Download as PDF, PPTX

![@ M A R G R I E T G R
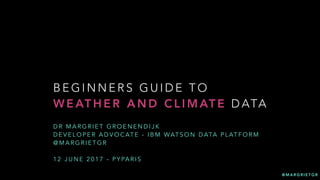
print json.dumps(weather, indent=4, sort_keys=True)
{
"forecasts": [
{
"class": "fod_long_range_intraday",
"clds": 42,
"dow": "Tuesday",
...
"temp": 13,
"wdir": 261,
},
],
"metadata": {
"expire_time_gmt": 1491904587,
"latitude": 51.45,
"longitude": -2.58,
...
}
}](https://image.slidesharecdn.com/170612weatherpyparisonline-170612082730/85/PyParis-weather-and-climate-data-9-320.jpg)
![@ M A R G R I E T G R
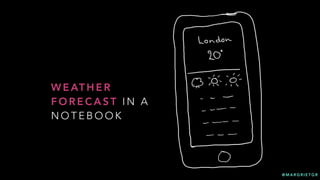
import pandas as pd
from datetime import datetime
df =
pd.DataFrame.from_dict(weather['forecasts'][0],orient='index').transpose()
for forecast in weather['forecasts'][1:]:
df =
pd.concat([df,pd.DataFrame.from_dict(forecast,orient='index').transpose()])
df['date'] = df['fcst_valid_local'].apply(lambda x: datetime.strptime(x,
'%Y-%m-%dT%H:%M:%S+0200'))](https://image.slidesharecdn.com/170612weatherpyparisonline-170612082730/85/PyParis-weather-and-climate-data-10-320.jpg)
![@ M A R G R I E T G R
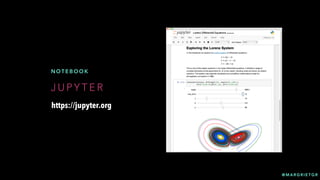
L A M B D A A N D PA N D A S D ATA F R A M E S
A N O N Y M O U S F U N C T I O N
df['date'] = df['fcst_valid_local'].apply(lambda x: datetime.strptime(x,
'%Y-%m-%dT%H:%M:%S+0200'))](https://image.slidesharecdn.com/170612weatherpyparisonline-170612082730/85/PyParis-weather-and-climate-data-11-320.jpg)
![@ M A R G R I E T G R
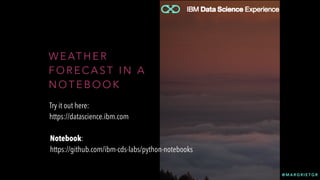
S O M E M O R E C L E A N I N G U P
df = df.drop([‘expire_time_gmt’],1)
df['temp']=df['temp'].apply(pd.to_numeric)
df.head()](https://image.slidesharecdn.com/170612weatherpyparisonline-170612082730/85/PyParis-weather-and-climate-data-12-320.jpg)
![@ M A R G R I E T G R
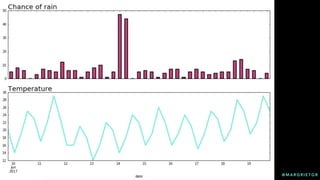
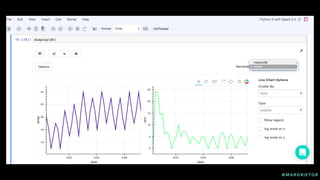
P L O T W I T H M AT P L O T L I B
import matplotlib.pyplot as plt
import matplotlib
%matplotlib inline
fig, axes = plt.subplots(nrows=2, ncols=1, figsize=(14, 8))
df['rain'].plot(ax=axes[0], kind='bar', color='#C93D79',sharex=True)
axes[0].set_title('Chance of rain',loc='left',fontsize=20)
df['temp'].plot(ax=axes[1], color='#6EEDD8',lw=4.0,sharex=True)
axes[1].set_title('Temperature',loc='left',fontsize=20)](https://image.slidesharecdn.com/170612weatherpyparisonline-170612082730/85/PyParis-weather-and-climate-data-13-320.jpg)
![@ M A R G R I E T G R
cities = [
('Bristol',51.44999778,-2.583315472),
...
('Portsmouth',50.80034751,-1.080022218)]
icons=[]
temps=[]
for city in cities:
lat = city[1]
lon = city[2]
line='https://'+username+':'+password+'@twcservice.mybluemix.net/api/
weather/v1/geocode/'+str(lat)+'/'+str(lon)+'/observations.json?&units=m'
r=requests.get(line)
weather = json.loads(r.text)
icons=np.append(icons,weather['observation']['wx_icon'])
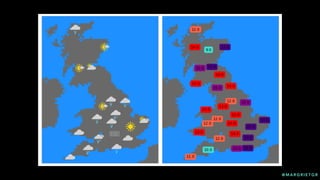
temps=np.append(temps,weather['observation']['temp'])](https://image.slidesharecdn.com/170612weatherpyparisonline-170612082730/85/PyParis-weather-and-climate-data-15-320.jpg)
![@ M A R G R I E T G R
from mpl_toolkits.basemap import Basemap
from matplotlib.offsetbox import AnnotationBbox, OffsetImage
from matplotlib._png import read_png
from itertools import izip
import urllib
matplotlib.style.use('bmh')
fig, axes = plt.subplots(nrows=1, ncols=2, figsize=(10, 12))
# background maps
m1 = Basemap(projection='mill',resolution=None,llcrnrlon=-7.5,llcrnrlat=49.84,urcrnrlon=2.5,urcrnrlat=59,ax=axes[0])
m1.drawlsmask(land_color='dimgrey',ocean_color='dodgerBlue',lakes=True)
m2 = Basemap(projection='mill',resolution=None,llcrnrlon=-7.5,llcrnrlat=49.84,urcrnrlon=2.5,urcrnrlat=59,ax=axes[1])
m2.drawlsmask(land_color='dimgrey',ocean_color='dodgerBlue',lakes=True)
# weather icons map
for [icon,city] in izip(icons,cities):
lat = city[1]
lon = city[2]
try:
pngfile=urllib.urlopen('https://github.com/ibm-cds-labs/python-notebooks/blob/master/weathericons/icon'+str(int(icon))+'.png?raw=true')
icon_hand = read_png(pngfile)
imagebox = OffsetImage(icon_hand, zoom=.15)
ab = AnnotationBbox(imagebox,m1(lon,lat),frameon=False)
axes[0].add_artist(ab)
except:
pass
# temperature map
for [temp,city] in izip(temps,cities):
lat = city[1]
lon = city[2]
if temp>16:
col='indigo'
elif temp>14:
col='darkmagenta'
elif temp>12:
col='red'
elif temp>10:
col='tomato'
elif temp>0:
col='turquoise'
x1, y1 = m2(lon,lat)
bbox_props = dict(boxstyle="round,pad=0.3", fc=col, ec=col, lw=2)
axes[1].text(x1, y1, temp, ha="center", va="center",
size=11,bbox=bbox_props)](https://image.slidesharecdn.com/170612weatherpyparisonline-170612082730/85/PyParis-weather-and-climate-data-16-320.jpg)

![@ M A R G R I E T G R
P I X I E D U S T
A N D M A P B O X
dfmap = pd.DataFrame(
cities,
columns=['city','lat','lon'])
dfmap['temp']=temps
dfmap[‘icon']=icons
display(dfmap)](https://image.slidesharecdn.com/170612weatherpyparisonline-170612082730/85/PyParis-weather-and-climate-data-20-320.jpg)
![@ M A R G R I E T G R
P I X I E D U S T
A N D M A P B O X
dfmap = pd.DataFrame(
cities,
columns=['city','lat','lon'])
dfmap['temp']=temps
dfmap[‘icon']=icons
display(dfmap)](https://image.slidesharecdn.com/170612weatherpyparisonline-170612082730/85/PyParis-weather-and-climate-data-21-320.jpg)
![@ M A R G R I E T G R
P I X I E D U S T
A N D M A P B O X
dfmap = pd.DataFrame(
cities,
columns=['city','lat','lon'])
dfmap['temp']=temps
dfmap[‘icon']=icons
display(dfmap)](https://image.slidesharecdn.com/170612weatherpyparisonline-170612082730/85/PyParis-weather-and-climate-data-22-320.jpg)


![@ M A R G R I E T G R
from scipy.interpolate import griddata
# grid of latitude and longitude values
x = np.linspace(49.0,59.0,100)
y = np.linspace(-6,2,100)
X, Y = np.meshgrid(x,y)
px = points['lat'].as_matrix()
py = points['lon'].as_matrix()
pz = points['temp'].as_matrix()](https://image.slidesharecdn.com/170612weatherpyparisonline-170612082730/85/PyParis-weather-and-climate-data-30-320.jpg)
![@ M A R G R I E T G R
from scipy.interpolate import griddata
# grid of latitude and longitude values
x = np.linspace(49.0,59.0,100)
y = np.linspace(-6,2,100)
X, Y = np.meshgrid(x,y)
px = points['lat'].as_matrix()
py = points['lon'].as_matrix()
pz = points['temp'].as_matrix()
fig, ax = plt.subplots(nrows=1, ncols=3, figsize=(18, 8))
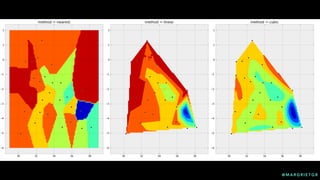
for i, method in enumerate(('nearest', 'linear', 'cubic')):
Ti = griddata((px, py), pz, (X, Y), method=method)
ax[i].contourf(X, Y, Ti)
ax[i].set_title('method = {}'.format(method))
ax[i].scatter(px, py, c='k', marker='o')](https://image.slidesharecdn.com/170612weatherpyparisonline-170612082730/85/PyParis-weather-and-climate-data-31-320.jpg)


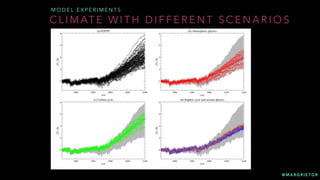
![@ M A R G R I E T G R
import scipy
import matplotlib
from pylab import *
from mpl_toolkits.basemap import Basemap, addcyclic, shiftgrid, maskoceans
# define the area to plot and projection to use
m =
Basemap(llcrnrlon=-180,llcrnrlat=-60,urcrnrlon=180,urcrnrlat=80,projection=
'mill')
# covert the latitude, longitude and temperatures to raster coordinates to
be plotted
t1=temperature[0,:,:]
t1,lon=addcyclic(t1,lons)
january,longitude=shiftgrid(180.,t1,lon,start=False)
x,y=np.meshgrid(longitude,lats)
px,py=m(x,y)](https://image.slidesharecdn.com/170612weatherpyparisonline-170612082730/85/PyParis-weather-and-climate-data-37-320.jpg)
![@ M A R G R I E T G R
rcParams['font.size']=12
rcParams['figure.figsize']=[8.0, 6.0]
figure()
palette=cm.RdYlBu_r
rmin=-30.; rmax=30.
ncont=20
dc=(rmax-rmin)/ncont
vc=arange(rmin,rmax+dc,dc)
pal_norm=matplotlib.colors.Normalize(vmin = rmin, vmax = rmax, clip =
False)
m.drawcoastlines(linewidth=0.5)
m.drawmapboundary(fill_color=(1.0,1.0,1.0))
cf=m.pcolormesh(px, py, january, cmap = palette)
cbar=colorbar(cf,orientation='horizontal', shrink=0.95)
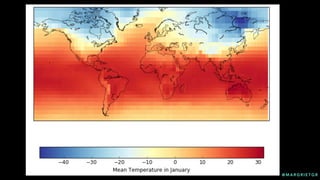
cbar.set_label('Mean Temperature in January')
tight_layout()](https://image.slidesharecdn.com/170612weatherpyparisonline-170612082730/85/PyParis-weather-and-climate-data-38-320.jpg)


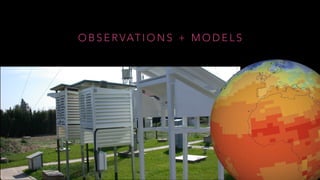
![@ M A R G R I E T G R
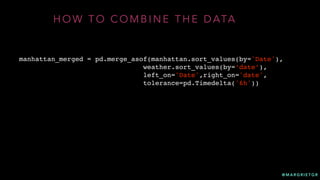
H O W T O C O M B I N E T H E D ATA
def perdelta(start, end, delta):
curr = start
while curr < end:
yield curr
curr += delta
for result in perdelta(datetime(2017,4,1,0), datetime(2017,4,15,23),
timedelta(hours=1)):
colhour = manhattan.loc[manhattan['Date'] == result]
hour = pd.DataFrame([[result,borough,len(colhour.index),
colhour['Persons Injured'].sum(),
colhour['Persons Killed'].sum(),
if result == datetime(2017,4,1,0):
newhour = hour.copy()
else:
newhour = newhour.append(hour)](https://image.slidesharecdn.com/170612weatherpyparisonline-170612082730/85/PyParis-weather-and-climate-data-54-320.jpg)

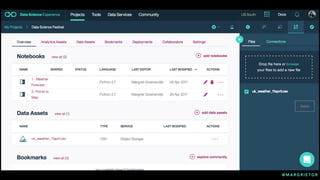
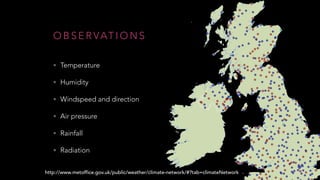
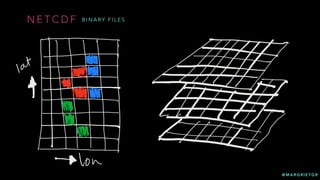
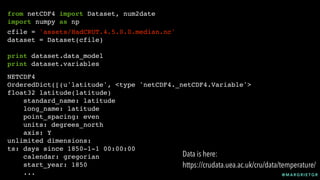
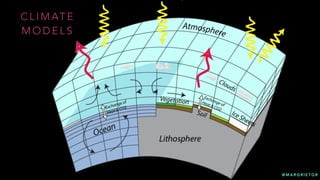
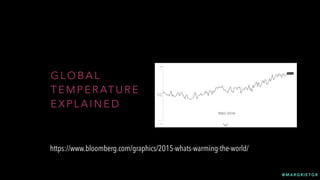
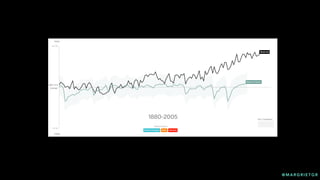
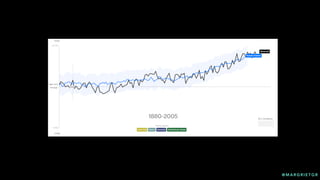
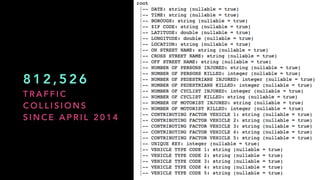
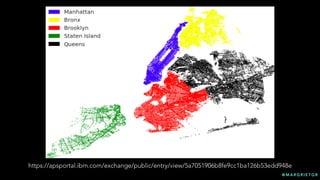
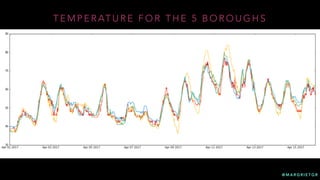
This document provides an overview of weather and climate data for beginners. It discusses accessing weather forecast data through The Weather Company API and visualizing the data in Jupyter notebooks. It also covers obtaining historical weather observations and climate model data from various sources. The document explores using weather data for applications in insurance, energy, retail, and analyzing the relationship between weather and traffic collisions.


![COMP41680 - Sample API Assignment¶In [5] .docx](https://cdn.slidesharecdn.com/ss_thumbnails/comp41680-sampleapiassignmentin5-221225060912-c064a6ea-thumbnail.jpg?width=640&height=640&fit=bounds)


![Scott Anderson [InfluxData] | Map & Reduce – The Powerhouses of Custom Flux F...](https://cdn.slidesharecdn.com/ss_thumbnails/influxdays2020-mapreducecroft-200723010914-thumbnail.jpg?width=640&height=640&fit=bounds)


![[DSC Europe 25] Bojan Djuricic - Predictive Design Process.pdf](https://cdn.slidesharecdn.com/ss_thumbnails/5awdrbedqdek3gqu2ezy-4-the-predictive-design-bojan-djuricic-260120105856-6c399e9b-thumbnail.jpg?width=640&height=640&fit=bounds)


![[DSC Europe 25] Ivan Lukovic & Marija Djukic - From Data to Value: Why Maturi...](https://cdn.slidesharecdn.com/ss_thumbnails/ahrfps8xr6knowwhacxh-1-ivan-marija-dsc-2025-ld-v1-presentation-260115093812-be21adfc-thumbnail.jpg?width=640&height=640&fit=bounds)


