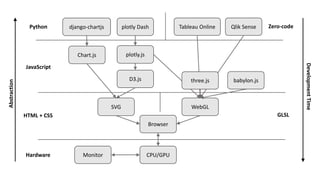
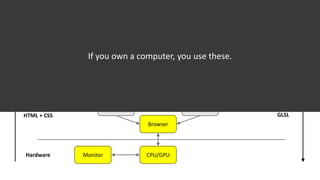
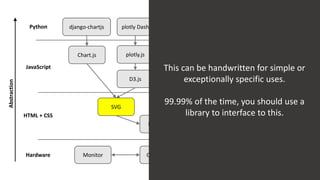
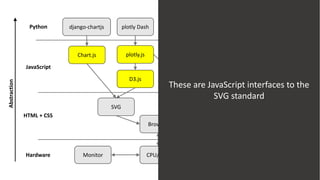
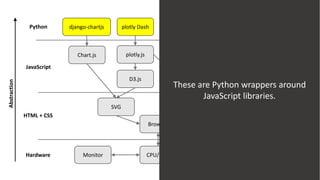
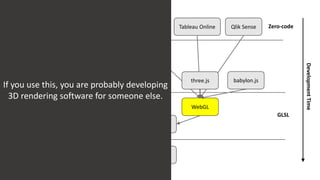
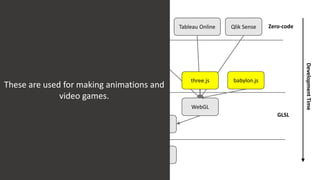
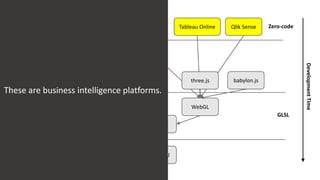
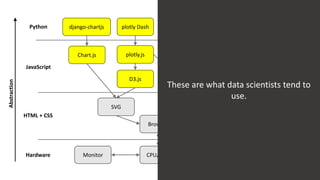
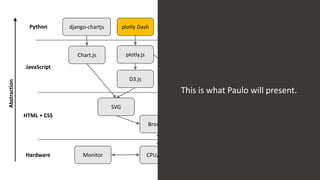
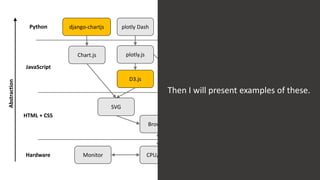
Data Visualization for the Web
Portfolio Tour & How to Get Started
Bethesda Data Science Meetup – Feb 2019 Presented by Conlan Scientific
Chris Conlan – President
chris@conlan.io
Background
• You’re a data scientist.
• It’s 2019.
Conclusion
• You should be sharing analytics on the web.
DevelopmentTime
Browser
SVG WebGL
Monitor CPU/GPUHardware
HTML + CSS
D3.js
JavaScript
plotly.js
plotly Dash
Chart.js
django-chartjsPython Zero-codeTableau Online Qlik Sense
three.js babylon.js
GLSL
Abstraction
DevelopmentTime
Browser
SVG WebGL
Monitor CPU/GPUHardware
HTML + CSS
D3.js
JavaScript
plotly.js
plotly Dash
Chart.js
django-chartjsPython Zero-codeTableau Online Qlik Sense
three.js babylon.js
GLSL
Abstraction
If you own a computer, you use these.
DevelopmentTime
Browser
SVG WebGL
Monitor CPU/GPUHardware
HTML + CSS
D3.js
JavaScript
plotly.js
plotly Dash
Chart.js
django-chartjsPython Zero-codeTableau Online Qlik Sense
three.js babylon.js
GLSL
Abstraction
This can be handwritten for simple or
exceptionally specific uses.
99.99% of the time, you should use a
library to interface to this.
DevelopmentTime
Browser
SVG WebGL
Monitor CPU/GPUHardware
HTML + CSS
D3.js
JavaScript
plotly.js
plotly Dash
Chart.js
django-chartjsPython Zero-codeTableau Online Qlik Sense
three.js babylon.js
GLSL
Abstraction
These are JavaScript interfaces to the
SVG standard
DevelopmentTime
Browser
SVG WebGL
Monitor CPU/GPUHardware
HTML + CSS
D3.js
JavaScript
plotly.js
plotly Dash
Chart.js
django-chartjsPython Zero-codeTableau Online Qlik Sense
three.js babylon.js
GLSL
Abstraction
These are Python wrappers around
JavaScript libraries.
DevelopmentTime
Browser
SVG WebGL
Monitor CPU/GPUHardware
HTML + CSS
D3.js
JavaScript
plotly.js
plotly Dash
Chart.js
django-chartjsPython Zero-codeTableau Online Qlik Sense
three.js babylon.js
GLSL
Abstraction
If you use this, you are probably developing
3D rendering software for someone else.
DevelopmentTime
Browser
SVG WebGL
Monitor CPU/GPUHardware
HTML + CSS
D3.js
JavaScript
plotly.js
plotly Dash
Chart.js
django-chartjsPython Zero-codeTableau Online Qlik Sense
three.js babylon.js
GLSL
Abstraction
These are used for making animations and
video games.
DevelopmentTime
Browser
SVG WebGL
Monitor CPU/GPUHardware
HTML + CSS
D3.js
JavaScript
plotly.js
plotly Dash
Chart.js
django-chartjsPython Zero-codeTableau Online Qlik Sense
three.js babylon.js
GLSL
Abstraction
These are business intelligence platforms.
DevelopmentTime
Browser
SVG WebGL
Monitor CPU/GPUHardware
HTML + CSS
D3.js
JavaScript
plotly.js
plotly Dash
Chart.js
django-chartjsPython Zero-codeTableau Online Qlik Sense
three.js babylon.js
GLSL
Abstraction
These are what data scientists tend to
use.
DevelopmentTime
Browser
SVG WebGL
Monitor CPU/GPUHardware
HTML + CSS
D3.js
JavaScript
plotly.js
plotly Dash
Chart.js
django-chartjsPython Zero-codeTableau Online Qlik Sense
three.js babylon.js
GLSL
Abstraction
This is what Paulo will present.
DevelopmentTime
Browser
SVG WebGL
Monitor CPU/GPUHardware
HTML + CSS
D3.js
JavaScript
plotly.js
plotly Dash
Chart.js
django-chartjsPython Zero-codeTableau Online Qlik Sense
three.js babylon.js
GLSL
Abstraction
Then I will present examples of these.

Data Visualization for the Web - How to Get Started