Download as PDF, PPTX

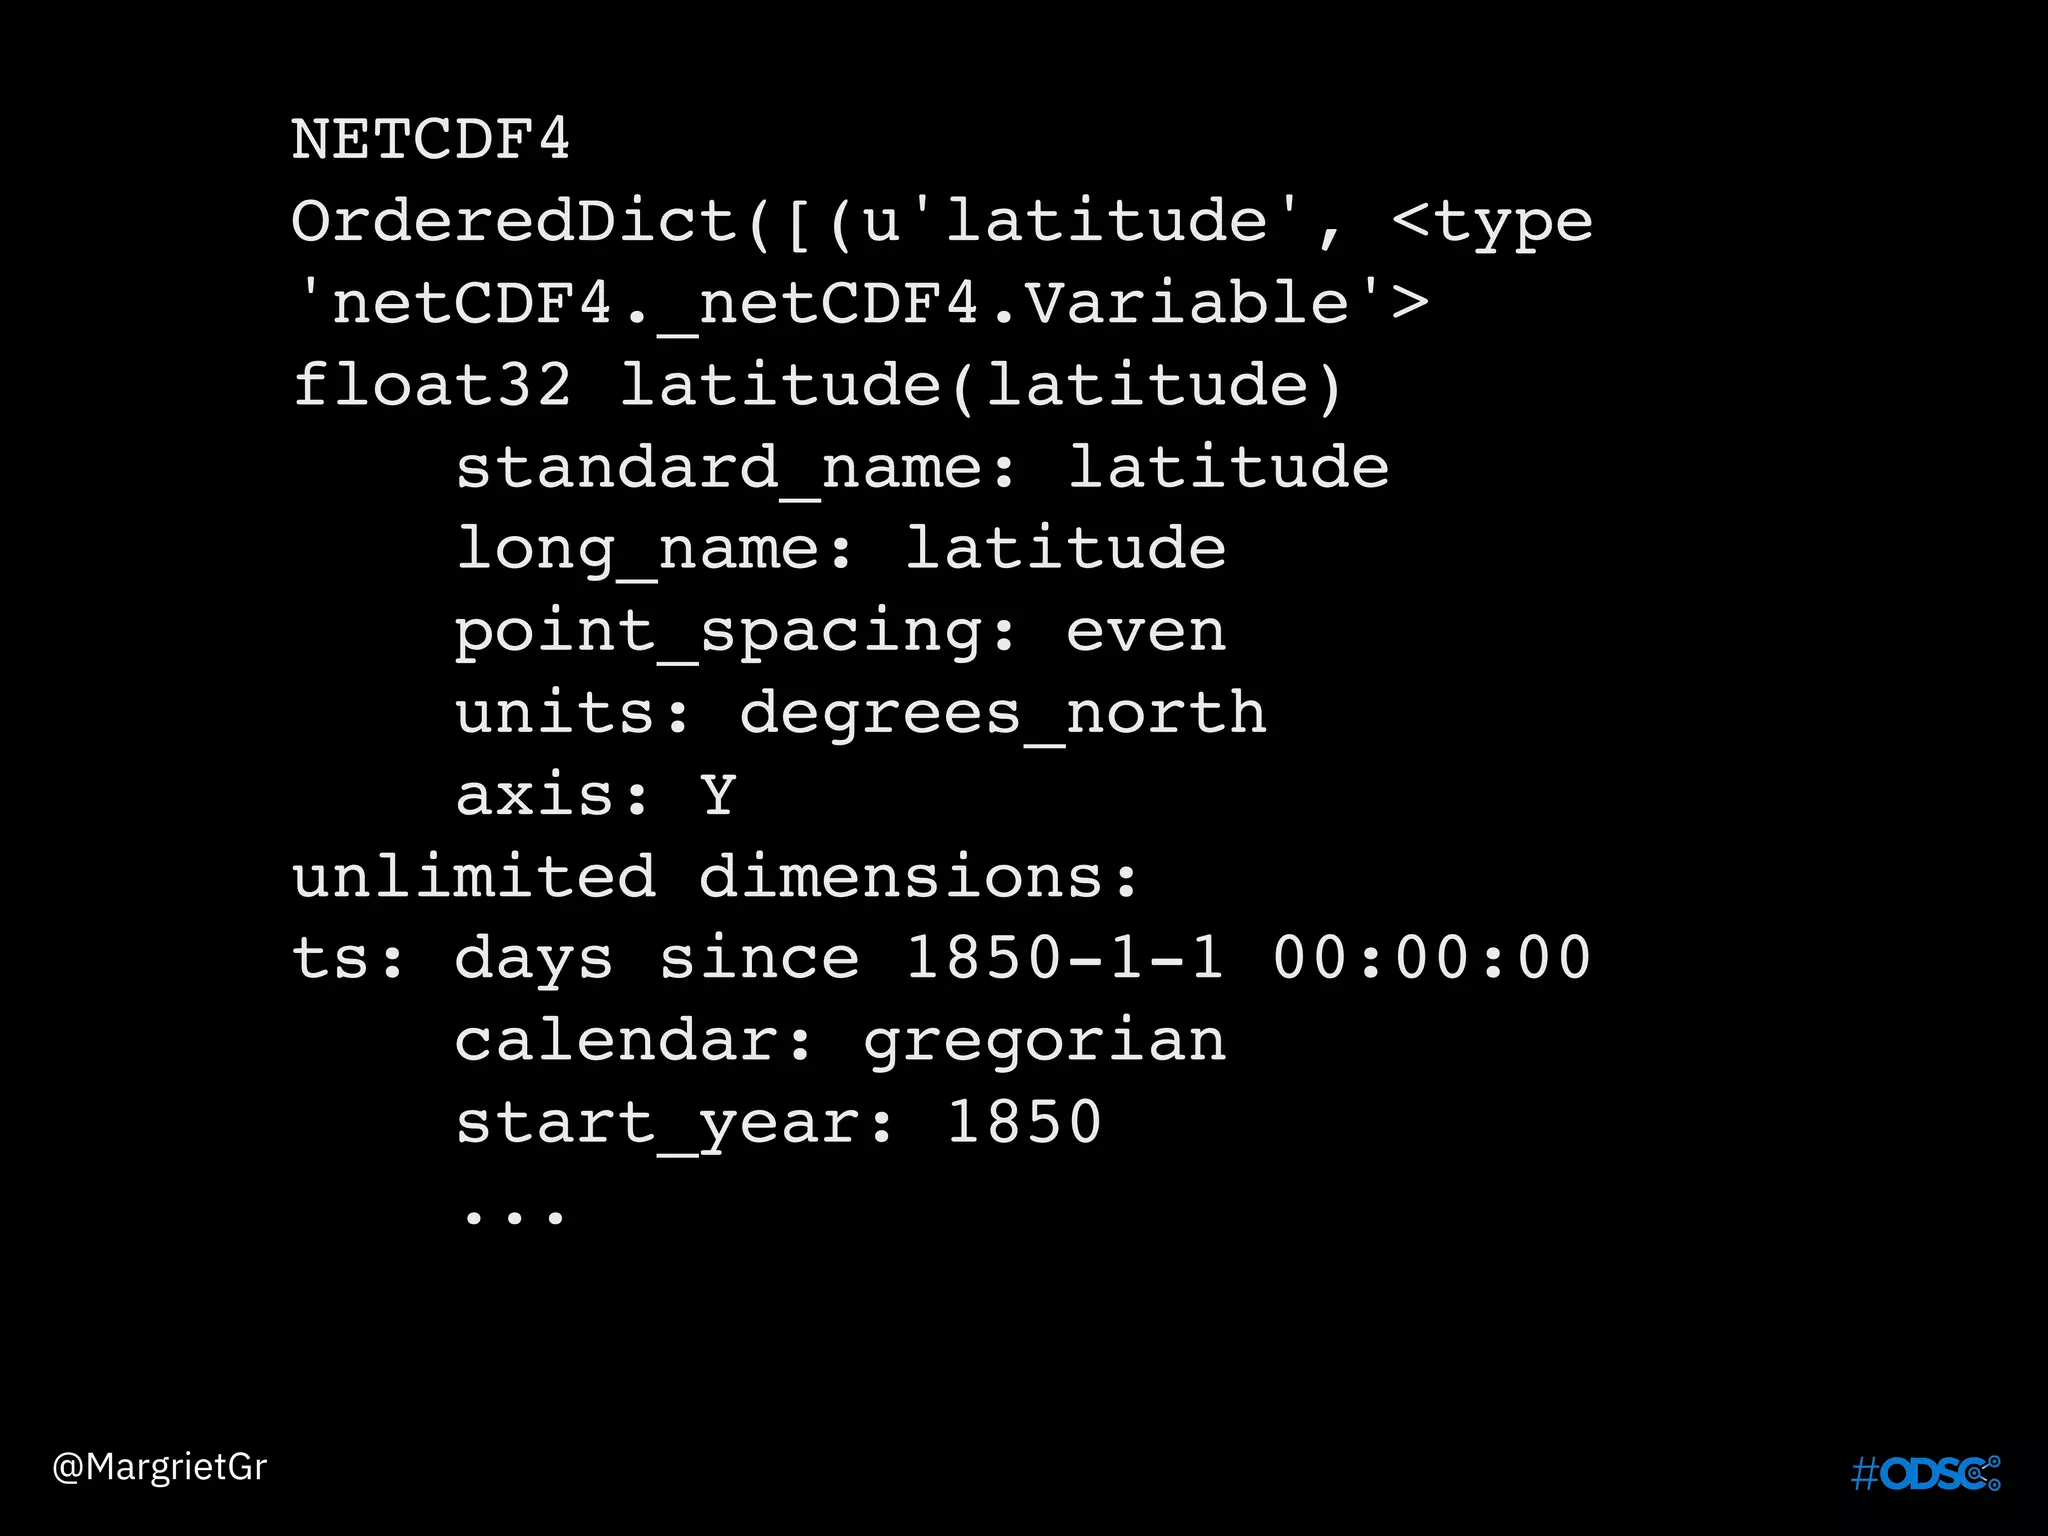
![import scipy
import matplotlib
from pylab import *
from mpl_toolkits.basemap import Basemap,
addcyclic, shiftgrid, maskoceans
# define the area to plot and projection to use
m =
Basemap(llcrnrlon=-180,llcrnrlat=-
60,urcrnrlon=180,urcrnrlat=80,projection='mill')
@MargrietGr
# covert the latitude, longitude and temperatures to
raster coordinates to be plotted
t1=temperature[0,:,:]
t1,lon=addcyclic(t1,lons)
january,longitude=shiftgrid(180.,t1,lon,start=False)
x,y=np.meshgrid(longitude,lats)
px,py=m(x,y)](https://image.slidesharecdn.com/odscweathermargriet-171013110443/75/ODSC-Europe-Weather-and-Climate-Data-Not-Just-for-Meteorologists-15-2048.jpg)
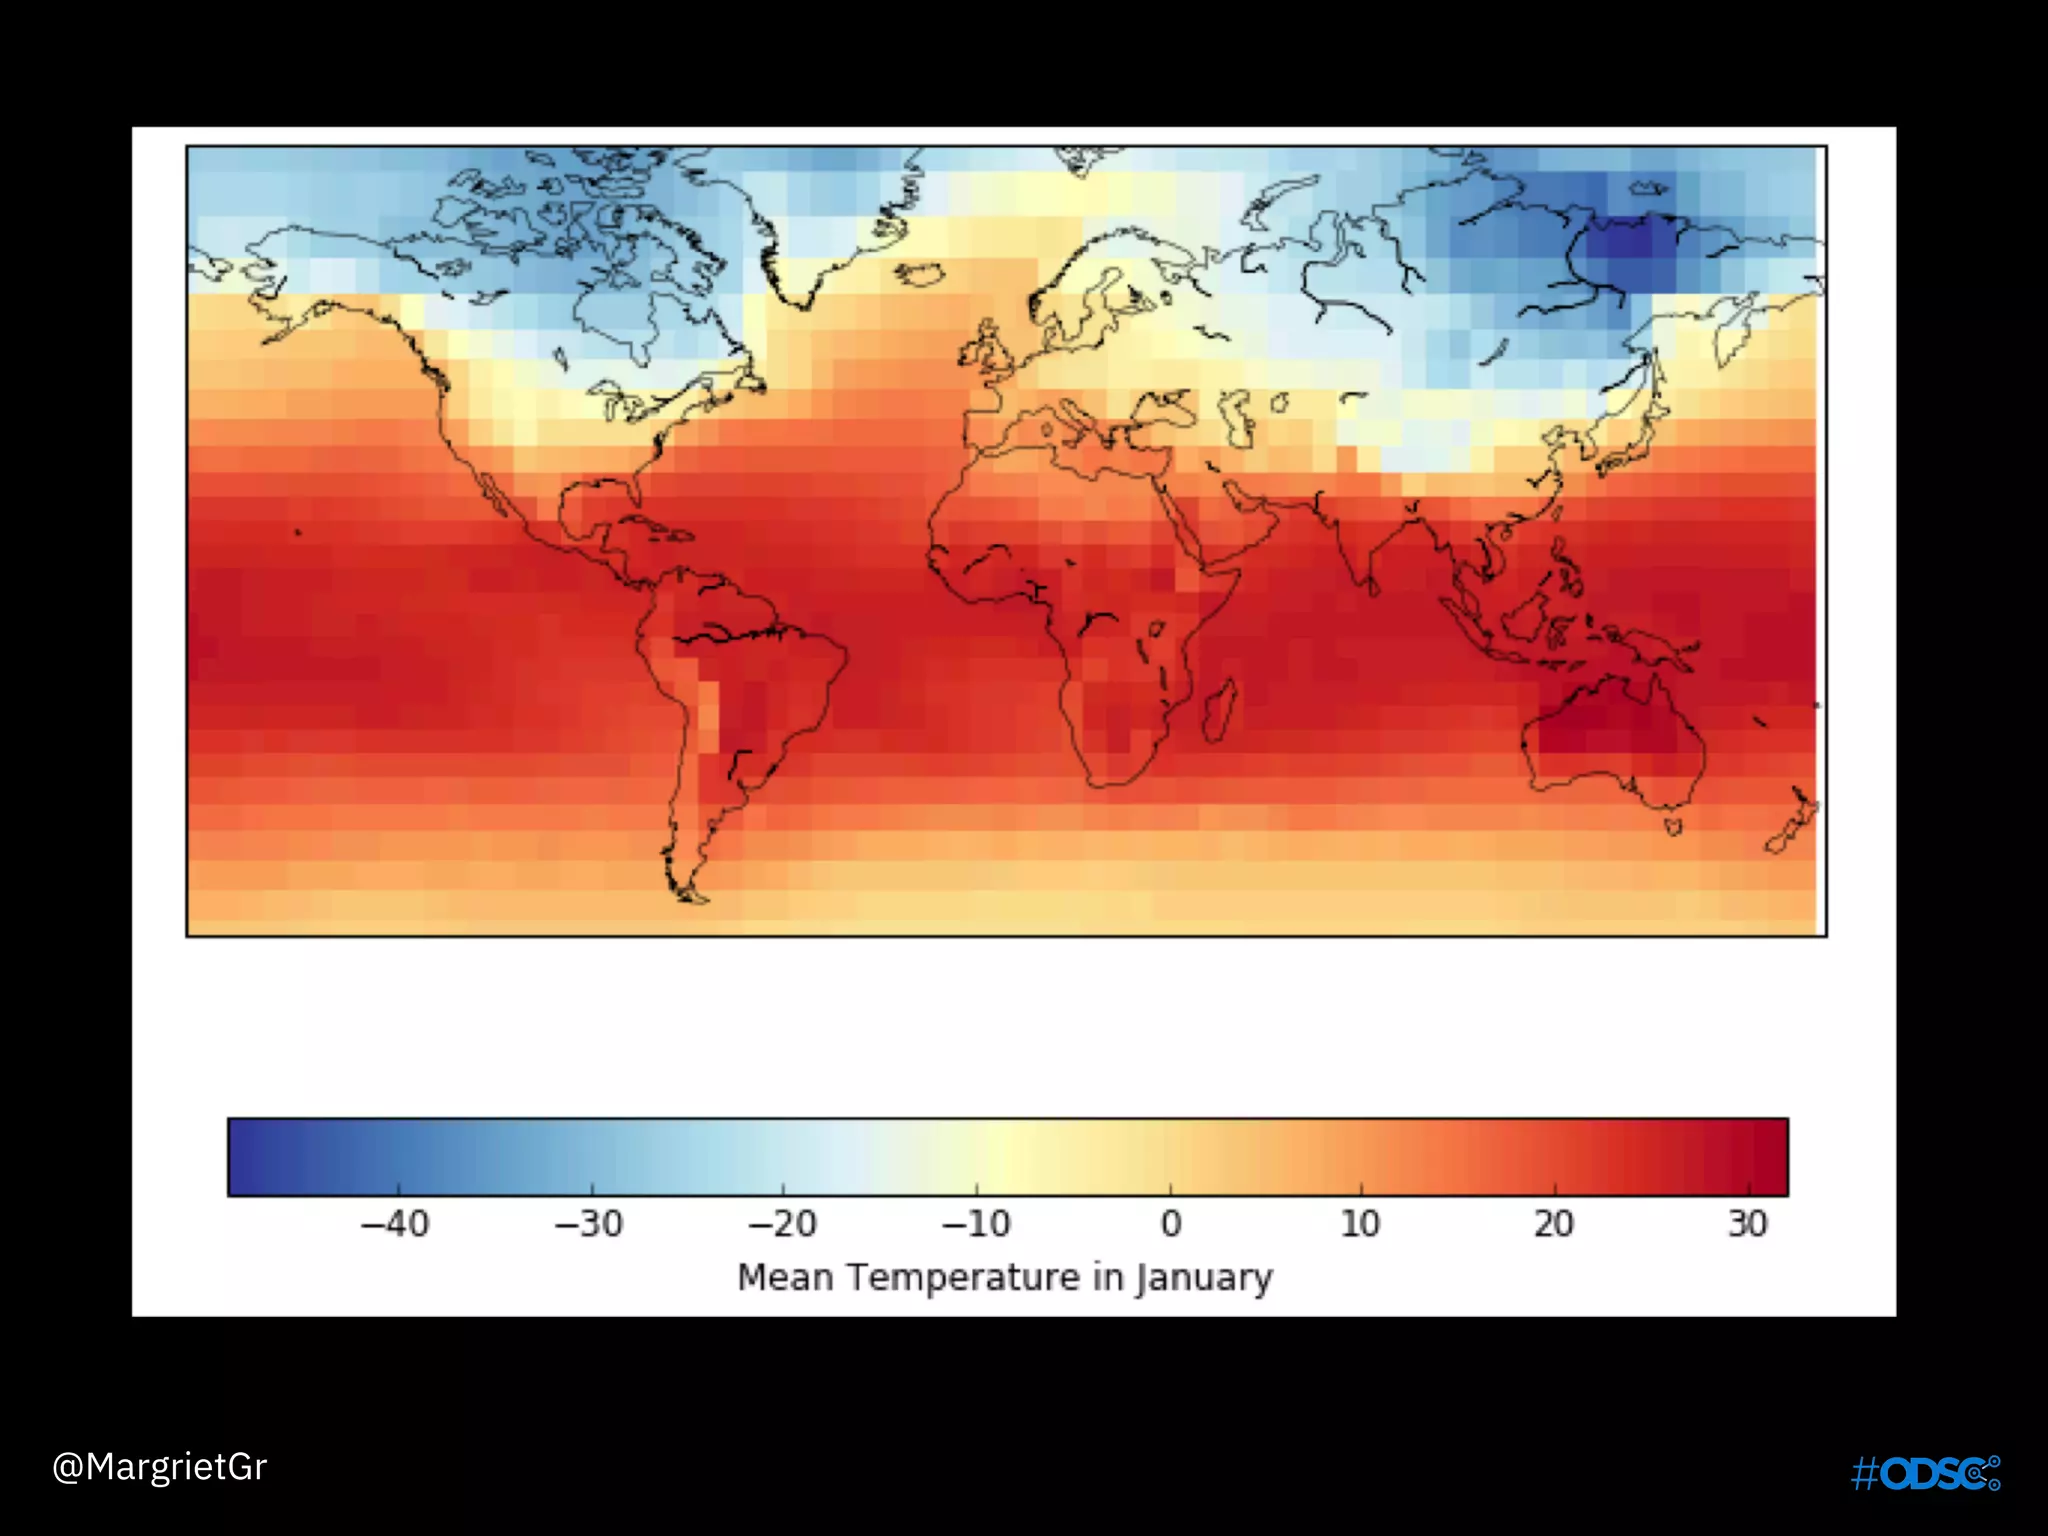
![rcParams['font.size']=12
rcParams['figure.figsize']=[8.0, 6.0]
figure()
palette=cm.RdYlBu_r
rmin=-30.; rmax=30.
ncont=20
dc=(rmax-rmin)/ncont
vc=arange(rmin,rmax+dc,dc)
pal_norm=matplotlib.colors.Normalize(vmin = rmin, vmax
= rmax, clip = False)
m.drawcoastlines(linewidth=0.5)
m.drawmapboundary(fill_color=(1.0,1.0,1.0))
cf=m.pcolormesh(px, py, january, cmap = palette)
cbar=colorbar(cf,orientation='horizontal',
shrink=0.95)
cbar.set_label('Mean Temperature in January')
tight_layout()](https://image.slidesharecdn.com/odscweathermargriet-171013110443/75/ODSC-Europe-Weather-and-Climate-Data-Not-Just-for-Meteorologists-16-2048.jpg)

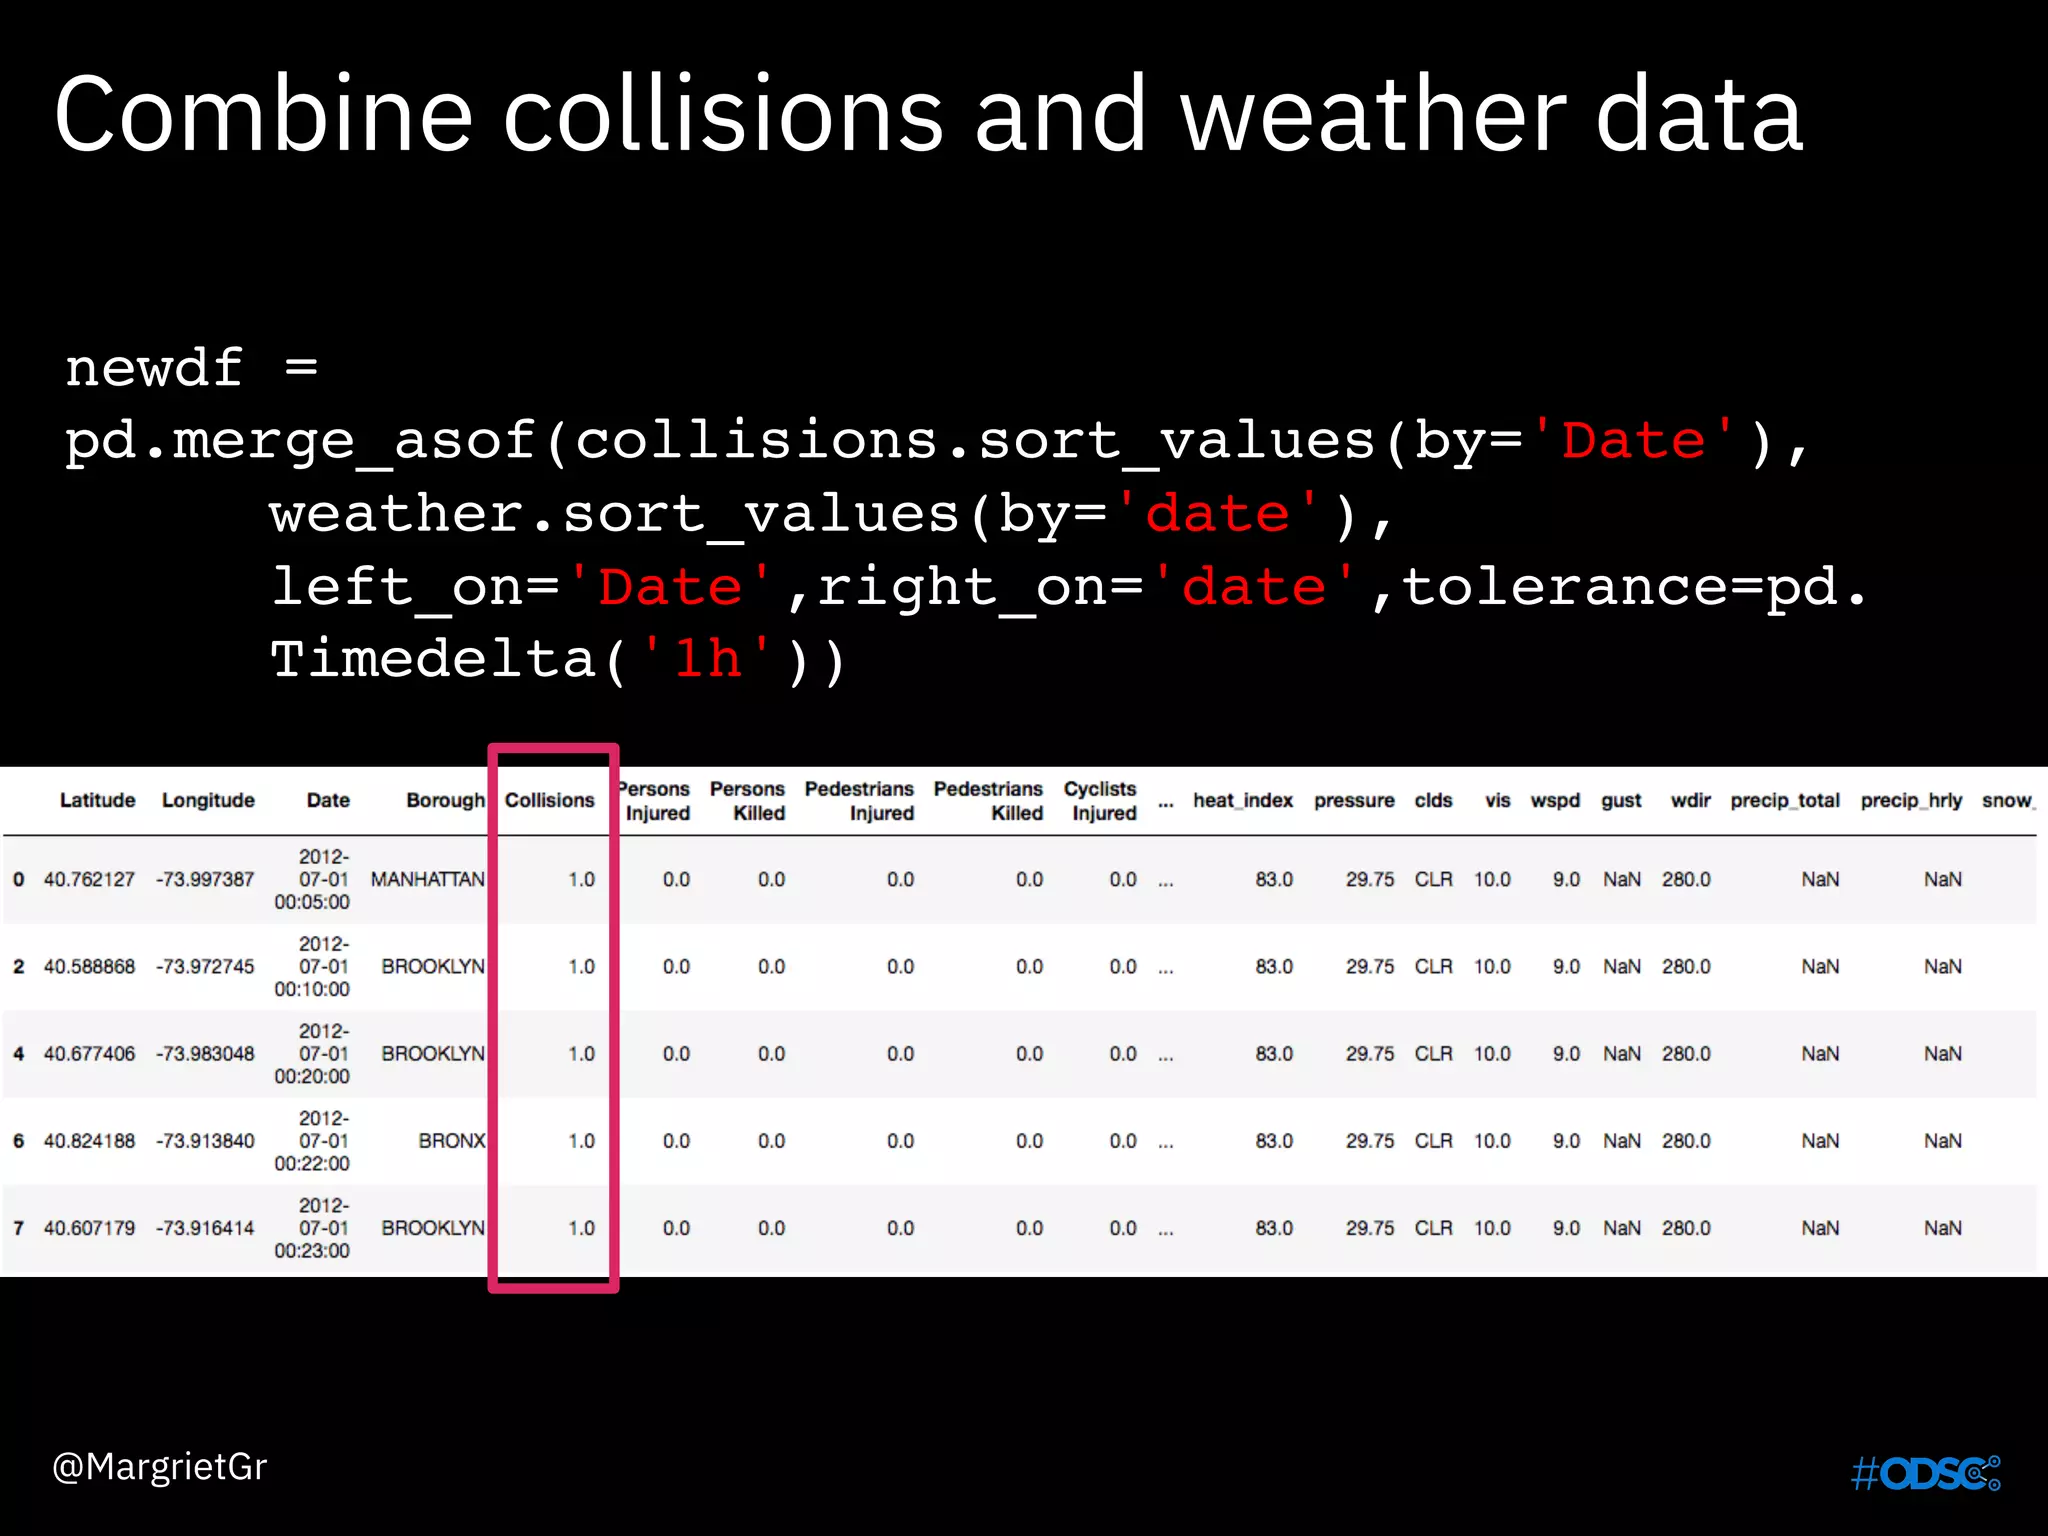
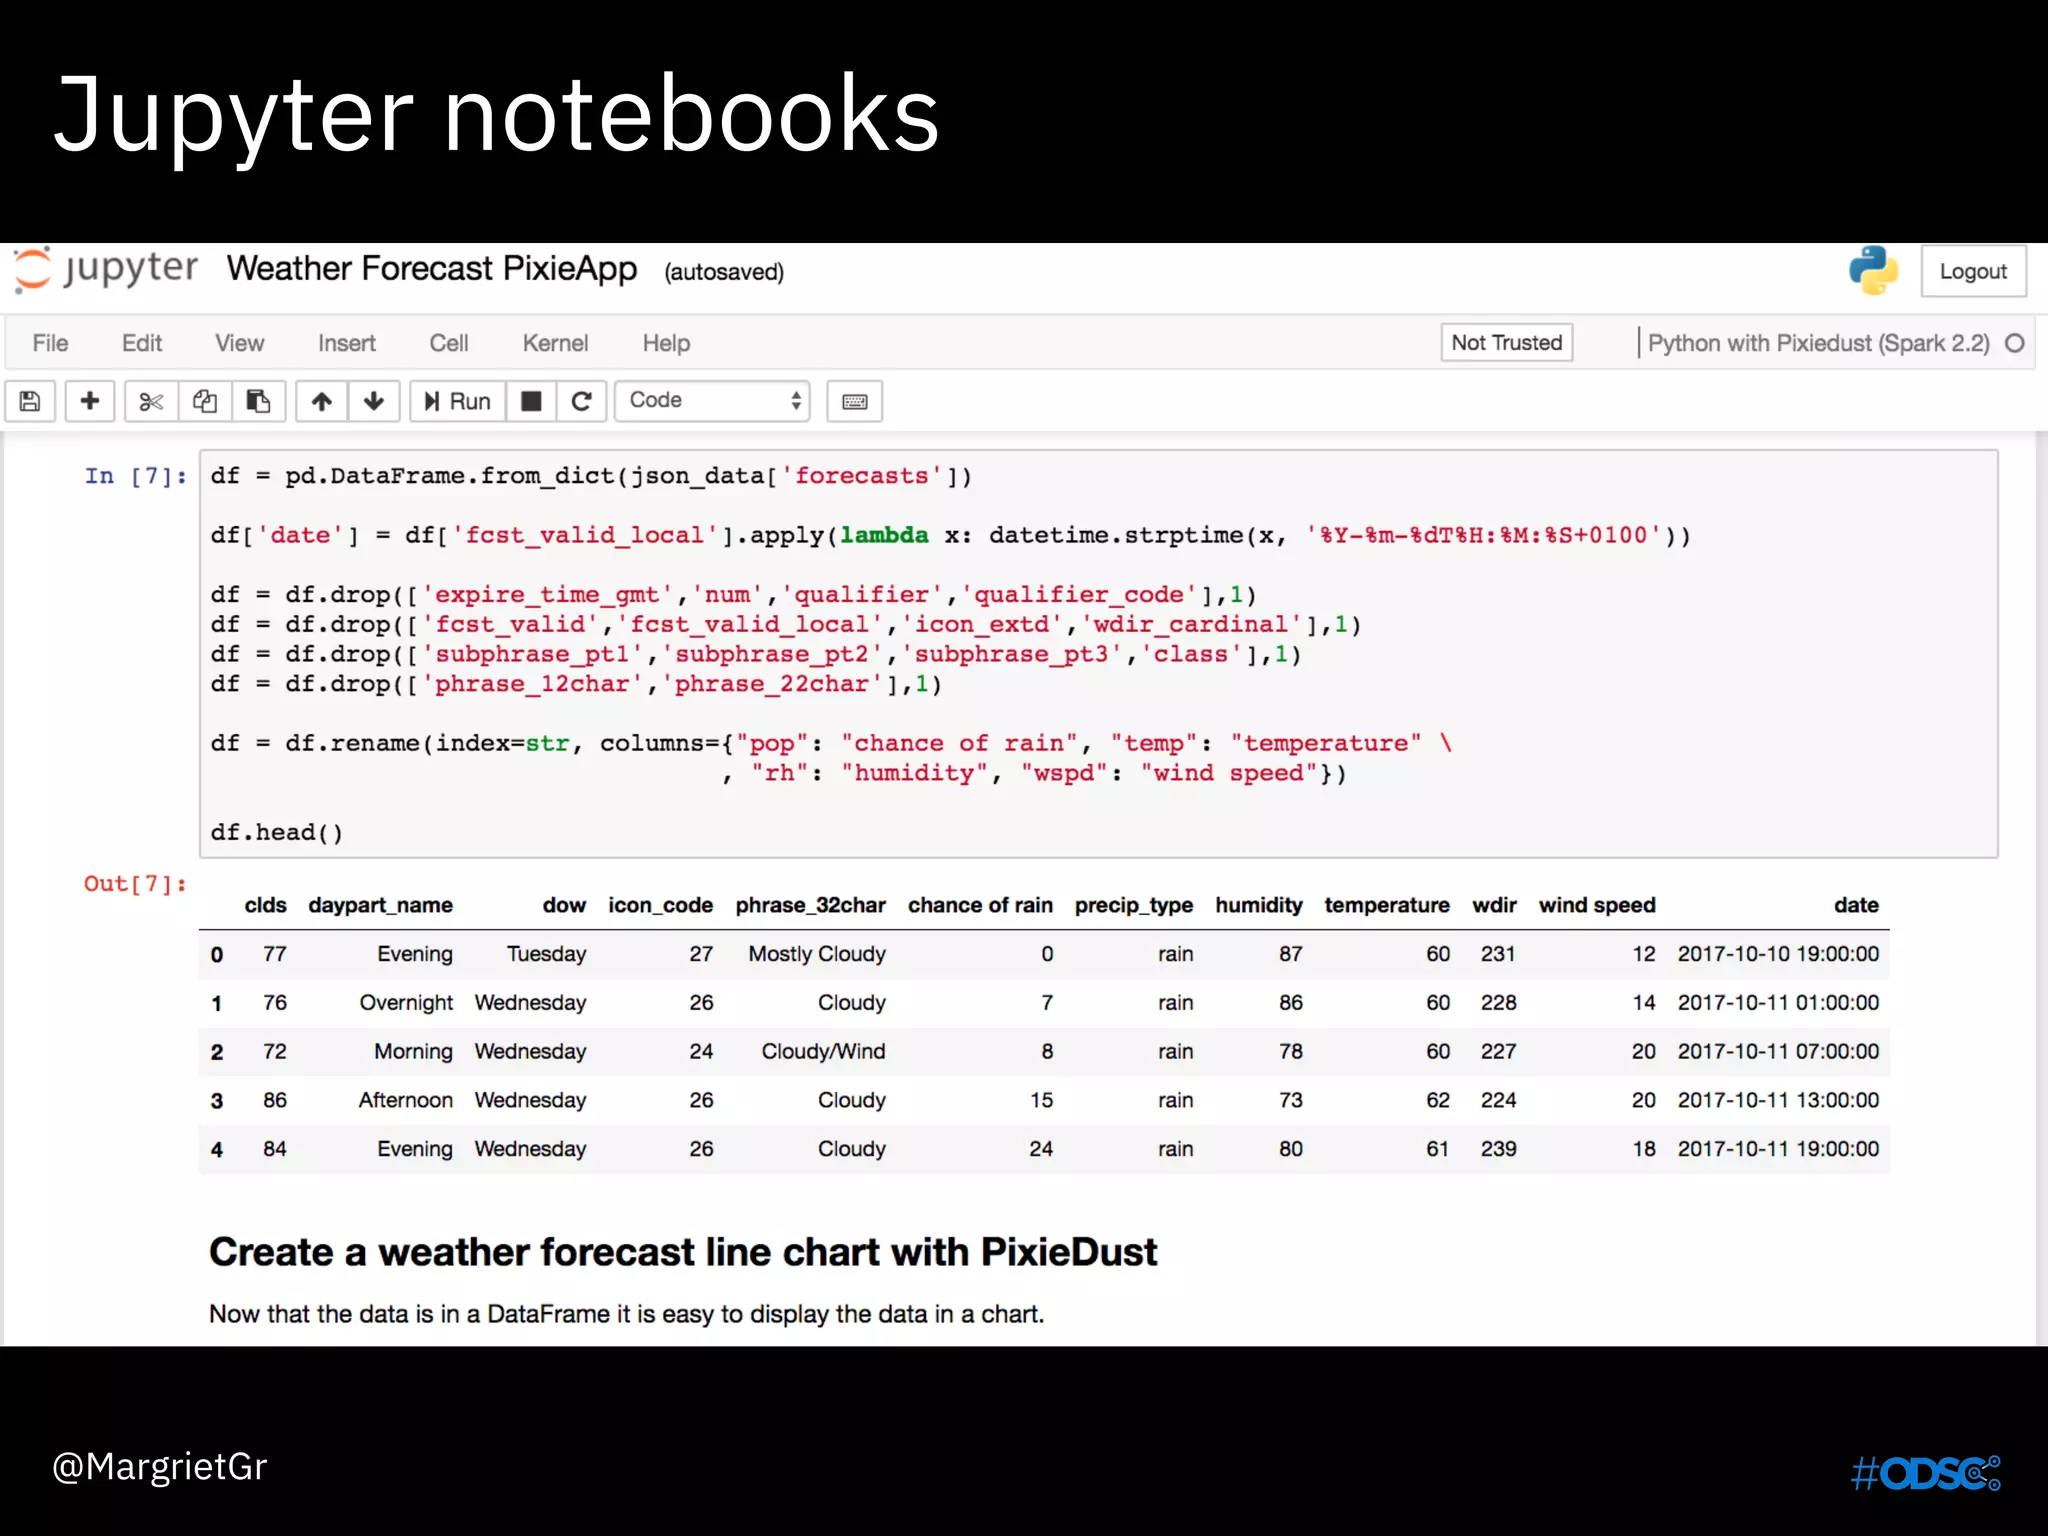
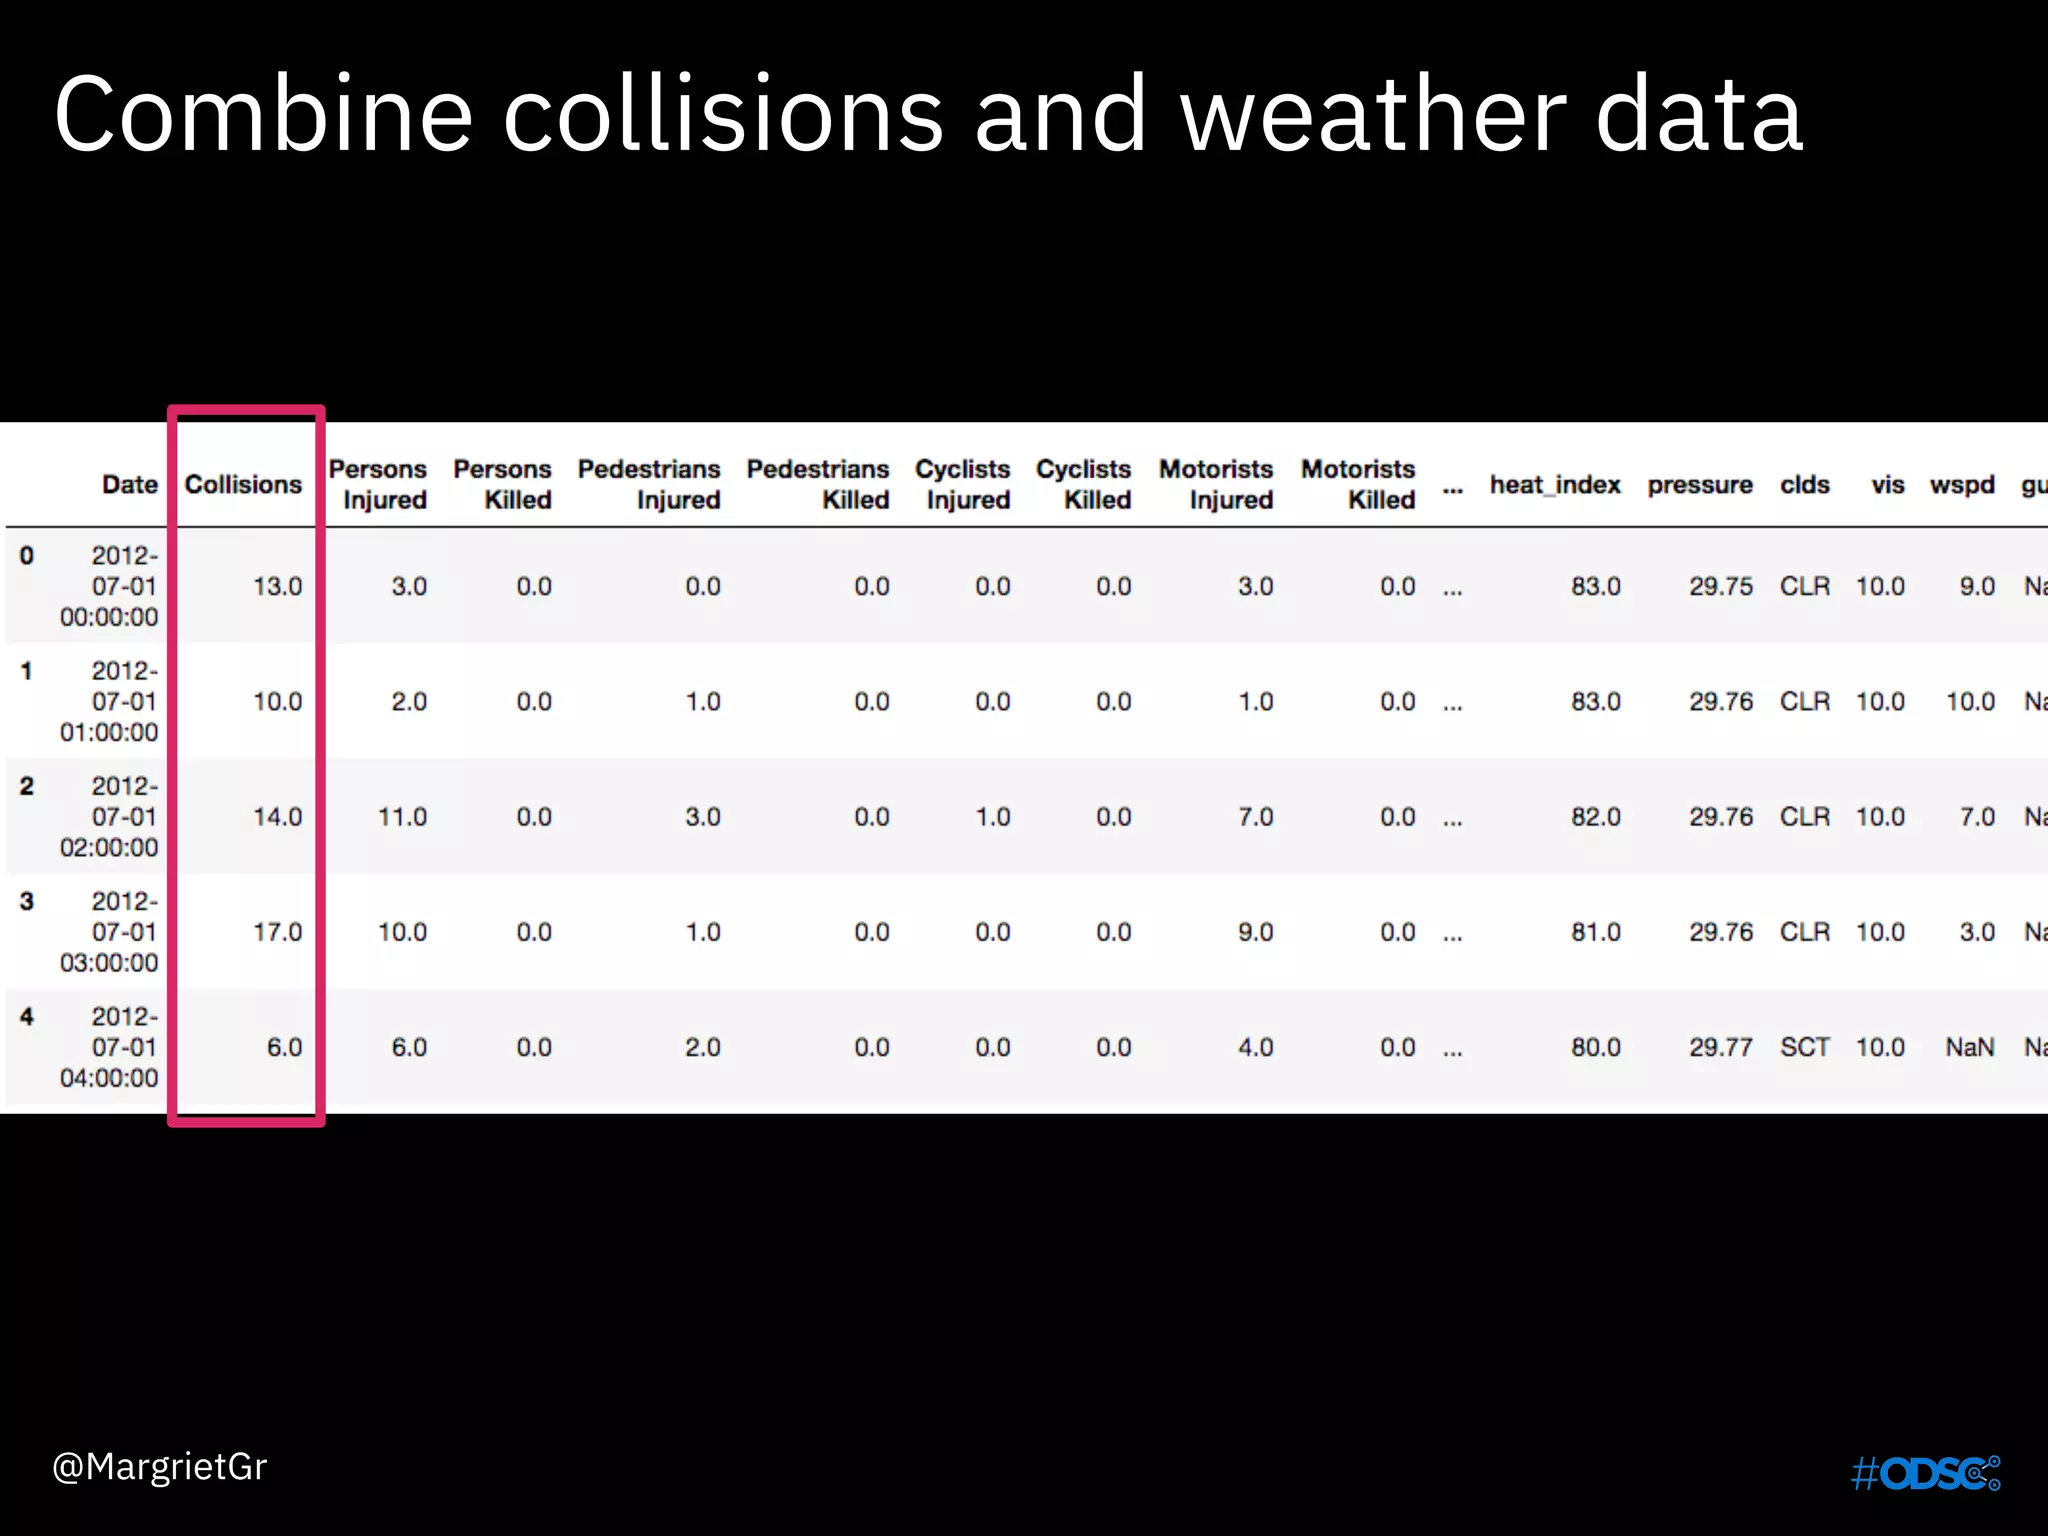
![Combine collisions and weather data
times = pd.DatetimeIndex(collisions.Date)
collisions1 =
collisions.groupby(
[times.year,times.month,times.day,times.hour]).
sum()
collisions1['Hour']=collisions1.index
@MargrietGr](https://image.slidesharecdn.com/odscweathermargriet-171013110443/75/ODSC-Europe-Weather-and-Climate-Data-Not-Just-for-Meteorologists-31-2048.jpg)
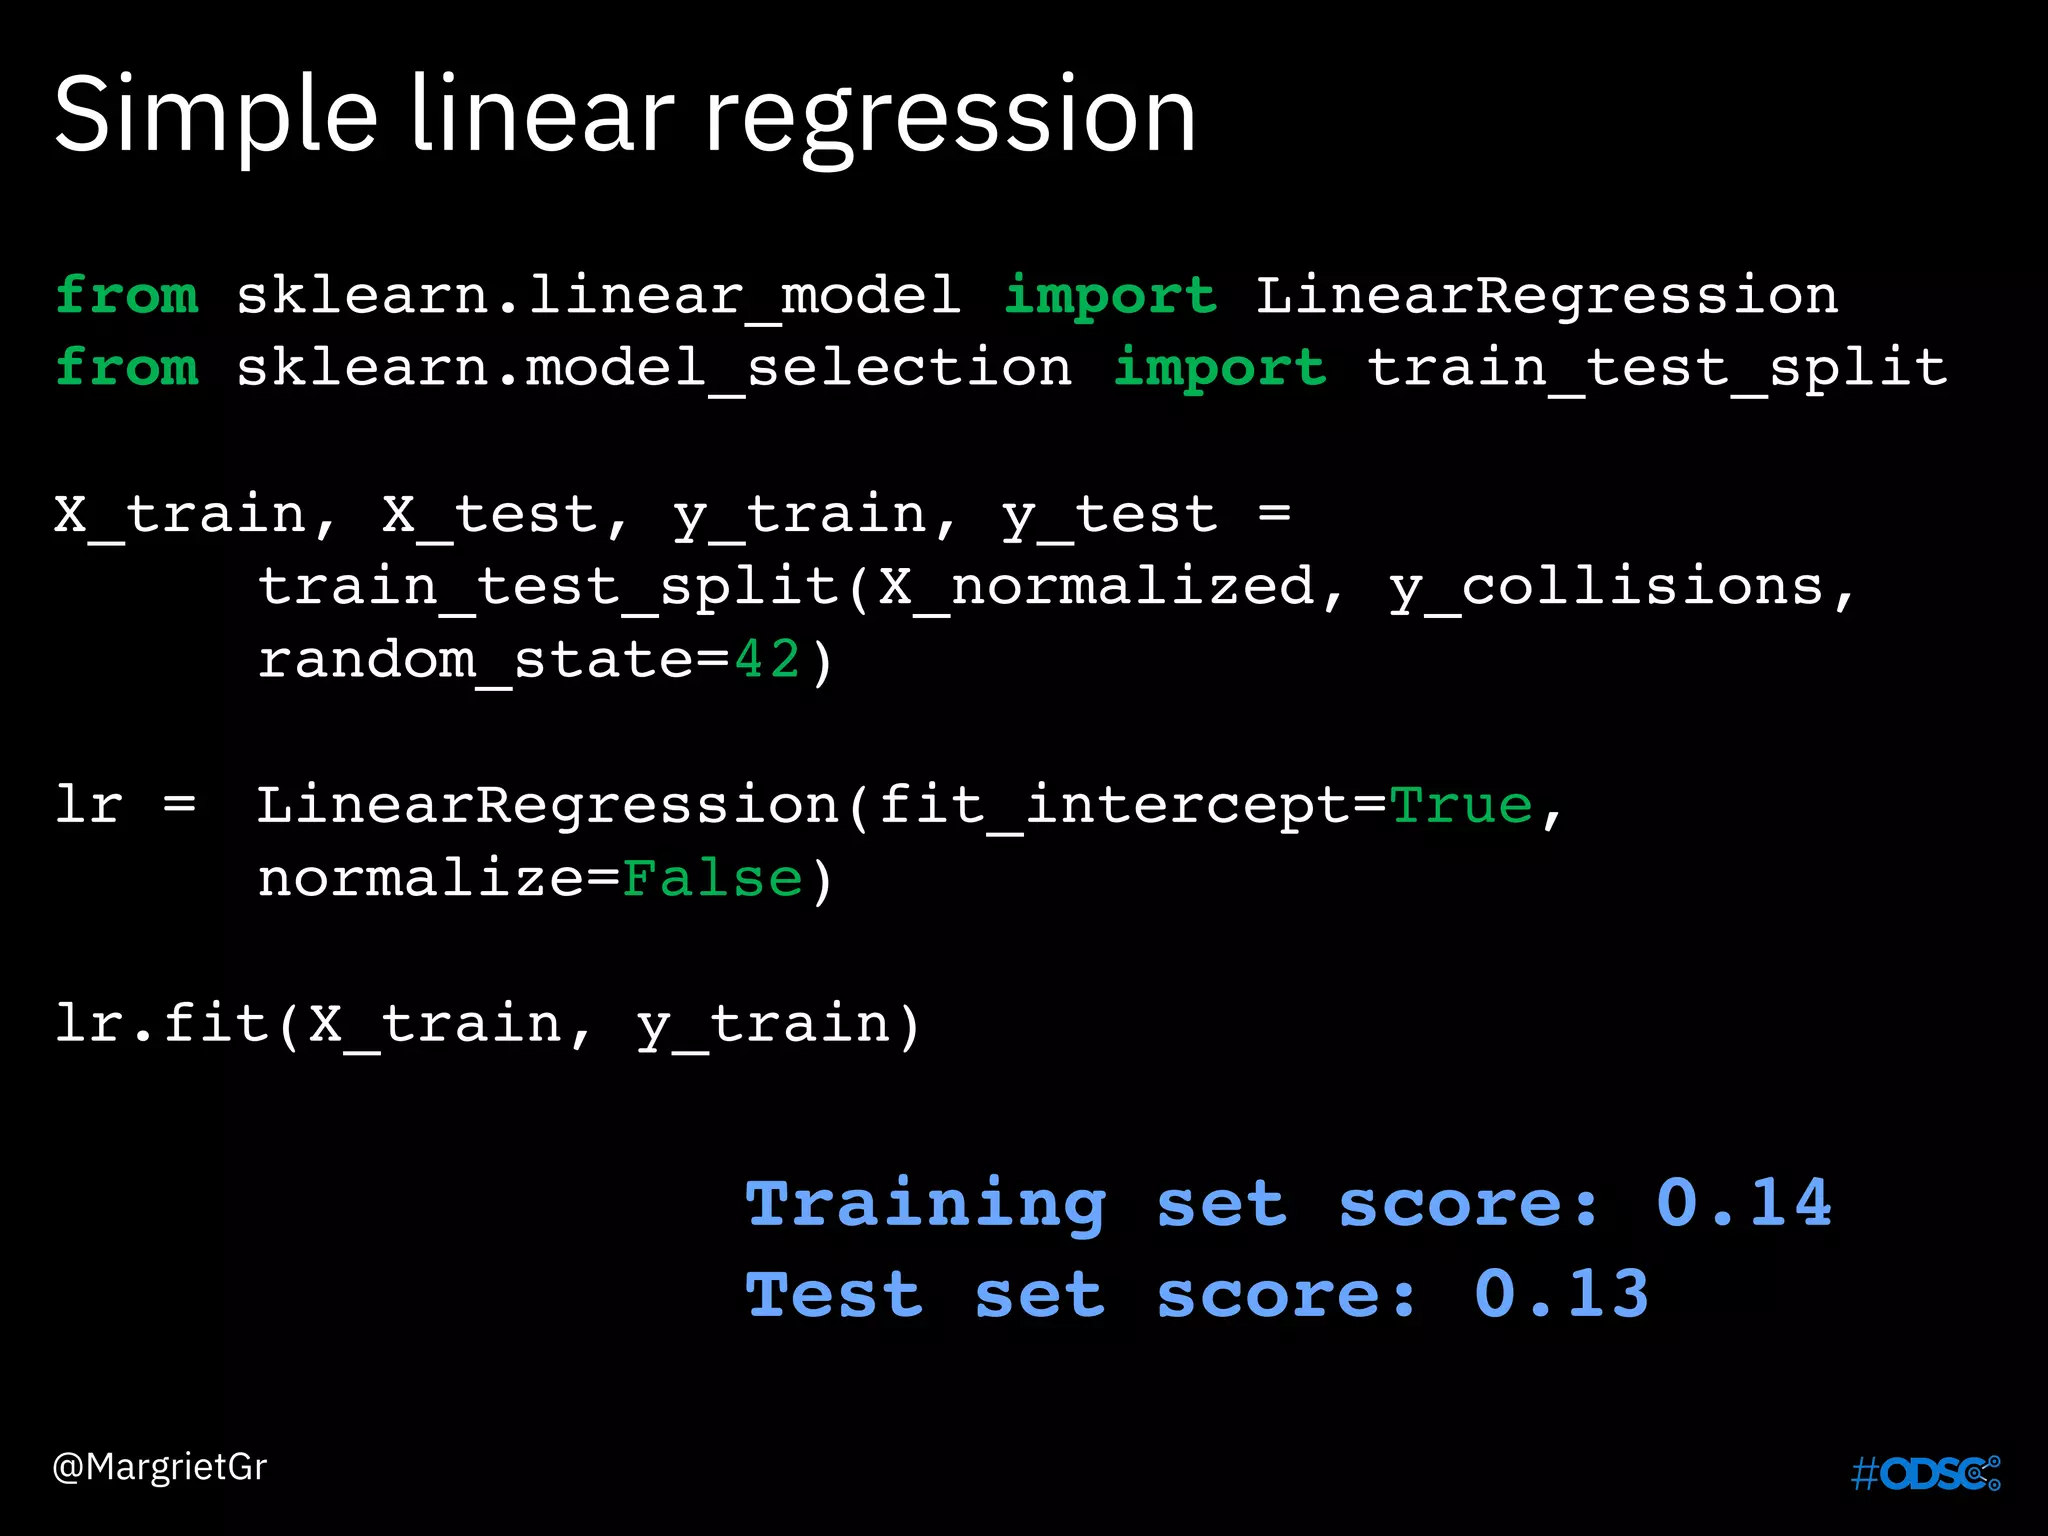
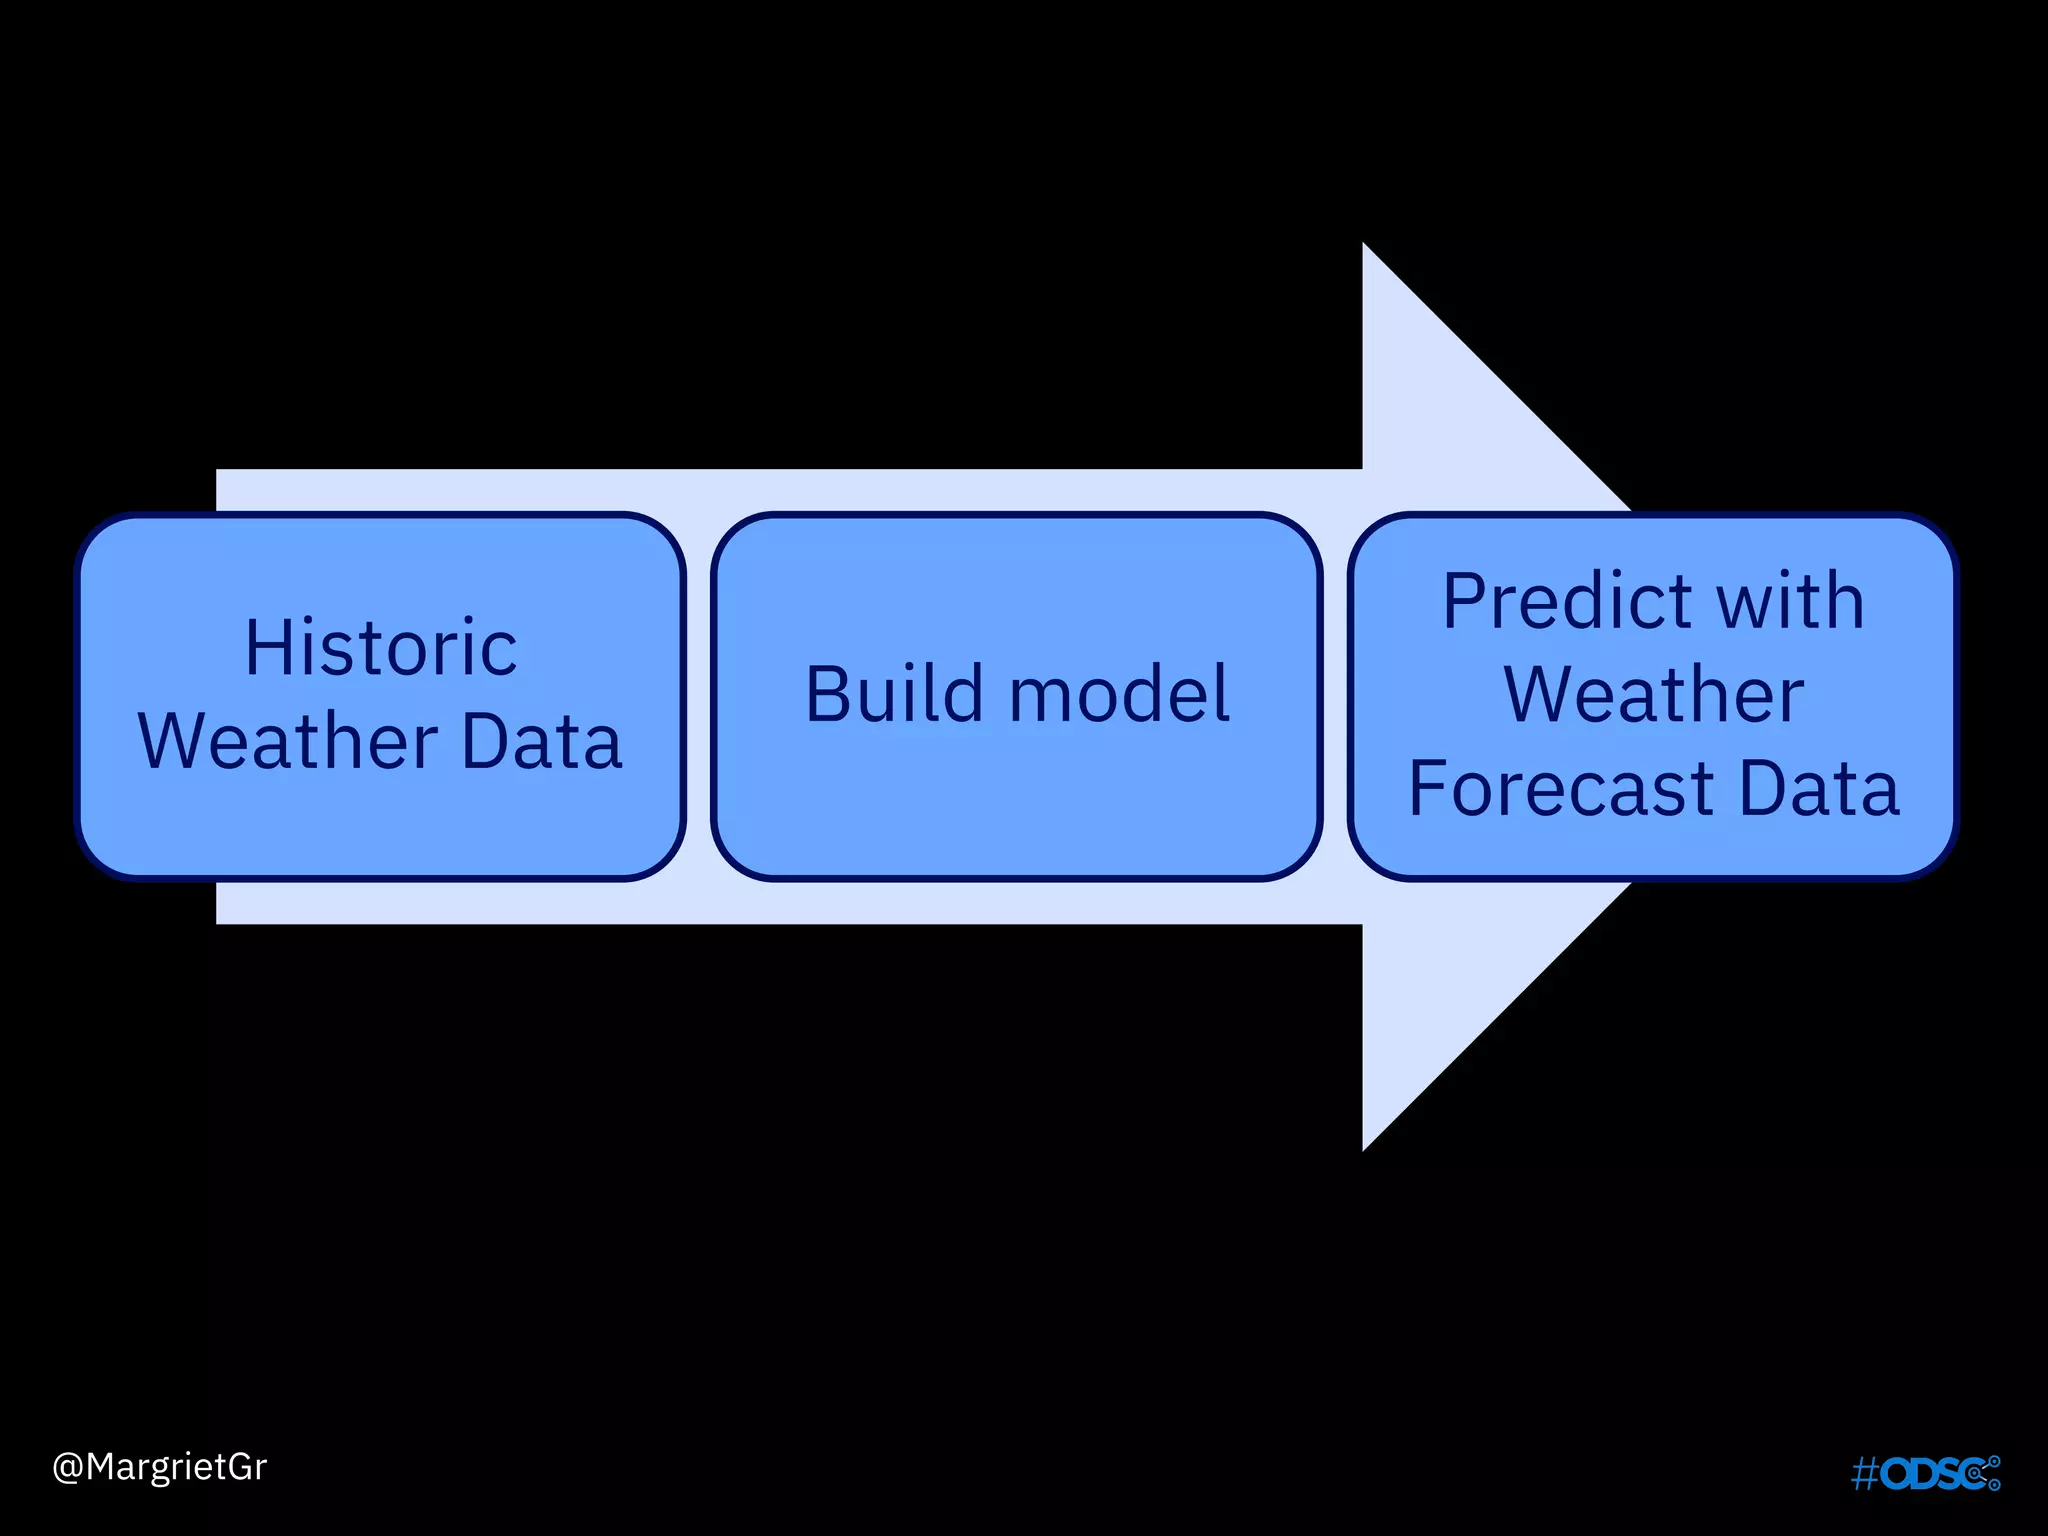
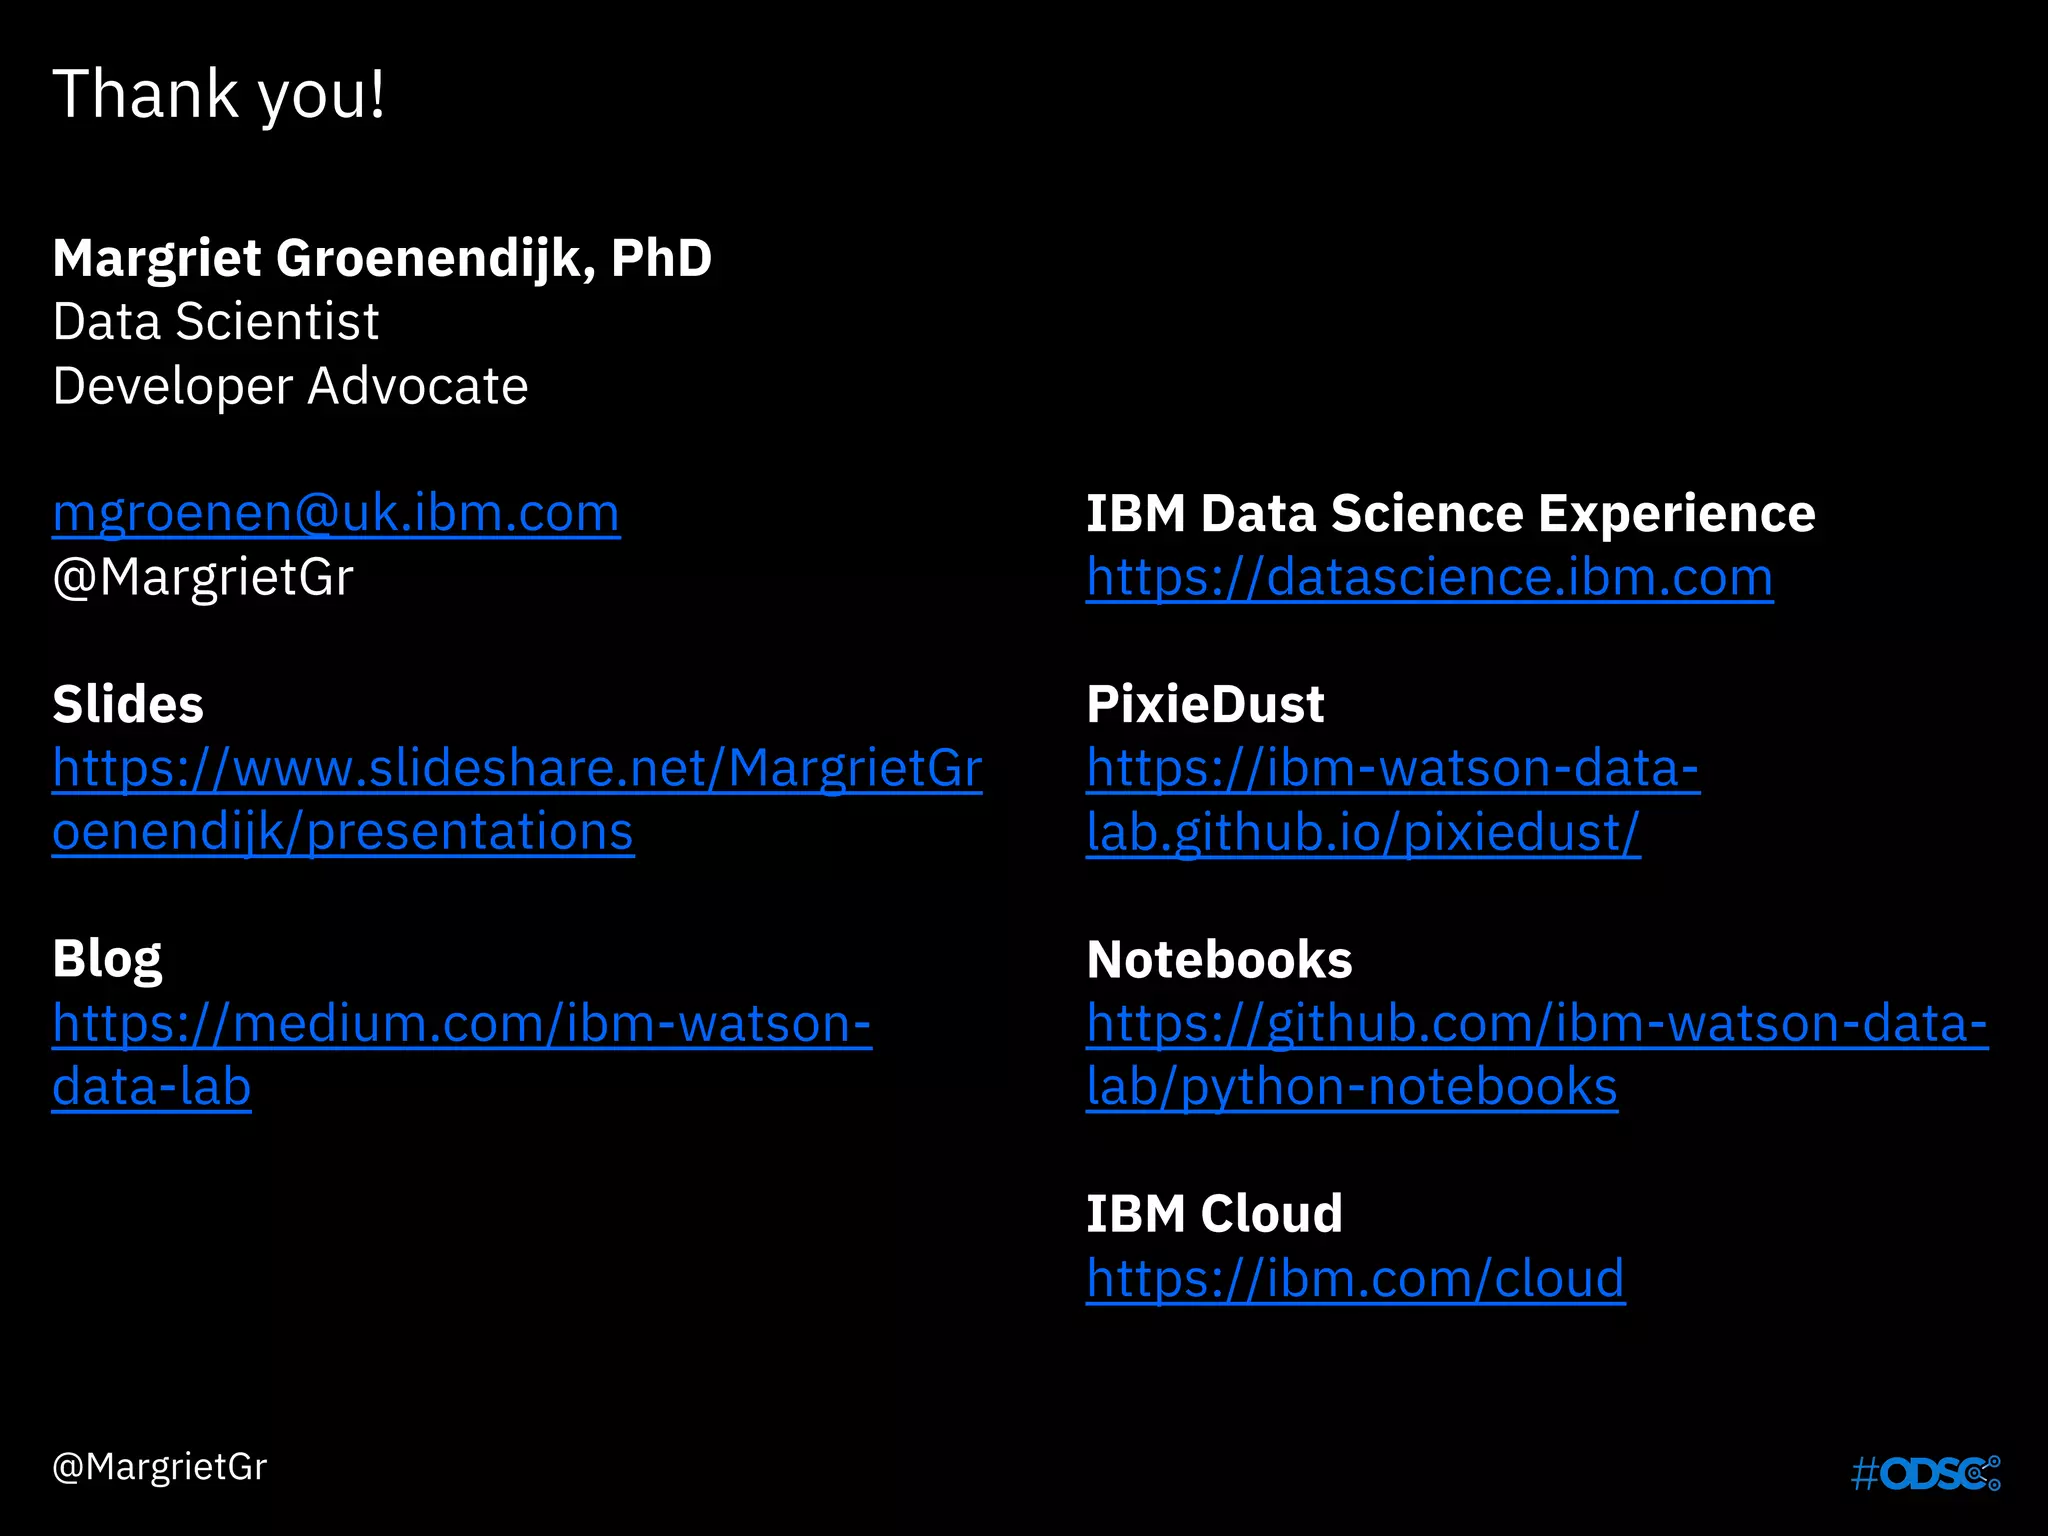


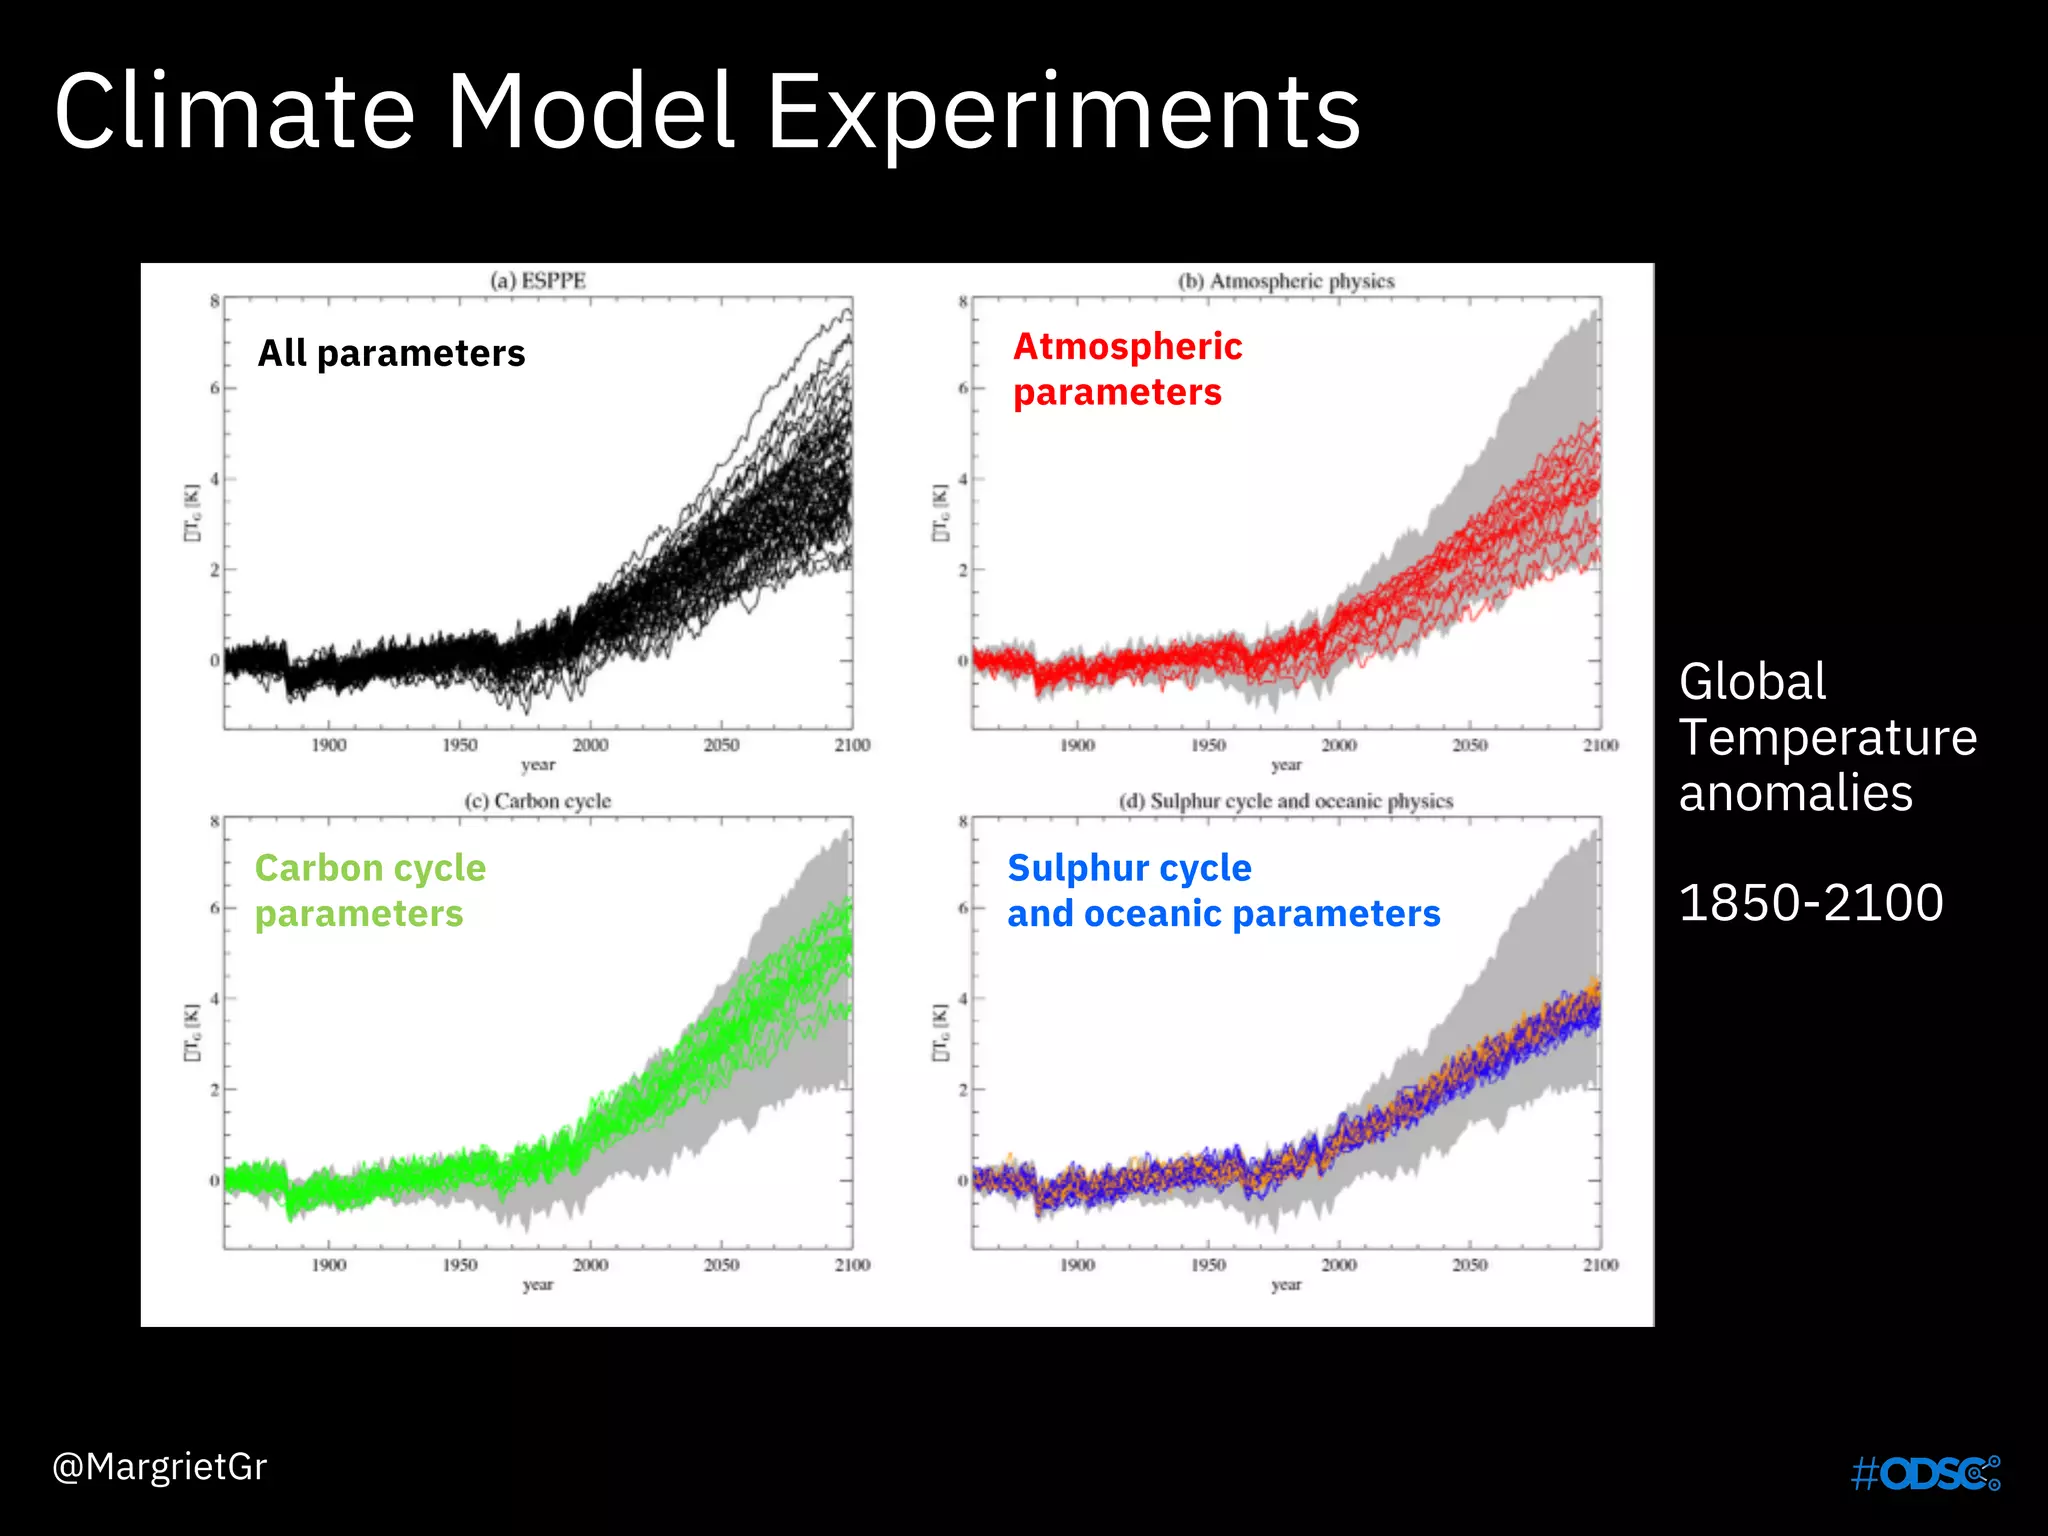
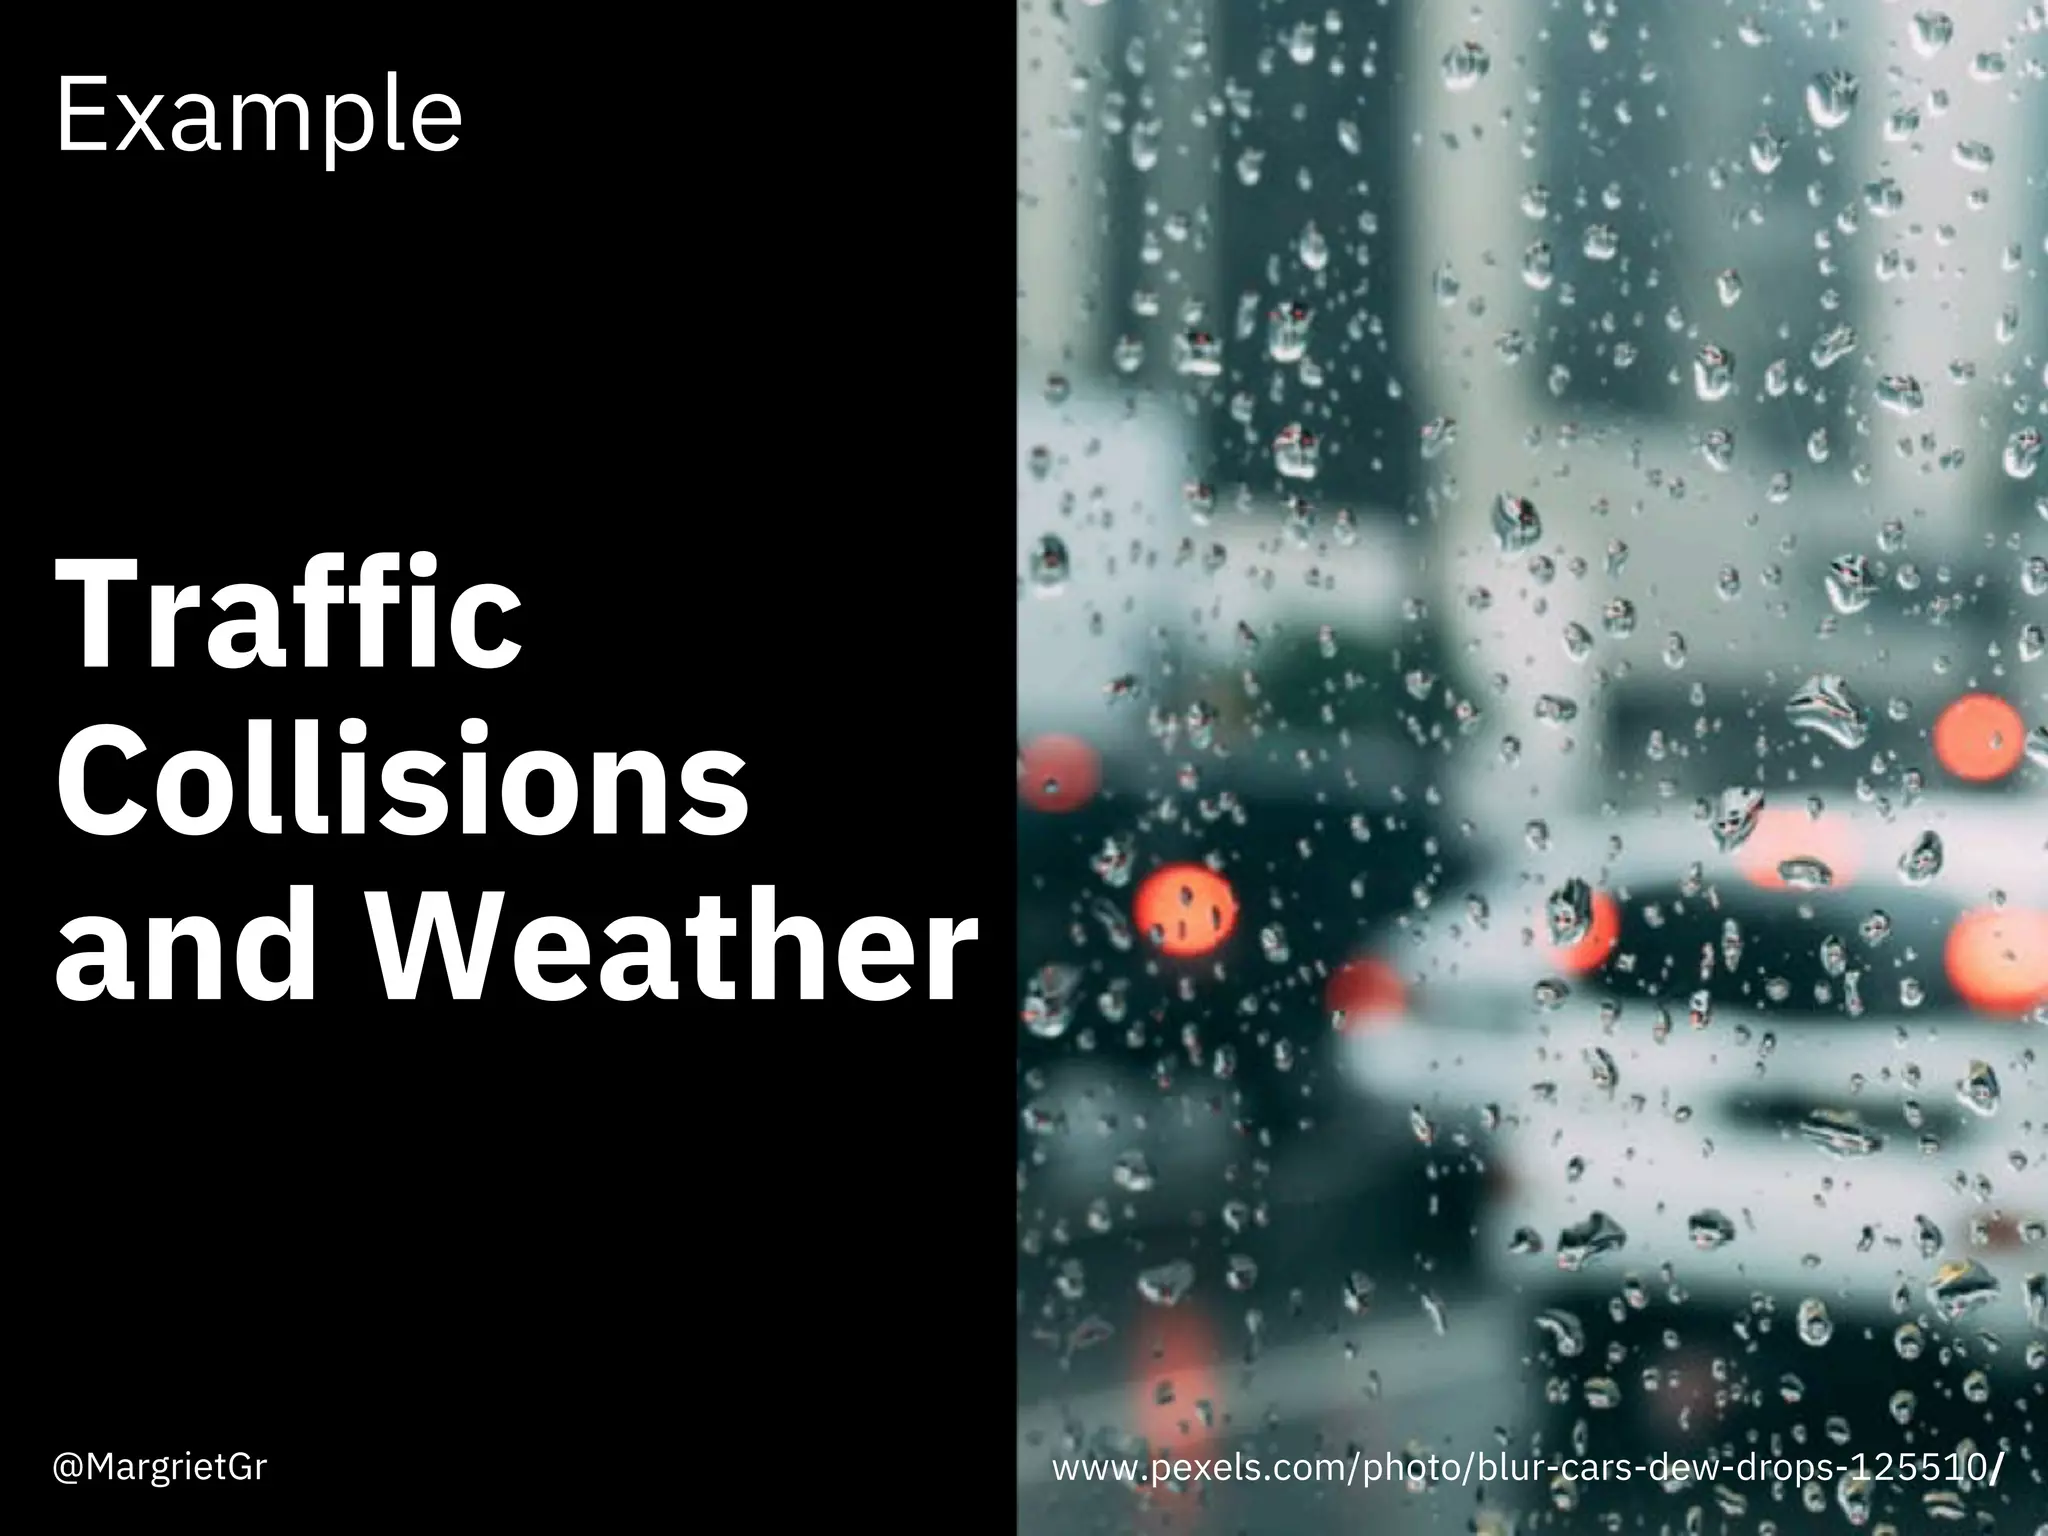
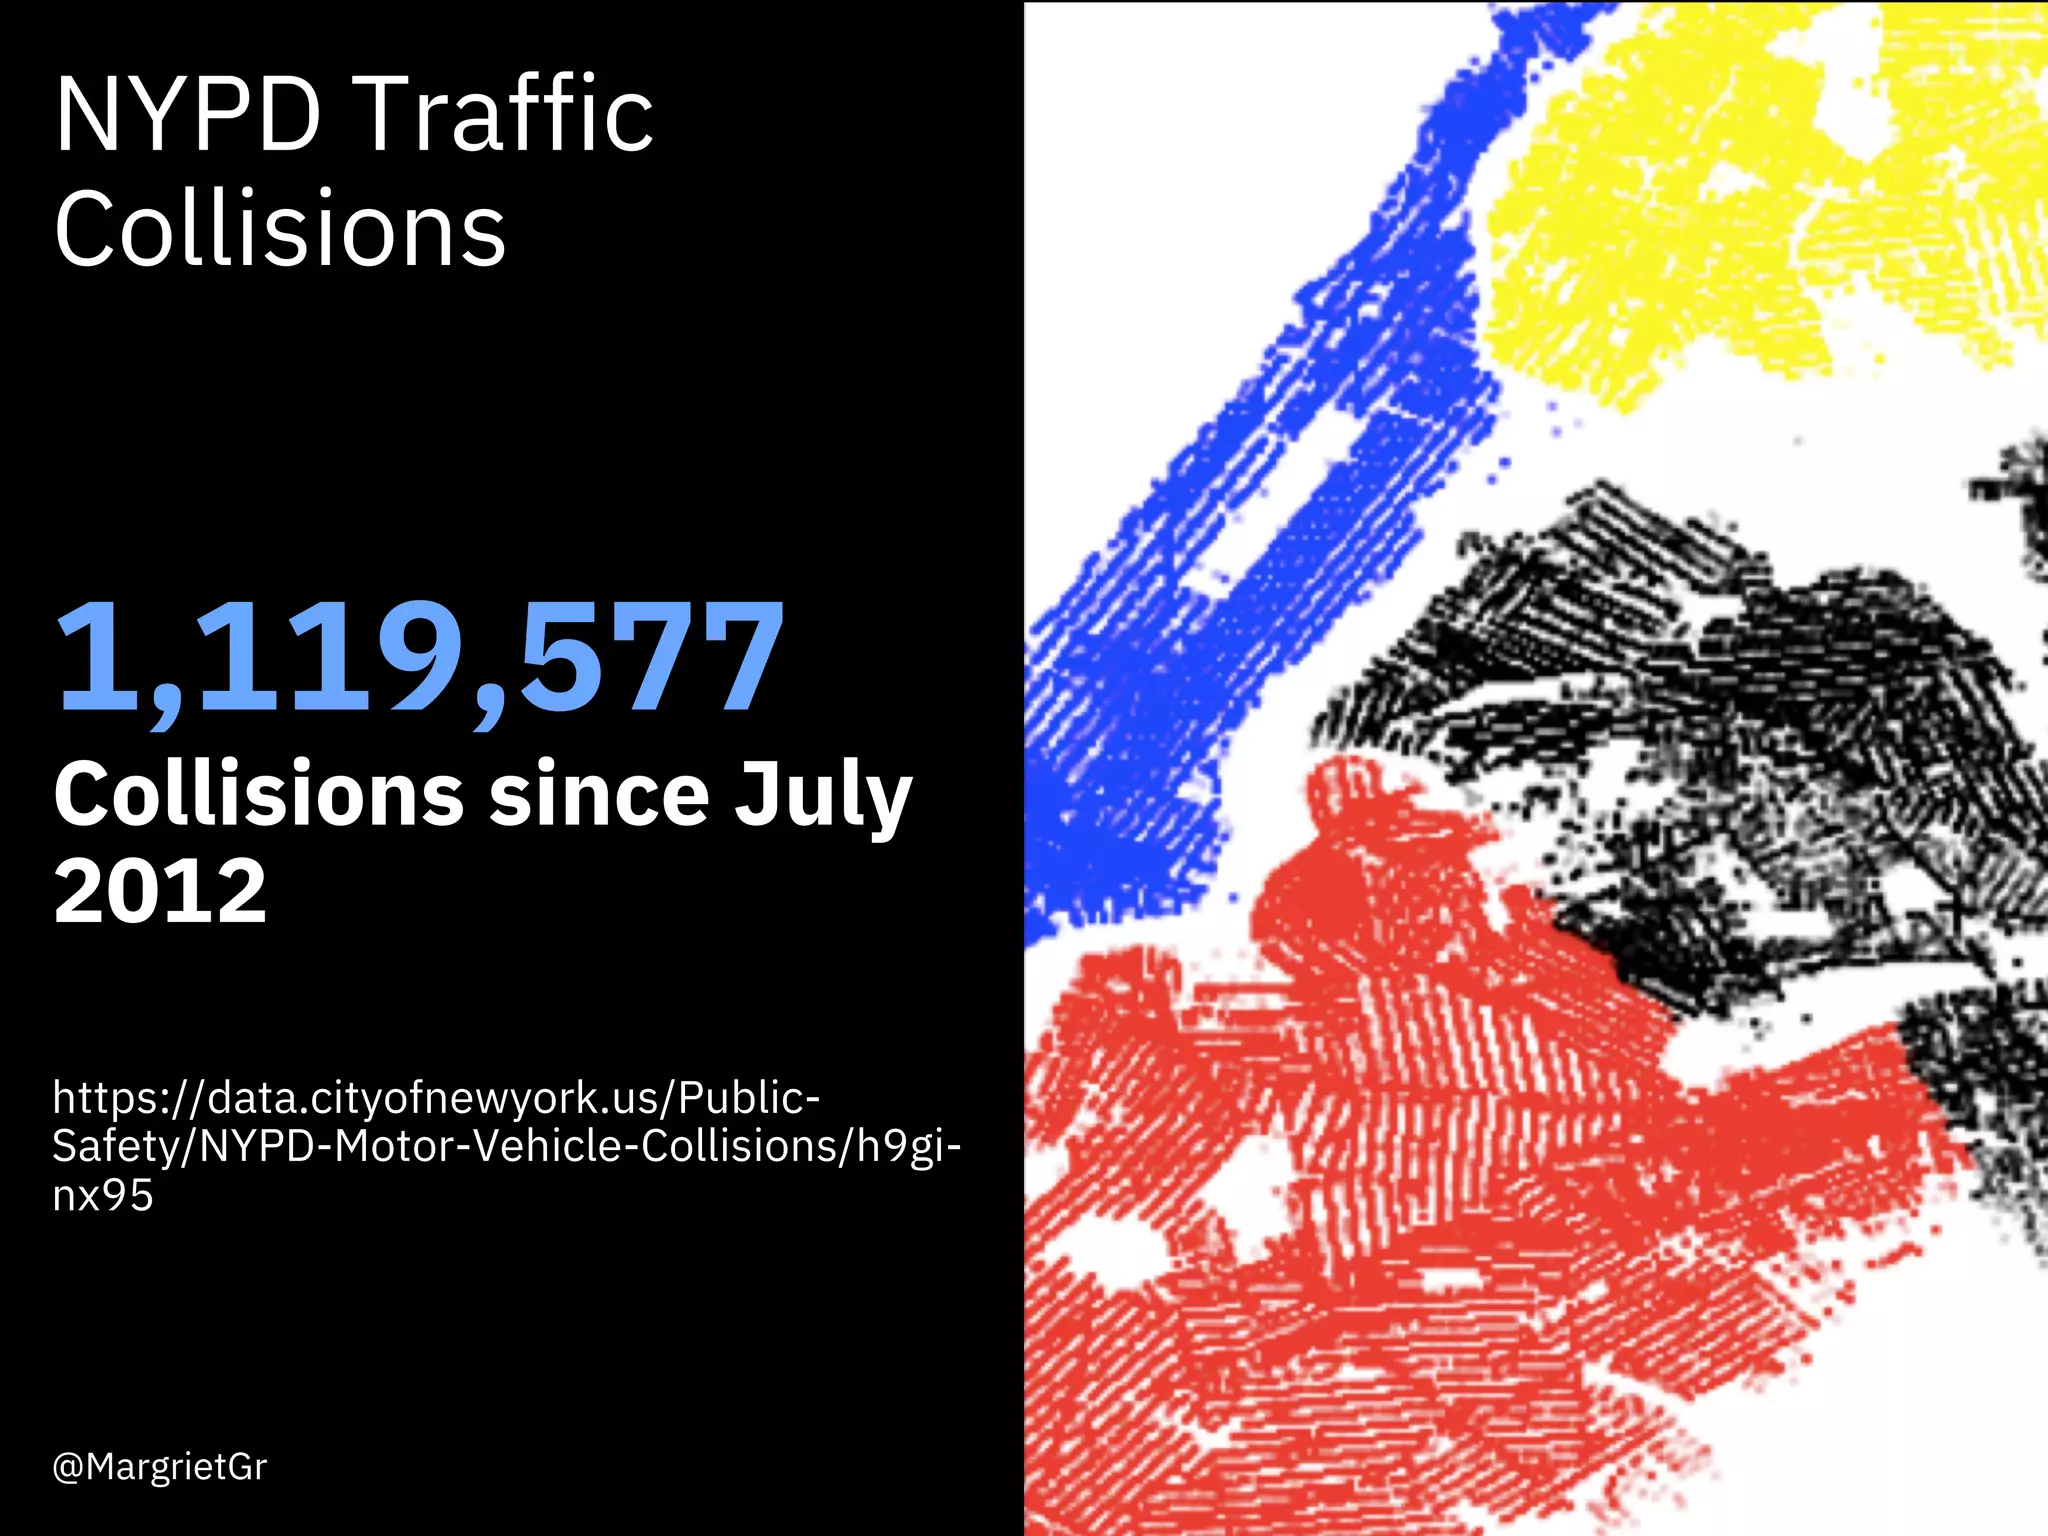
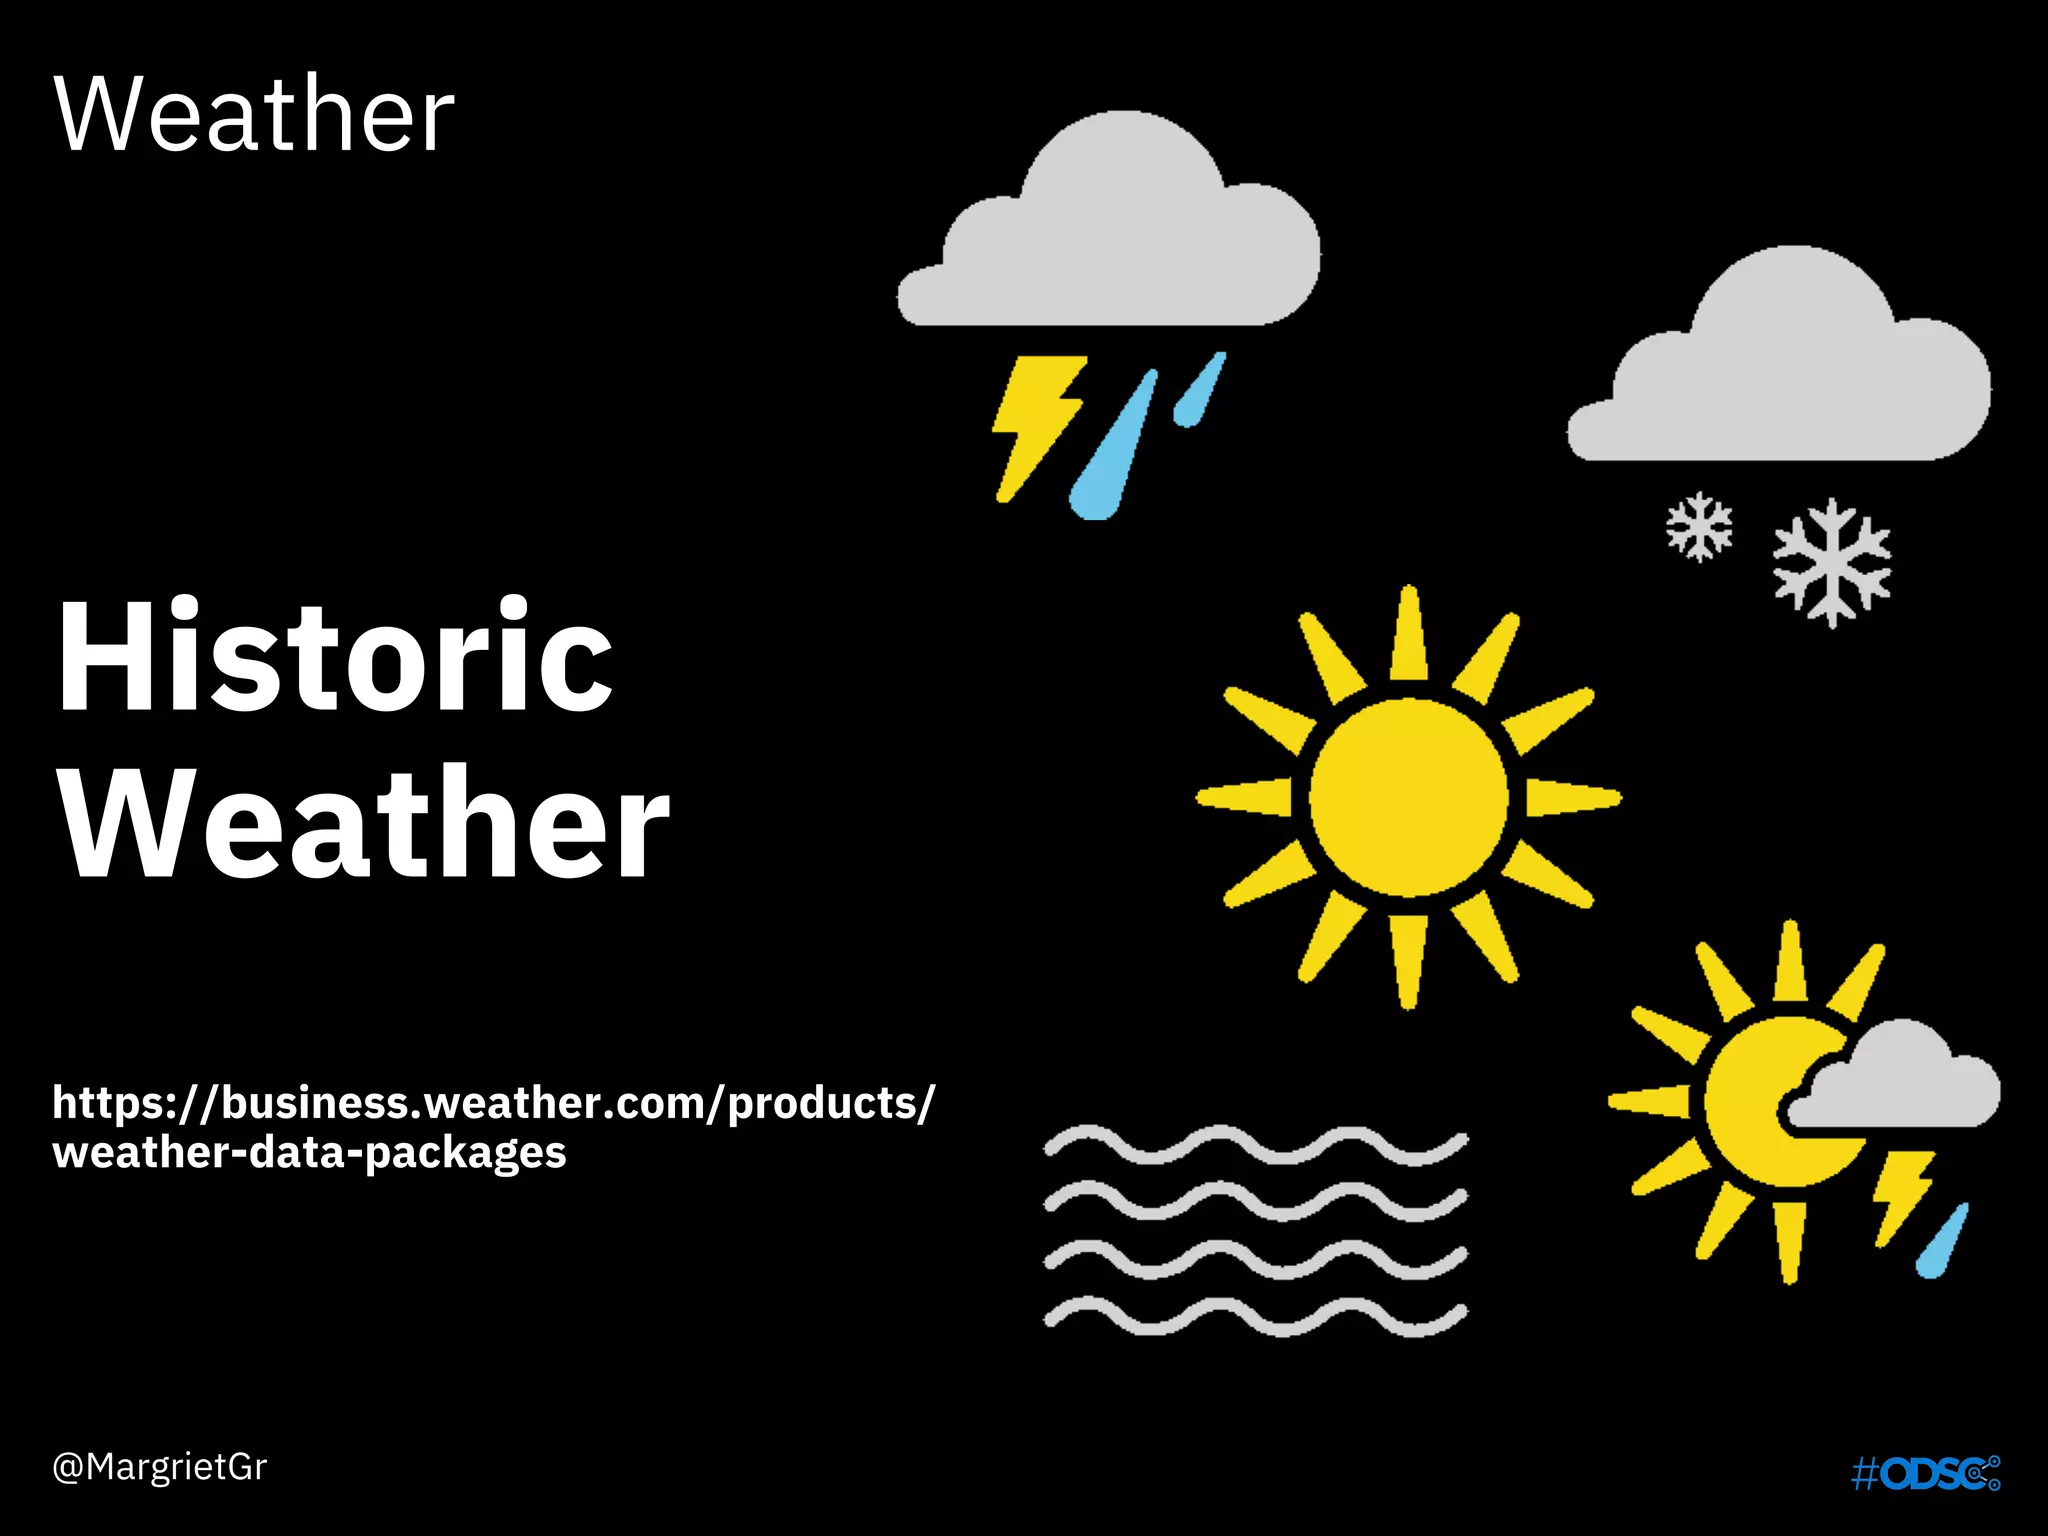
The document discusses the use of weather and climate data beyond meteorology, highlighting sources and tools for accessing and analyzing this data, such as APIs and Jupyter notebooks. It also explores the connection between weather and traffic collisions, suggesting that historical weather data can be used to build predictive models for accidents. Techniques like linear regression and random forest are introduced for analyzing the relationship between weather conditions and traffic incidents.


![[DSC Europe 25] Boris Perkovic - Lost in performance.pptx](https://cdn.slidesharecdn.com/ss_thumbnails/uq5hrp7vsuahqkxzifux-1-251204082258-fd2ee09d-thumbnail.jpg?width=640&height=640&fit=bounds)


![[DSC Europe 25] Dragana Ilic - AI for Big Data in Astronomy.pptx](https://cdn.slidesharecdn.com/ss_thumbnails/8palya86qaatvjhva1ms-2-dragana-ilic-ai-ilic-251208151906-652b819c-thumbnail.jpg?width=640&height=640&fit=bounds)
![[DSC Europe 25] Petar Zivanov - AI meets documents From chatbots to AI-powere...](https://cdn.slidesharecdn.com/ss_thumbnails/xer2bb6nrdc8pdpev0pc-8-251204082258-7c2fa4a1-thumbnail.jpg?width=640&height=640&fit=bounds)


![[DSC Europe 25] Nikola Rajovic - Hardware Technologies Under the Hood: RISC-V...](https://cdn.slidesharecdn.com/ss_thumbnails/o2gptrmtoyqndgoshwgq-dsc2025-tenstorrent-rajovic-251205090438-814685f5-thumbnail.jpg?width=640&height=640&fit=bounds)


