Download to read offline

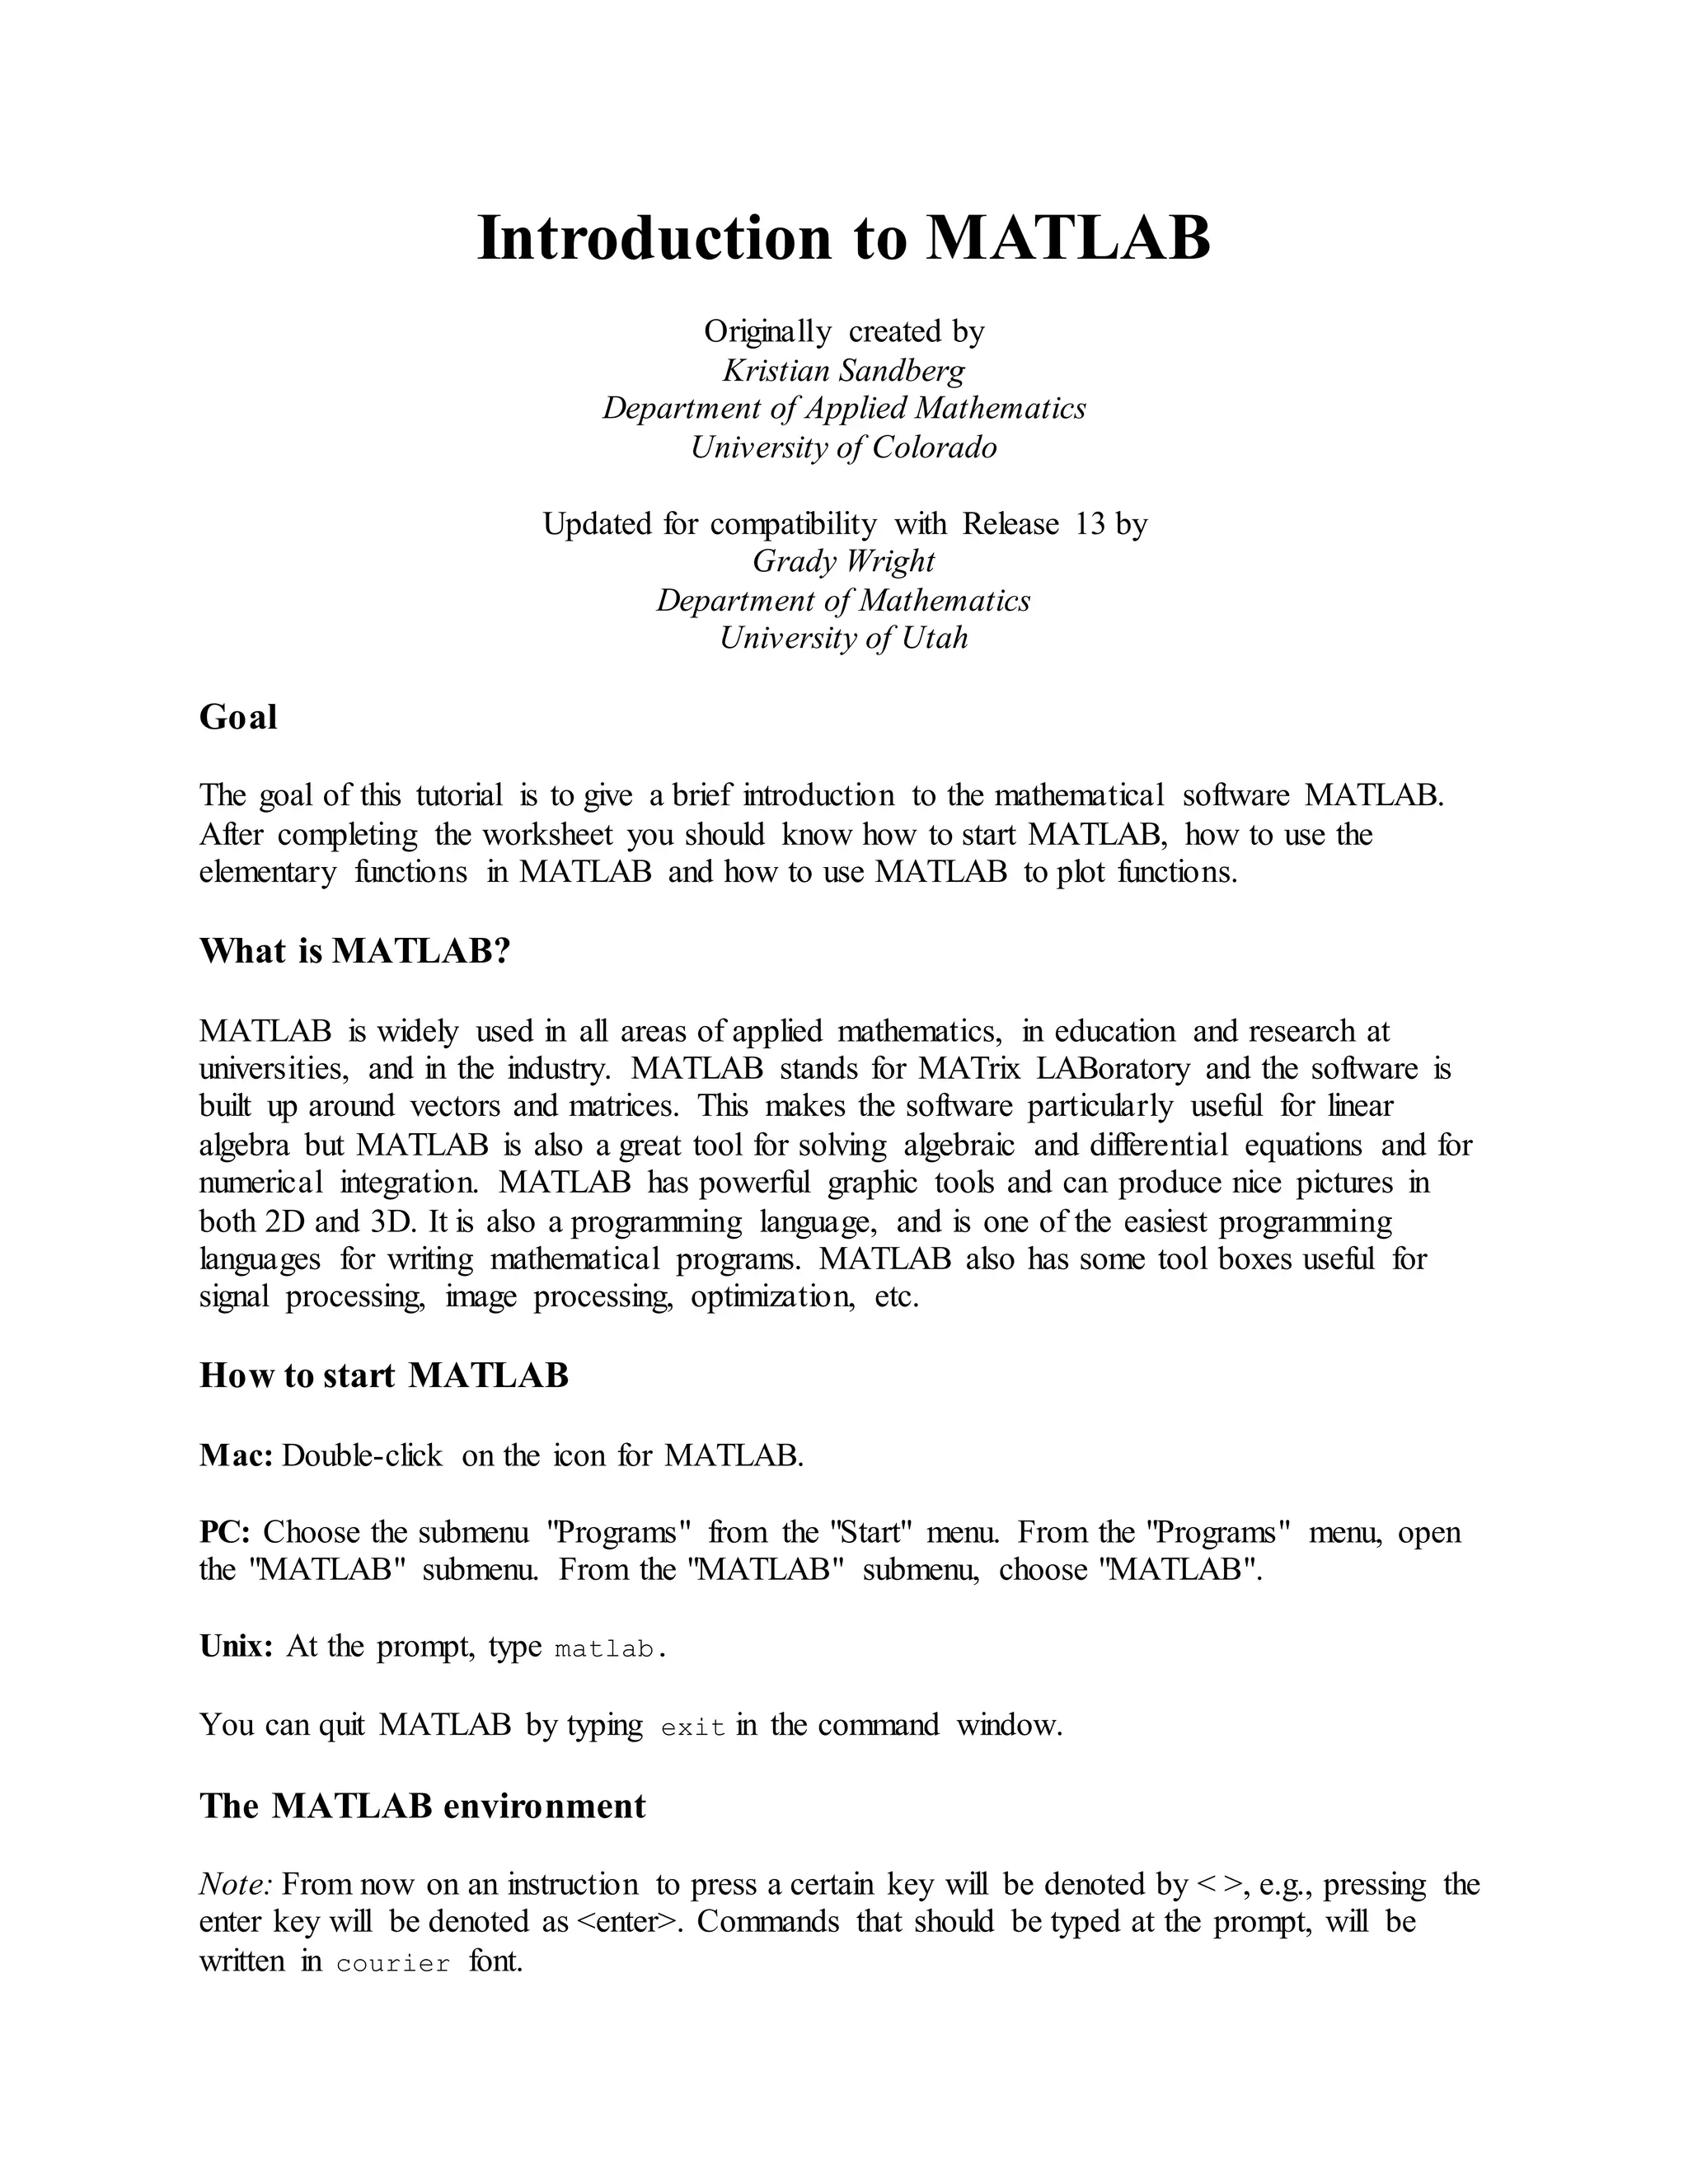
![Note that the description MATLAB returns about the command you requested help on contains
the command name in ALL CAPS. This does not mean that you use this command by typing it in
ALL CAPS. In MATLAB, you almost always use all lower case letters when using a command.
Variables in MATLAB
We can easily define our own variables in MATLAB. Let's say we need to use the value of
3.5sin(2.9) repeatedly. Instead of typing 3.5*sin(2.9)over and over again, we can denote this
variable as x by typing the following:
x=3.5*sin(2.9)
(Please try this in MATLAB.) Now type
x+1
and observe what happens. Note that we did not need to declare x as a variable that is supposed
to hold a floating point number as we would need to do in most programming languages.
Often, we may not want to have the result of a calculation printed-out to the command window.
To supress this output, we put a semi-colon at the end of the command; MATLAB still performs
the command in "the background". If you defined x as above, now type
y=2*x;
y
and observe what happened.
In many cases we want to know what variables we have declared. We can do this by typing
whos. Alternatively, we can view the values by openning the "Workspace" window. This is done
by selecting the Workspace option from the View menu. If you want to erase all variables from
the MATLAB memory, type clear. To erase a specific variable, say x, type clear x. To clear
two specific variables, say x and y, type clear x y, that is separate the different variables with a
space. Variables can also be cleared by selecting them in the Workspace window and selecting
the delete option.
Vectors and matrices in MATLAB
We create a vector in MATLAB by putting the elements within [] brackets.
Example: x=[ 1 2 3 4 5 6 7 8 9 10]
We can also create this vector by typing x=1:10. The vector (1 1.1 1.2 1.3 1.4 1.5) can be
created by typing x=[ 1 1.1 1.2 1.3 1.4 1.5 ] or by typing x=1:0.1:1.5.](https://image.slidesharecdn.com/introductiontomatlab-150417192039-conversion-gate01/85/Introduction-to-matlab-4-320.jpg)
![Matrices can be created according to the following example. The matrix A= is
created by typing
A=[1 2 3 ; 4 5 6; 7 8 9],
i.e., rows are separated with semi-colons. If we want to use a specific element in a vector or a
matrix, study the following example:
Example:
x=[10 20 30]
A=[ 1 2 3 ; 4 5 6 ; 7 8 9]
x(2)
A(3,1)
Here we extracted the second element of the vector by typing the variable and the position within
parantheses. The same principle holds for matrices; the first number specifies the row of the
matrix, and the second number specifies the column of the matrix. Note that in MATLAB the
first index of a vector or matrix starts at 1, not 0 as is common with other programming
languages.
If the matrices (or vectors which are special cases of a matrices) are of the same dimensions then
matrix addition, matrix subtraction and scalar multiplication works just like we are used to.
Example: Type
x=[1 2 3]
y =[4 5 6]
a=2
x+y
x-y
a*x
and observe what happens.
If want to apply an operation such as squaring each element in a matrix we have to use a dot .
before the operation we wish to apply. Type the following commands in MATLAB.](https://image.slidesharecdn.com/introductiontomatlab-150417192039-conversion-gate01/85/Introduction-to-matlab-5-320.jpg)
![x=1:10
x.^2
A=[1 2 3 ; 4 5 6 ; 7 8 9 ]
A.^2
A^2
and observe the result. The dot allows us to do operations elementwise. All built-in functions
such as sin, cos, exp and so on automatically act elementwise on a matrix. Type
y=[0 1/4 1/2 3/4 1]
y=pi*y
sin(y)
and observe the result.
How to plot with MATLAB
There are different ways of plotting in MATLAB. The following two techniques, illustrated by
examples, are probably the most useful ones.
Example 1: Plot sin(x2) on the interval [-5,5]. To do this, type the following:
x=-5:0.01:5;
y=sin(x.^2);
plot(x,y)
and observe what happens.
Example 2: Plot exp(sin(x)) on the interval [-,]. To do this, type the following:
x=linspace(-pi,pi,101);
y=exp(sin(x));
plot(x,y)
and observe what happens. The command linspace creates a vector of 101 equally spaced
values between - and (inclusive).](https://image.slidesharecdn.com/introductiontomatlab-150417192039-conversion-gate01/85/Introduction-to-matlab-6-320.jpg)
![Ocassionally, we need to plot values that vary quite differently in magnitude. In this case, the
regular plot command fails to give us an adequate graphical picture of our data. Instead, we
need a command that plots values on a log scale. MATLAB has 3 such commands:
loglog,semilogx, and semilogy. Use the help command to see a description of each function.
As an example of where we may want to use one of these plotting routines, consider the
following problem:
Example 3: Plot x5/2 for x = 10-5 to 105. To do this, type the following:
x=logspace(-5,5,101);
y=x.^(5/2);
plot(x,y)
and observe what happens. Now type the following command:
loglog(x,y)
The command logspace is similar to linspace, however it creates a vector of 101 points
lograthmically equally distributed between 10-5 and 105.
The following commands are useful when plotting:
Graphing functions MATLAB command
Label the horizontal axis. xlabel('text')
Label the vertical axis. ylabel('text')
Attach a title to the plot. title('text')
Change the limits on the x and y axis.
axis([xmin xmax ymin
ymax])
"Keep plotting in the same window." hold on
Turn off the "keep-plotting-in-the-same-window-
command".
hold off
Note that all text must be put within ' '. The last two commands (hold on and hold off) are
best explained by trying them next time you plot.
Exercises
Plot sin(x) on the interval [-pi,pi] using spacing 0.5, 0.1 and 0.01 between the points
where you will sample the function. (This will change the resolution). Experiment with
the hold on command.](https://image.slidesharecdn.com/introductiontomatlab-150417192039-conversion-gate01/85/Introduction-to-matlab-7-320.jpg)
![ Attach labels to the axis of the previous plot and give a title to the graph.
Plot 5 cos(x2+1) on [-2pi,2pi]. Note that the squaring operation will require you to use the
dot . in order for the squaring operation to act on each element individually. However,
the addition operation (+) automatically acts on elements individually.](https://image.slidesharecdn.com/introductiontomatlab-150417192039-conversion-gate01/85/Introduction-to-matlab-8-320.jpg)

This document provides an introduction to MATLAB. It describes what MATLAB is, how to start and use the basic functions in MATLAB, and how to plot functions. MATLAB is a numerical computing environment and programming language. It is useful for matrix manipulations, solving equations, integration, and producing graphs. The document outlines how to perform calculations, define variables, create vectors and matrices, and plot functions in MATLAB. It provides examples of basic math operations, functions, plotting techniques, and accessing help in MATLAB.