Downloaded 13 times
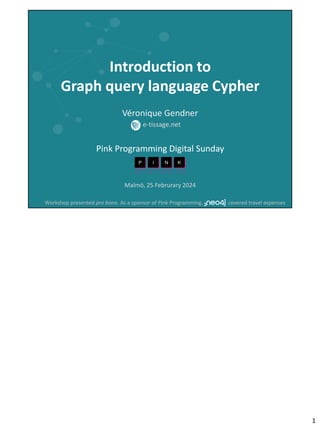

![- When the list gets too long, instead of having everything in just
one list
- You probably want to classify your items, in order to be able to
find them
- For example, take those grey dots, that can have properties,
represented here by a red triangle, blue cross or green square
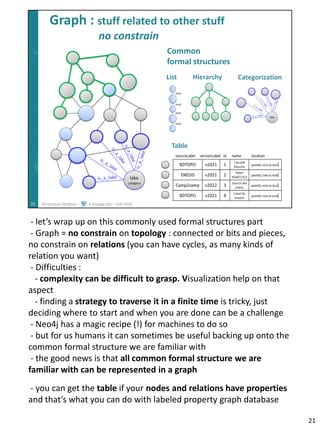
- A common representation of a classification is with sets, here,
the red, blue and green potato shapes
- But a classification can also be represented a graph structure
- [ graph def ]
6](https://image.slidesharecdn.com/240225-240809085204-b1bf2d45/85/Introduction-to-Graph-query-language-Cypher-6-320.jpg)


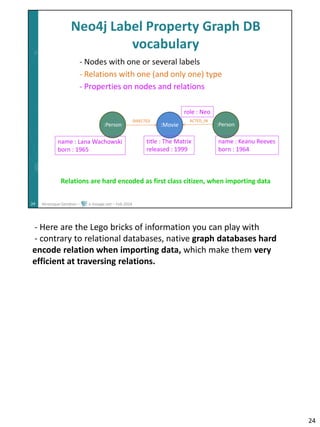


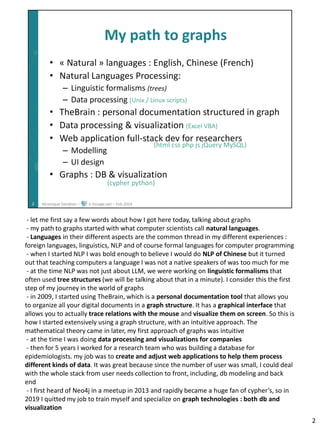
![- the term Knowledge Graph is sometimes used as a synonym of
graph database, but most of times, Knowledge Graph means
there are some constrains on the graph, in term of relations
types and or node topology.
(i.g. (instance)-[:isA]->(subClass)-[:isSubClassOf]->(class) ).
Such constrains allow to compute new information with logical
inferences
(i.g. if (a)-[:isSubClassOf]->(b)-[:isSubClassOf]->(c) then (a)-
[:isSubClassOf]->(c) )
- a currently very hot topic is the use of graphs for Retrieval
Augmented Generation (RAG), in order to frame LLM
hallucinations with knowledge represented in a graph structure
- nodes embedding (= node vectorization) is used for machine
learning
- state machine are a way to represent the state of an automaton
with operation that will make states evolve. This is used to
monitor tickets in a IT system, to deal with issues or updates
32](https://image.slidesharecdn.com/240225-240809085204-b1bf2d45/85/Introduction-to-Graph-query-language-Cypher-32-320.jpg)


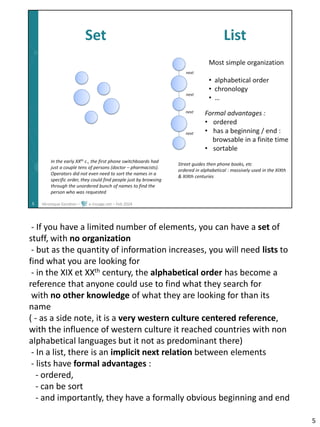
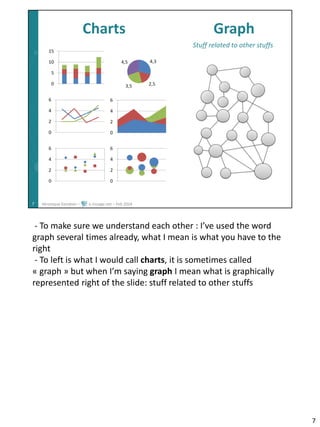
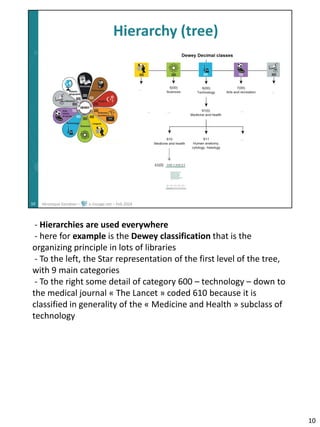
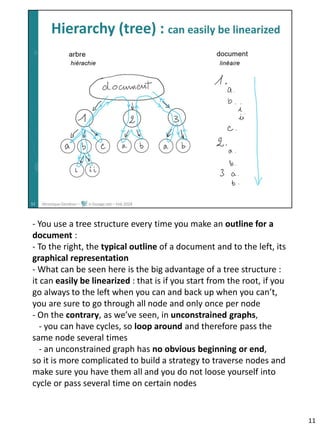
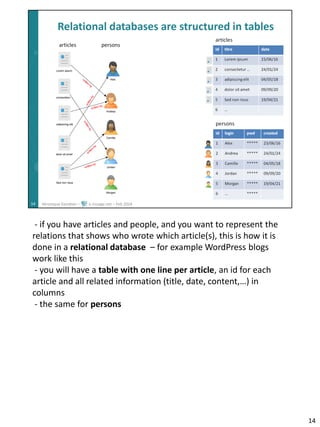
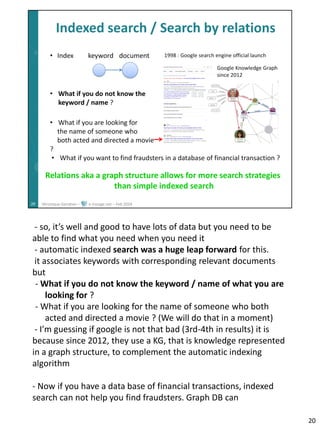
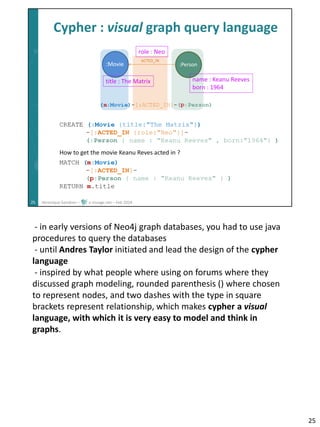
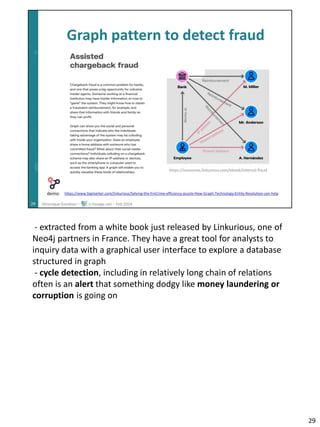
The document discusses the evolution of information representation, tracing the author's journey from natural languages to graph technologies and databases. It highlights the historical development of storage mediums, the need for structured information, and the advantages of graph databases over traditional relational models for managing complex relationships. The content also touches upon the significance of graph structures in modern data science, especially in applications such as knowledge graphs and fraud detection.