1) The document examines variation in stomatal densities in Macroneuropteris scheuchzeri fossil samples from five locations in the Illinois Basin dating to 306-307 million years ago to understand paleoclimate conditions.
2) Data was collected by counting stomata and epidermal cells in boxes of defined areas on leaf peels and fragments from the samples. Average stomatal densities ranged from 7-13 per box across locations.
3) Preliminary results show modest variation in stomatal densities and indices between samples within locations, suggesting relatively stable climate conditions during this period based on the inverse relationship between stomatal features and atmospheric CO2 levels.
Foraminiferal Approach to Palaeoenvironmental Interpretations: Case Study of ...Premier Publishers
Palaeoenvironmental analysis was carried out on eighty (80) ditch cutting samples of the Late Eocene-Early Oligocene sediments from two wells (well C consist of 13 samples collected at 30metres interval from depth range of 2410 -2770m while well F consists of 67 samples collected at 20metres from depth range of 2000-3320m) in the Northern Depobelt of the Tertiary Niger Delta. This study was carried out using standard micropalaeontological sample procedures and analysis as well as interpretation of the foraminiferal biofacies assemblages taking into consideration the qualitative and quantitative approaches. The qualitative method involved comparison of the recovered foraminifera with extant forms while the quantitative method involved the use of tau index, palaeowater depth (Pwd), percent of calcerous to arenaceous benthic foraminifera ratios (%FOBC: %FOBA), Fisher diversity and foraminifera/ ostracoda ratio. The palaeoenvironmental analysis indicates that the sediments were deposited in a non-marine to outer neritic environmental setting with salinity conditions fluctuating between normal marine and slightly hypersaline.
Towards an integrated Understanding of Green Space in the European Built Environment
`
For more information, Please see websites below:
`
Organic Edible Schoolyards & Gardening with Children
http://scribd.com/doc/239851214
`
Double Food Production from your School Garden with Organic Tech
http://scribd.com/doc/239851079
`
Free School Gardening Art Posters
http://scribd.com/doc/239851159`
`
Increase Food Production with Companion Planting in your School Garden
http://scribd.com/doc/239851159
`
Healthy Foods Dramatically Improves Student Academic Success
http://scribd.com/doc/239851348
`
City Chickens for your Organic School Garden
http://scribd.com/doc/239850440
`
Simple Square Foot Gardening for Schools - Teacher Guide
http://scribd.com/doc/239851110
Experiential Investigation on the Stabilization of Dispersive Soil with Limeijtsrd
The soils that are highly susceptible to erosion and containing high percentage of exchangeable sodium ions are called Dispersive Soils. In appearance, dispersive clays are like normal clays that are stable and somewhat resistant to erosion, but in reality they can be highly erosive and subject to severe damage or failure. Using dispersive clay soils in hydraulic structures, embankment dams, or other structures such as roadway, embankments can cause serious engineering problems if these soils are not stabilized and used appropriately. This problem is worldwide, and structural failures attributed to dispersive soils have occurred in many countries. This paper presents the stabilization of dispersive soil with lime. The soil sample is taken from Mandalay. Grain size distribution, Atterberg's limit test, compaction test, unconfined compressive strength UCS test and triaxial test are carried out to obtain the properties of soil. Type of studied soil classified by unified classification system is lean clay with sand. Crumb test is performed to know the dispersion degree of study soil. According to crumb test, the study soil is highly dispersive clay soil. Lime is used as stabilizing agent. The amount of lime used is 2 , 3 and 4 by dry weight of soil. The studied soil is mixed various contents of lime, and then crumb test is performed. At dispersive soil mixed with 4 of lime, there is no dispersion characteristic in soil. For stabilization of studied soil, 4 of lime is selected to investigate the improvement of strength in treated soil. The treated soil is performed compaction test, unconfined compression strength UCS test and triaxial test. Unconfined compression strength of treated soil at 4 lime is increased as 1.12 times that of natural soil. The shear strength of treated soil increases about 2 times than that of natural soil. The cohesion value of treated soil increases about 1.12 times and the angle of internal friction increases about 1.23 times than that of natural soil. Finally, it is concluded from this study that the lime treated soil is more resistant to erosion and the treated soil is more resistant to shear stress and lateral pressure. Soe Soe War | Nyein Nyein Thant "Experiential Investigation on the Stabilization of Dispersive Soil with Lime" Published in International Journal of Trend in Scientific Research and Development (ijtsrd), ISSN: 2456-6470, Volume-3 | Issue-5 , August 2019, URL: https://www.ijtsrd.com/papers/ijtsrd26658.pdfPaper URL: https://www.ijtsrd.com/engineering/civil-engineering/26658/experiential-investigation-on-the-stabilization-of-dispersive-soil-with-lime/soe-soe-war
Wagner College Forum for Undergraduate Research, Vol 13 No 2Wagner College
The Spring 2015 issue contains papers by Alexandria Mary Zummo, Justin S.E. Bulova, William Pegg, James Forbes Sheehan, Jessica Catanzaro, Laurie Fogelstrom, Krag Kerr, Aisha Raheel, Kailin Newlin-Wagner and Quincy Rasin.
PHARMACOGNOSTICAL AND PHYTOCHEMICAL STUDIES ON THE LEAVES OF Anacardium occid...Jing Zang
This present work was conducted to explore the micro morphology and physico chemical parameters of the leaves of Anacardium occidentale Linn. (Anacardaceae). Macroscopy, microscopy, physicochemical analysis, preliminary phytochemical screening and other WHO recommended parameters for standardizations were performed. A.occidentale Linn is a small, spreading, evergreen tree reaching upto a height of 12 m. Leaves (10-20 cm long) are opposite, Obovate or Obovate- oblong, green and glabrous with entire often undulated margin, Obtuse –retuse or rounded tip apex and cuneate base with stout petiole. Microscopic evaluation revealed the presence of abaxial epidermis with paracytic stomata, apostomatic adaxial epidermis with thick wavy anticlinal walls, xylem vessels, parenchyma, tanniniferous cells, fibres and glandular trichomes. Petiole showed epidermis, vascular strands, ground tissue, secretary cavities, and calcium oxalate crystals. Vein islet numbers, vein termination numbers, stomatal number, stomatal index and other physico chemical tests like ash values, loss on drying, extractive values were determined. Preliminary phytochemical screening showed the presence of sterols, tannins, proteins and aminoacids, flavonoids, mucilage, glycosides, volatile oil, terpenoids, saponin, carbohydrates and absence of alkaloids, fixed oil. Microscopic analysis was informative and provides useful information in the botanical identification, standardization for purity & quality and immense value in authentication of the leaf.
Running Head CRITIQUE OF OCEAN TEMPERATURES IN CORAL REEFSCRIT.docxhealdkathaleen
Running Head: CRITIQUE OF OCEAN TEMPERATURES IN CORAL REEFS
CRITIQUE OF OCEAN TEMPERATURES IN CORAL REEFS Madison McNeill
Introduction
Coral reef ecosystems are the most diverse marine ecosystem in the world. They provide a home to thousands of species of plants and animals. In the last few decades, global warming has caused increased temperatures, resulting in ocean acidification and increasing surface temperatures of the ocean. This can lead to the bleaching of coral reefs as well as the death of coral reef fishes due to their inability to acclimate to the elevated temperature. These three papers were chosen, because they illustrate the environmental impact higher temperatures have on these coral reefs and the organisms that live within them.
· Dias, M., Ferreira, A., Gouveia, R., Cereja, R., & Vinagre, C. (2018). Mortality, growth and regeneration following fragmentation of reef-forming corals under thermal stress. Journal of Sea Research, 141, 71-82. doi: 10.1016/j.seares.2018.08.008.
· De'ath, G., Lough, J., & Fabricius, K. (2009). Declining Coral Calcification on the Great Barrier Reef. Science, 323(5910), 116-119. doi: 10.1126/science.1165283.
· Nilsson, G., Östlund-Nilsson, S., & Munday, P. (2010). Effects of elevated temperature on coral reef fishes: Loss of hypoxia tolerance and inability to acclimate. Comparative Biochemistry and Physiology Part A: Molecular & Integrative Physiology, 156(4), 389-393. doi: 10.1016/j.cbpa.2010.03.009.
Dias (2018) evaluated how elevated surface temperatures of the ocean affected growth, mortality, and regeneration following the fragmentation of nine coral species in the Indo-Pacific, while De'ath (2009) suggested that the ability of coral in the Great Barrier Reef may have depleted due to a decrease in the saturation state of aragonite and rising temperature stress in this region. The third paper evaluated, Nilsson (2010), examined whether or not an elevated temperature decreased tolerance levels for low-oxygen regions in two species of coral reef fishes. This experiment used adults fishes of two species and tested their ability to acclimate to changes in higher temperatures, which differed from the other two studies in that Dias and De’Ath did not study the fishes in the ecosystems, only the coral there. Dias found that whether or not a coral had previous injury did not impact the mortality, partial mortality, or rate of growth of each fragment. However, the species of coral and the ocean temperature had significant impacts on the results for each fragment. Although the cause for coral calcification of Great Barrier Reef corals was not determined by the De'ath’s study, he did find that it was largely related to increasing temperatures of oceans, which caused more thermal stress in coral populations. This differed from the Nilsson paper, which showed that certain species of coral reef fishes were unable to adjust to higher ocean temperatures, a phenomenon that has occurred due to gl ...
How we know what we know about climate changeLisa Gardiner
Presentation for science educators at the National Science Teachers Association conference in Denver, CO 2013 about how climate scientists use data from paleoclimate proxies, current observations of the Earth system, and models of future climates to gain an understanding of Earth's climate.
Adsorption behaviour of dextrin onto activated oyster shelleSAT Journals
Abstract
The effect of initial dextrin concentration, contact time, pH, temperature and added calcium ion on the adsorption behaviour of dextrin onto oyster shell is investigated. The results obtained show that increase in concentration and temperature below the boiling point of dextrin enhances the adsorption process. It was found in this study that adsorption density varies with pH and is maximum within the range of 2 to 7. The plot of amount of dextrin adsorbed against the concentration of the adsorbate was hyperbolic which conforms to Legmir isotherm. The free energy of dextrin oyster shell adsorption system was found to be 13.23kg/mol and the specific area of the oyster shell for this work was 70.8m 2/g.
Keywords: Adsorption, dextrin, oyster shell, behaviour, crushing, drying
1. 1
Variation in Stomata on Macroneuropteris spp. and
Implications for Climatic Change
Prepared by
Asha P. Byrd
Submitted to
Dr. Isabel Montanez
Department of Geoscience, University of California, Davis
August 2013
INTRODUCTION
This paper examines climatic conditions in the Illinois Basin between 307.5 and
306.5 million years ago (Ma) revealed through the study of variation in the frequencies
and characteristics of stomata on the fossil tree fern species Macroneuropteris
scheuchzeri . The samples used were obtained from the Smithsonian, from William
DeMichael’s collection from the Illinois Basin. This pilot research project focused on six
of the seventeen samples. Each of these samples were preserved within coal beds in a 10-
meter cyclothem deposited during the Pennsylvanian period.
An icehouse occurred from 330 to 290 Ma, which was the primary time of the last
great icehouse, one of the biggest when multicellular life existed. Then, in the
Pennsylvanian period, the ice peaked subsequently followed by deglaciation. During that
small peak of ice, the tropical rainforests began to evolve, but the demise of rainforest
started as soon as the ice began to melt. These tropical rainforests went extinct and over
time became arid deserts with the exception of China and some part in the Middle East.
The primary objective of this research project is to document and identify how the
carbon dioxide (CO2) levels fluctuated during this time period. In order to do so, I looked
at the stomatal index (SI) variations within one specific species. My research is based on
the premise set forth by Woodward (1987:2) which states that changes in atmospheric
CO2 can be detected by changes in stomatal density, the number of stomata per unit area
of leaf and stomatal index, the percentage of leaf epidermal cells that are stomata from
the proven fact that stomatal density and stomatal index are inversely related to
atmospheric CO2level during leaf development. In other words, the stomatal densities
and indices are very sensitive to CO2 levels in the atmosphere, and an increase in
atmospheric CO2 should be reflected in decreased stomatal density and indices, and vice
versa.
Macroneuropteris scheuchzeri is a long-ranging taxt of wetland pteridosperms,
an extinct tree fern that was present in the Carboniferous period-Paleozoic Era. Four
samples were analyzed as part of this study and included samples from Cottage, Danville,
Baker, and Springfield sedimentary beds that were located in the Illinois Basin. All four
2. 2
sedimentary beds were dated to the Pennsylvanian epoch, which lasted from 323 to 299
Ma. Fossil samples extracted from these horizons included peels and fragments of
Macroneuropteris leaves.
BACKGROUND
Over the years, many studies have been conducted on climatic changes that have
focused on ancient macro fossils, specifically looking at stomatal change and variation in
leaves (Royer 2001). For example, McElwain’s (1998) research explored the possibility
of stomatal data providing useful information on how fossil plants respond to large-scale
fluctuations in atmospheric CO2. McElwain states that, “an inverse relationship between
stomatal density/index and atmospheric CO2 concentration has been documented for all
the studies to date concerning fossil and subfossil material” (McElwain 1998:5).
In addition, other related research has been conducted on this particular issue
with different plants McElwain investigated cuticle development in ancient leaves and
how features such as epidermal trichomes and papillae can be used to indicate specific
climate conditions. These xeromorphic characteristics in fossil plants have been used as
indicators of aridity in paleoenviromental models and paleobotanical research (e.g.
Seward 1892; Srinivasan 1995; Watson 1988; Watson and Alvin 1996, 1999). In addition
to stomatal variation, scholars have investigated how other aspects of ancient plants can
be used to model environmental changes in the past. Diefendrof et al. (2010) concluded
that fractionation of carbon isotopes by plants during CO2 uptake and fixation could help
to interpret climatic and ecological signals. Of importance is that the relationship between
stomata and atmospheric CO2 varies and is specific to plant species, habitat, altitude and
other environmental factors.
Particularly relevant to this study is the research of DeMichael et al. (2010)
highlighting the relationship between sedimentation and coal beds, and their role as
climate indicators. Through rigorous study of sedimentation patterns and rates DeMichael
et al. (2010) characterized the climate conditions in the Pennsylvanian period. Conditions
in this time period seem to be mostly humid with some semi-arid arid areas, specifically
when peat formation (when plant remains decay) occurs. DeMichael et al. (2010) argues
that the fluctuations in climate conditions, sea levels, and even vegetation were possibly
catalyzed by variations in glacial cycles. Furthermore, they provide strong evidence of
intervals in global warming in between major ice formation, which helps to prove the
linkage of sea level changes and fluxes in climate.
A plethora of research has been conducted in the past two decades focused on
responses of plants to climate change, and in particular the responses of specific plant
species to changes in atmospheric CO2 by variation on stomatal densities. In other words,
a change in stomatal densities within a particular plant species has been used to infer
information about changing paleo-CO2 levels. This research paper follows a similar path
3. 3
of inquiry in comparing and contrasting climate fluctuation as indicated by variation in
stomatal densities of particular ancient plants dating to the Pennsylvanian epoch (323 to
299 Ma) from a specific region.
DATA COLLECTION
The primary goal of the research was to define the variation in stomatal densities
within and between samples of fossil ferns in the late Pennsilvanian , and identify trends
which could provide insight into climate conditions. Six samples from the Illinois Basin
dating to the Pennsylvanian epoch were selected for the study. These six samples are
from five localities which range in age from 306.69 to 307.34 Ma, and the results can
provide insight into the general atmospheric conditions of this time frame by examining
the stomatal density using McElwain’s (1998) premise that there is an inverse
relationship between stomatal density and atmospheric CO2; in other words, an increase
in stomata suggests lower CO2 concentrations. To account for spatial and inter-species
variations of stomata among plants only one species at one locality were analyzed for this
study. Data collected directly from the fossil plant cuticles were individual counts of
stomata and epidermal cells in a determined/set mm area. To determine the number of
stomata per mm2
I had to account for the amount of epidermal cells since the number
and size of epidermal cells affect the size and number of stomata as well.
The five localities include Baker, Cottage, Danville, Springfield 82, and
Springfield 98 (Table 1). All samples were from the Illinois Basin in the state of Missouri
and were chosen for analysis based on their level of preservation.
The first step in the analysis involved separating the macrofossil leaves from the
rock samples. The samples, which were composed mostly of silica, were soaked in
Hydrofluoric (HF) acid to remove the mineral material. The resulting product comprised
of peels of ancient plant materials including leaves. Using polyester overlays, peels of
macrofossils were removed from the processed sample. These peels were then placed
onto glass slides for analysis (Figures 1 and 2).
Each slide was then viewed through the automated Leica Digital Camera System
(LDCS) to identify sections of specimens that have good preservation for stomatal
analysis. Once these specimen sections (areas on the peels and cuticles of leaves) were
identified, photographs were taken of each using Nikon Eclipse E600 POL using an
Epiflourecent light at a 450 wavelength and 20 magnification (Figure 3)
The next step in data collection involved counting the stomata and epidermal cells
on each of the specimen from each sample. Prior to data collection, the minimum number
of “area” boxes needed to have low variance in the average counts need to be determined.
Although it varied from specimen to specimen, on average five boxes with
4. 4
Table 1. Summary of samples used in study
Sample name Samples
Macroneurop
teris
scheuchzeri
Fragment Peel
Avg
Stomata
per box
Mean
SI
Age
Mean
SD
Baker 15 x x 9 13 306.71 225.22
Cottage Coal 15 x x 7 13 306.69 185.00
Danville 9 x x 10 12 306.69 250.39
Springfield 82 4 x x 10 13 307.34 237.50
Springfield 98 5 x x 7 13 307.34 167.00
Figure 1. Screen capture of polyester overlay (Macroneuropteris scheuchzeri, Baker
Coal)
5. 5
Figure 2. Screen capture of Cottage Coal Sample (Macroneuropteris scheuchzeri)
Figure 3. Screen Capture of Danville sample showing (Macroneuropteris scheuchzeri)
an average of two boxes per image were set as the standard. Five to 12 images were taken
for each peel (some fragment sizes and numbers resulted in less images). A box with an
area of no smaller than 0.04 mm2
was determined to be most effective to obtain an
unbiased count with minimum variance. The box dimensions were set to be 200 by
200µm or 130 by 307µm, but could be adjusted as long as the area remained 0.04mm2
.
In addition, a minimum of five boxes were required for each slide.
6. 6
Stomata and epidermal cells were counted and analysis/measurements were taken
within each 0.04mm box. (see Figure 4). Data recorded from the cuticle images on each
slide included the band height (the height between the two extreme costal regions), the
dimensions of the box from within which the data were counted, and the dimensions of
trichome bases and stomata using the Leica application suite- digital analysis software.
On average, one to two boxes and bands per image were drawn with an average of 10
boxes per leaf. This varied when the specimen were individual fragments because there
was no way to determine if separate fragments came from one leaf or several leaves.
Within each box, every stomata and epidermal cell was counted as long as it crossed the
box line, regardless of what percentage of it fell inside or outside the box.
After data collection was completed, it was exported to an excel spreadsheet. The
information obtained from the pictures and logged onto the box count sheet include box
count (number of boxes on a sample slide), location on specimen (location on slide),
preservation (qualitative), stomata count, epidermal count, box length, box height, box
area, band height, stomatal density, stomatal index, age, and running average for stomatal
density and index. The main algebraic formulas used in this analysis are presented in
(Table 2). This data was used to conduct relational analysis including graphs, running
average of stomatal index, running average of stomatal density, age versus stomatal
density, stomatal index, and mean stomatal density.
Stomatal Density (SD) and True Stomatal density per length (TSDL) differ in that the
bandwidth is accounted for in TSDL and in the calculation for True Stomatal index per
length (TSIL). “True stomatal density per length (TSDL) was determined using the
equation TSDL = SD x band width (in millimeters). The number of stomata per
millimeter of needle length (TSDL) can be approximated more accurately when the band
width is expressed in millimeters instead of number of rows” (Kouwenberg 2003).
Kouwenberg was working with conifers, in which stomata were arranged in rows, while
the fossils analyzed in this research were not in rows. Therefore, the calculations TSDL
and TSIL are not integral in this case since this study does not have a bandwidth to
incorporate into the analysis.
7. 7
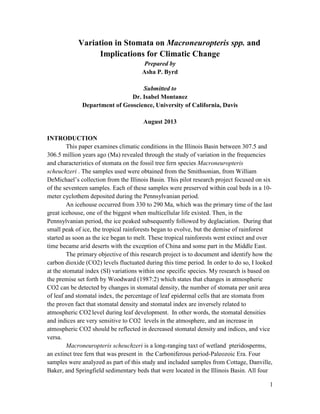
Figure 4. Relationship between running average and stomatal index
Table 2. Main algebraic formulas used in analysis
Relationship Formula
Stomatal Density (SD) SD/box area
Stomatal Index (SI) SI/ (SD+SI)*100
True Stomatal Density per millimeter of
needle length (TSDL)
SD/ (band height*1000)
True Stomatal Index Length (TSIL) SI/ (band height*1000)
Box Area width*height
RESULTS
The 9 samples from the five different groups included 15 specimens each from
Baker and Cottage Coal, 9 specimens from Danville, 4 specimens from Springfield 82
and 5 specimens from Springfield 92. In the following section, the main patterns
observed within each sample from each locality are discussed, and then the major trends
are identified.
6.0
6.5
7.0
7.5
8.0
8.5
9.0
9.5
10.0
10.5
11.0
11.5
12.0
12.5
13.0
13.5
14.0
14.5
15.0
15.5
16.0
16.5
17.0
1 6 11
SIRunningAverage
Box Counts
Baker
Danville
Cottage Coal
Springfield 82
Springfield 98
8. 8
Baker Samples
Most of the samples from Baker had poor preservation (Figure 5), and only
Sample 43518 (IL2007-03) yielded peels with good preservation (Table 3). The box sizes
on the 15 specimen with good preservation were maintained at 0.04 mm2
. The average
stomata per box were 9, with a range between 6 and 12 per box. The average epidermal
cells per box were 59, with a range of 52 and 69 cells per box (Figure 6). The summary
statistics for the Baker specimen are presented in Table 3. The standard deviations of
stomatal density, stomatal index, true stomatal density, and true stomatal index indicate
that there is only low to modest variation between specimens.
Cottage Coal Samples
In the 5 Cottage Coal samples, the average stomata count per box was 7, with a
range between 4 and 12 per box. The average epidermal cell count per box was 51.3, with
a range of 36 and 73 cells per box (Figure 7). The summary statistics for the Cottage Coal
specimen are presented in Table 4. The standard deviations of stomatal density, stomatal
index, true stomatal density, and true stomatal index indicate that there is modest
variation between specimens.
Figure 5. Screen capture of Baker Coal sample (Macroneuropteris scheuchzeri) showing
epidermal cells and stomata
9. 9
Figure 6. Relationship between running average and Stomatal Density
1
51
101
151
201
251
301
0 1 2 3 4 5 6 7 8 9 10 11 12 13 14 15
SDRunningAverage
Box Counts
Baker
Danville
Cottage Coal
Springfield 82
Springfield 98
14. 14
Danville Samples
Most of the samples from the Danville Coal locality had poor preservation, and
only Sample FN VII-49 yielded peels with good preservation. The sample yielded nine
specimens which had an average of 12 stomata per box, with a range between 8 and 13.
The average epidermal cells per box was 72.1, with a range between 56 and 81 stomata
per box. The summary statistics for the Danville Coal specimen are presented in Table 5.
The standard deviations of stomatal density, stomatal index, true stomatal density, and
true stomatal index indicate that there is low variation between specimens.
Springfield 82 Samples
Most of the Springfield 82 samples had poor preservation, and only Sample
FNVII-82 yielded peels with good preservation (Figure 8). The four specimens from the
single sample yielded an average count of 10 stomata per box, with a range between 6
and 12. As for epidermal cells, the average was 62.3 cells per box, and the range was
between 39 and 80 cells per box. The summary statistics for the Springfield 82 specimen
are presented in Table 6. The standard deviations of stomatal density, stomatal index, true
stomatal density, and true stomatal index indicate that there is low to modest variation
between specimens.
Figure 8. Screen capture of Springfield 82 (Macrofossil)
16. 16
Table 6. Data from Springfield 82 samples, Macrofossil Macroneuropteris scheuchzeri peels
Sample
Number
Specimen
Loc.
on
spec
#
Stomata
#
Epid.
Cells
SD SI TSDL TSIL
Along
Row
(mm)
Side
(mm)
Area
(mm2
)
Band
Height
(µm)
Age
SD
running
avg.
SI
running
avg.
FNVII-82 1A 1 6 39 150.0 13.33 32.05 0.18 0.31 0.13 0.04 213.65 307.34
FNVII-82 1B 1 9 60 225.0 13.04 41.61 0.17 0.31 0.13 0.04 184.93 307.34 112.5 13.19
FNVII-82 1B 2 11 80 275.0 12.09 62.47 0.15 0.18 0.22 0.04 227.17 307.34 193.75 12.57
FNVII-82 1B 3 12 70 300.0 14.63 91.49 0.21 0.20 0.20 0.04 304.96 307.34 246.875 13.36
Mean 237.50 13.27 56.90 0.18 232.68
St. Dev. 66.14 1.05 26.32 0.03 51.31
Coeff. Var. 0.28 0.08 0.46 0.16 0.22
2XSTDErr 20.92 0.33 8.32 0.01 16.22
SI Mean: 13.27 count: 4 2Std Err: 0.91 2.00
SD Mean: 237.50 count: 4 2Std Err: 57.28 2.00
17. 17
Springfield 98 Samples
Most of the Springfield 98 samples did not have good preservation, with the
exception of Sample FNVII-98 which yielded six specimens. The 6 specimens had an
average of 7 stomata per box (with a range between 4 and 9) and an average of 43
epidermal cells per box, with the range between 33 and 54. The summary statistics for the
Springfield 98 specimen are presented in Table 7. The standard deviations of stomatal
density, stomatal index, true stomatal density, and true stomatal index indicate that there
is low to modest variation between specimens.
COMPARISON
In comparing the data from within and between samples, the analysis discussed below
will primarily focus on variation in stomatal density (SD). Stomatal density (SD) is
inversely proportional to the CO2 concentration in the atmosphere, therefore, the higher
the number, the lower the concentration of CO2 there exists in the atmosphere. Stomatal
index represents the proportion of epidermal cells to stomata, therefore, the high the
index number, the more stomata there are.
Stomatal Density (SD) and True Stomatal density per length (TSDL) differ in that the
bandwidth is accounted for in TSDL and in the calculation for True Stomatal index per
length (TSIL). “True stomatal density per length (TSDL) was determined using the
equation TSDL = SD x band width (in millimeters). The number of stomata per
millimeter of needle length (TSDL) can be approximated more accurately when the band
width is expressed in millimeters instead of number of rows” (Kouwenberg 2003).
Kouwenberg was working with conifers, in which stomata were arranged in rows, while
the fossils analyzed in this research were not in rows. Therefore, the calculations TSDL
and TSIL are not integral in this case since this study does not have a bandwidth to
incorporate into the analysis.
Baker Coal comprised of 15 Macroneuropteris scheuchzeri samples, all which were
peels with an average of 9 stomata per box and a mean stomatal index (SI) of 13. Cottage
Coal was very similar to Baker in that there were 15 Macroneuropteris scheuchzeri
samples, though these were fragments instead of peels. The Cottage Coal samples have
an average of 7 stomata per box with a mean SI of 13. Danville had 9 Macroneuropteris
scheuchzeri peel samples with an average of 10 stomata per box, and a mean SI of 12.
Springfield 82 comprised of 4 Macroneuropteris scheuchzeri samples, of which all were
peels and had an average stomata count of 10 per box and a mean SI of 13. Lastly,
Springfield 98 accounted for 5 samples of Macroneuropteris scheuchzeri peels and had
an average of 7 stomata per box and a mean SI of 13.
19. 19
Specific trends in the data are noted when comparing running average and stomatal
Index (SI). Figure 4 illustrates the relationship between running average and SI and
shows a primarily stable correlation between the two. The trend shows that as the box
counts increase, stomatal index rises as well. Figure 5 shows the relationship between
running average and SI, and a similar pattern is discerned as box counts increase, most
stomatal densities increase as well. With regard to age versus SD (Figure 9), the stomatal
density clearly fluctuated through time. The Age versus SD relationship (Figure 9) shows
the similarly dated (306.69 to 306.71) Danville, Baker, and Cottage Coal samples cluster
between 200 to 275 SD. In other words, the stomatal density averages for majority of the
samples dating between 306.69 and 306.71 Ma are not very different. The standard error
indicates that the data is centered at 225 SD, and, does not waver in comparison to the
mean stomatal density.
The two Springfield sample sets (Springfield 82 and Springfield 98) show a
similar variability despite fewer samples. The Springfield sets dating to 307.34 Ma, show
a small clustering at 225 SD (see Figure 6). Interestingly, although the two Springfield
sample sets are older than the Danville, Baker, and Cottage Coal sample sets, their SD
falls within the same range. In other words, there is no notable difference between the
older and younger samples.
Figure 9. Relationship between age and stomatal density (includes fragments and peels)
It is noted that the stomatal density does not vary notably between fragments and
peels of Macroneuropteris scheuchzeri analyzed. For example, not many differences are
apparent when the fragment samples from Cottage Coal are compared to the peel samples
from Baker, Danville, and the two Springfield Coals. Cottage Coal samples meld in
306.0
306.5
307.0
307.5
308.0
0 50 100 150 200 250 300 350
Age
Stomatal Density
Danville
Baker
Mean
2StdRange
Cottage Coal
Springfield 82
Springfield 98
20. 20
seamlessly with the other samples in both average stomatal index and running average
stomatal density. This relationship is shown in Figures 4 & 6 which illustrates the lack of
difference between Cottage Coal, Baker, and Danville.
Despite these interesting patterns that were observed, it is important to note the
limitations of the data. First, these specific sample species have no living relatives and
therefore, the results cannot be compared and contrasted to similar species. Second, some
sample groups did not have good preservation and the stomata could not be quantified;
hence the fewer number of samples in Springfield 82 and Springfield 98. In other words,
the accuracy of the stomatal density and stomatal index could have been stronger if the
preservation in some samples groups was better. In addition, the sample sizes vary both
within and between the six samples, which makes the rigor of comparison lower.
IMPLICATIONS AND CONCLUSIONS
Overall, there is a small increase in the stomatal index over time and space. The
younger the sample, the greater the range of stomatal index (greater variation) as well as
the maximum value (Figure 10). Given that stomatal index and stomatal density
increased slightly over time, this indicates that the carbon dioxide concentration in the
atmosphere from 307.34 to 306.69 Ma was lower than previously modeled. However, for
Springfield 98, which is the sample group with the lowest mean stomatal density, the
carbon dioxide concentration was the highest among all the samples. This increase in
carbon dioxide among the Springfield 98 samples could have caused the leaves to have
more hairs and papillae, which would help to retain water, especially if there were too
many nutrients in the water, inhibiting water absorption.
Figure 10. Relationship between age and stomatal index
306.50
306.60
306.70
306.80
306.90
307.00
7 8 9 10 11 12 13 14 15 16 17 18 19 20
Age
SI
Danville
Baker
Series3
Cottage Coal
Springfield 82
Springfield 98
21. 21
There is considerable variation noted within the samples, indicating that there was
variation in carbon dioxide spatially (see Figure 4 and 5). For example, the variation in
stomatal index within the Baker samples ranges from 9 to 16. Greatest variation is within
Baker, Cottage Coal, and Springfield 98. In contrast, Danville and Springfield 82 have
lower variation. It is important to note when considering these patterns, that the sample
sizes are small, and additional data from these contexts may alter these patterns.
In summary, this research was aimed to document and identify how the carbon
dioxide (CO2) levels fluctuated between 306.69 and 307.34 Ma. In order to do so, we
looked at the stomatal index (SI) and stomatal density (SD) and analyzed how they varied
between samples within an area. This research is based on the premise that ancient fossil
leaves alter their morphology in reaction to climate conditions.
This pilot study provides insight into whether a similar global warming event
observed today may have occurred in the past, around 370 million years ago (Ma). Based
on the analysis, the highest CO2 levels occurred in Springfield 98, which dated to 307.34
Ma. These higher CO2 levels from one set of samples do not necessarily indicate a global
warming incident. The data indicates that the CO2 concentration in the atmosphere
generally decreased slightly between 307.34 Ma and 306.69 Ma.
Based on the limited samples analyzed in this pilot study, the data indicates that
there was no notable global warming incident. On a final note, the findings of this small
study can be tested when additional data from strong contrasting samples are analyzed.
22. 22
ACKNOWLEDGEMENTS
This research and my internship would not have been possible without the mentorship
and support of Dr. Isabel Montanez. I am deeply grateful to Dr. Montanez for providing
me an opportunity to intern in her lab as a high school student, having the confidence in
me to conduct the research, and directing me on the project. It has been a most valuable
education which has provided me a rare insight into research. Dominique Garello, lab
assistant to Dr. Montanez, worked with me closely on this project and provided valuable
guidance and input. Lastly, many thanks to Dr. William DeMichael for the study samples
which provided the primary data in this project.
LIST OF FIGURES
Figure 1. Screen capture of polyester overlay (Baker Coal)
Figure 2. Picture of Cottage Coal Sample
Figure 3. Screen Capture of Danville sample showing Macroneuropteris scheuchzeri
Figure 4. Relationship between running average and stomatal index
Figure 5. Screen capture of Baker Coal sample (Macroneuropteris scheuchzeri)
Figure 6. Relationship between running average and stomatal density
Figure 7. Screen capture of Cottage Coal sample (Macroneuropteris scheuchzeri)
Figure 8. Screen capture of Springfield 82 (Macrofossil)
Figure 9. Relationship between running average and stomatal density
Figure 10. Relationship between age and stomatal index
LIST OF TABLES
Table 1. Summary of samples used in study
Table 2. Main algebraic formulas used in analysis
Table 3. Data from Baker Coal samples, Macroneuropteris scheuchzeri peels
Table 4. Data from Cottage Coal samples, Macroneuropteris scheuchzeri fragments
Table 5. Data from Danville Coal samples, Macroneuropteris scheuchzeri peels
Table 6. Data from Springfield 82 samples, Macroneuropteris scheuchzeri peels
Table 7. Data from Springfield 98 samples, Macroneuropteris scheuchzeri peels
23. 23
REFERENCES
Barclay, R, McElwain, J, and Sageman, B, 2010, Carbon sequestration activated by a
volcanic CO2 pulse during Ocean Anoxic Event 2, Nature Geoscience, VOL. 3, 205-208
DeMichael, W, Cecil, C, Montanez, I, and Falcon-Lang, H, 2010, Cyclic changes in
Pennsylvanian paleoclimate and effects on floristic dynamics in tropical Pangaea,
International Journal of Coal Geology, VOL. 83, 329-344
Diefendorf, A, Mueller, K, Wing, S, Koch, P, and Freeman, K, 2010, Global patterns in
leaf 13
C discrimination and implications for studies of past and future climate, PNAS,
VOL. 107, NO. 13, 5738-5743
Haworth, M, and McElwain, J, 2008, Hot, dry, wet, cold or toxic/ Revisiting the
ecological significance of leaf and cuticular micromorphology, Palaeogeography,
Palaeoclimatology, Palaeoecology, VOL. 262, 79-90
McElwain, J.C, Wagner, F, Kurschner, W.M., and van Bergen, P.F., 1998, Do fossil
plants signal palaeoatmospheric CO2 concentration in the geological past?, Phil. Trans.
R. Soc. Lond. B, VOL. 353, No. 1365, 83-96
Royer, D., 2001, Stomatal density and stomatal index an indicators of paleoatmospheric
CO2 concentration, Review of Paleobotany and Palynology 114: 1-28.
Woodward, F.I., 1987, Stomatal numbers are sensitive to increases in CO2 from pre-
industrial levels, Nature, VOL. 327, 617-618