Download as PDF, PPTX


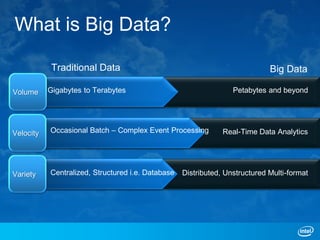
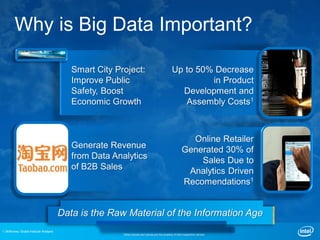
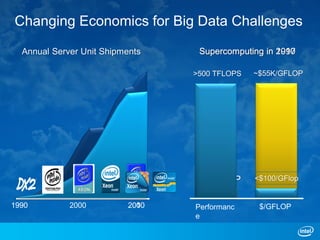


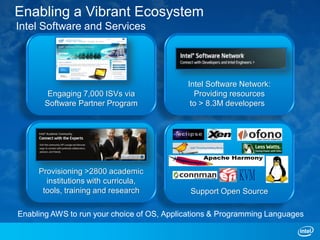
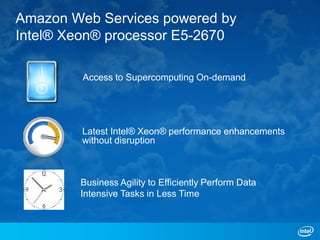
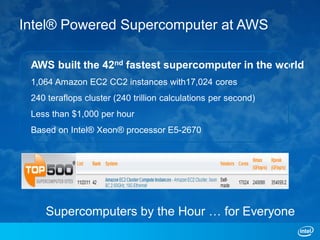
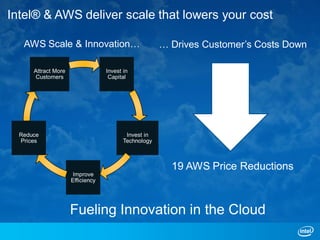

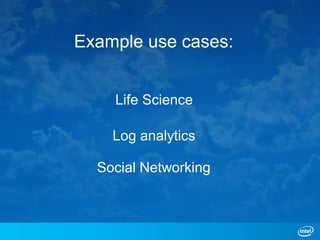
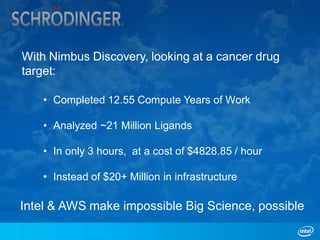
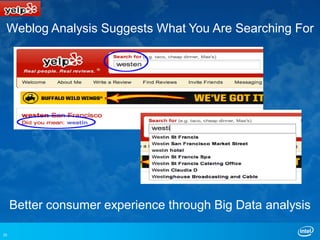
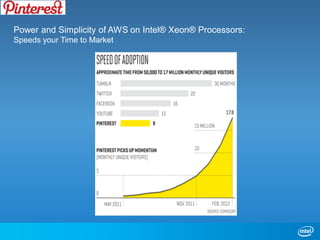

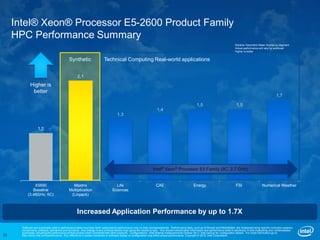


The document discusses big data and how Intel technologies can help address challenges with big data. It defines big data in terms of volume, velocity, and variety of data. It then discusses how Intel Xeon processors provide benefits like improved performance, reduced costs, and support for large-scale analytics. Customer case studies show how Intel and AWS enable big data use cases in areas like life sciences, log analytics, and social networking.