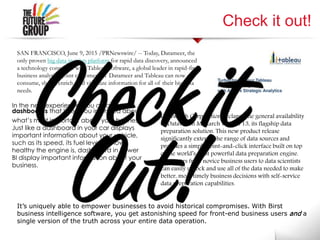
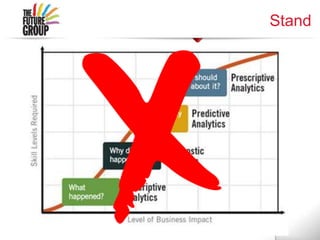
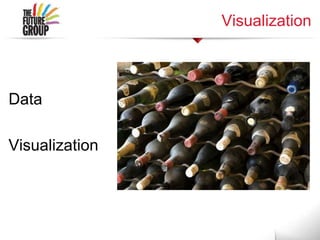
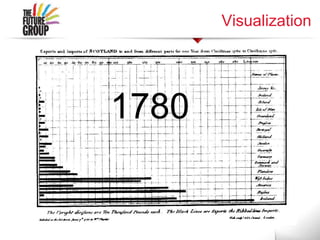
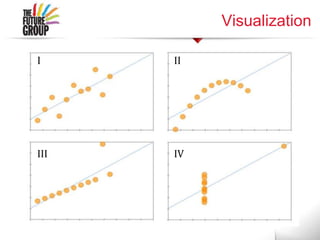
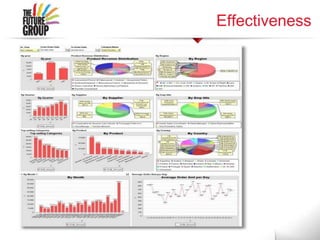
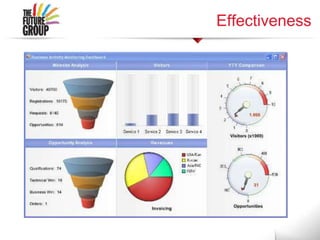
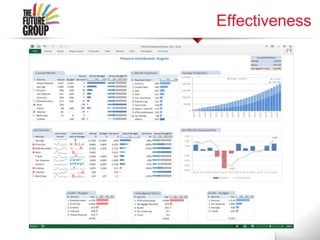
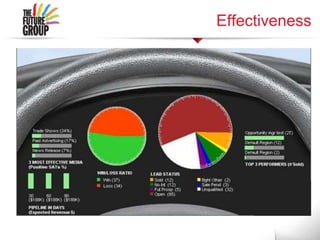
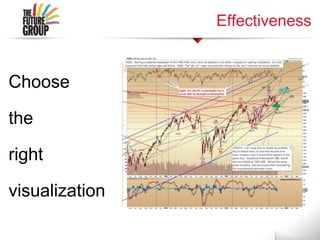
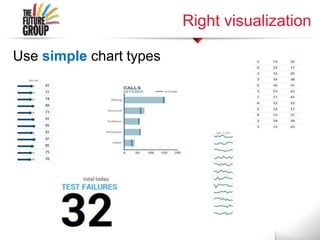
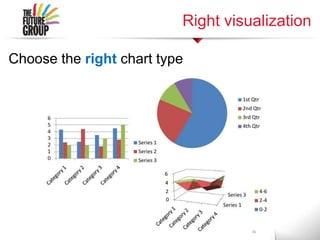
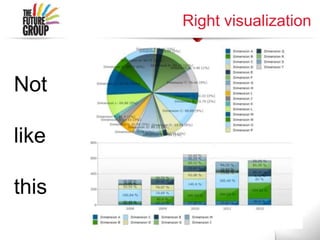
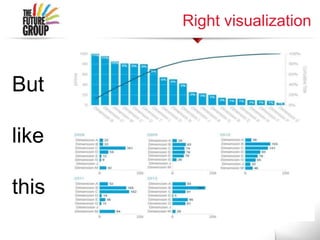
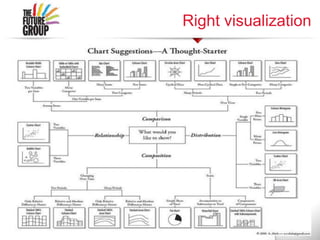
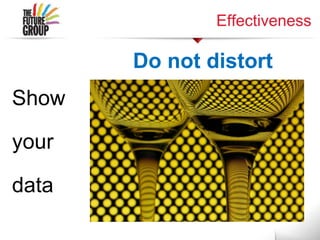
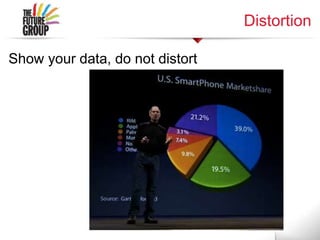
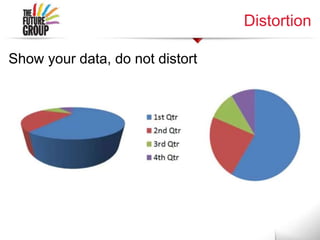
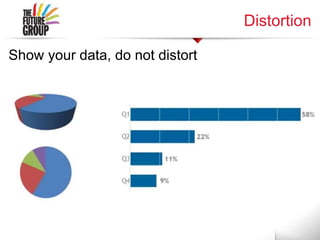
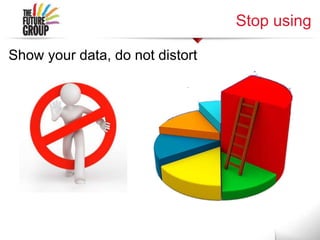
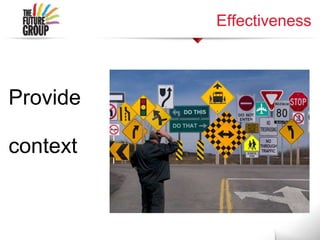
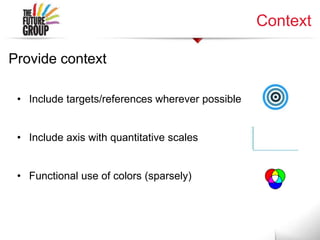
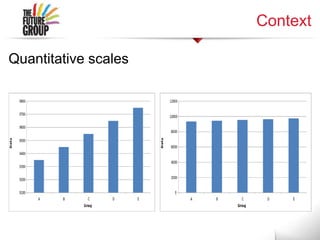
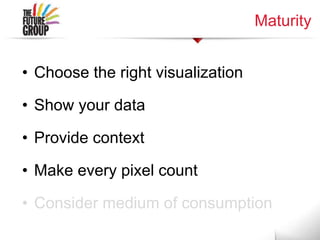
1) The document discusses business intelligence and data visualization. It covers topics like choosing the right visualization type, showing data clearly without distortion, providing proper context, making efficient use of screen space, and considering the consumption medium.
2) A news article announces that Datameer and Tableau now have a technology connector, allowing joint customers to consume, shape, enrich, and visualize big data.
3) Datawatch Corporation declares the general availability of its flagship data preparation solution Datawatch Monarch version 13, which provides self-service data preparation capabilities.
InterSystems Caché a leader in Gartner MQ on Operational DBMSRobert Bira
According to Gartner, the operational database management system (DBMS) market is defined by relational and non-relational database management products that are suitable for a broad range of enterprise-level transactional applications, including purchased business applications such as enterprise resource planning, customer relationship management and customized transactional systems. The operational DBMS market is evolving dramatically, with new entrants and incumbents supporting the growing use of unstructured data and NoSQL DBMS engines.
if you want to see the full report : http://www.gartner.com/technology/reprints.do?id=1-23A415Q&ct=141020&st=sb,
Data Science Resources for Project and Product ManagersBrian Lynch
Presentation slides for the Charlottetown Product & Project Managers and Business Analyst Group by Darcy Norman. Provides a range of recommended data science resources for managers.
OpenSymmetry - Business Intelligence MaturityOpenSymmetry
OpenSymmetry Breakout Session during the Callidus Customer Connections Conference in Las Vegas - May 2013. Presenter: Trevor Dunham, Director of Business Intelligence with OpenSymmetry
A global overview of the new Oracle business intelligence suite 11g by Oracle.
As the word's first specialized partner for the BI Foundation we would to share these slides with you.
Big Data Refinery: Distilling Value for User-Driven AnalyticsInside Analysis
The Briefing Room with John Myers and Pentaho
Live Webcast April 28, 2015
Watch the archive: https://bloorgroup.webex.com/bloorgroup/lsr.php?RCID=8cb3ef0a35b948ec374f330cb5de752a
A well-oiled enterprise depends upon the quality of its data. From business intelligence to data science, users require clean, governed data sets to blend, enrich and explore, without worrying about changes in data flows or models. The shortest path to insight involves providing users with direct access to the data preparation process and the ability to blend data from highly diverse sources – but what are the risks?
Register for this episode of The Briefing Room to hear veteran Analyst John Myers as he outlines best practices for the self-service, intelligent enterprise. He’ll be briefed by Chuck Yarbrough of Pentaho, who will tout his company’s Big Data Integration and Analytics Platform and discuss Big Data Blueprints, the Streamlined Data Refinery, a virtual on-demand data mart generator that gives users access to the data they need. He will also explain how well-governed data orchestration, along with pragmatic design patterns, can create an agile analytics environment for information workers across the board.
Visit InsideAnalysis.com for more information.
Shift AI 2020: Building AI-first Products - Ehsan Yousefzadeh (AIG Investments)Shift Conference
Shift AI was a success, connecting hundreds of professionals that were eager to propel the progress of AI and discuss the newest technologies in data mining, machine learning and neural networks. More at https://ai.shiftconf.co/.
Talk description:
With rapid advancements in AI research, new breakthroughs lead to new product opportunities. In this presentation, I will discuss the AI product development process, along with the challenges and rewards that come with it. I’ll also discuss the various degrees of AI products, the teams needed to build them, and what it takes to be a great AI-first product manager.
How Data Annotation is Changing the Future of Businesses?Data Labeler
Almost all companies today annotate their data to fuel their machine learning projects. From bounding boxes to semantic segmentation data annotation aids multiple industries and sectors to overcome their everyday operational challenges effortlessly. Read more - https://bit.ly/3chHTlw
Shift AI 2020: Business benefits of privacy-preserving synthetic data | Sebas...Shift Conference
Shift AI was a success, connecting hundreds of professionals that were eager to propel the progress of AI and discuss the newest technologies in data mining, machine learning and neural networks. More at https://ai.shiftconf.co/.
Talk description:
Privacy defines a state in which one is free from public attention and not observed or disturbed by others. Taken in the context of data, privacy is therefore a state in which an individual’s data is used only with their specific consent, and where any person or organization party to that individual’s data guarantee to prevent unauthorized disclosures or misuse of that information.
Therefore, in order to protect the individual's privacy, strict regulations have already been introduced in many regions and countries worldwide, such as CCPA in California or GDPR in the EU and we can expect many more to come. This puts businesses in a position in which they need to find a solution in order to leverage data while preserving privacy. We will address this topic and answer how businesses can benefit from synthetic data and unlock the value of data.
Discover and visualize your critical data and produce actionable facts for better decision making in a fraction of the time. Power BI is a cloud-based business analytics service that gives you a single view of your most critical business data. Monitor the health of your projects using a live dashboard, create rich interactive reports with Power BI Desktop and access your data on the go with native Power BI Mobile apps.
Two fundamental technologies to enter into mainstream information technology are Big Data and cloud computing. Although these two are not the same; as Big Data represents content, whereas cloud computing is infrastructure, the combination of both technologies can yield excellent results. Cloud computing provides enterprises with a cost-effective & flexible way to access a vast volume of information we call the Big Data. Because of Big Data and cloud computing, it is now much easier to start an IT company than ever before. https://vexxhost.com/blog/big-data-cloud-computing/
Get High Quality Data Annotation ServicesAndrew Leo
Collecting the raw data and processing it is not enough. This data must be structured to be fed into Machine Learning algorithms. because otherwise, it is just noise for a supervised model. Hence, this leads to the need for annotation in Machine Learning.
FOR FURTHER DETAILS: https://www.damcogroup.com/data-support-for-ai-ml
#DATAANNOTATIONSERVICES
#ANNOTATIONINMACHINELEARNING
#DAMCOSOLUTIONS
Global Data Annotation Tools Market Size & Analysis - Forecasts To 2026SandeepVishwakarma82
Global Data Annotation Tools Market Size & Analysis By Type (Text, Image), By Annotation Type (Manual, Semi-supervised, Automatic), By Vertical (IT, Automotive, Government, Healthcare, Financial Services, Retail), End-Use Landscape; Vendor Landscape, Company Market Share Anaylsis and Competitor Landscape - Forecasts to 2026
Request a sample copy of the report @: https://www.globalmarketestimates.com/report-summary.php?report_id=1963&report_name=global-data-annotation-tools-market
Business intelligence tools to handle big dataIshucs
Business intelligence (BI) is a technology-driven process for analyzing data and delivering actionable information that helps executives, managers and workers make informed business decisions.
Next-Gen Cloud Analytics with AWS, Big Data and Data VirtualizationDenodo
Watch Tekin's keynote presentation from Fast Data Strategy Virtual Summit here: https://goo.gl/RJon7n
The Denodo Platform for AWS enabled Logitech's cloud journey with minimal impact on business operations. The Denodo Platform acts a big data fabric layer and sources data for all of Logitech's analytics initiatives from descriptive to prescriptive to predictive analytics including NLP processing engines.
Attend this session to learn how Logitech:
• Reduced TCO such as infrastructure and operational expenses
• Empowered their business users with advanced analytics capabilities
• Uses AWS and Denodo as their innovation engine
The QlikView software offers excellent business intelligence gathering opportunities. With its new end-user driven it has proved to be beneficial for business ventures. Different applications and systems can be easily correlated with each other. Data can be shared very easily between concerned people related to an organization. In this presentation, we have discussed Qlikview software and some of its useful features.
What is the Best Data Visualization Tool: Power BI or Tableau?Digital Dialogue
Business Intelligence (BI) is a vital field of computer science that involves a range of processes and technologies aimed at gathering, storing, analyzing, and providing access to data to enhance business decision-making. Read more here!
8 Steps to BI Success - Choosing The Ideal Business Intelligence SolutionChristian Ofori-Boateng
No pressure - but the BI solution you invest in today has far-reaching implications for your organization's success tomorrow.
- With dozens of Business Intelligence solutions available, what are the 'must-haves' in BI tools?
- What features will bring you the quickest time to value plus meet the flexibility and budgetary needs for your organization?
- How will this satisfy your Business Intelligence needs?
- Where does this fit into your Business Intelligence Strategy and Roadmap?
Strap on those crampons as we scale those eight essential steps to take in making your big decision - let's get your company equipped for the future, and performing at its peak!
BI is all about making dry figures accessible & useful to the right audience within an Enterprise
Euthenics IT Services Pvt. Ltd.
306-B, Super Plaza, Sandesh Press Road, Bodakdev, Ahmedabad-380 054, Gujarat, INDIA
Tel: +91 (79) 26769094 & 40036094
Web: www.euthenicsit.com/ www.factisbi.com
Visionet Business Intelligence Solutions - Is your Business Intelligence real...Visionet Systems, Inc.
Visionet Systems has been helping companies mitigate risk and prepare to make the most of their corporate data. From enterprise data management assessment to establishing rigorous data standards, our domain and technology expertise has assisted companies in defining their corporate data strategies and getting the very most out of their BI and reporting assets.
The Present - the History of Business IntelligencePhocas Software
Learn the history of business intelligence in this three part series. In part one, we discussed how business intelligence software used to be (the past). In part two, we discuss business intelligence as it is in the present.
Modern Business Intelligence - Design and ImplementationsDavid J Rosenthal
During the first two “waves” of business intelligence, IT professionals and business analysts were the keepers of BI. They made BI accessible and consumable for end users.
While this approach still applies to complex business intelligence needs, today there is a new “wave.” This third wave of BI makes BI available to every kind of user.
As customer strive to take advantage of the digital transformation that is occurring in virtually every industry, they need to re-evaluate how they engage with their customers/prospects, how they transform their products and operations, and how they empower and understand their employees.
In today’s world, doing each of these things is more and more reliant upon data…traditionally, everything you knew about your customers and prospects was available in your business application systems and in the heads of employees. You learned almost everything about your products BEFORE they left your warehouse. Employees used technology more to enter data than to learn from it.
In the data-driven world we live in today, leveraging intelligent insights from data across customers, products, and employees is critical to be able to stay competitive and keep up with or lead digital transformation in any industry. And this isn’t just a customer’s typical business application data – it’s also about augmenting the customer’s data with additional data (e.g. search, employee behavioral data, sentiment data, benchmark data, etc..) – and applying the right intelligence to drive meaningful insights.
Top 20 Best Business Intelligence Tools | CIO Women MagazineCIOWomenMagazine
Here are the top 20 Business Intelligence Tools: 1. Micro Strategic Planning, 2. IBM Cognos Analytics (in a nutshell), 3. Tableau, 4. Oracle Business Intelligence Tools, 5. Board, etc.
Smarter Analytics: Supporting the Enterprise with AutomationInside Analysis
The Briefing Room with Barry Devlin and WhereScape
Live Webcast on June 10, 2014
Watch the archive:
https://bloorgroup.webex.com/bloorgroup/lsr.php?RCID=5230c31ab287778c73b56002bc2c51a
The data warehouse is intended to support analysis by making the right data available to the right people in a timely fashion. But conditions change all the time, and when data doesn’t keep up with the business, analysts quickly turn to workarounds. This leads to ungoverned and largely un-managed side projects, which trade short-term wins for long-term trouble. One way to keep everyone happy is by creating an integrated environment that pulls data from all sources, and is capable of automating both the model development and delivery of analyst-ready data.
Register for this episode of The Briefing Room to hear data warehousing pioneer and Analyst Barry Devlin as he explains the critical components of a successful data warehouse environment, and how traditional approaches must be augmented to keep up with the times. He’ll be briefed by WhereScape CEO Michael Whitehead, who will showcase his company’s data warehousing automation solutions. He’ll discuss how a fast, well-managed and automated infrastructure is the key to empowering faster, smarter, repeatable decision making.
Visit InsideAnlaysis.com for more information.
How Does Business Intelligence Help Companies Today?Flexsin
We are a business intelligence and analytics application development company with in-depth expertise in helping businesses unlock the power of their data. Contact us to know more.
https://www.flexsin.com/bi-analytics.php
Visual Analytics combines human intuition and data science to derive knowledge from the data in a very efficient, effective and easy way. Visual Analytics empowers your people to interact with the data and generate new insights.
1KEY Business Intelligence Reporting Software.
More user friendly and intuitive menus.
Reduction in analysis time for business users.
Provides freedom to end users for generating customized reports.
Improved accuracy and efficiency in decision-making.
More proactive understanding of business data.
Lets end users access and interact with reports without extra IT overhead.
Easy-to-use with minimum IT involvement
Similar to Bi infodag 20151009 rien matthijsse (20)
UiPath Test Automation using UiPath Test Suite series, part 4DianaGray10
Welcome to UiPath Test Automation using UiPath Test Suite series part 4. In this session, we will cover Test Manager overview along with SAP heatmap.
The UiPath Test Manager overview with SAP heatmap webinar offers a concise yet comprehensive exploration of the role of a Test Manager within SAP environments, coupled with the utilization of heatmaps for effective testing strategies.
Participants will gain insights into the responsibilities, challenges, and best practices associated with test management in SAP projects. Additionally, the webinar delves into the significance of heatmaps as a visual aid for identifying testing priorities, areas of risk, and resource allocation within SAP landscapes. Through this session, attendees can expect to enhance their understanding of test management principles while learning practical approaches to optimize testing processes in SAP environments using heatmap visualization techniques
What will you get from this session?
1. Insights into SAP testing best practices
2. Heatmap utilization for testing
3. Optimization of testing processes
4. Demo
Topics covered:
Execution from the test manager
Orchestrator execution result
Defect reporting
SAP heatmap example with demo
Speaker:
Deepak Rai, Automation Practice Lead, Boundaryless Group and UiPath MVP
The Art of the Pitch: WordPress Relationships and SalesLaura Byrne
Clients don’t know what they don’t know. What web solutions are right for them? How does WordPress come into the picture? How do you make sure you understand scope and timeline? What do you do if sometime changes?
All these questions and more will be explored as we talk about matching clients’ needs with what your agency offers without pulling teeth or pulling your hair out. Practical tips, and strategies for successful relationship building that leads to closing the deal.
Securing your Kubernetes cluster_ a step-by-step guide to success !KatiaHIMEUR1
Today, after several years of existence, an extremely active community and an ultra-dynamic ecosystem, Kubernetes has established itself as the de facto standard in container orchestration. Thanks to a wide range of managed services, it has never been so easy to set up a ready-to-use Kubernetes cluster.
However, this ease of use means that the subject of security in Kubernetes is often left for later, or even neglected. This exposes companies to significant risks.
In this talk, I'll show you step-by-step how to secure your Kubernetes cluster for greater peace of mind and reliability.
JMeter webinar - integration with InfluxDB and GrafanaRTTS
Watch this recorded webinar about real-time monitoring of application performance. See how to integrate Apache JMeter, the open-source leader in performance testing, with InfluxDB, the open-source time-series database, and Grafana, the open-source analytics and visualization application.
In this webinar, we will review the benefits of leveraging InfluxDB and Grafana when executing load tests and demonstrate how these tools are used to visualize performance metrics.
Length: 30 minutes
Session Overview
-------------------------------------------
During this webinar, we will cover the following topics while demonstrating the integrations of JMeter, InfluxDB and Grafana:
- What out-of-the-box solutions are available for real-time monitoring JMeter tests?
- What are the benefits of integrating InfluxDB and Grafana into the load testing stack?
- Which features are provided by Grafana?
- Demonstration of InfluxDB and Grafana using a practice web application
To view the webinar recording, go to:
https://www.rttsweb.com/jmeter-integration-webinar
Connector Corner: Automate dynamic content and events by pushing a buttonDianaGray10
Here is something new! In our next Connector Corner webinar, we will demonstrate how you can use a single workflow to:
Create a campaign using Mailchimp with merge tags/fields
Send an interactive Slack channel message (using buttons)
Have the message received by managers and peers along with a test email for review
But there’s more:
In a second workflow supporting the same use case, you’ll see:
Your campaign sent to target colleagues for approval
If the “Approve” button is clicked, a Jira/Zendesk ticket is created for the marketing design team
But—if the “Reject” button is pushed, colleagues will be alerted via Slack message
Join us to learn more about this new, human-in-the-loop capability, brought to you by Integration Service connectors.
And...
Speakers:
Akshay Agnihotri, Product Manager
Charlie Greenberg, Host
Smart TV Buyer Insights Survey 2024 by 91mobiles.pdf91mobiles
91mobiles recently conducted a Smart TV Buyer Insights Survey in which we asked over 3,000 respondents about the TV they own, aspects they look at on a new TV, and their TV buying preferences.
Transcript: Selling digital books in 2024: Insights from industry leaders - T...BookNet Canada
The publishing industry has been selling digital audiobooks and ebooks for over a decade and has found its groove. What’s changed? What has stayed the same? Where do we go from here? Join a group of leading sales peers from across the industry for a conversation about the lessons learned since the popularization of digital books, best practices, digital book supply chain management, and more.
Link to video recording: https://bnctechforum.ca/sessions/selling-digital-books-in-2024-insights-from-industry-leaders/
Presented by BookNet Canada on May 28, 2024, with support from the Department of Canadian Heritage.
DevOps and Testing slides at DASA ConnectKari Kakkonen
My and Rik Marselis slides at 30.5.2024 DASA Connect conference. We discuss about what is testing, then what is agile testing and finally what is Testing in DevOps. Finally we had lovely workshop with the participants trying to find out different ways to think about quality and testing in different parts of the DevOps infinity loop.
Slack (or Teams) Automation for Bonterra Impact Management (fka Social Soluti...Jeffrey Haguewood
Sidekick Solutions uses Bonterra Impact Management (fka Social Solutions Apricot) and automation solutions to integrate data for business workflows.
We believe integration and automation are essential to user experience and the promise of efficient work through technology. Automation is the critical ingredient to realizing that full vision. We develop integration products and services for Bonterra Case Management software to support the deployment of automations for a variety of use cases.
This video focuses on the notifications, alerts, and approval requests using Slack for Bonterra Impact Management. The solutions covered in this webinar can also be deployed for Microsoft Teams.
Interested in deploying notification automations for Bonterra Impact Management? Contact us at sales@sidekicksolutionsllc.com to discuss next steps.
LF Energy Webinar: Electrical Grid Modelling and Simulation Through PowSyBl -...DanBrown980551
Do you want to learn how to model and simulate an electrical network from scratch in under an hour?
Then welcome to this PowSyBl workshop, hosted by Rte, the French Transmission System Operator (TSO)!
During the webinar, you will discover the PowSyBl ecosystem as well as handle and study an electrical network through an interactive Python notebook.
PowSyBl is an open source project hosted by LF Energy, which offers a comprehensive set of features for electrical grid modelling and simulation. Among other advanced features, PowSyBl provides:
- A fully editable and extendable library for grid component modelling;
- Visualization tools to display your network;
- Grid simulation tools, such as power flows, security analyses (with or without remedial actions) and sensitivity analyses;
The framework is mostly written in Java, with a Python binding so that Python developers can access PowSyBl functionalities as well.
What you will learn during the webinar:
- For beginners: discover PowSyBl's functionalities through a quick general presentation and the notebook, without needing any expert coding skills;
- For advanced developers: master the skills to efficiently apply PowSyBl functionalities to your real-world scenarios.
Encryption in Microsoft 365 - ExpertsLive Netherlands 2024Albert Hoitingh
In this session I delve into the encryption technology used in Microsoft 365 and Microsoft Purview. Including the concepts of Customer Key and Double Key Encryption.
Kubernetes & AI - Beauty and the Beast !?! @KCD Istanbul 2024Tobias Schneck
As AI technology is pushing into IT I was wondering myself, as an “infrastructure container kubernetes guy”, how get this fancy AI technology get managed from an infrastructure operational view? Is it possible to apply our lovely cloud native principals as well? What benefit’s both technologies could bring to each other?
Let me take this questions and provide you a short journey through existing deployment models and use cases for AI software. On practical examples, we discuss what cloud/on-premise strategy we may need for applying it to our own infrastructure to get it to work from an enterprise perspective. I want to give an overview about infrastructure requirements and technologies, what could be beneficial or limiting your AI use cases in an enterprise environment. An interactive Demo will give you some insides, what approaches I got already working for real.
6. Check it out!
SAN FRANCISCO, June 9, 2015 /PRNewswire/ -- Today, Datameer, the
only proven big data insights platform for rapid data discovery, announced
a technology connector with Tableau Software, a global leader in rapid-fire
business analytics. Joint customers of Datameer and Tableau can now
consume, shape, enrich, and visualize information for all of their big data
needs.
Datawatch Corporation declared the general availability
of Datawatch Monarch version 13, its flagship data
preparation solution. This new product release
significantly extends the range of data sources and
provides a simple point-and-click interface built on top
of the world’s most powerful data preparation engine.
Now users from novice business users to data scientists
can easily unlock and use all of the data needed to make
better, more timely business decisions with self-service
data preparation capabilities.
It’s uniquely able to empower businesses to avoid historical compromises. With Birst
business intelligence software, you get astonishing speed for front-end business users and a
single version of the truth across your entire data operation.
In the new experience, you create
dashboards that keep you informed about
what’s most important about your business.
Just like a dashboard in your car displays
important information about your vehicle,
such as its speed, its fuel level, or how
healthy the engine is, dashboard in Power
BI display important information about your
business.
45. Context
Provide context
• Include targets/references wherever possible
• Include axis with quantitative scales
• Functional use of colors (sparsely)
57. Data Ink
• Background removed
• Frames removed
• Colors, effects and gridlines removed
Make every pixel count
58. Data Ink
• Background removed
• Frames removed
• Colors, effects and gridlines removed
• Font weights reduced
Make every pixel count
59. Data Ink
• Background removed
• Frames removed
• Colors, effects and gridlines removed
• Font weights reduced
• Direct labels added
Make every pixel count