Download to read offline

![Globalcode – Open4education
GC - Log
GC G1
[GC pause (young) (to-space exhausted), 0.0406140
secs] 6229.691:
[Full GC 10G->5813M(12G), 15.7221680 secs]](https://image.slidesharecdn.com/insidethejvm-180721193043/85/Inside-the-JVM-Performance-Garbage-Collector-Tuning-in-JAVA-27-320.jpg)
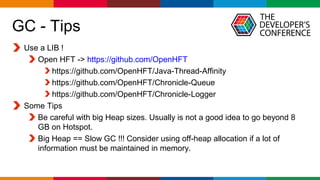

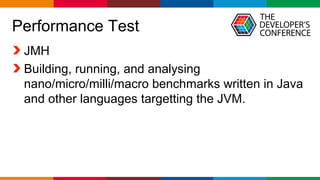
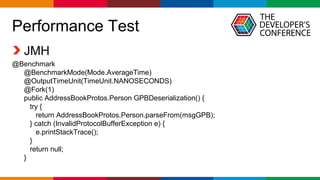
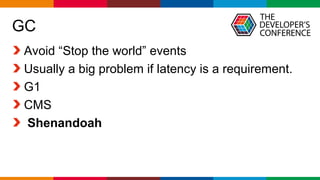
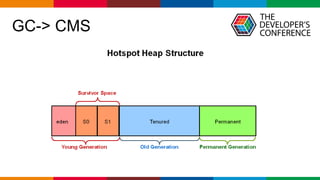
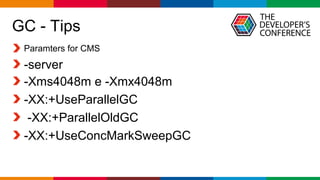
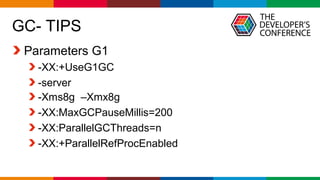
O documento apresenta uma visão geral sobre a otimização de desempenho e coleta de lixo na JVM (Java Virtual Machine), incluindo ferramentas como Java Mission Control e métodos de análise de desempenho. São discutidos parâmetros para diferentes técnicas de coleta de lixo, como G1, CMS e Shenandoah, bem como práticas recomendadas para evitar eventos de 'stop the world'. Além disso, o texto aborda alocação off-heap e fornece links para recursos adicionais e referências.


![TDC2018SP | Trilha Java - Computacao [Concorrente | Paralela | Distribuida] e...](https://cdn.slidesharecdn.com/ss_thumbnails/tdc2018-trilhajava-180801192151-thumbnail.jpg?width=640&height=640&fit=bounds)


![New Java features: Simplified Design Patterns[LIT3826]](https://cdn.slidesharecdn.com/ss_thumbnails/20221019javaonenewjavafeaturessimplifieddesignpatterns-221107195902-a2959a11-thumbnail.jpg?width=640&height=640&fit=bounds)

![Java Concurrency, A(nother) Peek Under the Hood [Code One 2019]](https://cdn.slidesharecdn.com/ss_thumbnails/oco19jcaluth-191015114641-thumbnail.jpg?width=640&height=640&fit=bounds)


![20260201 [FOSDEM] gomodjail - library sandboxing for Go modules.pdf](https://cdn.slidesharecdn.com/ss_thumbnails/20260201fosdemgomodjail-librarysandboxingforgomodules-260201225659-76609ec4-thumbnail.jpg?width=640&height=640&fit=bounds)


