Downloaded 709 times


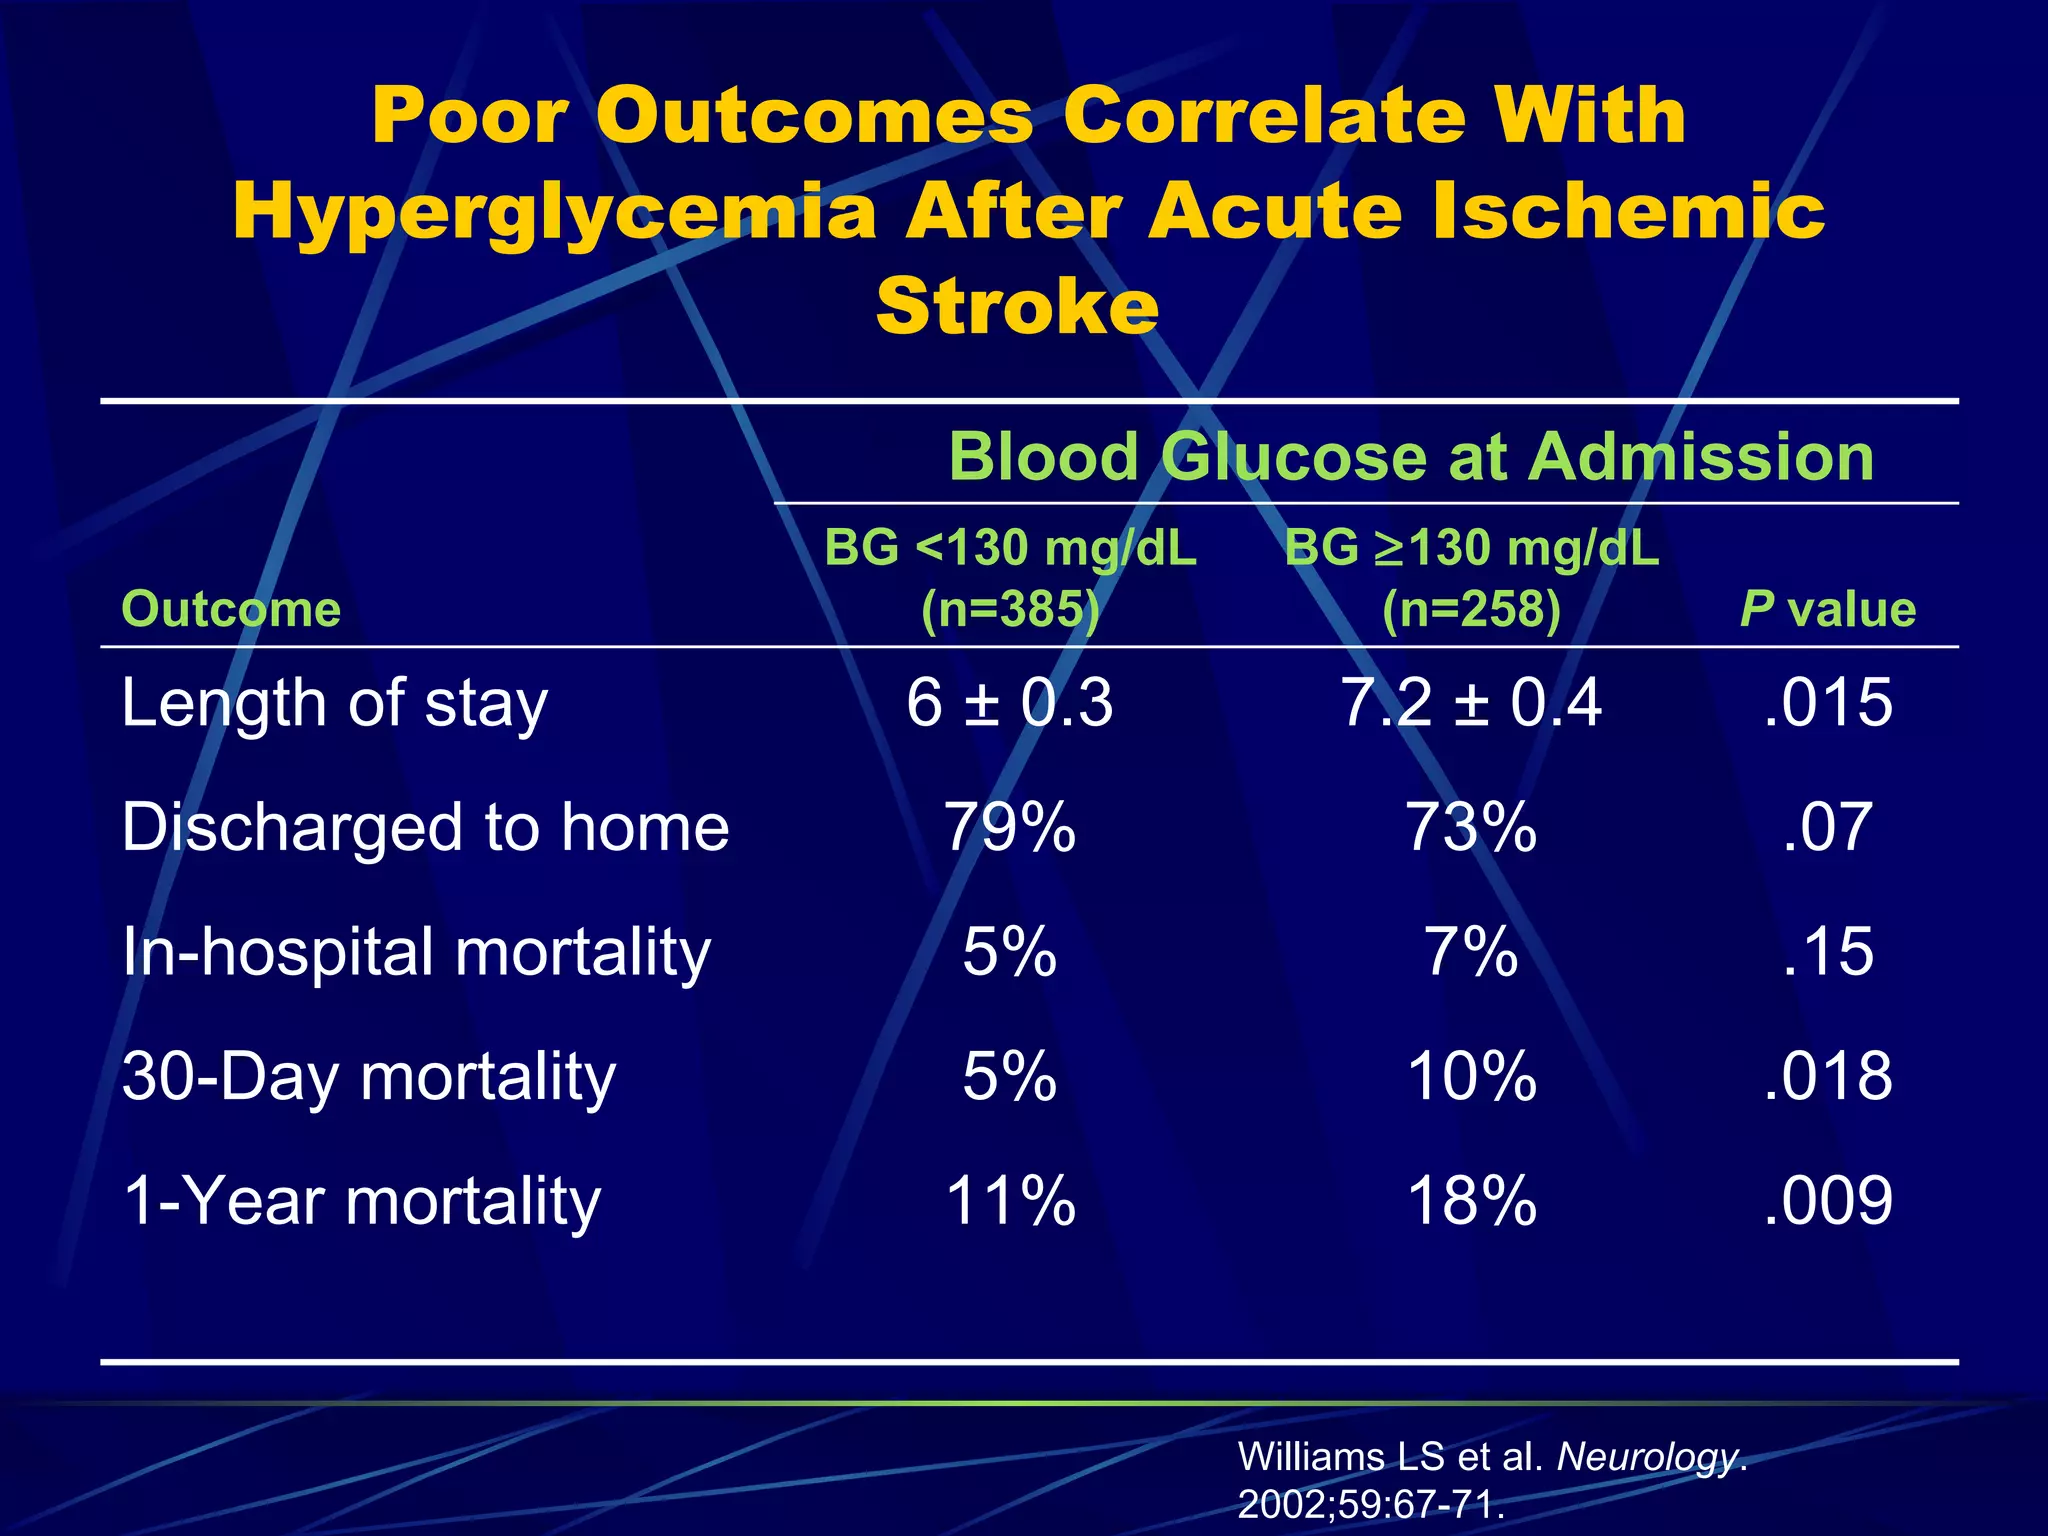

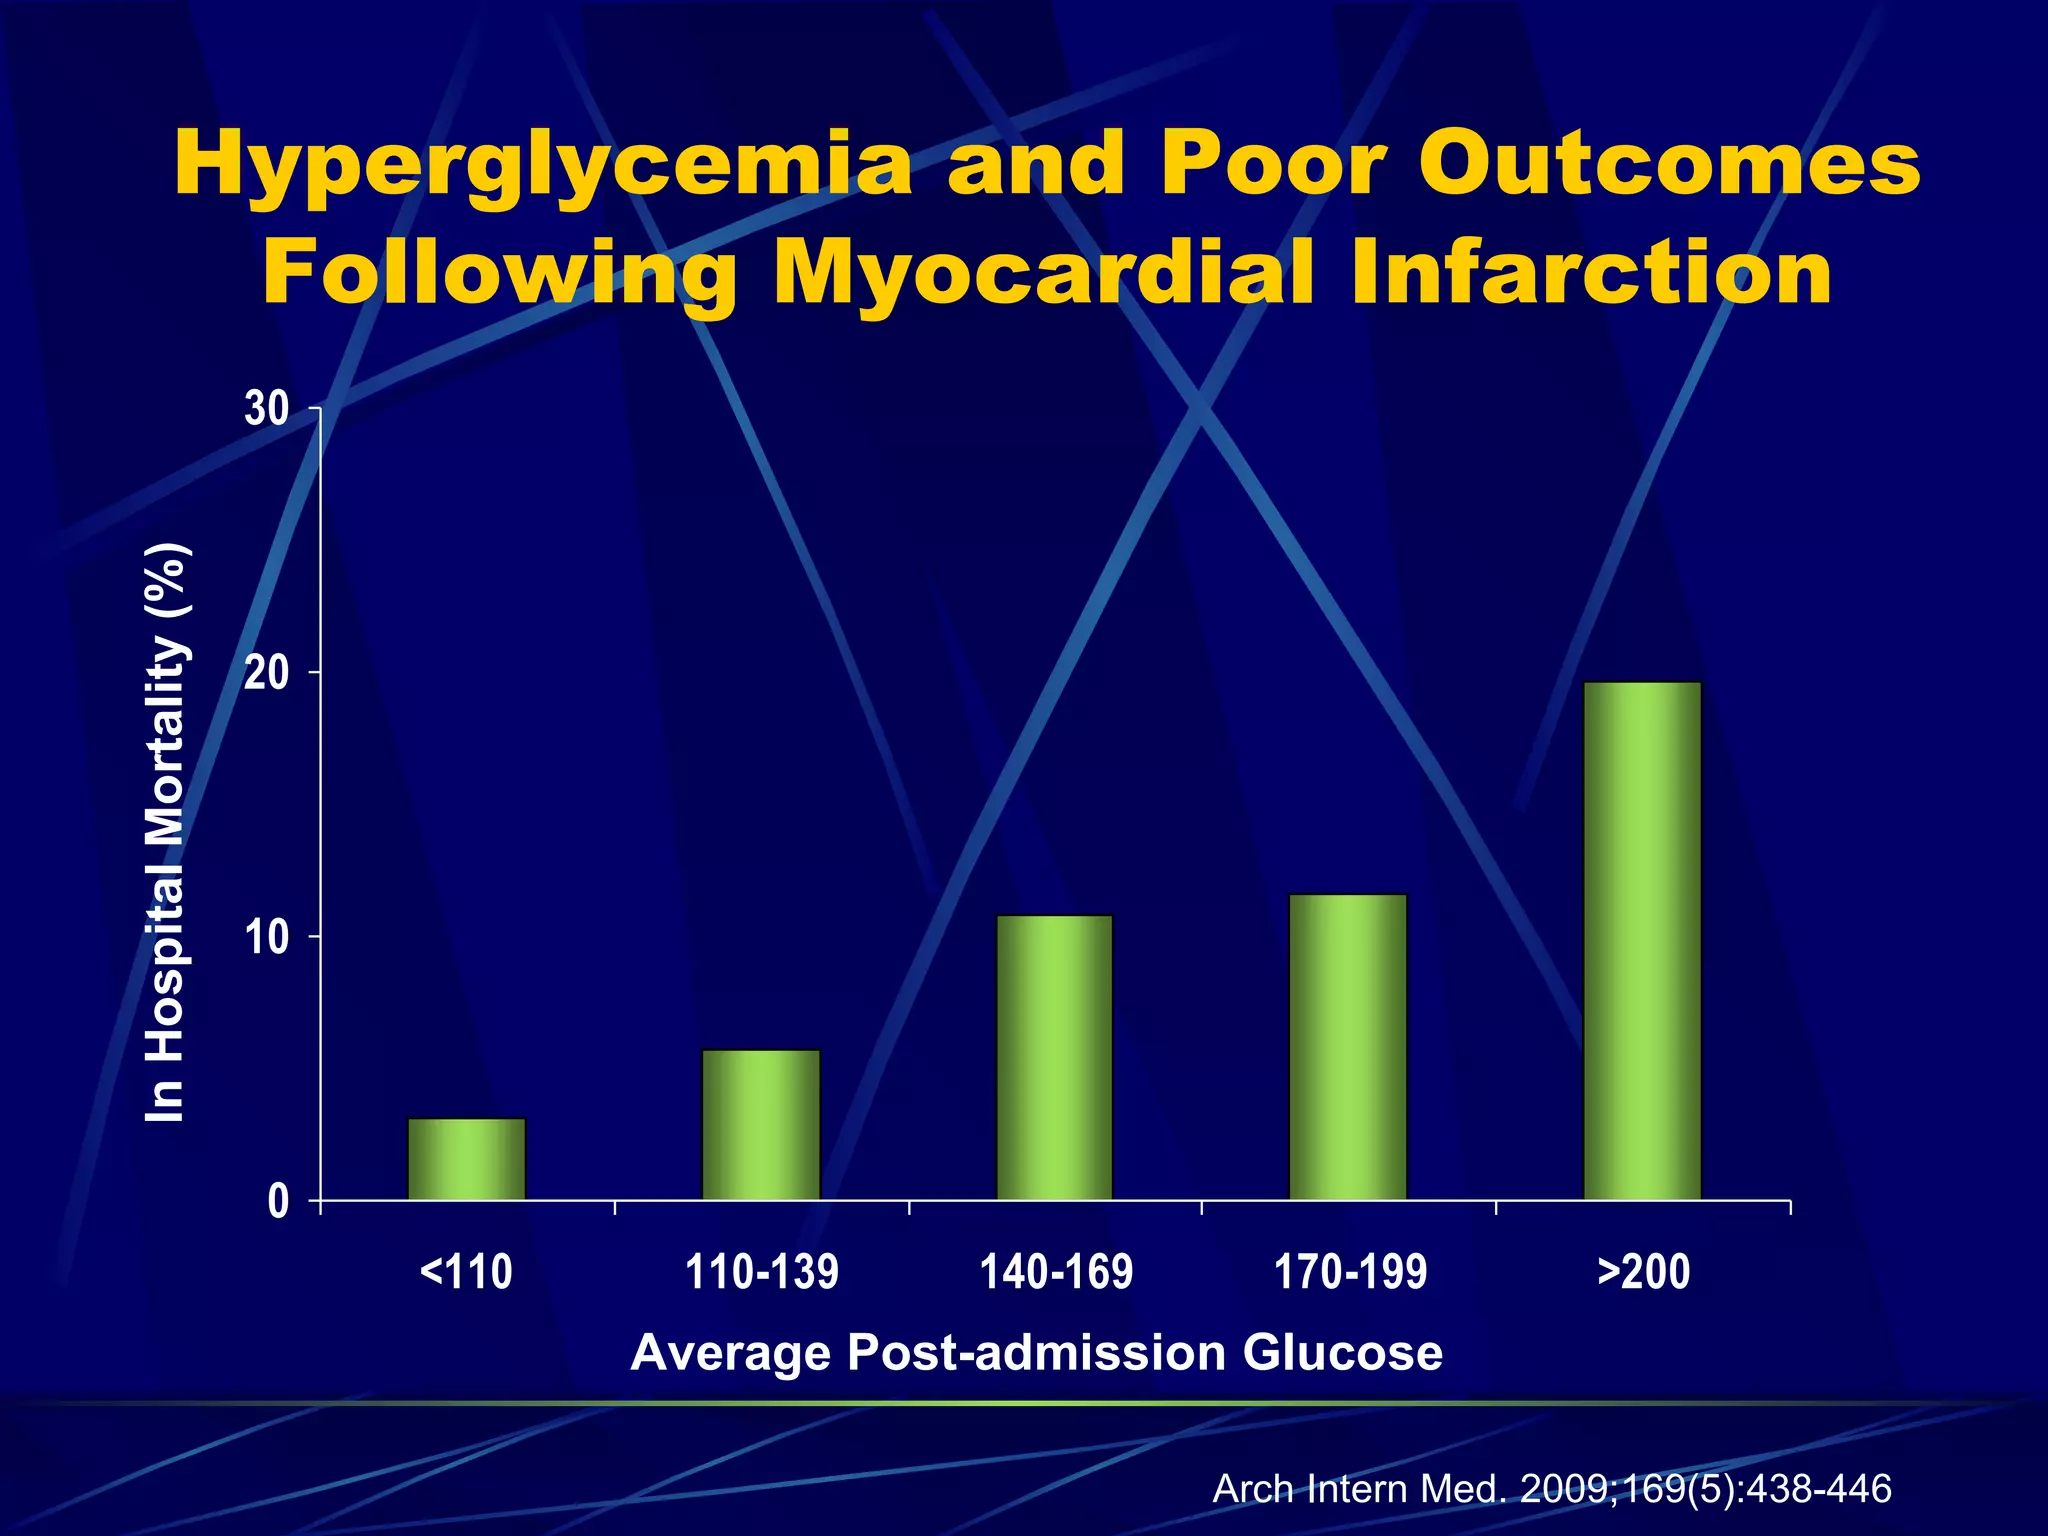


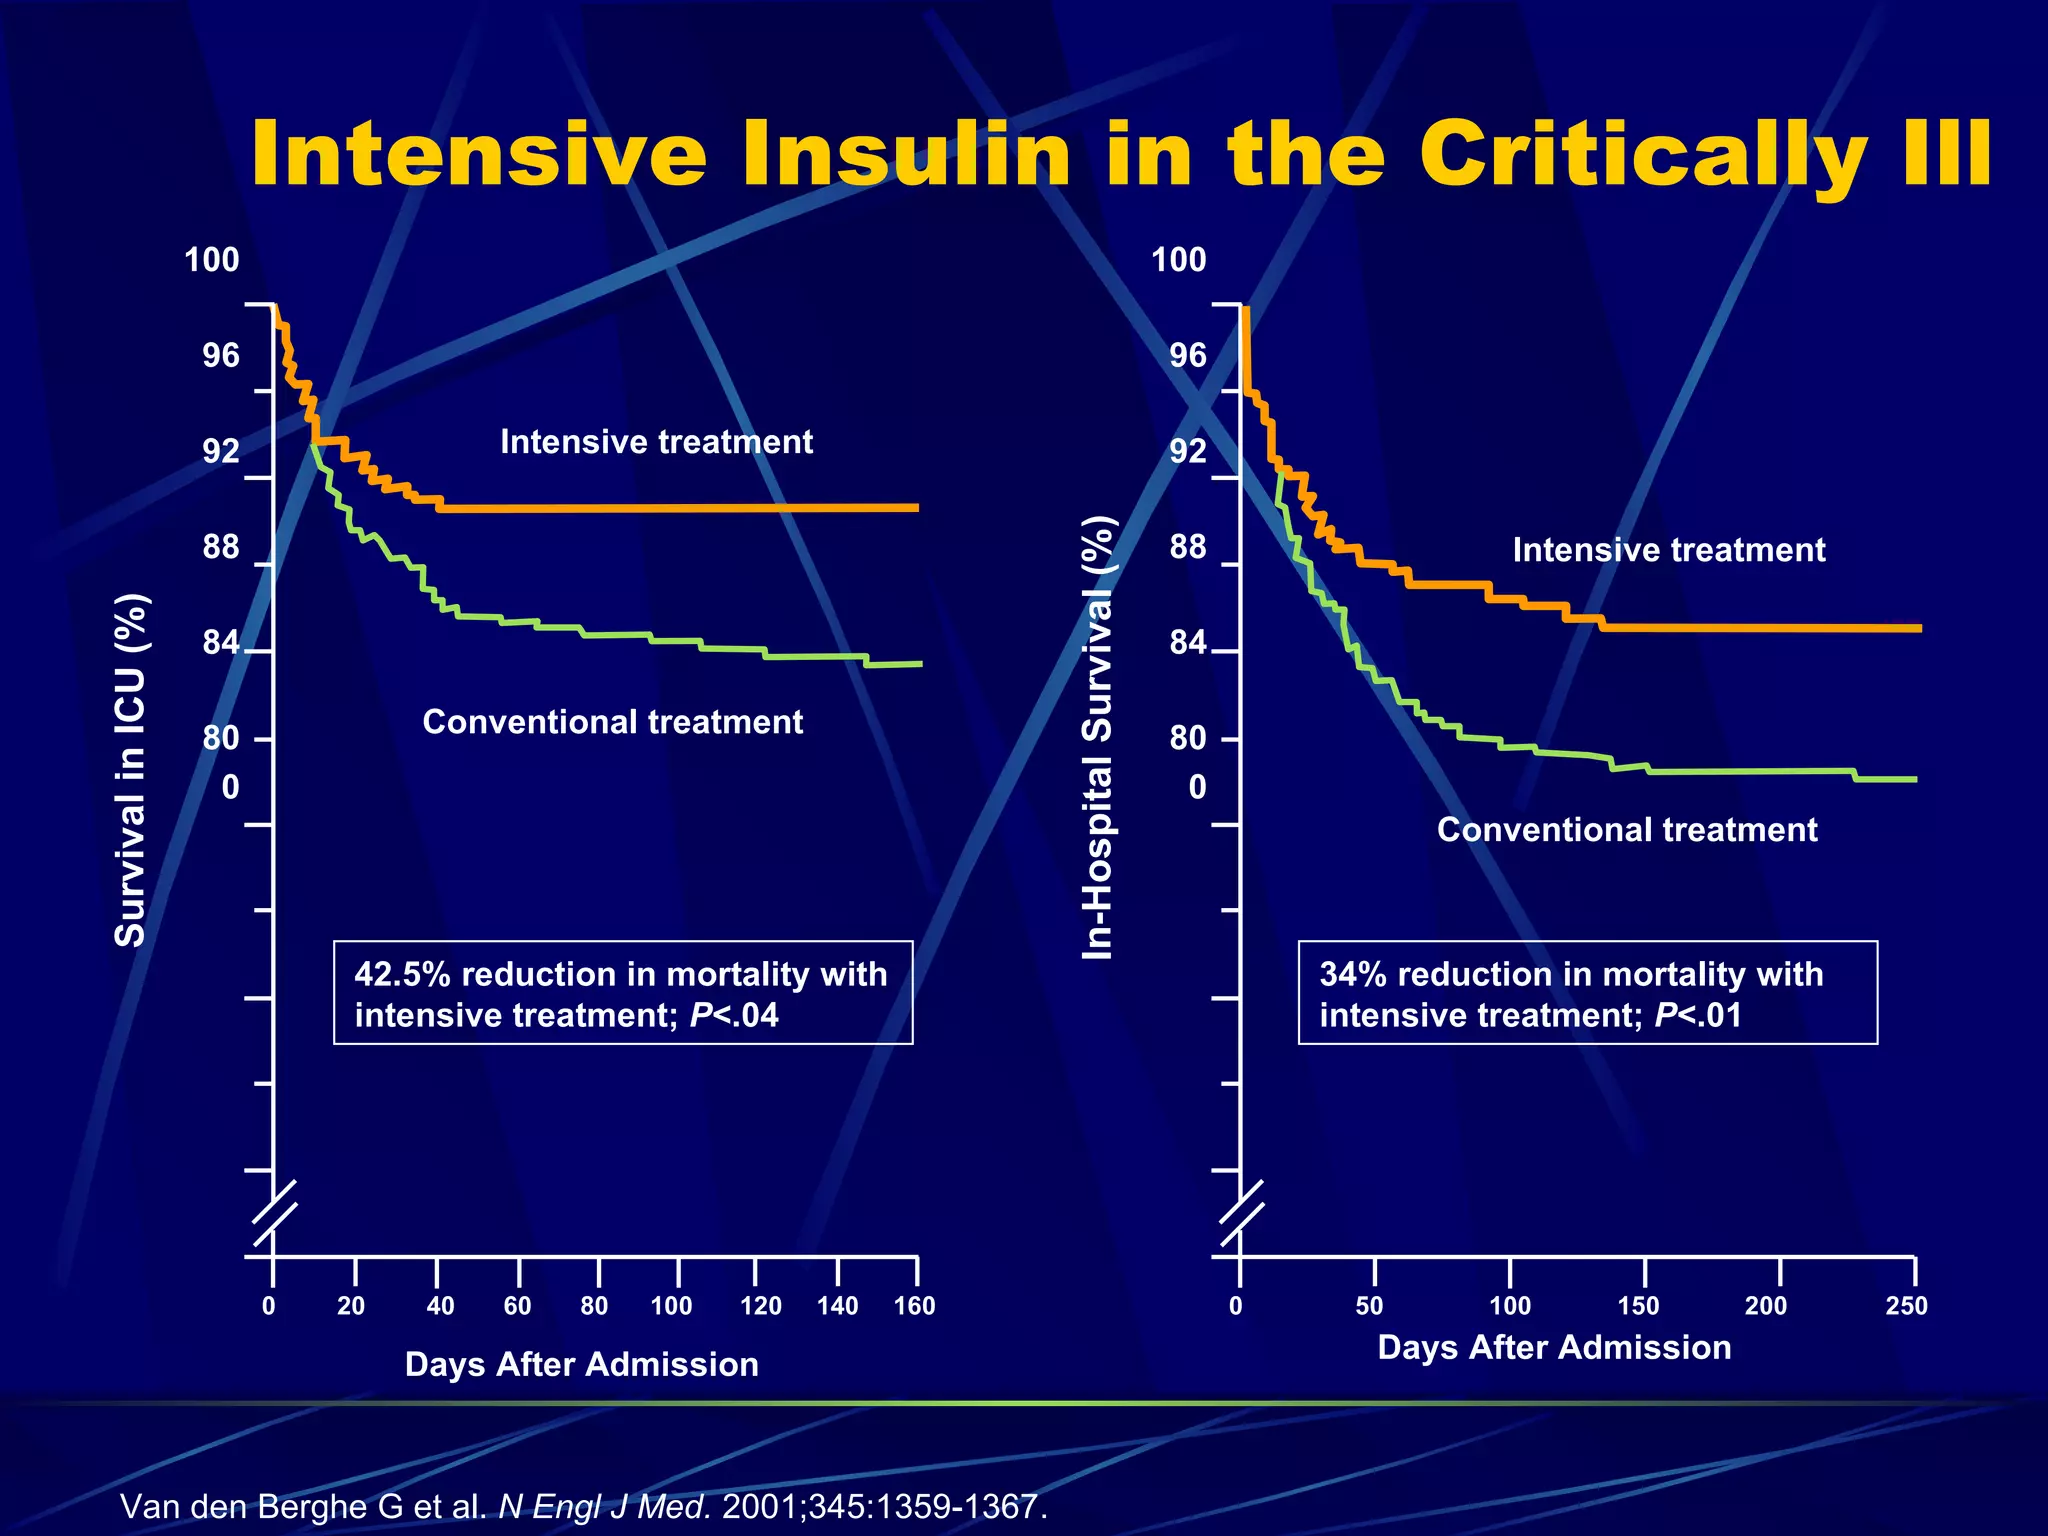
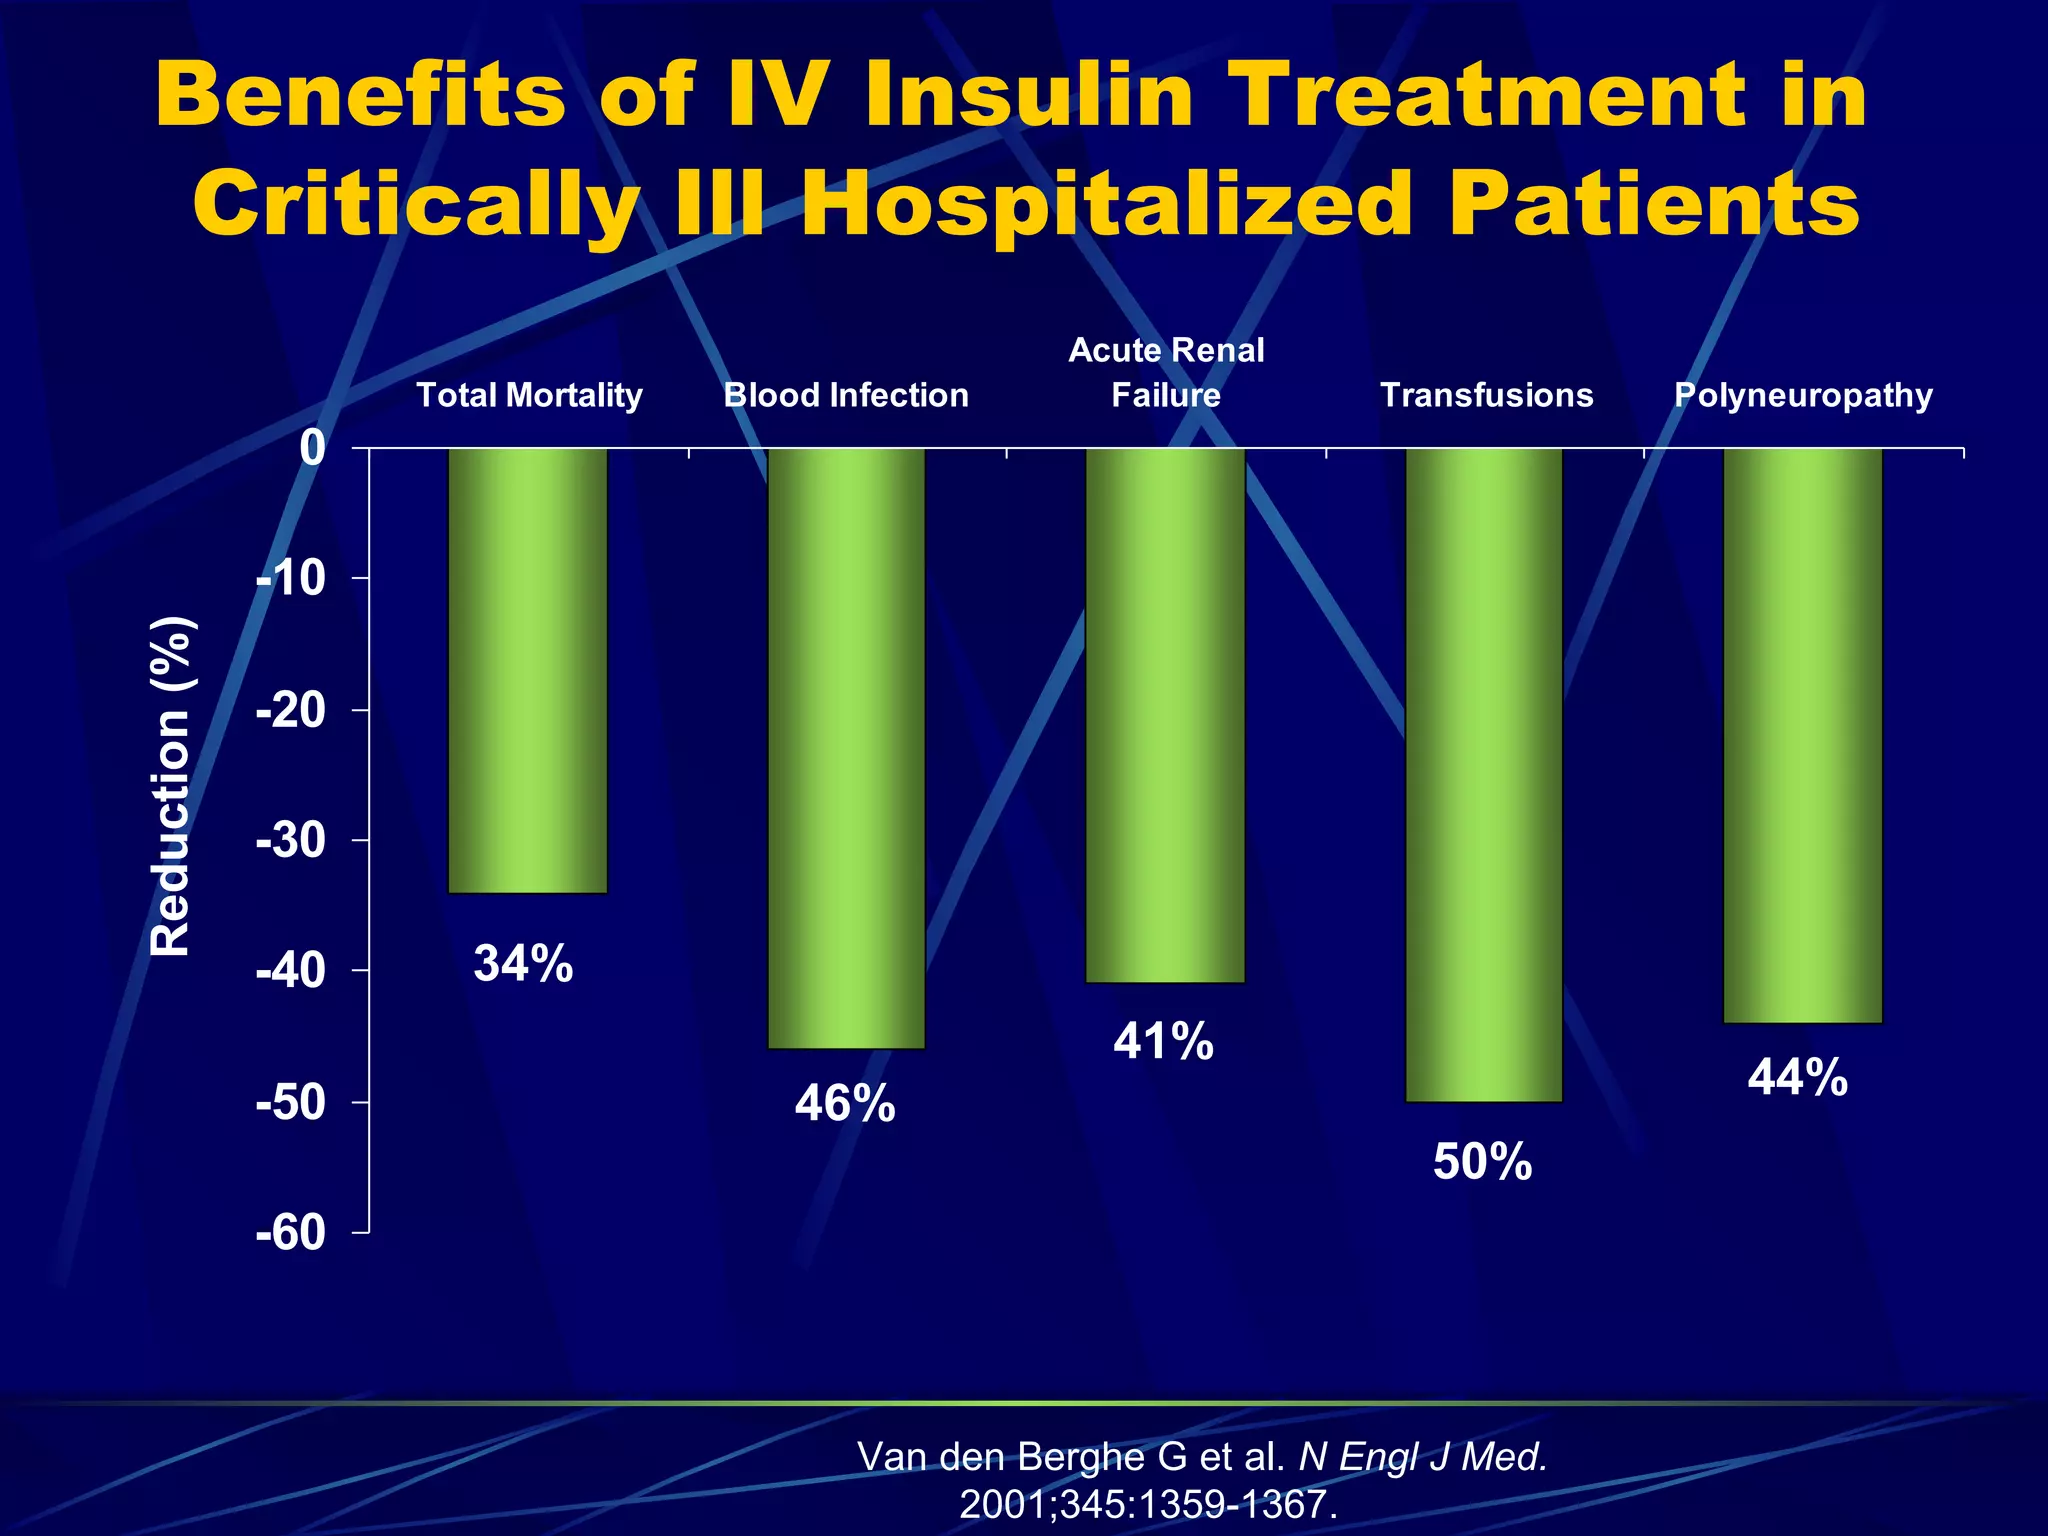
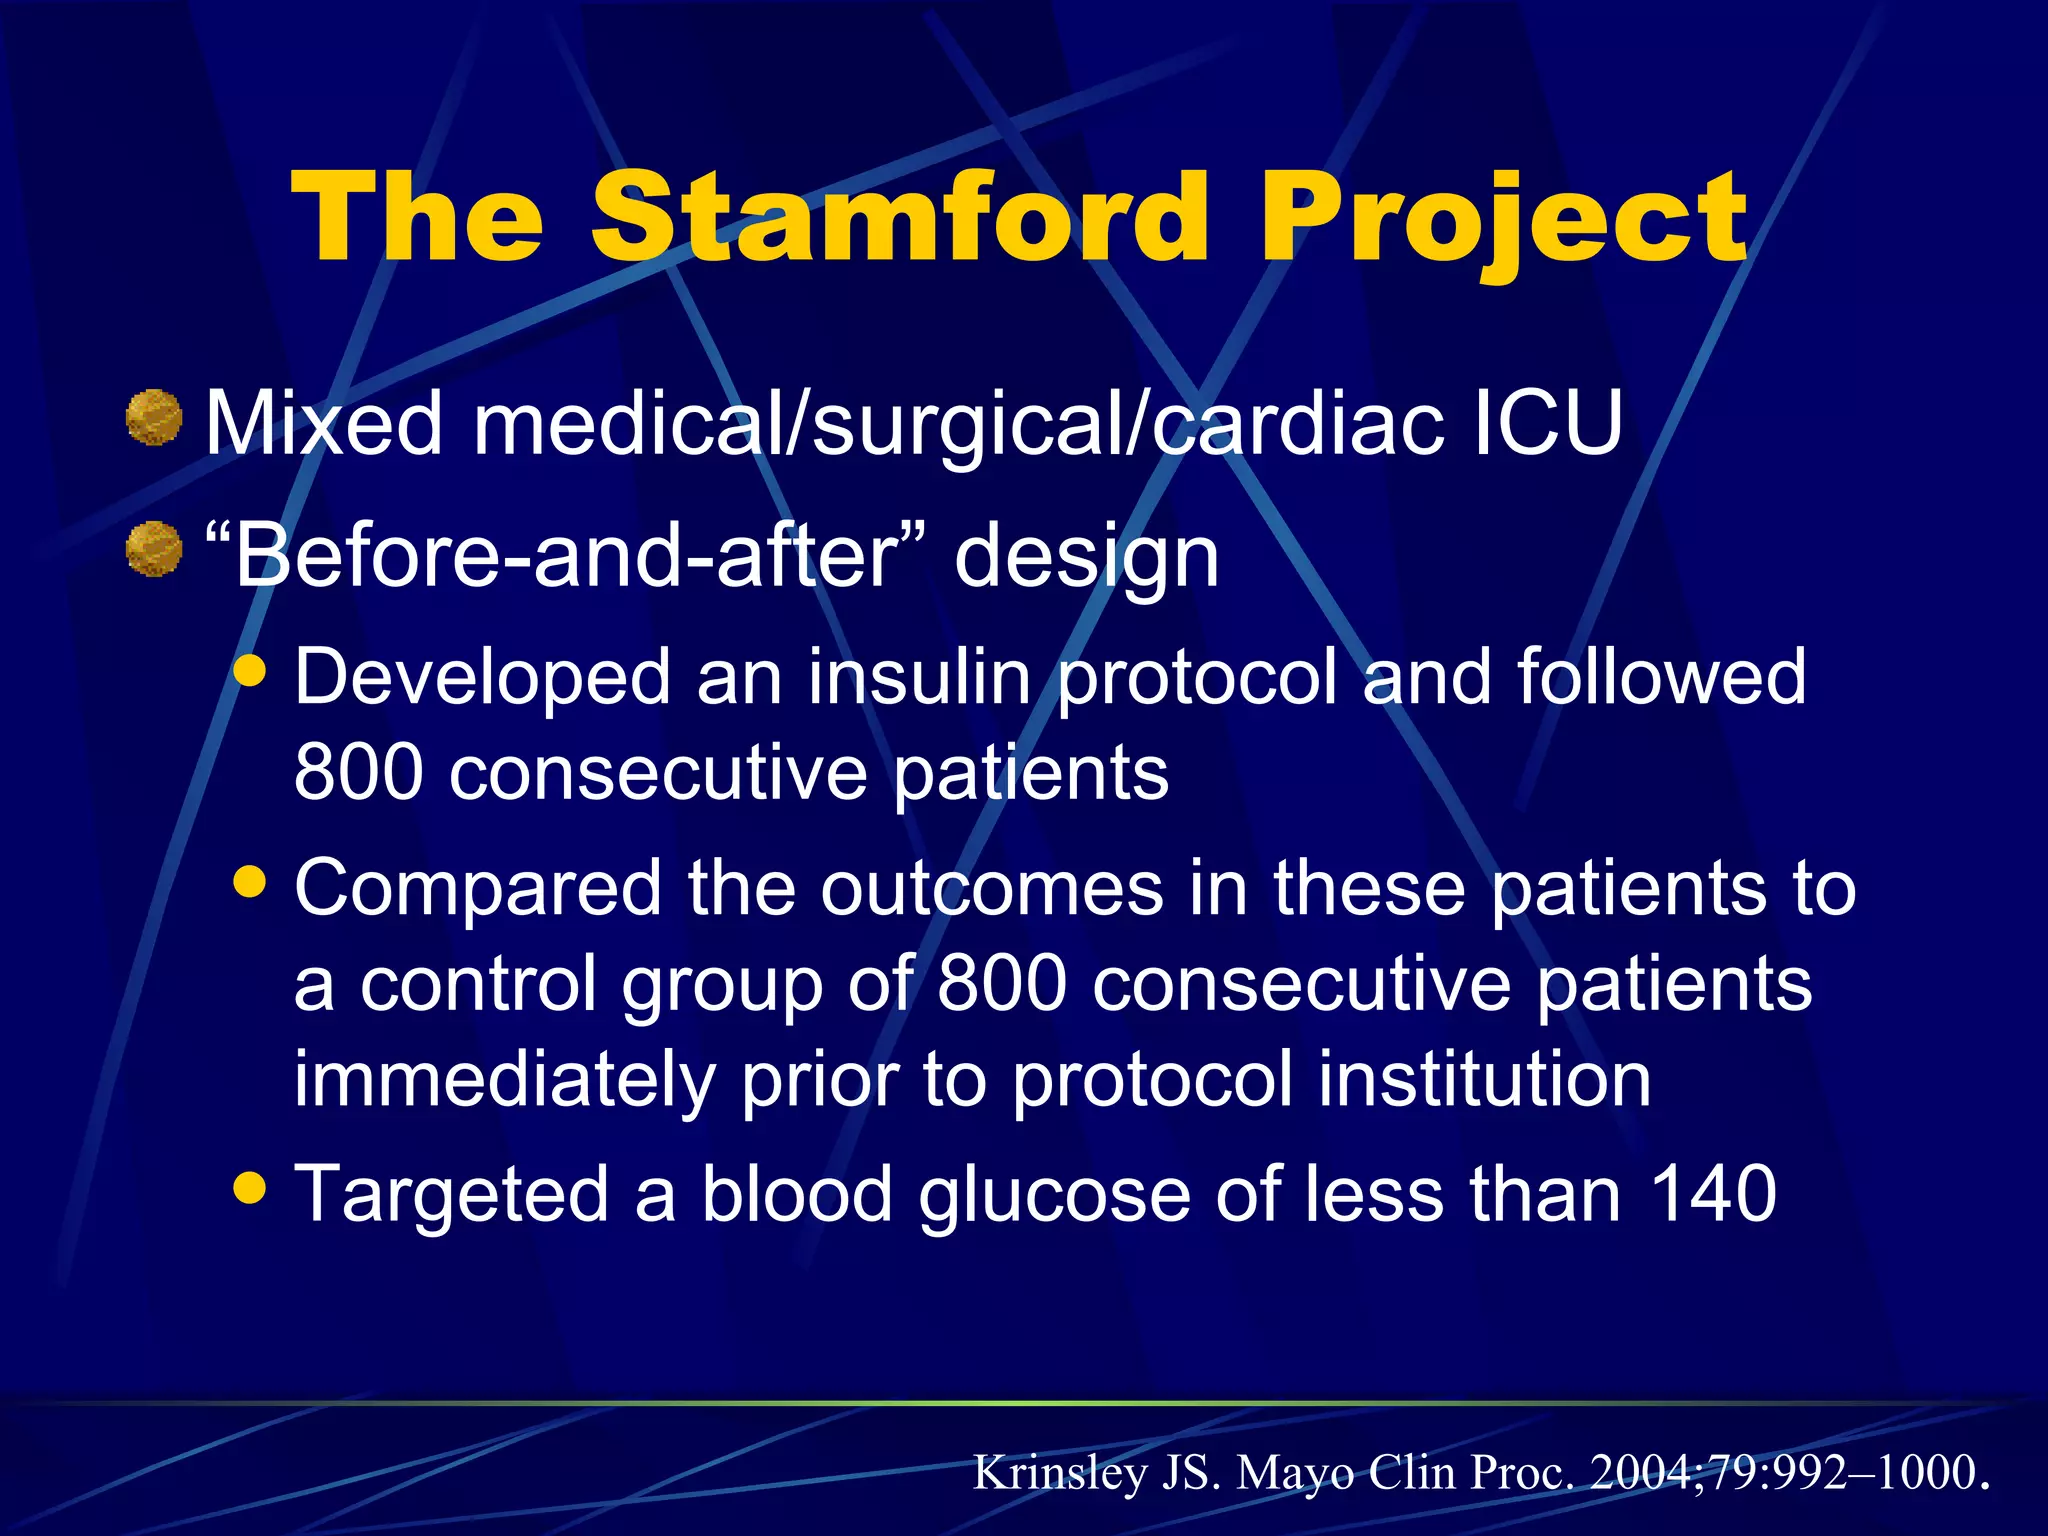
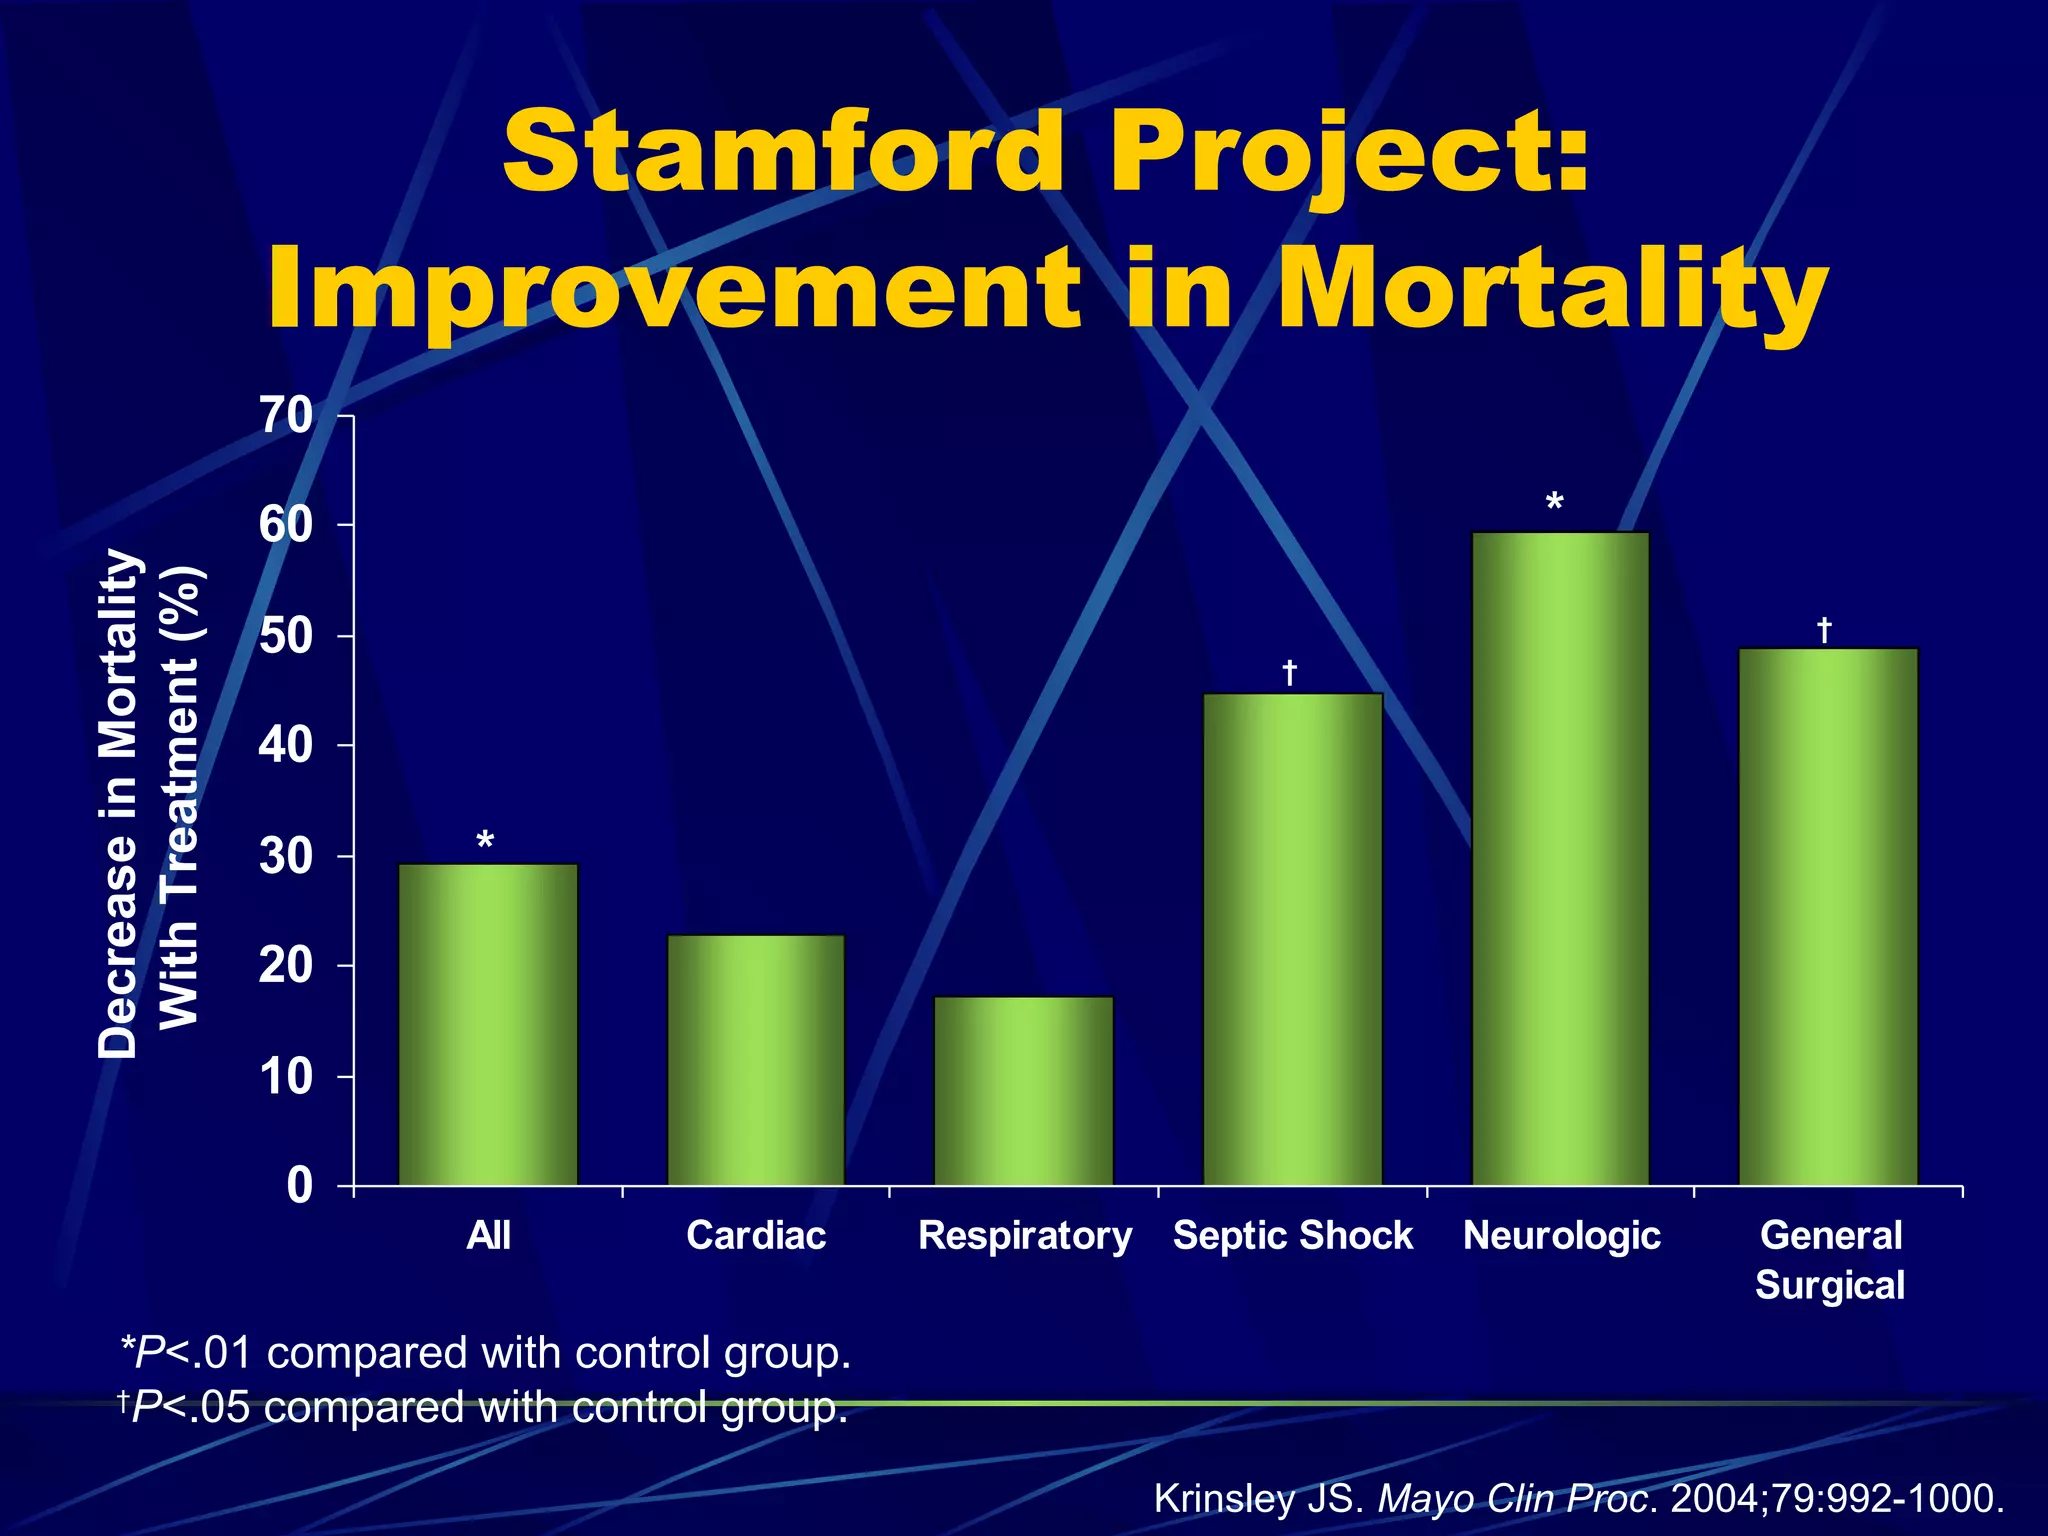
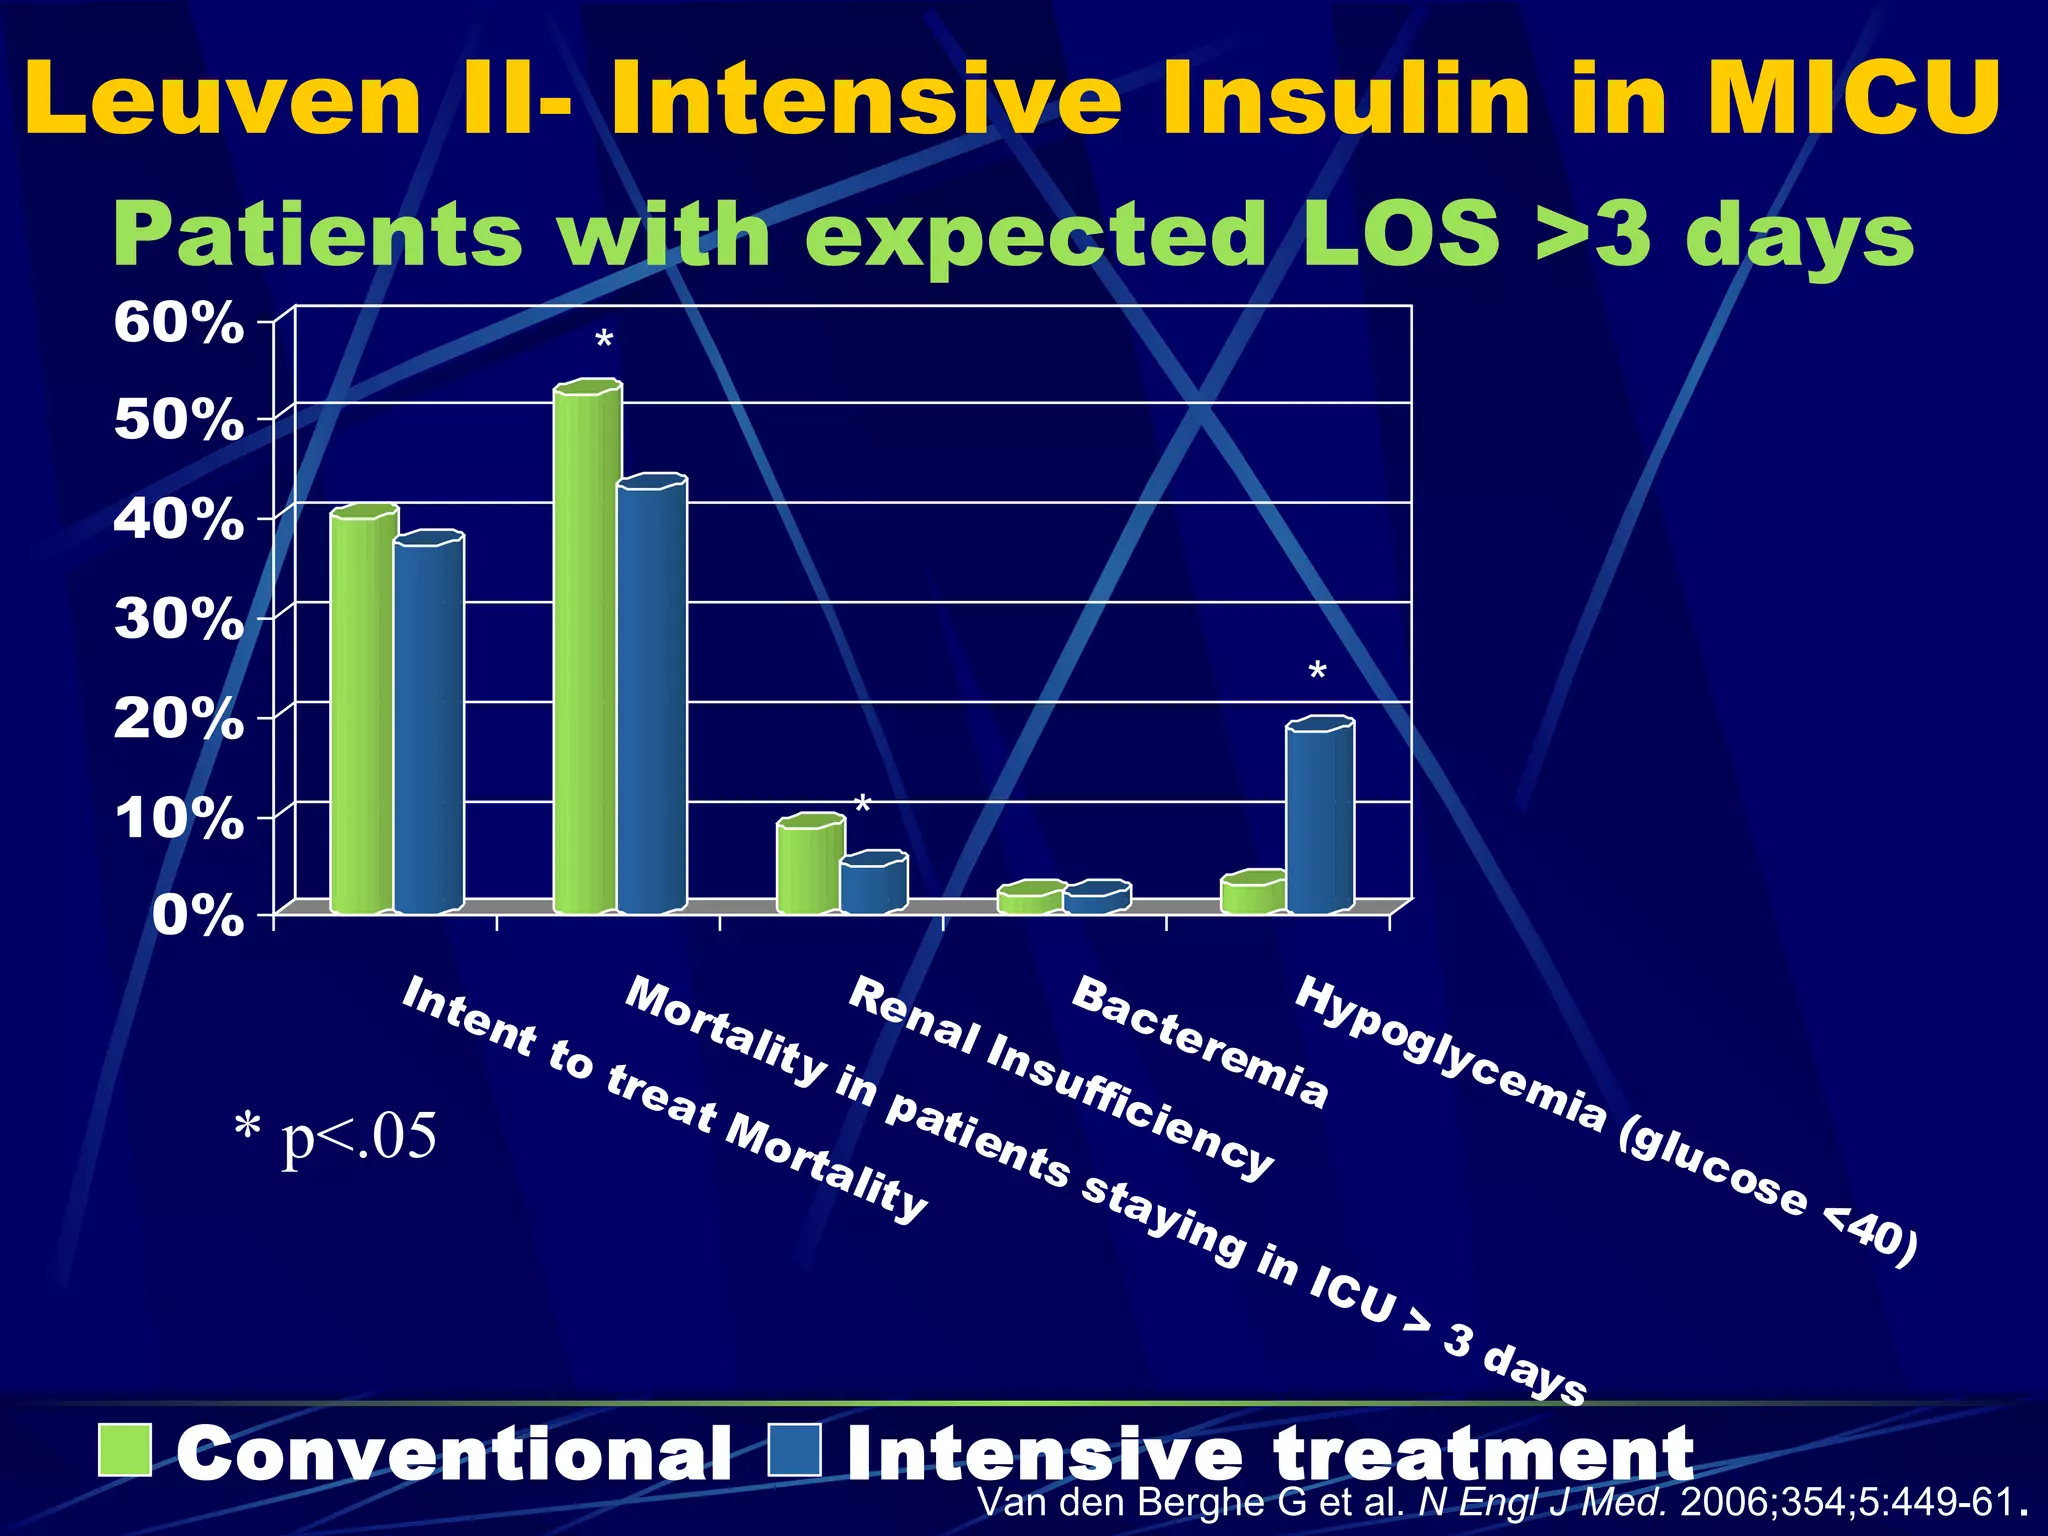


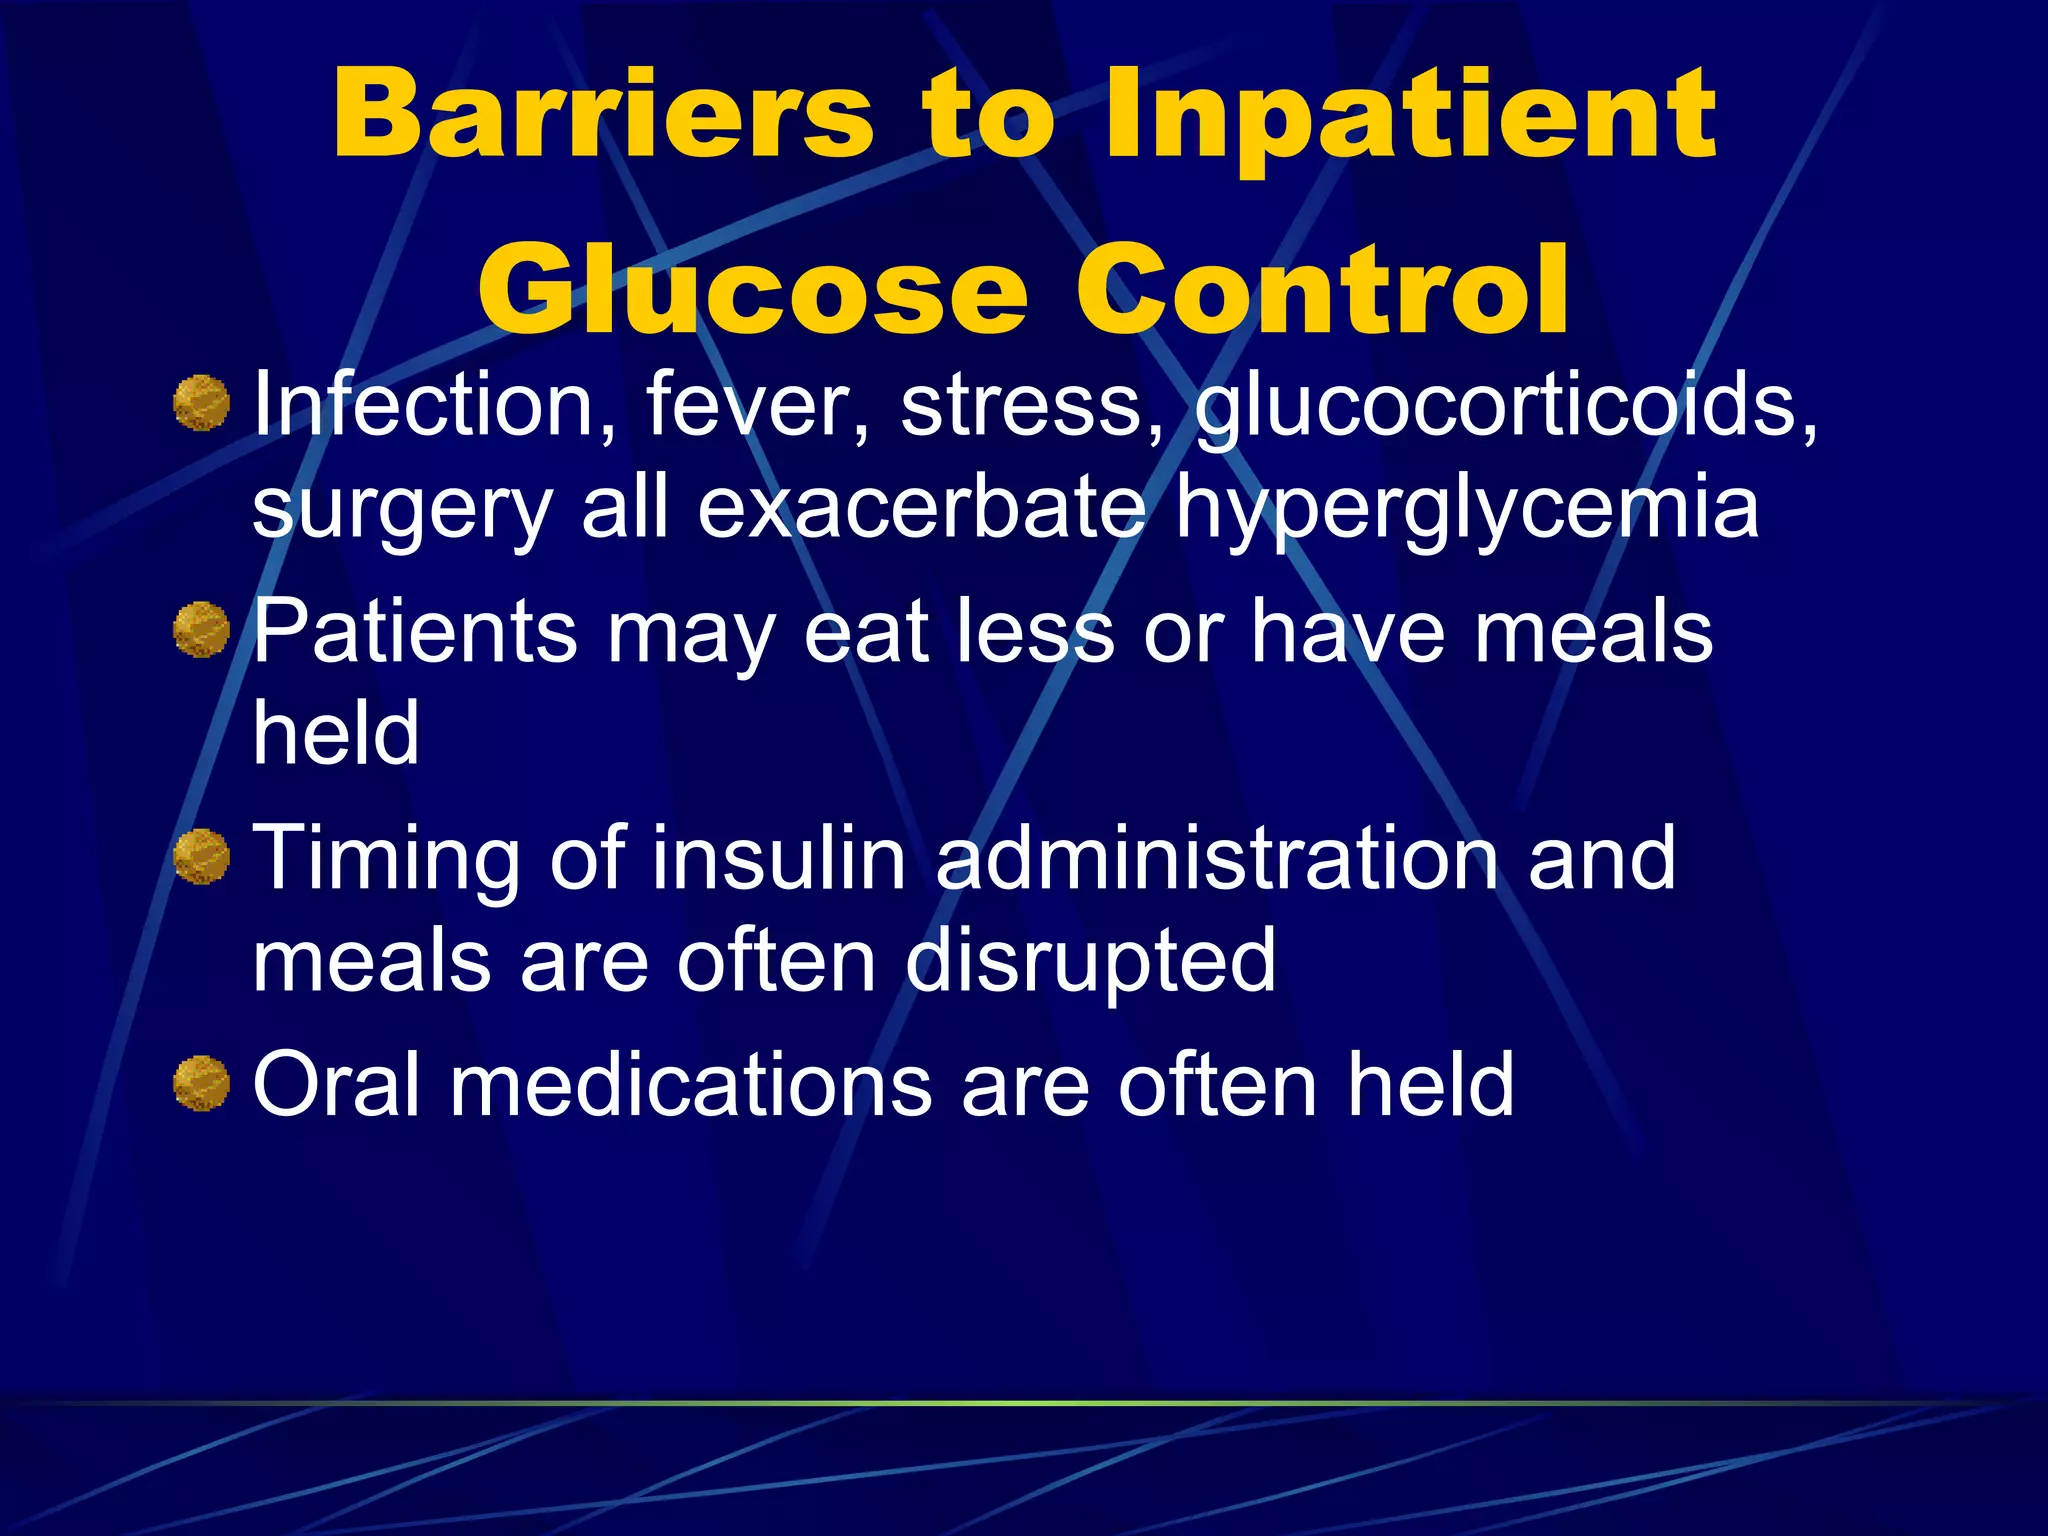


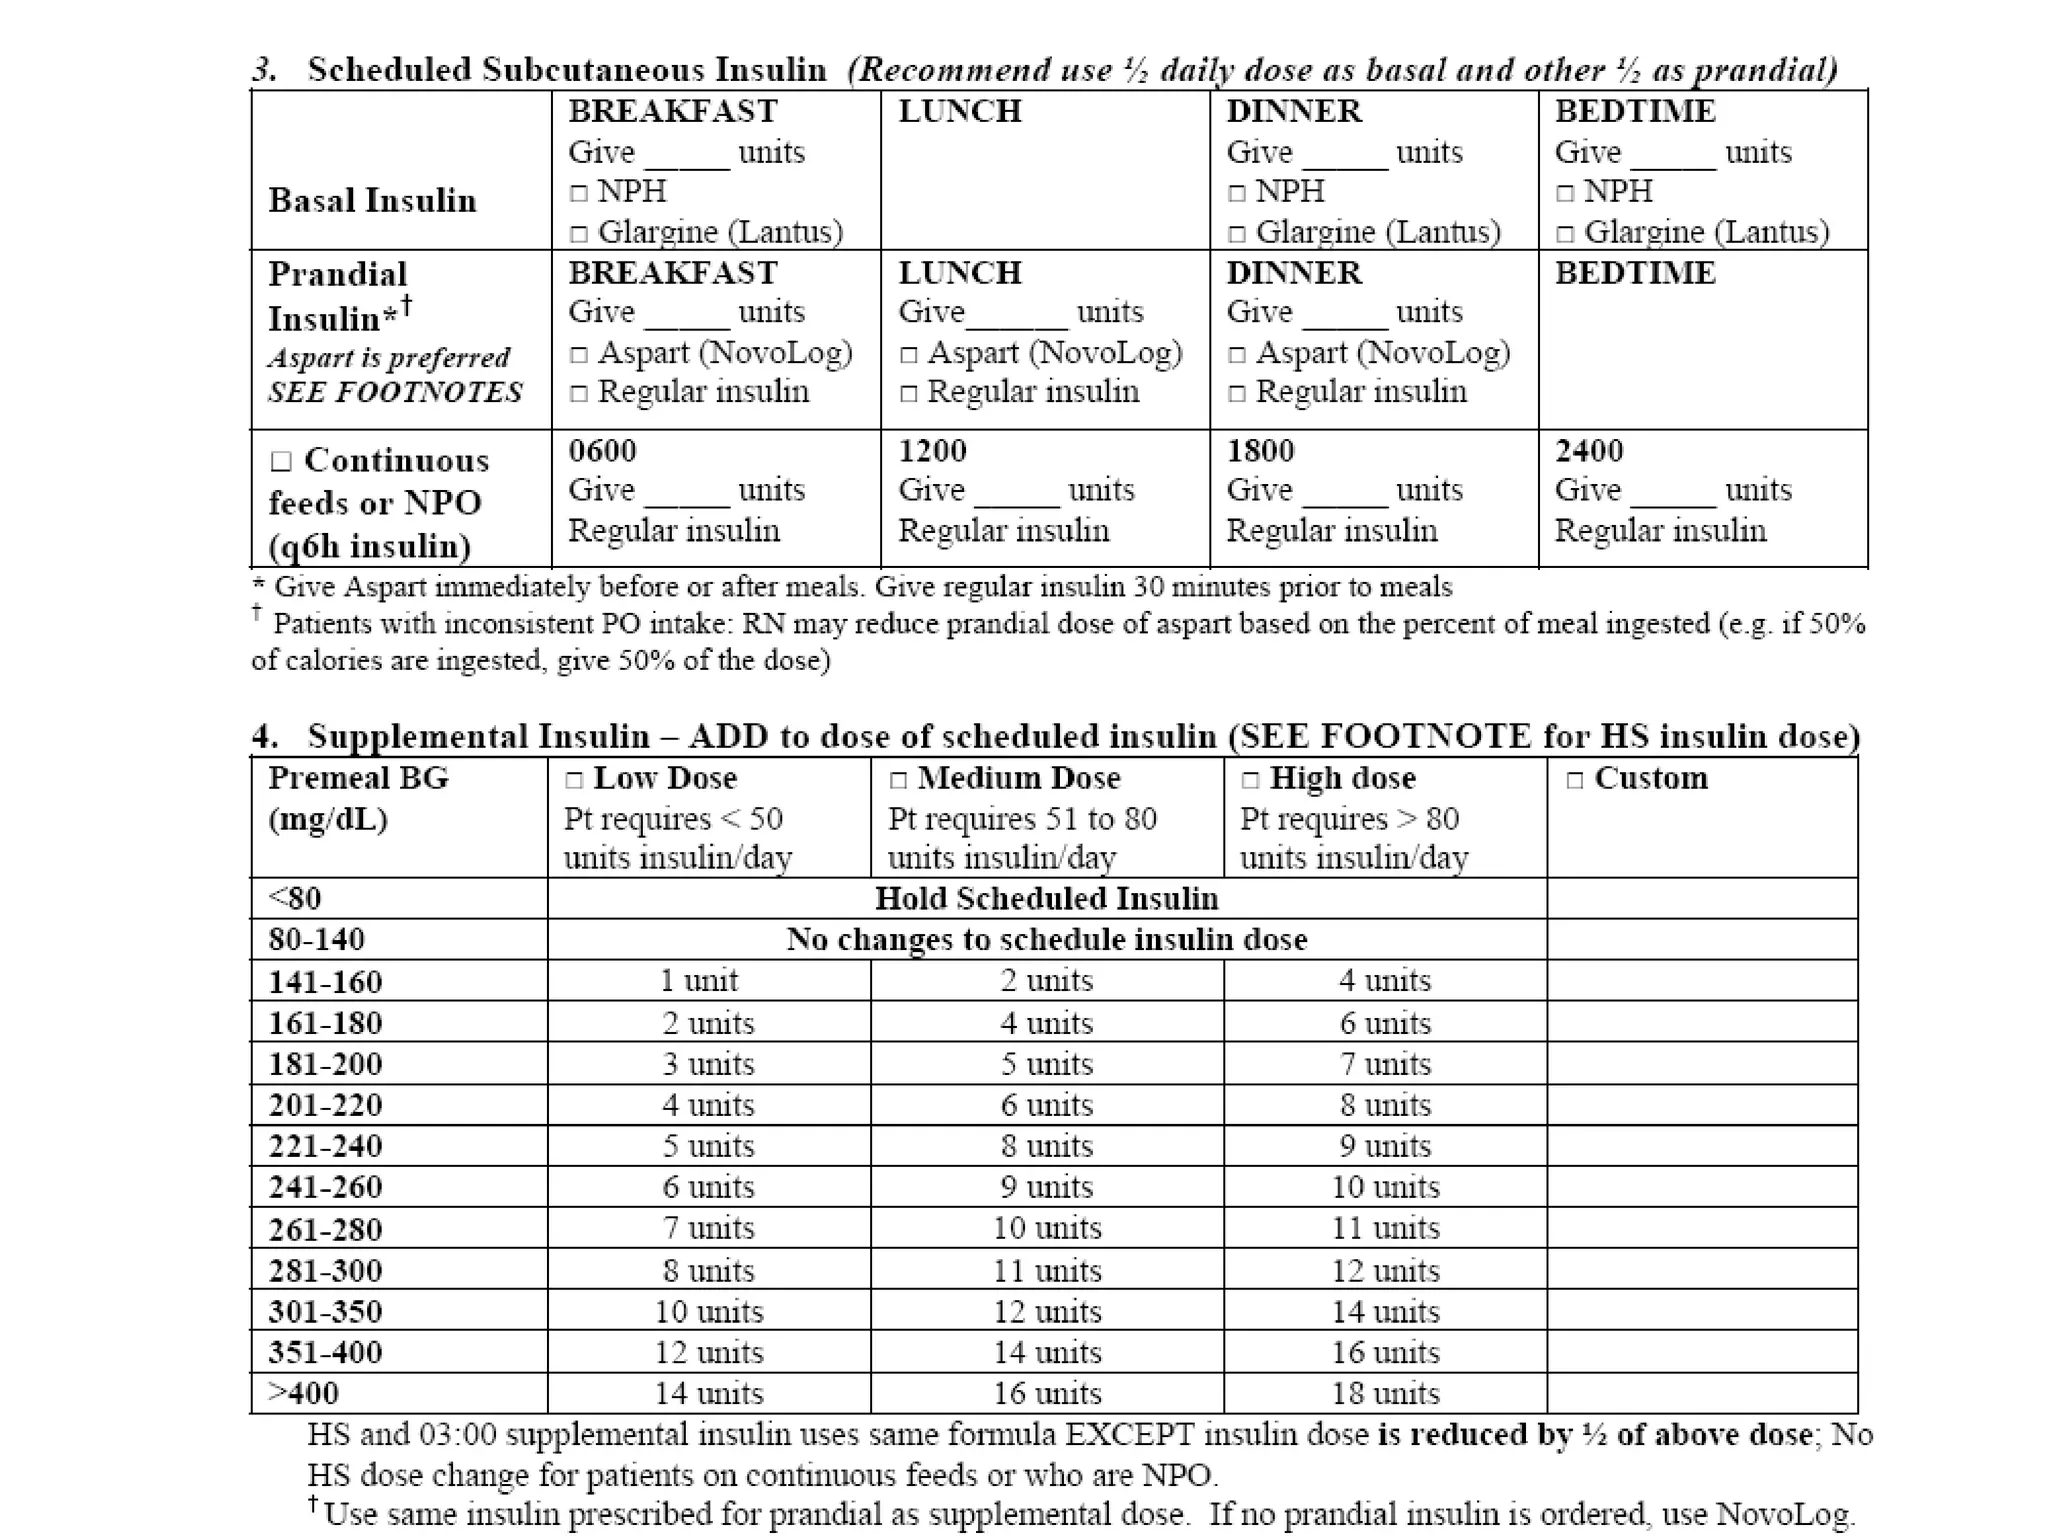
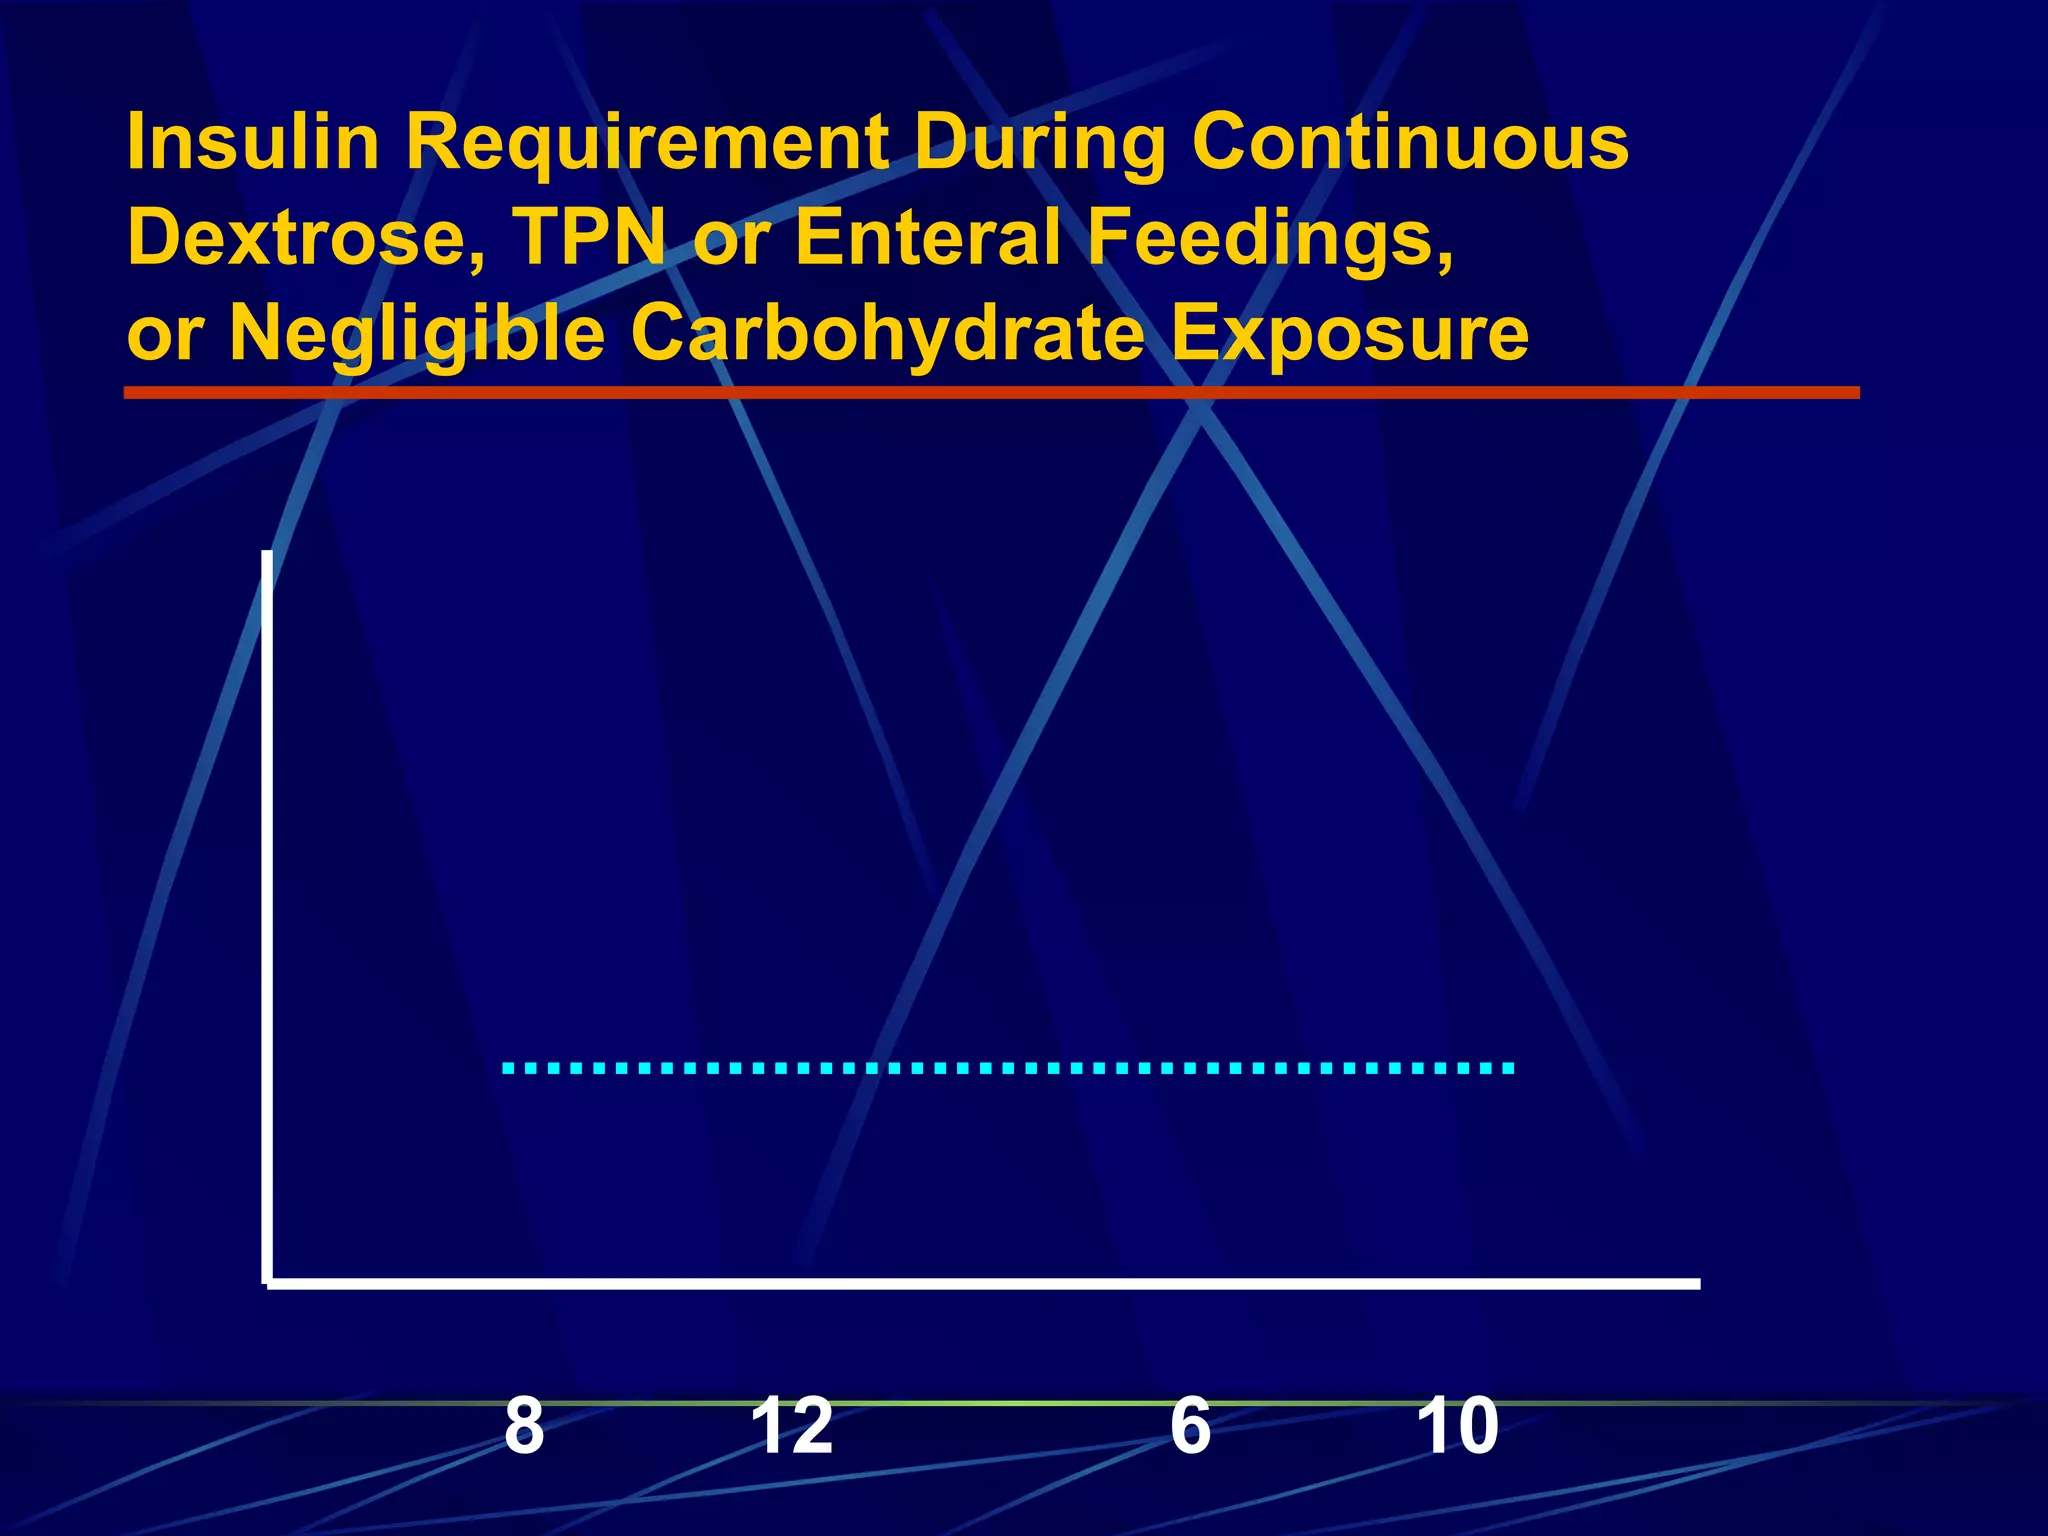


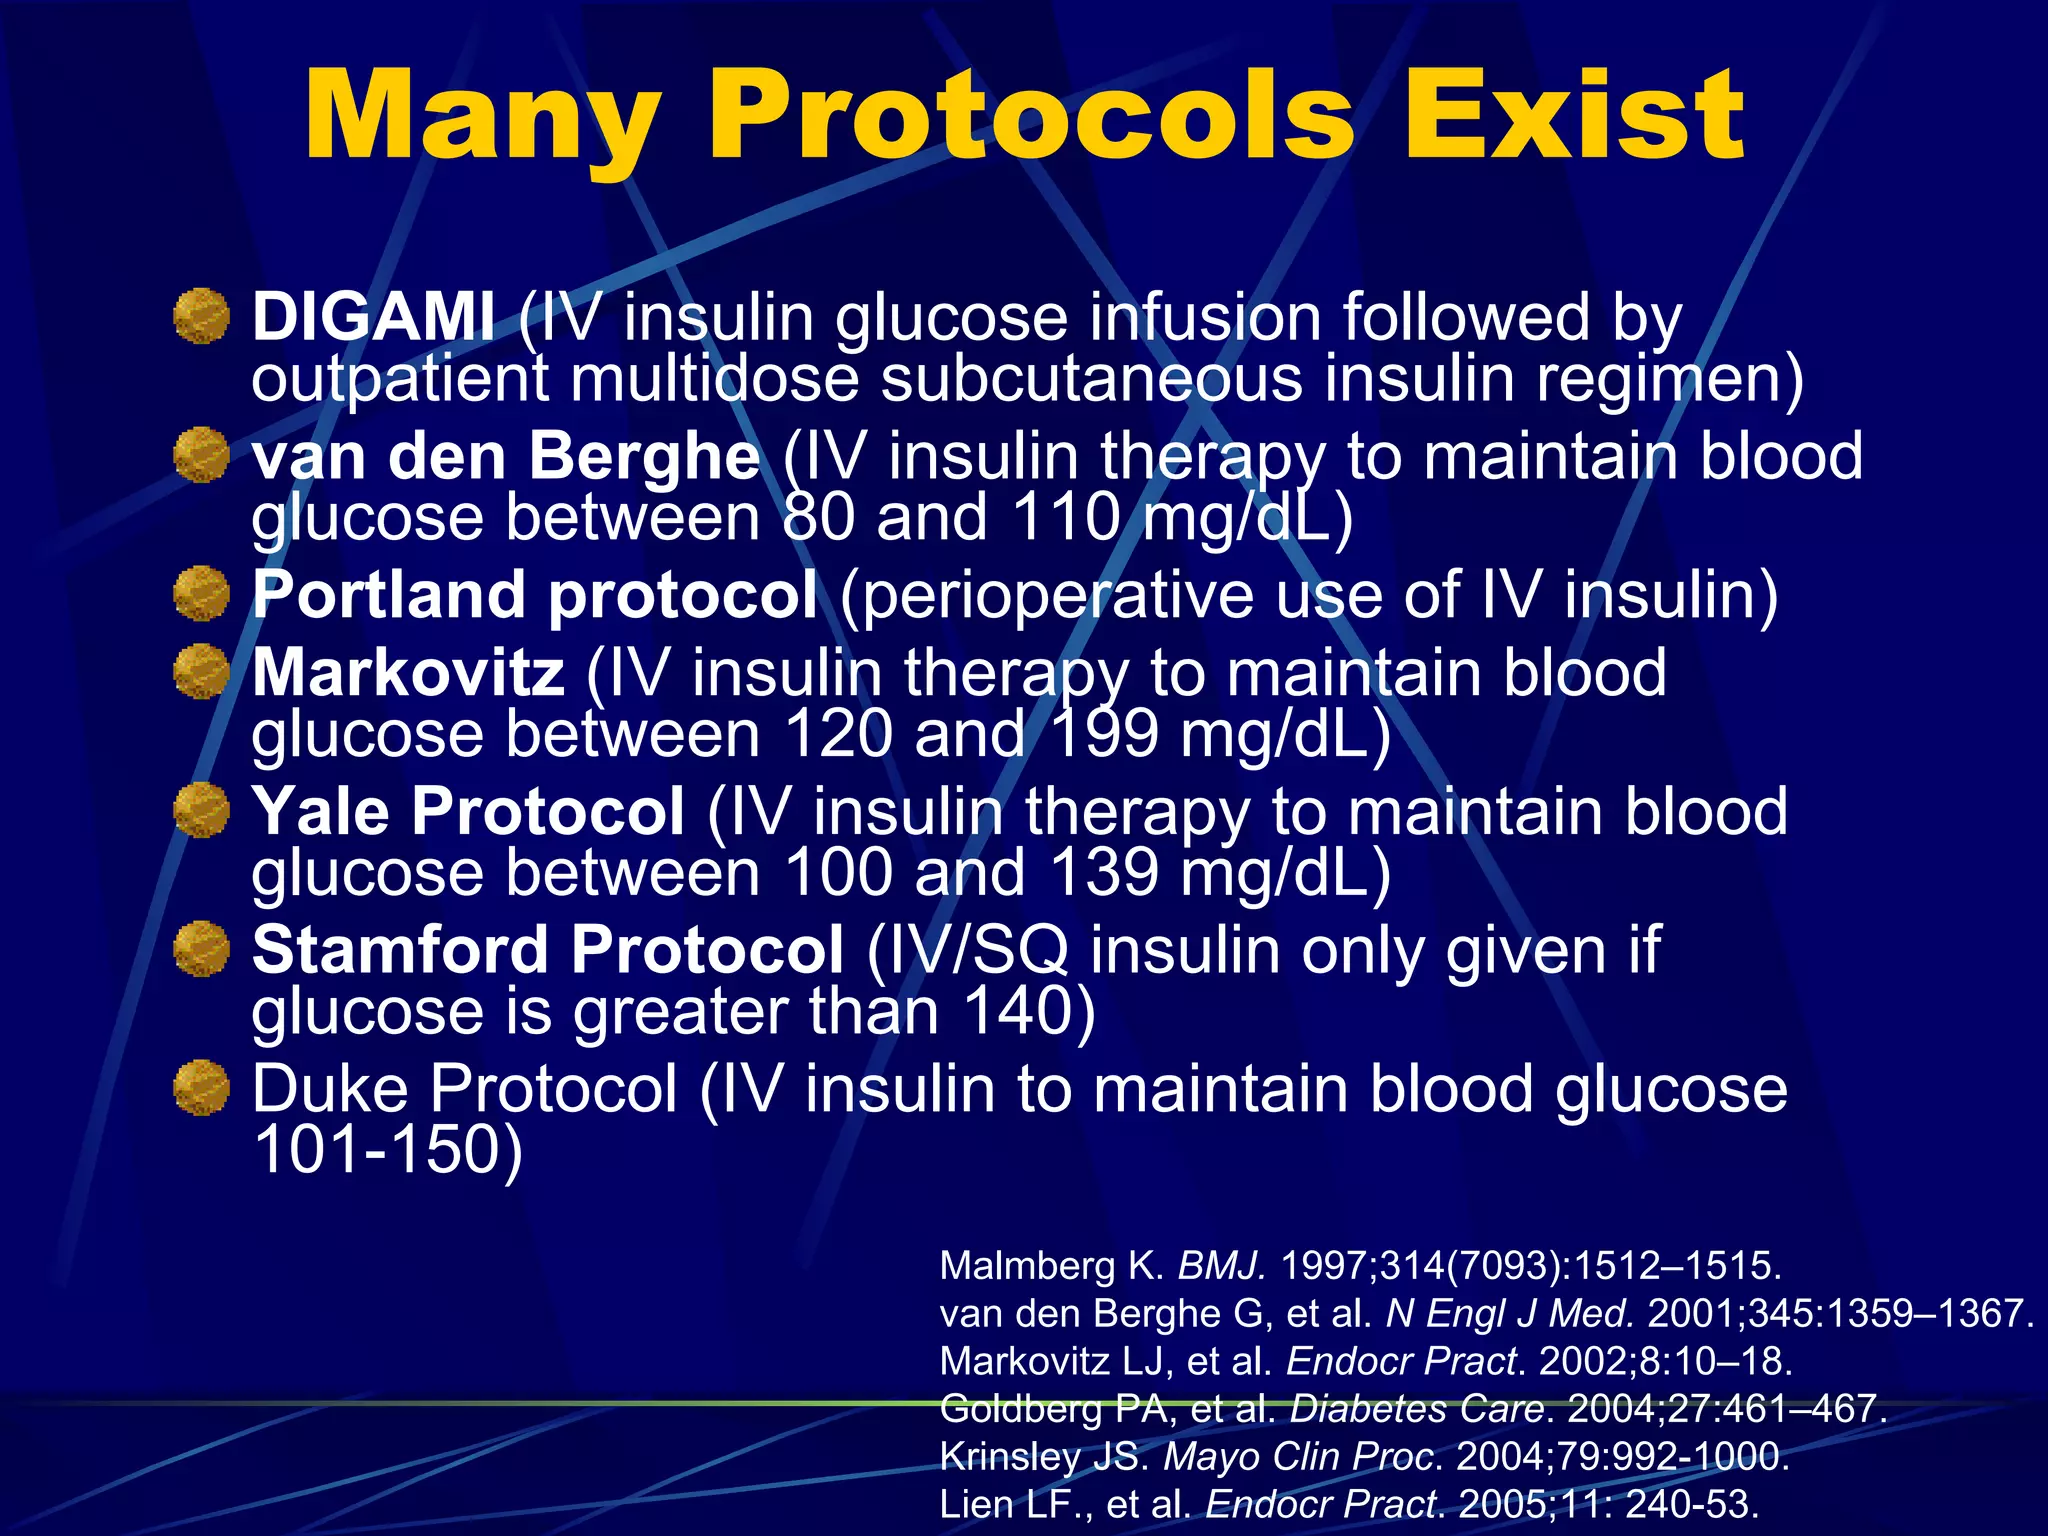

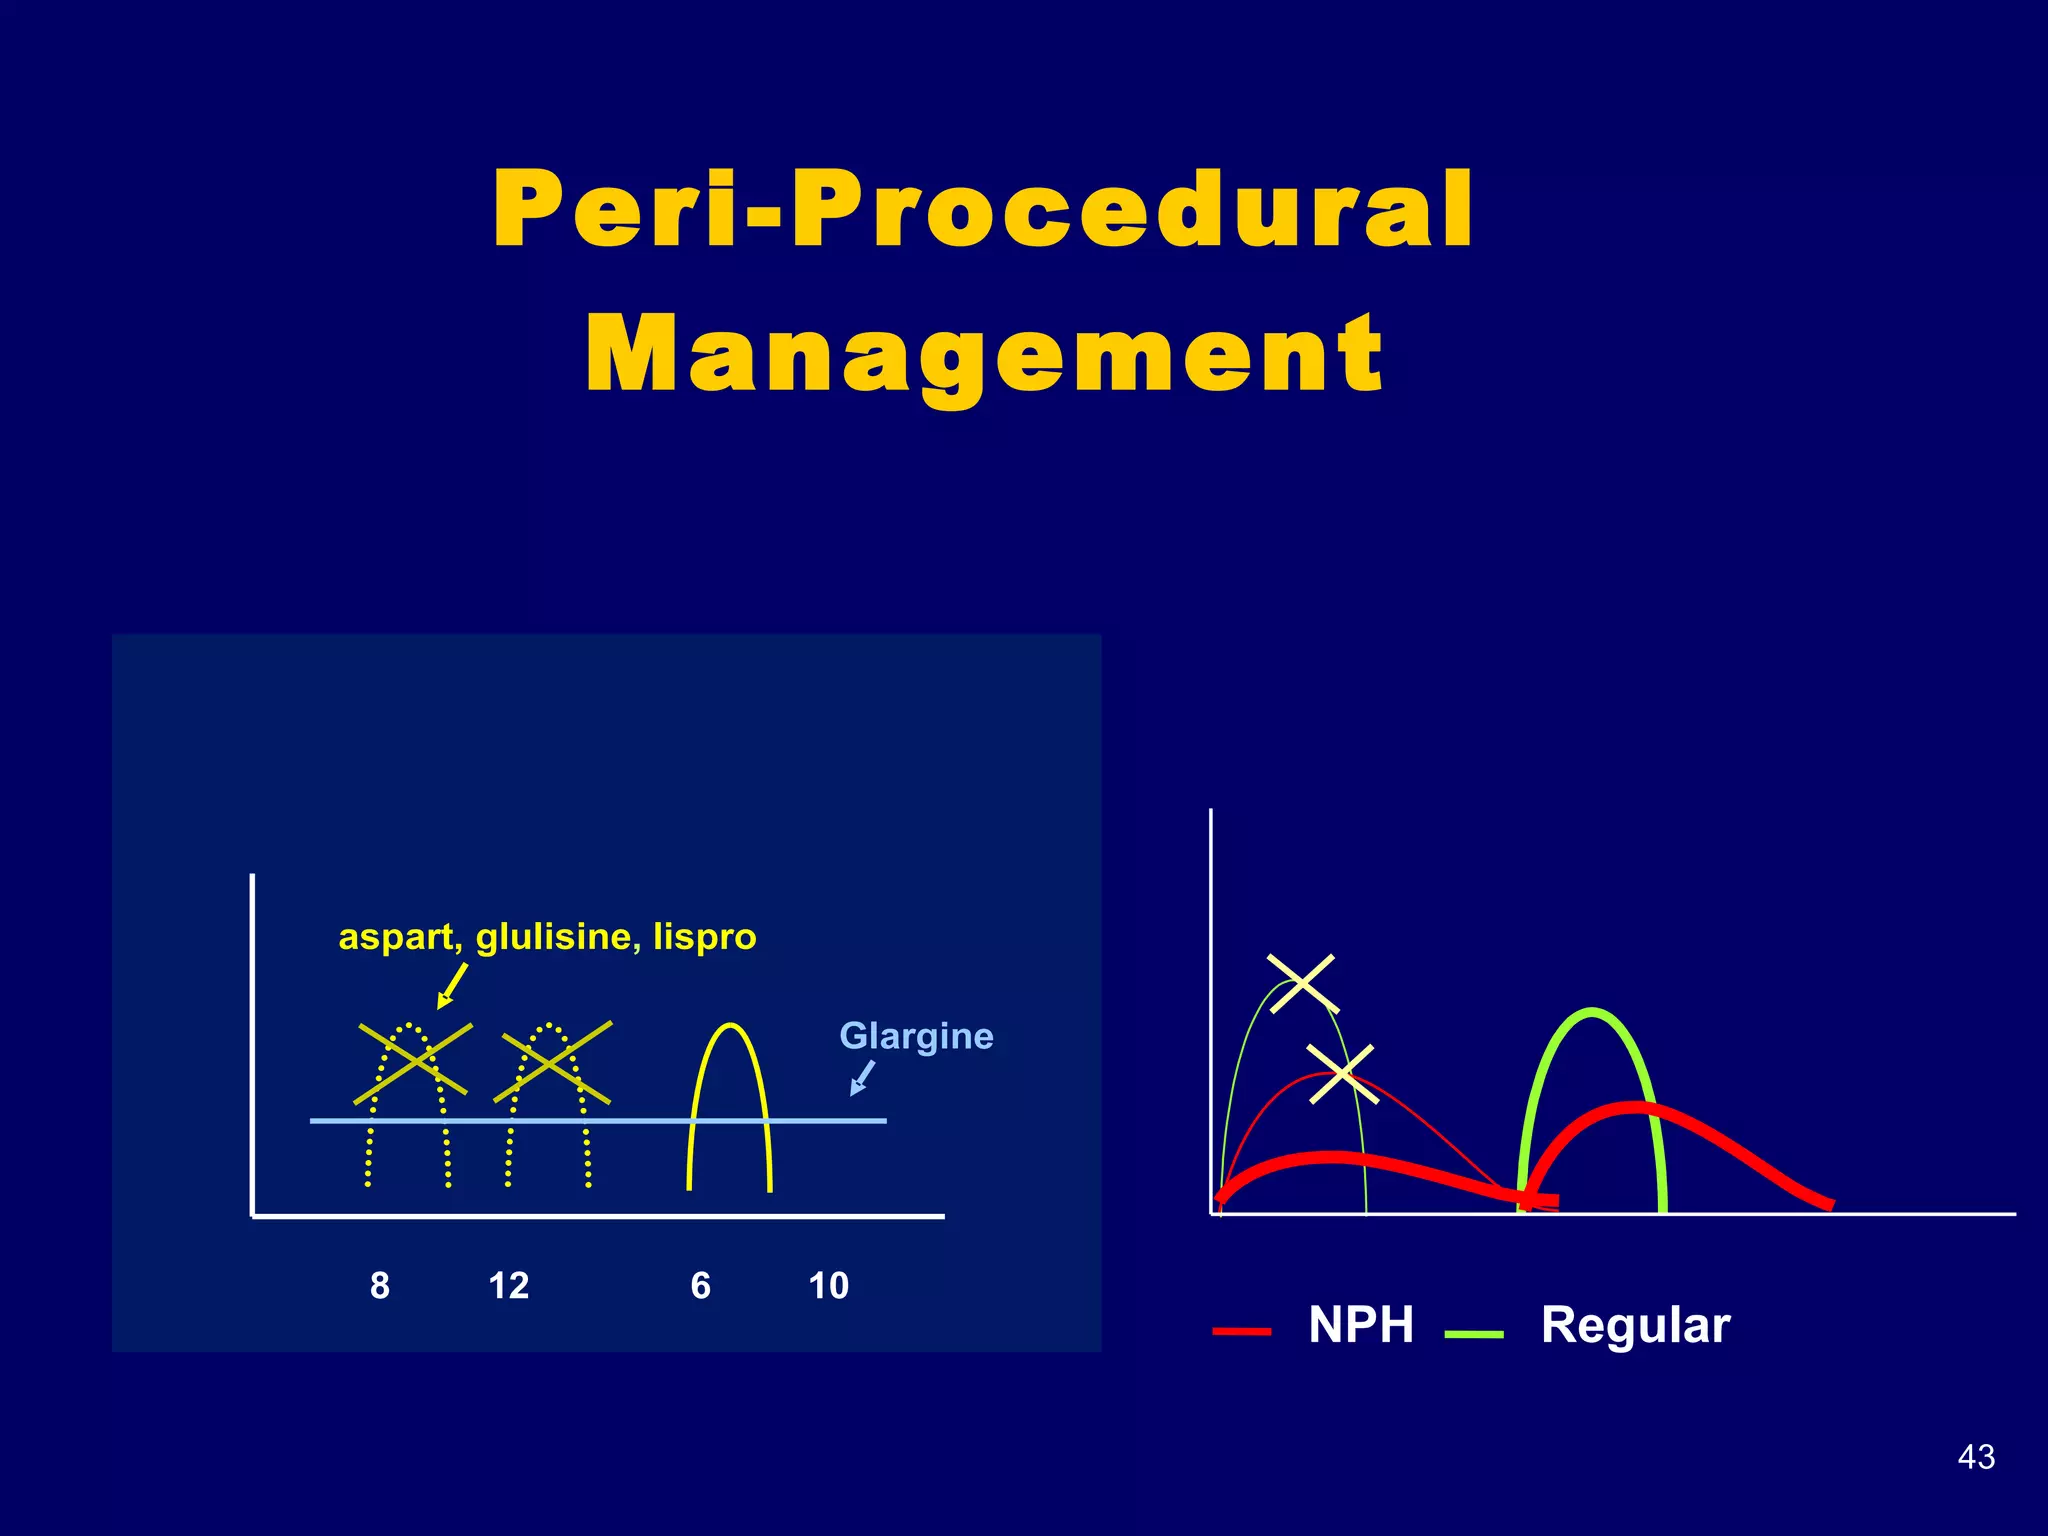


The document discusses inpatient management of hyperglycemia. It provides an overview of studies showing associations between hyperglycemia and poor outcomes in hospitalized patients. It then reviews interventional studies demonstrating that intensive insulin therapy targeting tighter glucose control can improve outcomes. The document discusses strategies for glucose management in the hospital, barriers to control, and different insulin regimens that can be used.


![Nursing 5263 Hypoglycemia And Hyperglyemia[1]](https://cdn.slidesharecdn.com/ss_thumbnails/nursing5263hypoglycemiaandhyperglyemia1-090812233906-phpapp02-thumbnail.jpg?width=640&height=640&fit=bounds)


![Umpierrez%20 inpatient non_icu%20guidelines_7_2010[1][1]](https://cdn.slidesharecdn.com/ss_thumbnails/umpierrez20inpatientnonicu20guidelines7201011-110407140834-phpapp01-thumbnail.jpg?width=640&height=640&fit=bounds)


![Apporach to lung biopsy [Auto-saved].pptx latest](https://cdn.slidesharecdn.com/ss_thumbnails/apporachtolungbiopsyauto-saved-251211225655-93258539-thumbnail.jpg?width=640&height=640&fit=bounds)


