Download to read offline

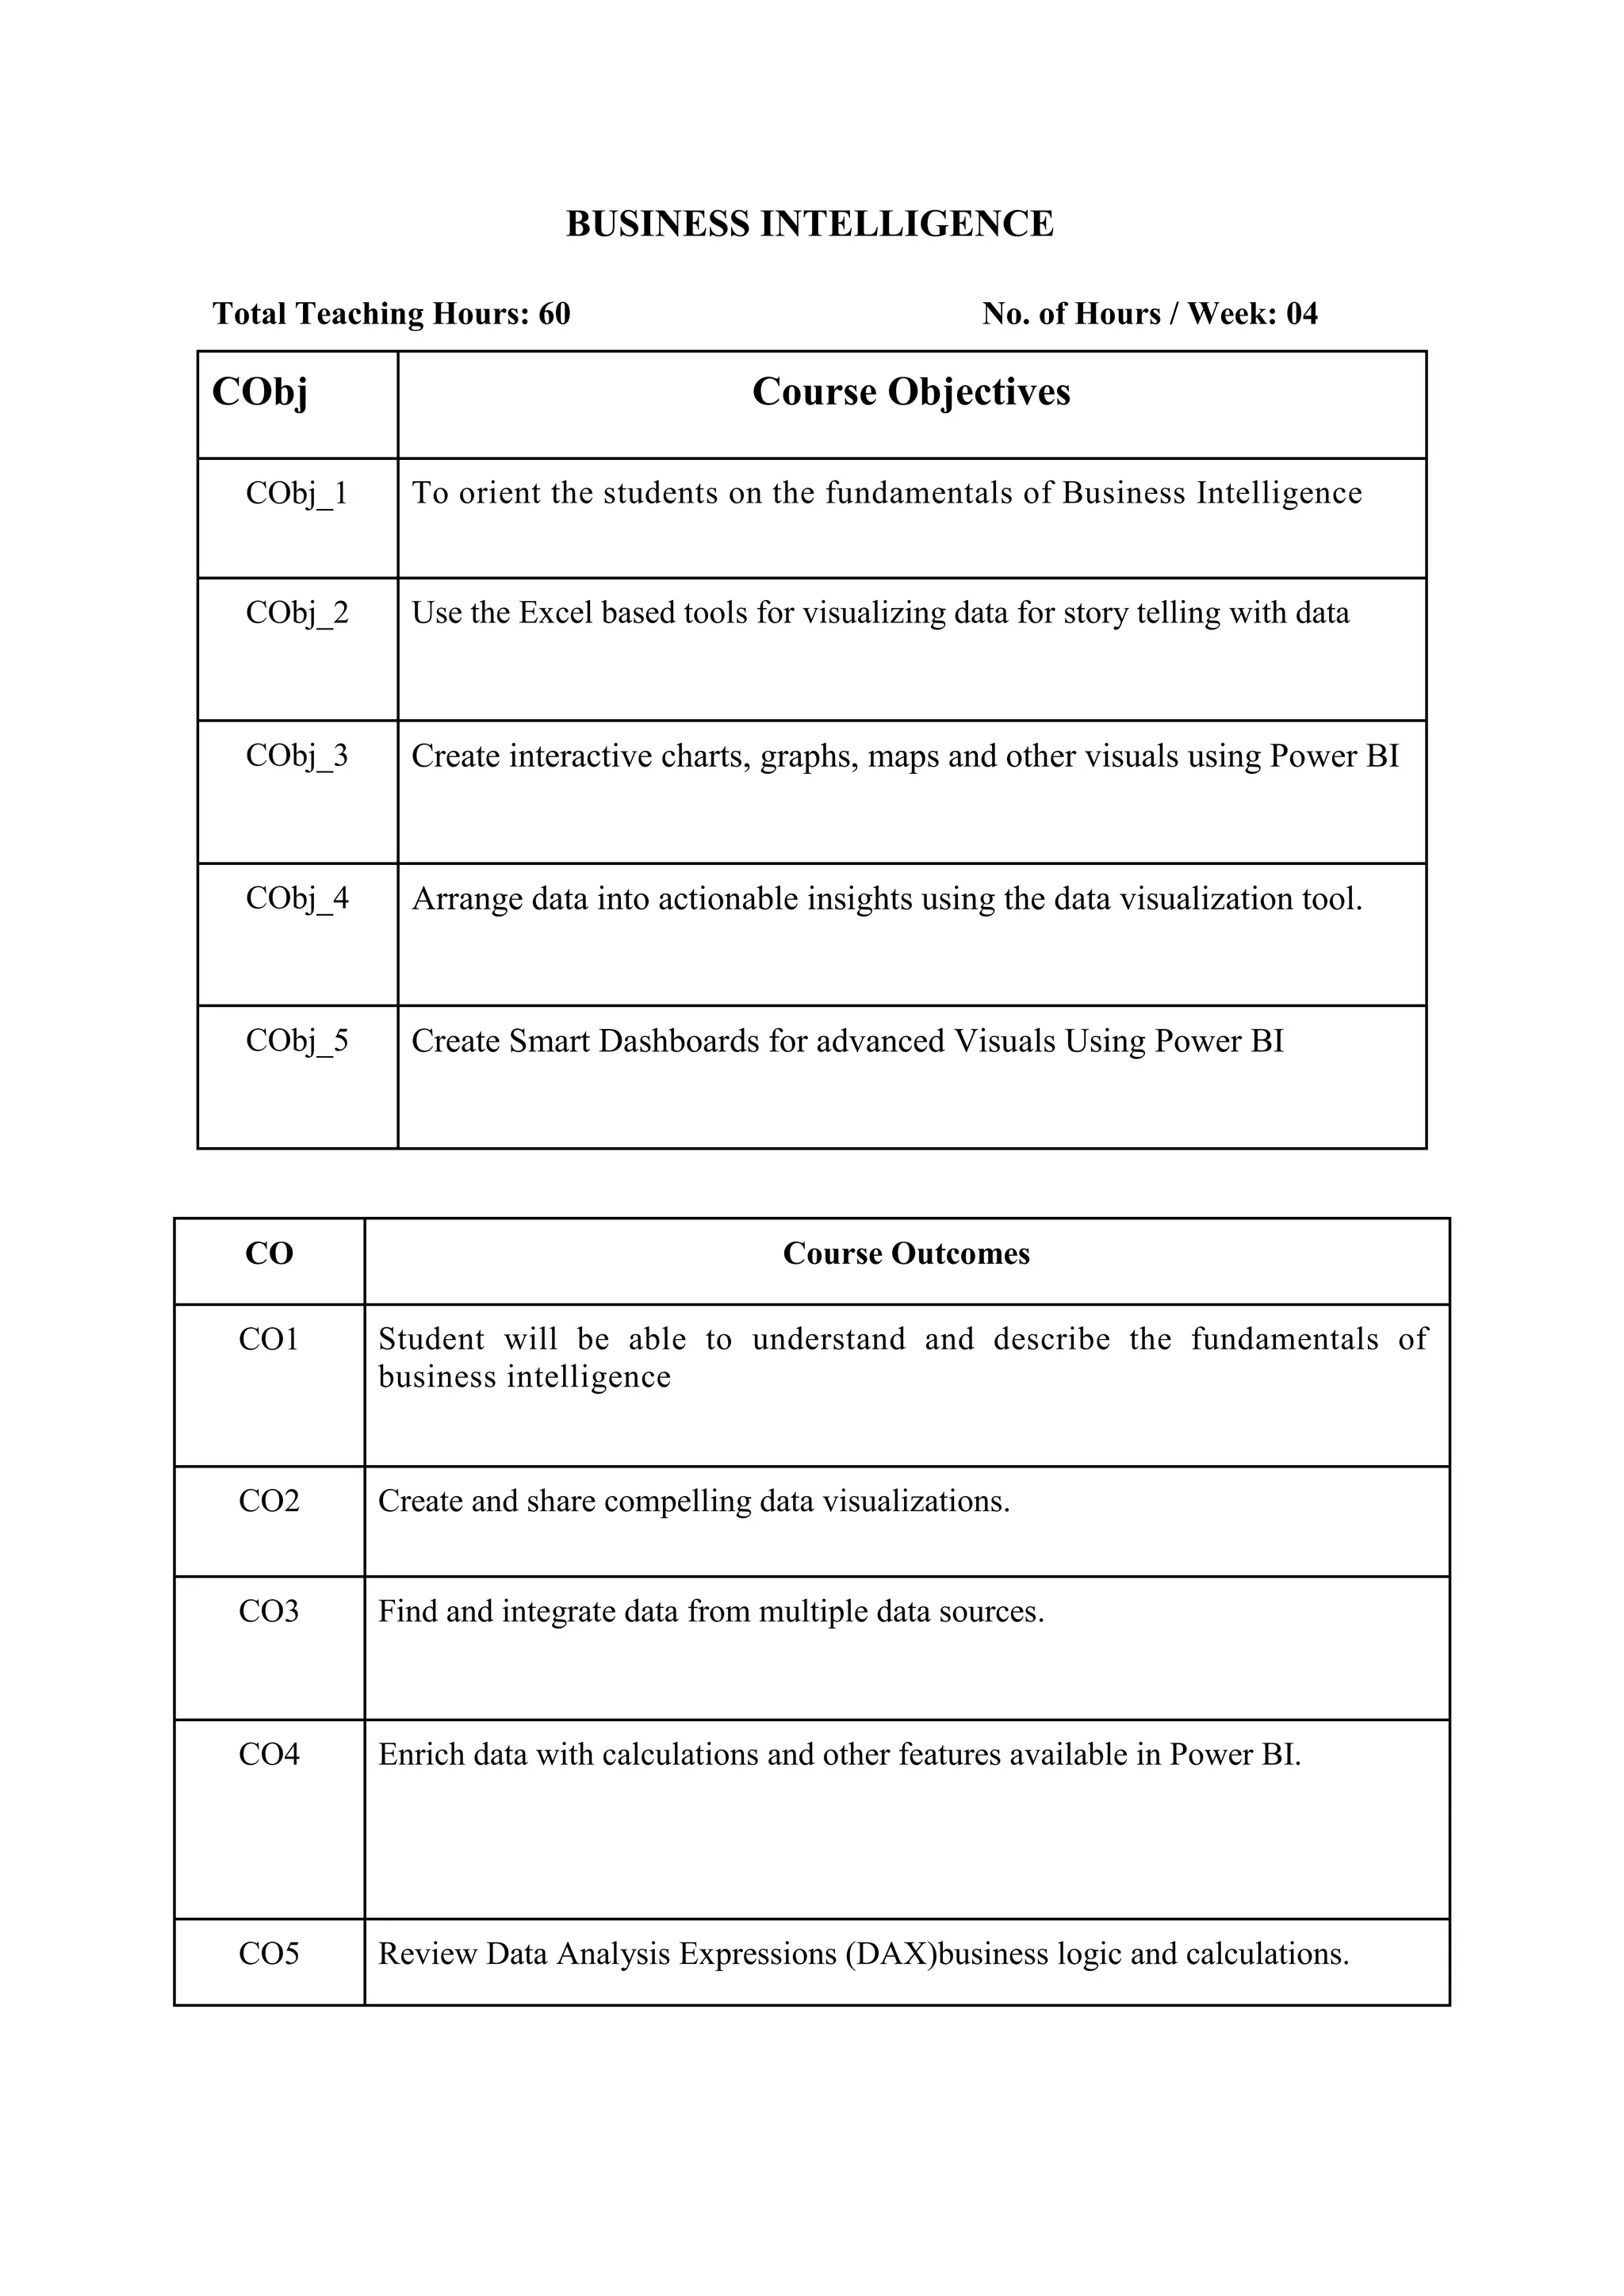
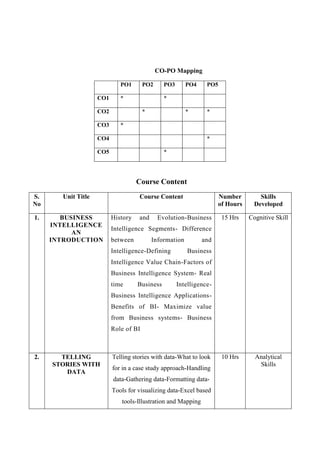
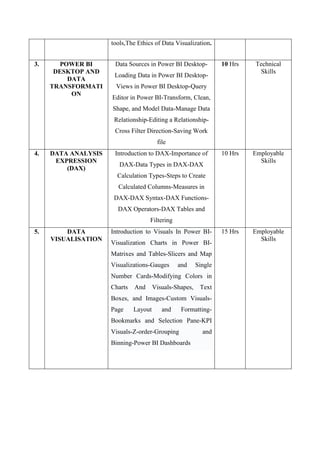


The document outlines a Business Intelligence course that focuses on data visualization and analysis using tools like Excel and Power BI. The course objectives are to teach students the fundamentals of business intelligence, how to visualize data for storytelling, create interactive charts and graphs using Power BI, and arrange data into actionable insights. The course covers topics like business intelligence concepts, data visualization with Excel, data transformation in Power BI, using DAX for calculations, different visualization types in Power BI, and creating dashboards. The intended outcomes are for students to understand and apply business intelligence, create compelling visualizations, integrate data from multiple sources, and perform analysis and calculations in Power BI.