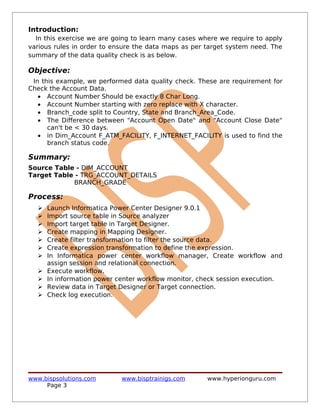
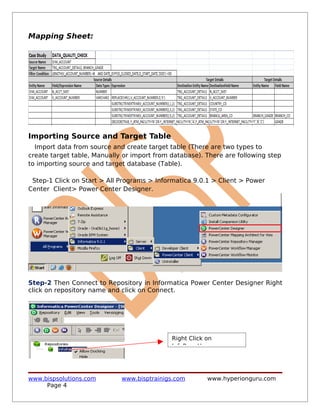
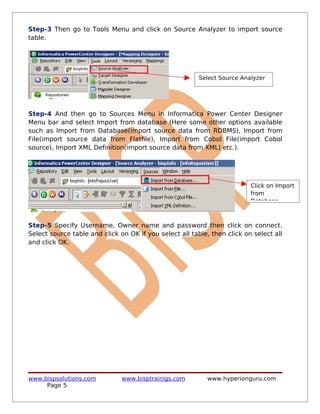
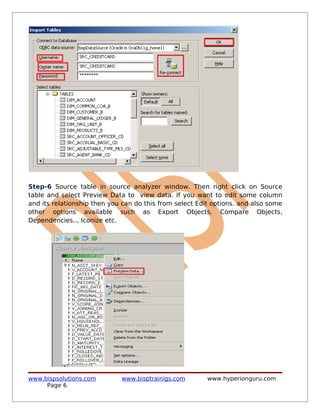
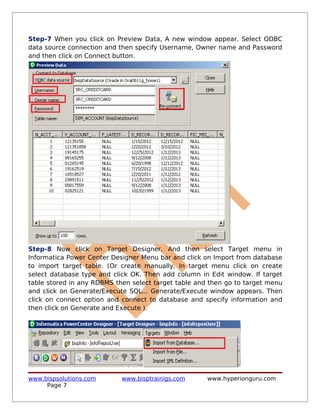
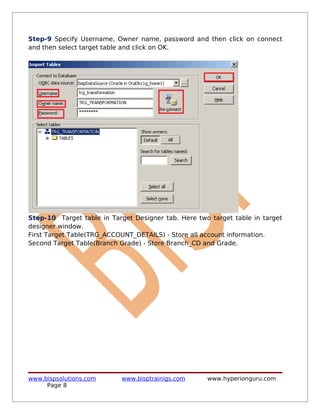
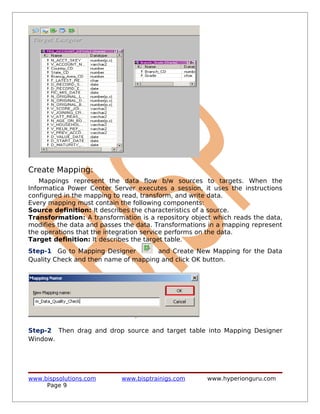
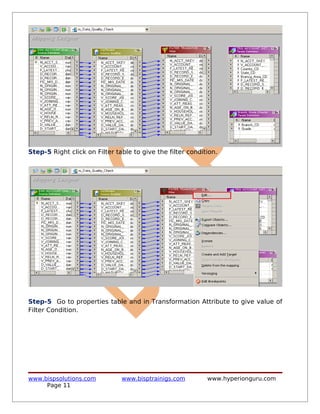
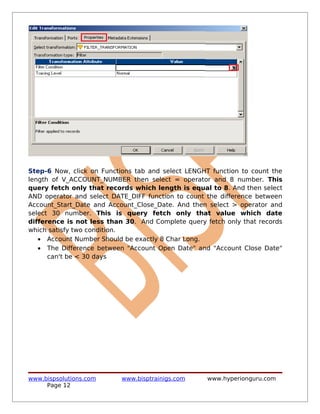
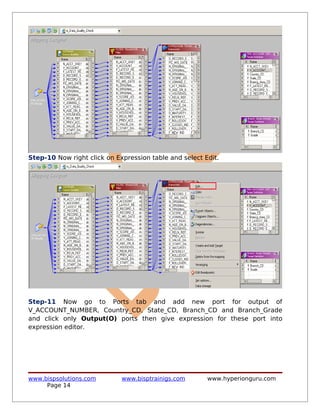
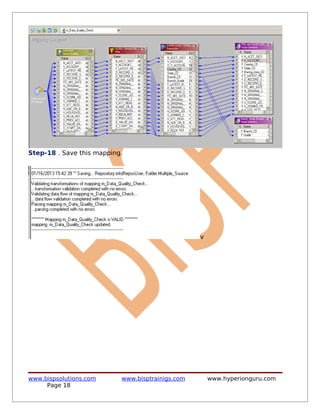
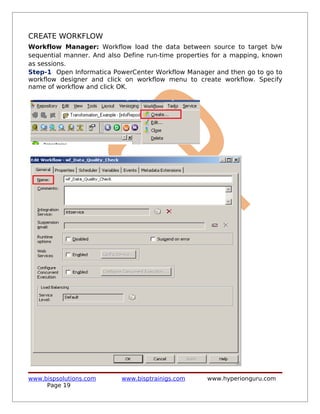
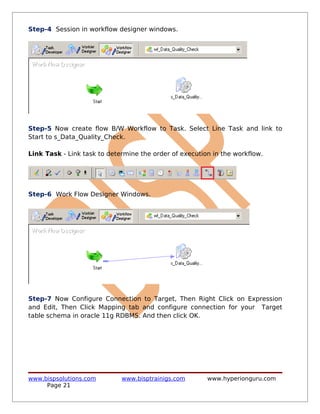
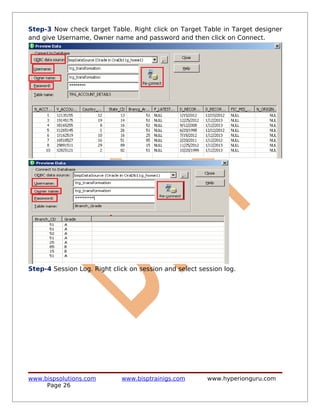
This document provides instructions for creating a mapping in Informatica Power Center to perform data quality checks on financial account data from a source table to load into a target table. It describes importing the source and target tables, creating a filter transformation to select records where the account number length is 8 characters and the difference between open and close dates is not less than 30 days, and generating the mapping. The objective is to map data that meets specific rules for the target system.
This Edureka Informatica Interview Questions tutorial will help you to prepare yourself for Informatica Interviews ( Informatica Interview Questions Blog: https://goo.gl/z4jVff ). Learn about the most important Informatica interview questions and answers and know what will set you apart in the interview process. Below are the topics covered in this Informatica Interview Questions and Answers Tutorial:
Informatica Interview Questions on:
1. Generic Informatica Interview Questions.
2. Informatica Transformation Questions.
3. Informatica Lookup Questions.
4. Informatica Scenario Based questions.
5. Informatica Workflow Questions.
6. Informatica Administrator Questions
The pivot tables are not created mechanically. In Microsoft excel the user should select the data first for which the pivot table should be created. The pivot table option is available on the insert tab. The user has the option of inserting the pivot table either in the existing sheet or creating the pivot table in the new sheet. Copy the link given below and paste it in new browser window to get more information on Pivot Table:- http://www.transtutors.com/homework-help/statistics/pivot-table.aspx
How to Improve Data Analysis Through Visualization in TableauEdureka!
Data Visualization using Tableau will allow one to gain an edge over the other analysts and let you present the data in a much better and insightful manner. It would be easier for the learners to immediately implement it in their workplace and create a real-time dashboard for their management using one of the most sought-after tools.
What are Parameters in Tableau | Tableau Tutorial | EdurekaEdureka!
YouTube Link: https://youtu.be/hvWkGP6yvek
**Tableau Certification Training: https://www.edureka.co/tableau-training **
This Edureka PPT on "Parameters in Tableau" allows you to use aggregated values that aren’t available in your data and incorporate these values into your reports. Learn how to create and control the input to see the results of the effect of the parameter on your data.
The following are the topics covered in the session:
What are the Parameters in Tableau?
Getting Started on the Desktop
Creating a Parameter in Tableau
Using the Parameter in a Calculation
Parameter Control
Using Parameters in your Visualization
Follow us to never miss an update in the future.
YouTube: https://www.youtube.com/user/edurekaIN
Instagram: https://www.instagram.com/edureka_learning/
Facebook: https://www.facebook.com/edurekaIN/
Twitter: https://twitter.com/edurekain
LinkedIn: https://www.linkedin.com/company/edureka
Castbox: https://castbox.fm/networks/505?country=in
50-55 hours Training + Assignments + Actual Project Based Case Studies
All attendees will receive,
Assignment after each module, Video recording of every session
Notes and study material for examples covered.
Access to the Training Blog & Repository of Materials
Excel Tutorials - Creating a Hyperlink in ExcelMerve Nur Taş
Excel Tutorials on Mac. For Mac and for windows.
Creating a hyperlink in excel
Adding a link to excel between sheets
HYPERLINK function
Hyperlink Command
Adding URL's to excel
Presentation is about advance excel advance feature PIVOT Table and contains steps to insert pivot table and some useful features of pivot table in case of large amount of data
Excel 2010 brought with it two new features which extend the usefulness of pivot tables: the slicer and the timeline. They are really useful, among other use cases, when you want to easily monitor indicators in your data. Join our fellow Sheena Opulencia-Calub to learn more about this.
Power BI is a business analytics service by Microsoft. It aims to provide interactive visualizations and business intelligence capabilities with an interface simple enough for end users to create their own reports and dashboards.
This presentation will give you an overview of what Microsoft Power BI is. What are its features. Why it is an upcoming popular Data Visualization tool in the market. How to use it and comparison with other Visualization tools.
BISP is committed to provide BEST learning material to the beginners
and advance learners. In the same series, we have prepared a complete
end-to end Hands-on Guide for building financial data model in
Informatica. The document focuses on how the real world requirement
should be interpreted. The mapping document template with very
simplified steps and screen shots makes the complete learning so easy.
The document focuses This document contains step by step process for
conditional lookup transformation (Unconnected lookup) in Informatica Power
Center 9.0.1. Join our professional training program and learn from
experts.
History:
Informatica power center 9.x developer & admin Basics | Demo | Introduction Kernel Training
Become an expert in ETL i.e. Data Integration & Data Migration Projects Professional by mastering concepts like fundamentals of ETL, Informatica PowerCentre Designer, Manager, Monitor while working on industry based Use-cases and Projects. You can seek Informatica certification from authorized centers.
course Curriculum:
Module 1:
Introduction to Data Warehouse & Business Intelligence
Module 2:
Informatica PowerCenter 9.X – An overview
Module 3:
Informatica PowerCenter Designer With Transformation Techniques
Module 4:
Informatica PowerCenter Workflow Manager & Monitor
Module 5:
Parameters & Variables
Module 6:
Debugging Troubleshooting Error Handling & Recovery
Module 7 :
Performance Tuning & Optimization With Caches Handling
Module 8:
PowerCenter Repository Manager
Module 9:
Informatica Installation, Configuration, Administration Console, Security & Command Line Utilities
Module 10:
Best Practices & Velocity Methodologies
Informatica is a software tool designed to simplify Data Warehouse design and routine tasks related to
data transformation and migration i.e ETL -> Extract,transform and Load.
It is a visual interface and you will be dragging and dropping with the mouse in the Designer(client Application).This graphical approach to communicate with all major databases and can move/transform data between them. It can move huge bulk of data in a very effective way.
Informatica comes in different packages:
Informatica PowerCenter license - has all options, including distributed metadata, ability to organize repositories into a data mart domain and share metadata accross repositories.
PowerMart PowerMart - a limited license (all features except distributed metadata and multiple registered servers)Working
Working with Informatica:
Source database(s), target database(s), repository metadatabase
Informatica Server
Client Software: Designer, Server Manager and Repository Manager.
Informatica provides the market's leading data integration platform. Tested on nearly 500,000 combinations of platforms and applications, the data integration platform inter operates with the broadest possible range of disparate standards, systems, and applications. This unbiased and universal view makes Informatica unique in today's market as a leader in the data integration platform. It also makes Informatica the ideal strategic platform for companies looking to solve data integration issues of any size.
Informatica power center performance tuningdivjeev
For more details visit http://free-informatica-tutorials.blogspot.com
Informatica power center performance tuning.Version 8.6.1
This presentation is a property of INFORMATICA
d5)Go to the following website by clicking on the provided link,OllieShoresna
d5)
Go to the following website by clicking on the provided link, http://www.countyhealthrankings.org/ , and select a county and a state (this may be the county/state in which you reside, attend school, or plan to live and work as an APRN). After reviewing the website and the health outcomes in the County Health Rankings for the area, answer the following questions in a few short sentences as part of your discussion.
1. Briefly list the general statistics pertaining to a specific health concern that is on the rise in selected the city/county.
2. How can the creation of a community health center program help to address this public health problem?
3. What can you as a nurse practitioner and/or nurse leader do to influence policy innovation to resolve the problem?
Assignment #3
Task 1-Perform an association rules analysis
Step 1: First download “Associations.xls” files found on Canvas and import the file into Rapidminer like assignment 2(click File tab to choose “add data”).
Step 2: Drag and drop the file to the Process view.
Step 3: In the Operators view, type “select attributes” to search for “select attributes” operator. Drag and drop the operator to the Process view and connect the two operators as follows. In the Parameters view, set attribute filter type as “single” and select attribute “Seq#”. The last step is to check “invert selection” to select all attributes except Seq#.
Step 4a: In the Operators view, type “Numerical to Binomial” to search for “Numerical to Binomial” operator. Drag and drop the operator to the Process view and connect the operators as follows. In the Parameters view, set attribute filter type as “all” to convert all attributes from Numerical to Binomial. Then click the blue run button to run the operator.
Step 4b: Click the “Results” tab and check “ExampleSet (Numerical to Binomial)” tab to make sure all attributes are set.
Step 5: Switch back to Design view. In the Operators view, type “FP-Growth” to search for “FP-Growth” operator. Drag and drop the operator to the Process view and connect the operators as follows. In the Parameters view, uncheck “find min number of itemsets” and set min support as 0.1 and max items as 3.
Step 6a: In the Operators view, type “create association” to search for “Create Association Rules” operator. Drag and drop the operator to the Process view and connect the operators as follows. In the Parameters view, select “confidence” for criterion and set min confidence at 0.4. Click the blue run button.
Step 6b: Click “Results” tab and then “AssociationRules (Create Association Rules)” tab to check out the values of confidence and lift.
Step 7: Save the Rapidminer file. Click “File” button to select “Export Process” to save the file in the local path.
Task 2-Perform a cluster analysis
Step 1: First download “BathSoap.xls” files found on Canvas and import the file into Rapidminer like assignment 1 and 2. Make sure to selec ...
1. Informatica Power Center 9.0.1
Building Financial Data Mode - Lab#28
Complex Data Transformation Guide I
Description:
BISP is committed to provide BEST learning material to the
beginners and advance learners. In the same series, we have
prepared a complete end-to end Hands-on Guide for building
financial data model in Informatica. The document focuses on how
the real world requirement should be interpreted. The mapping
document template with very simplified steps and screen shots
makes the complete learning so easy. The document focuses on
various data transformation required to while loading data to the
transaction system. Join our professional training program and learn
from experts.
History:
Version Description Change Author Publish Date
0.1 Initial Draft Upendra Upadhyay 12th Aug 2011
0.1 Review#1 Amit Sharma 18th Aug 2011
www.bispsolutions.com www.bisptrainigs.com www.hyperionguru.com
Page 1
2. Table of Contents
Table of Contents.............................................................................................................2
Introduction: .................................................................................................................. 3
Objective:..................................................................................................................... 3
Summary:..................................................................................................................... 3
Process:........................................................................................................................ 3
Mapping Sheet:.............................................................................................................4
Importing Source and Target Table.................................................................................4
Create Mapping: .............................................................................................................9
CREATE WORKFLOW .....................................................................................................19
Execute Workflow, Review data and Check log File.......................................................25
www.bispsolutions.com www.bisptrainigs.com www.hyperionguru.com
Page 2
3. Introduction:
In this exercise we are going to learn many cases where we require to apply
various rules in order to ensure the data maps as per target system need. The
summary of the data quality check is as below.
Objective:
In this example, we performed data quality check. These are requirement for
Check the Account Data.
• Account Number Should be exactly 8 Char Long.
• Account Number starting with zero replace with X character.
• Branch_code split to Country, State and Branch_Area_Code.
• The Difference between "Account Open Date" and "Account Close Date"
can't be < 30 days.
• in Dim_Account F_ATM_FACILITY, F_INTERNET_FACILITY is used to find the
branch status code.
Summary:
Source Table - DIM_ACCOUNT
Target Table - TRG_ACCOUNT_DETAILS
BRANCH_GRADE
Process:
Launch Informatica Power Center Designer 9.0.1
Import source table in Source analyzer
Import target table in Target Designer.
Create mapping in Mapping Designer.
Create filter transformation to filter the source data.
Create expression transformation to define the expression.
In Informatica power center workflow manager, Create workflow and
assign session and relational connection.
Execute workflow.
In information power center workflow monitor, check session execution.
Review data in Target Designer or Target connection.
Check log execution.
www.bispsolutions.com www.bisptrainigs.com www.hyperionguru.com
Page 3
4. Mapping Sheet:
Importing Source and Target Table
Import data from source and create target table (There are two types to
create target table, Manually or import from database). There are following step
to importing source and target database (Table).
Step-1 Click on Start > All Programs > Informatica 9.0.1 > Client > Power
Center Client> Power Center Designer.
Step-2 Then Connect to Repository in Informatica Power Center Designer Right
click on repository name and click on Connect.
Right Click on
InfoRepoUser.
www.bispsolutions.com www.bisptrainigs.com www.hyperionguru.com
Page 4
5. Step-3 Then go to Tools Menu and click on Source Analyzer to import source
table.
Select Source Analyzer
Step-4 And then go to Sources Menu in Informatica Power Center Designer
Menu bar and select Import from database (Here some other options available
such as Import from Database(import source data from RDBMS), Import from
File(import source data from Flatfile), Import from Cobol File(import Cobol
source), Import XML Definition(import source data from XML) etc.).
Click on Import
from
Database.
Step-5 Specify Username, Owner name and password then click on connect.
Select source table and click on OK if you select all table, then click on select all
and click OK.
www.bispsolutions.com www.bisptrainigs.com www.hyperionguru.com
Page 5
6. Step-6 Source table in source analyzer window. Then right click on Source
table and select Preview Data to view data. If you want to edit some column
and its relationship then you can do this from select Edit options. and also some
other options available such as Export Objects, Compare Objects,
Dependencies.., Iconize etc.
www.bispsolutions.com www.bisptrainigs.com www.hyperionguru.com
Page 6
7. Step-7 When you click on Preview Data, A new window appear. Select ODBC
data source connection and then specify Username, Owner name and Password
and then click on Connect button.
Step-8 Now click on Target Designer. And then select Target menu in
Informatica Power Center Designer Menu bar and click on Import from database
to import target table. (Or create manually, In target menu click on create
select database type and click OK. Then add column in Edit window. If target
table stored in any RDBMS then select target table and then go to target menu
and click on Generate/Execute SQL... Generate/Execute window appears. Then
click on connect option and connect to database and specify information and
then click on Generate and Execute ).
www.bispsolutions.com www.bisptrainigs.com www.hyperionguru.com
Page 7
8. Step-9 Specify Username, Owner name, password and then click on connect
and then select target table and click on OK.
Step-10 Target table in Target Designer tab. Here two target table in target
designer window.
First Target Table(TRG_ACCOUNT_DETAILS) - Store all account information.
Second Target Table(Branch Grade) - Store Branch_CD and Grade.
www.bispsolutions.com www.bisptrainigs.com www.hyperionguru.com
Page 8
9. Create Mapping:
Mappings represent the data flow b/w sources to targets. When the
Informatica Power Center Server executes a session, it uses the instructions
configured in the mapping to read, transform, and write data.
Every mapping must contain the following components:
Source definition: It describes the characteristics of a source.
Transformation: A transformation is a repository object which reads the data,
modifies the data and passes the data. Transformations in a mapping represent
the operations that the integration service performs on the data.
Target definition: It describes the target table.
Step-1 Go to Mapping Designer and Create New Mapping for the Data
Quality Check and then name of mapping and click OK button.
Step-2 Then drag and drop source and target table into Mapping Designer
Window.
www.bispsolutions.com www.bisptrainigs.com www.hyperionguru.com
Page 9
10. Step-3 Then Create Filter transformation for filter data means Account
Number Should be exactly 8 Char Long and The Difference between
"Account Open Date" and "Account Close Date" can't be less than 30
days.
Select Filter
transformation in drop
down.
Step-4 Now, passes all source qualifier column into filter table.
www.bispsolutions.com www.bisptrainigs.com www.hyperionguru.com
Page 10
11. Step-5 Right click on Filter table to give the filter condition.
Step-5 Go to properties table and in Transformation Attribute to give value of
Filter Condition.
www.bispsolutions.com www.bisptrainigs.com www.hyperionguru.com
Page 11
12. Step-6 Now, click on Functions tab and select LENGHT function to count the
length of V_ACCOUNT_NUMBER then select = operator and 8 number. This
query fetch only that records which length is equal to 8. And then select
AND operator and select DATE_DIFF function to count the difference between
Account_Start_Date and Account_Close_Date. And then select > operator and
select 30 number. This is query fetch only that value which date
difference is not less than 30. And Complete query fetch only that records
which satisfy two condition.
• Account Number Should be exactly 8 Char Long.
• The Difference between "Account Open Date" and "Account Close Date"
can't be < 30 days
www.bispsolutions.com www.bisptrainigs.com www.hyperionguru.com
Page 12
13. Step-7 Now, click on Validate button to validate it.
Step-8 Now create expression transformation for split the account number into
COUNTRY_CD, STATE_CD, BRANCH_CD and if account number starting with zero
then replace with x character. And also define its grade.
Step-9 Now passes all filter table column into expression transformation table
www.bispsolutions.com www.bisptrainigs.com www.hyperionguru.com
Page 13
14. Step-10 Now right click on Expression table and select Edit.
Step-11 Now go to Ports tab and add new port for output of
V_ACCOUNT_NUMBER, Country_CD, State_CD, Branch_CD and Branch_Grade
and click only Output(O) ports then give expression for these port into
expression editor.
www.bispsolutions.com www.bisptrainigs.com www.hyperionguru.com
Page 14
15. Step-12 Now select ReplaceChr function from function tab and select column
and then specify condition and validate it.
www.bispsolutions.com www.bisptrainigs.com www.hyperionguru.com
Page 15
16. Step-13 Now select SUBSRT from function tab and select LTRIM and RTRIM
function from function then specify condition and validate it.
Step-14 Now select SUBSRT from function tab and select LTRIM and RTRIM
function from function then specify condition and validate it
Step-15 Now select SUBSRT from function tab and select LTRIM and RTRIM
function from function then specify condition and validate it
www.bispsolutions.com www.bisptrainigs.com www.hyperionguru.com
Page 16
17. Step-16 Now select DECODE function from function tab and then specify
condition to give grade for facility for ATM and Internet banking.
Step-17 Then Create Mapping.
www.bispsolutions.com www.bisptrainigs.com www.hyperionguru.com
Page 17
18. Step-18 . Save this mapping.
v
www.bispsolutions.com www.bisptrainigs.com www.hyperionguru.com
Page 18
19. CREATE WORKFLOW
Workflow Manager: Workflow load the data between source to target b/w
sequential manner. And also Define run-time properties for a mapping, known
as sessions.
Step-1 Open Informatica PowerCenter Workflow Manager and then go to go to
workflow designer and click on workflow menu to create workflow. Specify
name of workflow and click OK.
www.bispsolutions.com www.bisptrainigs.com www.hyperionguru.com
Page 19
20. Step-2 Workflow Designer.
Step-3 Create Task and assign session, Click on Task menu and click on create
and then name of session, click Create, select mapping and click OK.
SESSION - A session is a set of instructions that tells the Power Center Server
how and when to move data from sources to targets.
www.bispsolutions.com www.bisptrainigs.com www.hyperionguru.com
Page 20
21. Step-4 Session in workflow designer windows.
Step-5 Now create flow B/W Workflow to Task. Select Line Task and link to
Start to s_Data_Quality_Check.
Link Task - Link task to determine the order of execution in the workflow.
Step-6 Work Flow Designer Windows.
Step-7 Now Configure Connection to Target, Then Right Click on Expression
and Edit, Then Click Mapping tab and configure connection for your Target
table schema in oracle 11g RDBMS. And then click OK.
www.bispsolutions.com www.bisptrainigs.com www.hyperionguru.com
Page 21
22. Step-8 In Mapping. Specify Connection and property.
Step-9 Set These property for target table.
• Insert: Check this option to insert a row in the target table.
• Delete: Check this option to delete a row in the target table.
• Truncate Table: check this option to truncate the target table before
loading the data.
• Update as Update: Update the row in the target table.
• Update as Insert: Insert the row which is flagged as update.
• Update else Insert: If the row exists in the target table, then update the
row. Otherwise, insert the row.
www.bispsolutions.com www.bisptrainigs.com www.hyperionguru.com
Page 22
23. Set property for TRG_ACCOUNT_DETAILS.
Step-10 Set These Set property for Branch_Grade.
www.bispsolutions.com www.bisptrainigs.com www.hyperionguru.com
Page 23
24. Step-11 Now save (ctrl+s) this workflow and check it.
www.bispsolutions.com www.bisptrainigs.com www.hyperionguru.com
Page 24
25. Execute Workflow, Review data and Check log File
Workflow monitor: Workflow monitor is helpful in monitoring and tracking the
workflow created in Informatica power center.
Step-1 Now Start Workflow, Right click on Workflow Designer Window and Click
on Start Workflow.
Step-2 Check session in Informatica PowerCenter Workflow Monitor.
Target table Session successfully
www.bispsolutions.com www.bisptrainigs.com www.hyperionguru.com
Page 25
26. Step-3 Now check target Table. Right click on Target Table in Target designer
and give Username, Owner name and password and then click on Connect.
Step-4 Session Log. Right click on session and select session log.
www.bispsolutions.com www.bisptrainigs.com www.hyperionguru.com
Page 26