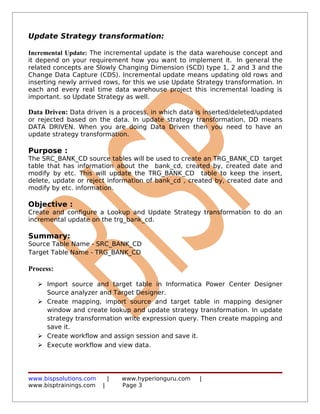
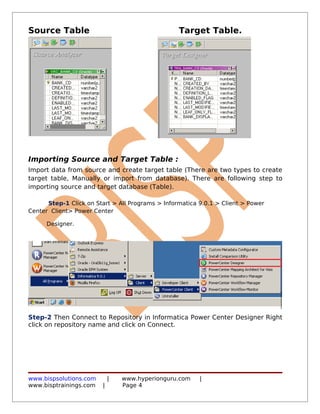
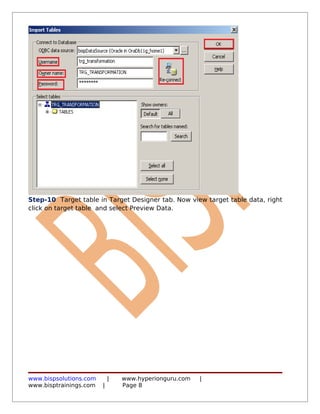
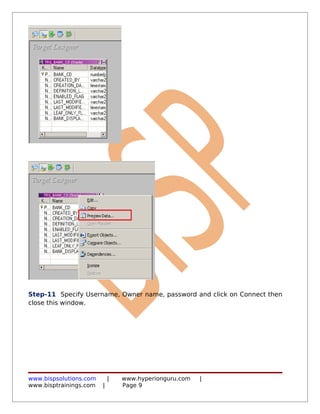
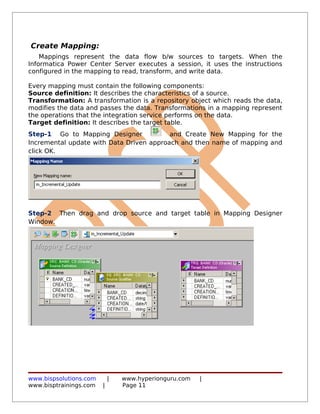
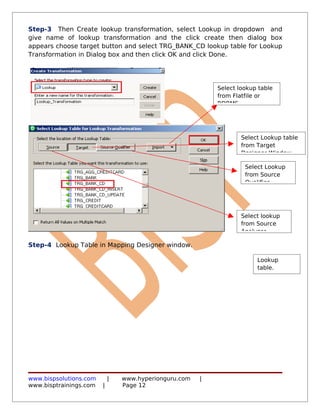
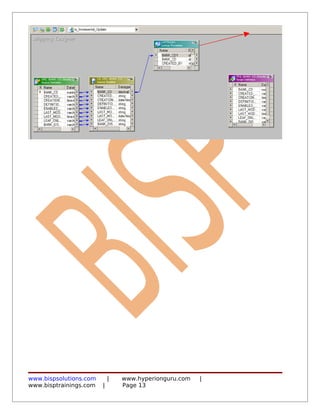
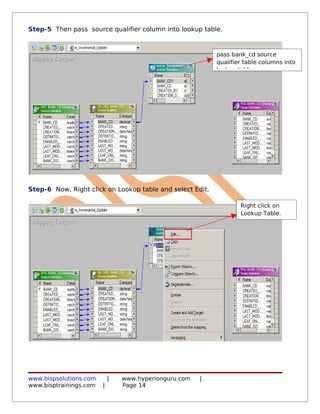
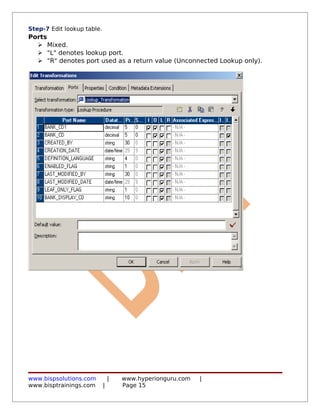
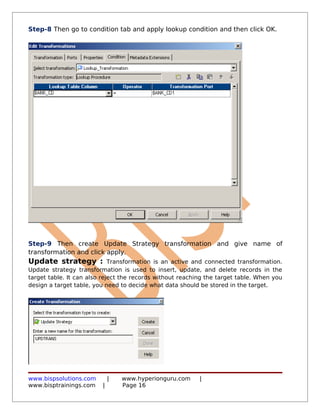
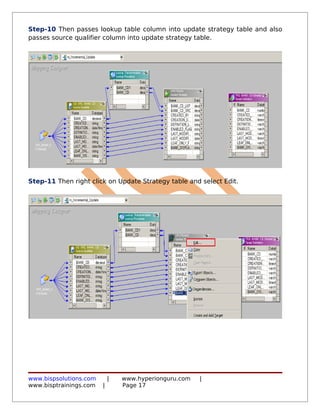
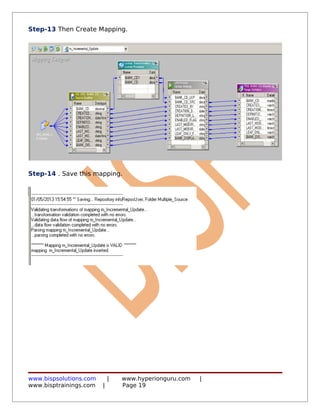
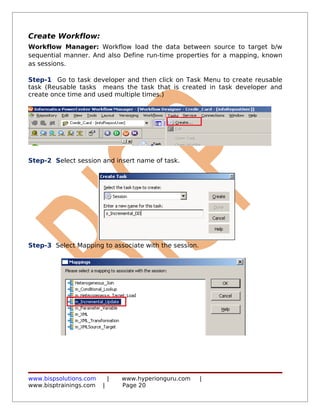
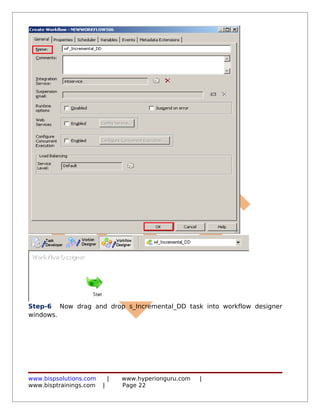
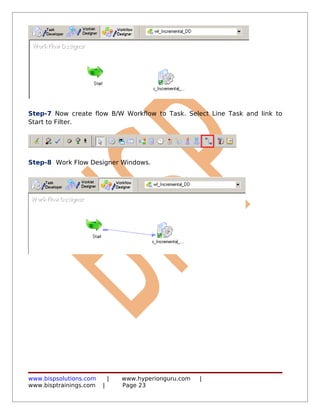
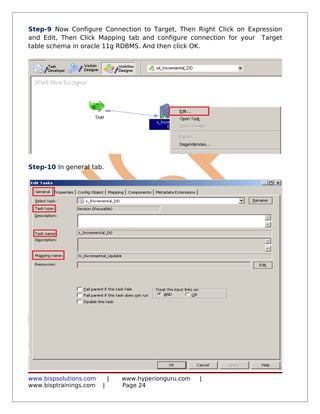
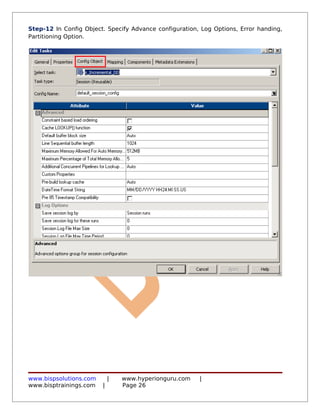
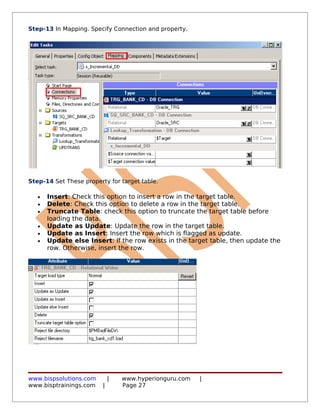
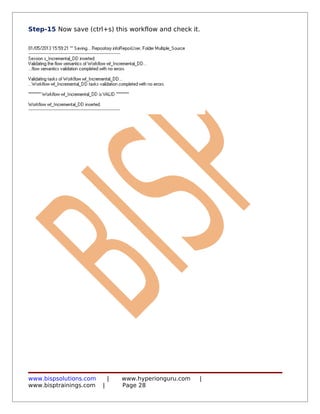
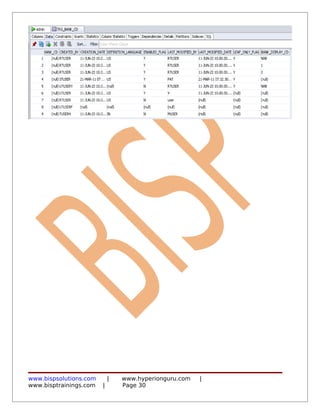
The document provides steps to create an incremental data load from a source table (SRC_BANK_CD) to a target table (TRG_BANK_CD) using Informatica PowerCenter. This involves importing the source and target tables, creating a mapping with Lookup and Update Strategy transformations, building a reusable session, creating a workflow assigning the session, executing the workflow, and reviewing the target data and logs. The goal is to update, insert, and delete records in the target table to maintain consistent data using an incremental, data-driven approach.
The document describes how to perform XML transformations in Informatica PowerCenter. It discusses XML source qualifier, XML parser, and XML generator transformations. It then provides steps to import an Oracle source table and XML target, create a mapping between them, build a workflow to execute the mapping, run the workflow, and view the data loaded to the XML target.
Here are the key steps to create a mapping in Informatica PowerCenter:
1. Open the Mapping Designer and create a new mapping
2. Drag and drop the source and target tables from the Repository Navigator into the mapping area
3. Create an Expression Transformation and name it appropriately
4. Connect the source table ports to the Expression Transformation ports
5. Right click the Expression Transformation and select 'Edit' to open the Expression Editor
6. In the Expression Editor, add a dummy output port for the field to be calculated/transformed
7. Write the expression in the Expression Editor to calculate/transform the field value based on the business logic
8. Connect the Expression Transformation output port
BISP is committed to provide BEST learning material to the beginners
and advance learners. In the same series, we have prepared a complete
end-to end Hands-on Guide for building financial data model in
Informatica. The document focuses on how the real world requirement
should be interpreted. The mapping document template with very
simplified steps and screen shots makes the complete learning so easy.
The document focuses This document contains step by step process for
conditional lookup transformation (Unconnected lookup) in Informatica Power
Center 9.0.1. Join our professional training program and learn from
experts.
History:
This document provides instructions for creating a mapping in Informatica Power Center to perform data quality checks on financial account data from a source table to load into a target table. It describes importing the source and target tables, creating a filter transformation to select records where the account number length is 8 characters and the difference between open and close dates is not less than 30 days, and generating the mapping. The objective is to map data that meets specific rules for the target system.
This document provides instructions on migrating objects in Informatica Power Center 9.0.1. It discusses the different types of Informatica repositories and how to create and configure a repository. It then describes how to migrate objects between repositories or folders using drag and drop or XML export/import. The key steps involve connecting to the source and target repositories, selecting the object to migrate, resolving any conflicts, and verifying the migrated object in the target location.
The document provides information about various log files created by Informatica PowerCenter including session logs, workflow logs, reject files, target files, cache files, and row error logs. It describes the purpose and contents of each log file and provides steps to view the log files in the Informatica repository and file system. Tracing levels that can be configured at the session and transformation levels are also discussed.
The document provides information about various log files created in Informatica PowerCenter 9.0.1 including session logs, workflow logs, reject files, target files, cache files, and how to configure different tracing levels. It describes how each log file type is used, where they are located by default, and how to view and modify settings for the log files in the PowerCenter designer and workflow manager user interfaces.
The document provides an overview of Informatica PowerCenter components and functions. It discusses:
- The Informatica repository which stores all metadata created in the client tools.
- The main components of PowerCenter which are the Repository Manager, Designer, and Workflow Manager.
- How the Designer is used to connect to sources and targets, build mappings and transformations, and create sessions.
- How the Workflow Manager is used to create workflows containing tasks like sessions that are run by the Informatica Server to extract, transform and load data.
Informatica Online Training By Keylabstraining.com with Real time and certified consultants. In this Informatica Training we will teach you basic Data base training and also we will cover some Unix concepts . And also we can provide you Video recordings.
Contact: info@keylabstraining.com , +91- 9550645679(IND) , +1-908-366-7933( USA).
Informatica Power Center - Workflow ManagerZaranTech LLC
The document discusses various workflow tasks in Informatica PowerCenter including sessions, commands, email, decision, assignment, timer, control, event raise, and event wait tasks. It provides examples of how to use these tasks to control workflow execution based on conditions, variables, events, timing requirements. Specifically, it presents a business case where sessions need to wait for indicator files but only within a specific time window each day, using assignment, file wait, timer, and command tasks along with link logic.
This document is part of Oracle BI Publisher Certification Program from Adiva Consulting Inc. contact
info@adivaconsulting.com for you corporate training needs and reduce your training cost by 75%
Electronics Library Management System from the WebsiteIJERD Editor
Electronics libraries are libraries in which collections are stored in electronic media formats and accessible via computers. The electronic content may be stored locally, or accessed remotely via computer networks. An electronic library is a type of information retrieval system. In this work MySQL database and php dynamic 3-tire website is design. The tested on this website don as a college virtual library it provide fast and secured system.
This document provides an overview and instructions for creating reports using Crystal Reports. It discusses the benefits of Crystal Reports such as creating various types of reports from any data source. It then provides a step-by-step process for creating a basic report which includes connecting to a database, selecting fields, grouping and summarizing data, and adding style. The document also briefly discusses incorporating Crystal Reports into Visual Basic applications.
This document provides an overview of SAP BusinessObjects capabilities for business intelligence. It describes how SAP BO can extract and integrate data from multiple source systems, aggregate metrics for fast reporting, and facilitate analysis and decisions through semantic layers and reporting tools. The document also covers key SAP BO concepts like dimensions, measures, and how to build queries and reports in Web Intelligence. It concludes with resources for training materials located in shared folders.
Introduction to Oracle Fusion BIP ReportingGurpreet singh
Oracle Fusion Applications uses Oracle Business Intelligence platform for reporting and analytics. There are three main types of reports: operational reports for statutory requirements, analytics for interactive data visualizations, and dashboards that combine different reporting components. The document then outlines the steps to create a sample report in Oracle Business Intelligence Publisher (BIP), including defining a data model, creating a report layout using the wizard or manually, and running the report online or scheduling as a job. It also discusses various report layout properties that can be configured.
This document provides an overview of the course "Visual Basic and Databases". It discusses what will be covered in the course including understanding how to use Visual Basic as a front-end interface to build database applications. It also reviews the basic concepts of databases, how Visual Basic fits into database management systems, and the steps to build a Visual Basic application. The requirements to complete the course are also outlined.
This document provides information on data models in BI Publisher and their components. A data model contains instructions to retrieve structured data from one or more sources to generate BI Publisher reports. It can extract, transform, and aggregate data. Key components of a data model include data sets, triggers, flexfields, lists of values, parameters, and bursting definitions. The data model editor allows users to link data between sets, perform calculations, and select from various data sources when building a data model. It provides an interface to design the data structure and properties. Parameters and lists of values can be added to allow for user filtering of report data.
- The PowerPivot data refresh problem needs to be fixed by using the PowerPivot Configuration Tool and selecting the Configure or Repair PowerPivot for SharePoint option, as the Secure Store Service target application used for unattended data refresh has been deleted.
- The SSISOwners SQL Server login needs to be mapped to the SSISDB database and assigned to the db_ssisadmin role to grant appropriate permissions for ETL administrators.
- A Regional Sales report needs to be created using a PivotTable in Excel 2010 or a matrix in SQL Server Report Builder to allow filtering by year and drilling down through the Products hierarchy while highlighting sales values under $5,000 in red.
***First Half***
Introduction to Oracle Fusion Middleware and Oracle ADF
Getting started with JDeveloper
Building a Business Model with ADF Business Components
Querying and persisting data
Exposing Data
Declaratively Customizing Data Services
Programmatically Customizing Data Services
Validating User Inputs
***Second Half***
Understanding UI Technology
Binding UI Components to Data
Planning the User Interface
Passing values between UI Elements
Responding to Application Events
Implementing Transactional Capabilities
This document provides an overview of Oracle Reports and its components. It discusses that Oracle Reports is a reporting tool that generates reports by retrieving data from an Oracle database. It has several components including the Object Navigator, Data Model Editor, Layout Model Editor, and Parameter Form Editor. The Data Model Editor defines the data and queries, the Layout Model Editor designs the report layout, and the Parameter Form allows users to input values. Triggers can be used to format fields and handle errors/warnings.
This document provides an overview of the Business Intelligence and Reporting Tool (BIRT). It discusses BIRT's architecture and components, how to connect to data sources and create reports using the report designer, and how to preview and deploy reports. Key features covered include working with charts, cross tabs, groups, filters, and parameters.
This document provides instructions for developing SQL Server Reporting Services (SSRS) reports for Microsoft Dynamics AX. It covers SSRS installation and configuration, editing existing reports, developing new query-based and report data provider (RDP)-based reports using Visual Studio, previewing and deploying reports, and using controller classes to modify report behavior. Key steps include creating AX queries and temporary tables, developing report datasets and designs in Visual Studio, and deploying reports for viewing in the browser or launching from AX. Controller classes can modify report queries, parameters, and contracts before report execution.
Business intelligence tools help users make better decisions by gathering and analyzing data from various sources. Oracle Reports addresses challenges of accessing massive and distributed data by enabling reports to be generated from multiple data sources and published securely and reliably. It provides wizards to simplify report creation and allows customizing and previewing reports. Reports can be published as paper or dynamic web pages for different audiences using a single definition.
Sap business intelligence 4.0 report basictovetrivel
This 2-day course covers creating and formatting Interactive Analysis reports in Business Objects. The course consists of 5 modules: 1) Introduction to Interactive Analysis Reporting; 2) Creating Interactive Analysis documents; 3) Formatting documents; 4) Working with charts; and 5) Analyzing data. Module 2 focuses on building queries, adding filters and prompts to queries, and creating the first Interactive Analysis report. Key topics covered include writing queries, using different data sources, adding document-level filters and prompts, applying multiple prompts, and previewing data.
This document contains a collection of questions and answers related to Informatica technical interviews. It includes questions about bitmap indexes, deleting duplicate rows from flat files, recovery strategies after a session fails, limitations of joiner transformations, how the server recognizes source and target databases, the purpose of rank indexes in a group, database operation constants and flags, generating reports using Informatica, starting batches within batches, types of groups in a router transformation, types of batches, the PowerCenter repository, differences between dynamic and static caches, the use of source qualifiers, page code compatibility, synonyms, and types of lookup caches.
The document provides steps to perform an incremental update of a target table (TRG_BANK_CD) using a source table (SRC_BANK_CD) in Informatica PowerCenter. This involves importing the source and target tables, creating a mapping with Lookup and Update Strategy transformations, building a reusable session, creating a workflow assigning the session, executing the workflow, and reviewing the target data and logs. The goal is to update, insert, and delete records in the target table based on the source data in an incremental and data-driven manner.
The document provides steps to create an OBIEE11g dashboard for brand analysis. It describes creating various dashboard prompts, filters, and analyses and integrating them into a single dashboard. Specifically, it outlines creating prompts for year, company, weeks between, and product hierarchy. It then provides details on building two initial analyses - a product line analysis pivot table and trending analysis bar graph. The goal is to create a fully functioning sample brand analysis dashboard to help learn OBIEE11g features.
The document provides steps to create an OBIEE11g dashboard for brand analysis. It describes creating various dashboard prompts, filters, and analyses and integrating them into a single dashboard. Specifically, it outlines creating prompts for year, company, weeks between, and product hierarchy. It then provides details on building two initial analyses - a product line analysis pivot table and a trending analysis bar graph. The goal is to create a fully functioning sample brand analysis dashboard to help learners explore OBIEE11g features.
This document provides steps to create an OBIEE 11g dashboard for analyzing brands. It describes creating several dashboard prompts, including for year, company, weeks between, and product hierarchy. It then outlines adding various dashboard components like analyses, charts, and pivots to showcase metrics like product line analysis, trending analysis, revenue by months, daily revenue timeline, top customers, and performance index compared to company average. The tutorial is intended to help OBIEE 11g learners explore features by building this sample brand analysis dashboard.
MBA 580 Power BI User Manual Introduction1Accessing Power BAbramMartino96
MBA 580 Power BI User Manual
Introduction1
Accessing Power BI via the VDI1
Importing Files to Power BI2
Working on the Module Six Milestone Two Assignment4
Creating a Pie Chart4
Exporting Files from Power BI8
Uploading Image Files to OneDrive10
Introduction
Power BI is a tool that enables its users to visualize data and present it in a manner that is easy to understand and analyze.
Accessing Power BI via the VDI
1. Open the virtual desktop interface (VDI) on your machine.
2. On the VDI home screen, select Power BI Desktop. The Power BI homepage is displayed.
Importing Files to Power BI
Once Power BI opens, close out of any message windows that may pop up. On the Power BI homepage, to select the type of file you want to import:
1. Go to File, then choose Get Data, and then choose Text/CSV.
Note: For the steps to access Power BI via the VDI, refer to Accessing Power BI via the VDI.
The Open window is displayed.
2. Go to Desktop, then click on Business Analytics Course Content Folder, and then choose MBA-580. Select the CSV file to be imported and click Open. The preview window with the data set content is displayed.
3. Click Load. The data is imported in Power BI. You can now perform your analysis.
Working on the Module Six Milestone Two Assignment
In MBA 580, you will access Power BI using the VDI in the Module Six Milestone Two assignment. In this assignment, you will create four pie charts and perform your analysis.
Creating a Pie Chart
1. Access Power BI and import the required CSV file.
Note: To learn the process for importing files into Power BI, refer Importing Files to Power BI.
2. In the right pane, under Visualizations, click the pie chart icon.
In the center pane, the pie chart placeholder is displayed.
Note: To view the name of the icon, place your cursor over the icon. For example, to view the name pie chart, place your cursor over the following icon.
3. Using the resizing tool, resize the pie chart placeholder so that it fits the screen.
The placeholder is resized. You can now move ahead and plot the pie chart per the required attributes.
4. To add an attribute, in the right pane, under Fields, drag an attribute and place it under Visualizations in Legend, Details, Values, or Tooltips.
For example, let’s move the attributes Markets and Competitors and Market share percentage for cars and trucks now from Fields to Legend and Values in Visualizations.
This will provide us with the pie chart for analyzing the existing market share of cars and trucks category for the companies VW, Toyota, BMW, and your car company.
The fields are then displayed in the boxes under the Legend and Values, under Visualizations.
5. After moving the two attributes, the pie chart is displayed in the center pane.
Similarly, plot the pie chart for market share percentage for cars and trucks in 2030 and compare the two pie charts displaying the market share percentage for cars and trucks now and the m ...
This document provides guidance on creating a strategy tree, KPIs, and dashboard in OBIEE11g. It discusses creating objectives and assigning KPIs to objectives to measure performance. Steps are provided to create a scorecard with objectives like improving financial results and increasing sales. The document then covers creating a strategy tree and building a dashboard to display the strategy tree. Guidance is given on creating KPIs in OBIEE11g related to metrics like average revenue per employee and billed vs target quantities.
The document provides steps to create an OBIEE11g dashboard with various objects like analysis, charts, maps, and prompts. It begins by creating a dashboard prompt for revenue between a specified range using a slider. It then creates an analysis to show order, revenue, unit price by customer and establishment with filters. Subsequent steps will cover creating a chart and map visualization and integrating them into a single dashboard.
The document provides an overview of the four main tools in Informatica PowerCenter - Designer, Repository Manager, Workflow Manager, and Workflow Monitor. It then focuses on describing the steps to use the Designer tool to create a mapping between a source and target database table, create a session for that mapping, and incorporate the session into a workflow that can be scheduled and monitored.
Sap bo-universe-design-beginner-s-guide-part-iAmit Sharma
The document provides instructions for getting started with SAP BO 4.1 using the Information Design Tool. It includes steps to create a project, connect to a database to build a universe, insert tables and create joins in the data foundation layer, build the business layer, and create folders, classes and objects. The summary steps are:
1. Create a project and connect to a database to build the data source connections.
2. Create a data foundation layer and insert tables from the connections, detecting keys and joins.
3. Build the business layer associated with the data foundation tables and folders.
4. Create folders, classes and objects (dimensions, measures, attributes) within the business layer structure.
BISP is committed to provide BEST learning material to the beginners and advance learners. In
the same series, we have prepared a complete end-to-end OBIEE Dashboard design document. The
document briefs you practical approach to create Dashboard, Analysis, Filters, Maps, KPI, scorecard
Gauge and Prompts. The document assists OBIEE11g learners to explore the various features. The
document simplifies OBIEE11g. In the first part of tutorial it is shown creation of Brand Analysis
Dashboard. The subsequent release of the case study will cover many new advanced features of
Dashboard building. Join our professional training program to learn from the experts.
This document provides steps to extract metadata and build hierarchies from Hyperion Planning using Oracle Data Integrator (ODI). It describes how to connect ODI to Hyperion Planning, reverse engineer the Planning metadata into ODI, and load dimension data from flat files into Planning dimensions using ODI interfaces. The document is intended to guide users through setting up the required ODI objects, mappings, and executions to integrate data between flat files and Hyperion Planning dimensions.
This document provides guidance on setting up Adobe SiteCatalyst to analyze search engine optimization (SEO) efforts. It discusses preparing SiteCatalyst by enabling search detection, e-commerce functionality, success events, and internal filters. It then describes how to create keyword, success event, e-commerce, and multi-channel reports to analyze SEO performance metrics like keyword rankings and conversions. The document is intended to help digital analytics professionals leverage SiteCatalyst's capabilities to establish a foundation for "smart SEO".
An introduction to hyperion public sector planningAmit Sharma
Oracle Hyperion Public Sector Planning and Budgeting (PSPB) is a budgeting and planning solution that helps public sector organizations manage budgets. PSPB allows users to allocate salary and position budgets to ledger accounts, see the impact of salary plans on operating expenses, define budget requests, and integrate with ERP systems. The key steps to set up a PSPB application include creating a data source, defining dimensions like year and currency, setting up plan types, creating the Essbase database, and configuring properties.
This document provides information about IBM SPSS Bootstrapping 20, including an introduction to bootstrapping methodology and how it is implemented in SPSS. It outlines which SPSS procedures support bootstrapping functionality, how to perform bootstrap analyses using dialog boxes, and provides examples of bootstrap analyses for obtaining confidence intervals for proportions, medians, and choosing predictors in regression models.
The document provides an overview of the ETL tool Informatica. It discusses that ETL stands for Extraction, Transformation, and Loading and is the process of extracting data from sources, transforming it, and loading it into a data warehouse or other target. It describes the key components of Informatica including the repository, client, server, transformations like filters and aggregators, and how mappings are used to move data from sources to targets. Finally, it provides examples of how to create simple mappings in Informatica Designer.
The Documentation Phase is the fifth phase of system development where documentation is produced. Documentation includes user manuals written in simple language to help users understand how to use the system, and technical documentation written for system developers as a reference for system improvement and maintenance. Producing documentation is important as it provides information on what was done in the program and reduces the time needed for new developers to learn about existing systems.
The document provides information about using the Salesforce Data Import Wizard to import data from a CSV file into Salesforce objects. It discusses the three main steps for importing data: 1) selecting the object and file, 2) mapping fields between the CSV and Salesforce, and 3) starting the import. The wizard allows importing both standard and custom objects in Salesforce.
The document provides instructions for creating a balanced scorecard in Microsoft SharePoint 2010 using PerformancePoint Services. It describes how to create scorecards, strategy maps, and dashboards to display key performance indicators (KPIs) across financial, customer, internal, and learning & growth perspectives. The document contains steps for defining KPIs, creating data connections, building the scorecard and strategy map components, and assembling the complete balanced scorecard dashboard.
This document provides steps for creating a balanced scorecard in PerformancePoint using Dashboard Designer, including defining KPIs, creating data connections, building the individual KPIs across financial, customer, internal, and learning & growth perspectives, and assembling the scorecard and a corresponding strategy map.
Power BI(Empower Your Data: Unleash Business Insights with Our Comprehensive ...jahanvi52
Power BI Is A Powerful Business Analytics Tool By Microsoft That Allows You To Visualize Your Data And Share Insights Across Your Organization Or Embed Them In An App Or Website.
Oracle enteprise pbcs drivers and assumptionsAmit Sharma
This document discusses driver-based planning and budgeting solutions using Oracle Enterprise Planning and Budgeting. It allows adjusting numbers based on internal or external factors through defining key drivers that impact areas like revenue, expenses, balance sheets, and cash flows. Drivers can be standard or custom defined and then used to calculate and adjust planned numbers across various areas. The document provides examples of common drivers for revenue, expenses, balance sheet accounts, and cash flows that can significantly impact the planning and budgeting process.
Oracle Strategic Workforce Planning Cloud is a tool to help companies align workforce strategy with business goals. It assesses skills across categories like behavioral, managerial, and technical. It identifies gaps between current and future skill needs through supply and demand analysis. Recommendations include establishing reliable data processes and using intelligent software to link HR transactions to workforce planning and strategic goals.
This document provides an overview of Oracle's Financial Data Quality Management, Enterprise Edition (FDMEE). It describes FDMEE's introduction, architecture, key differences from the previous Financial Data Management product, and value-added features. The document also walks through the FDMEE graphical user interface and components for navigation, setup, integration, data loading, and batch processing.
This document provides examples of using import and mapping scripts in Oracle Hyperion Financial Data Quality Management. There are four examples that demonstrate different ways to apply import and mapping scripts, including using string expressions to extract data from import files, conditional expressions to convert credit and debit columns into a single amount column, and using the "IGNORE" expression to skip rows with negative amounts in a mapping script. The examples are intended to illustrate the flexibility of using Jython scripts to customize data import and mapping tasks.
Oracle PBCS creating standard applicationAmit Sharma
This document provides steps for creating a standard application in Oracle Enterprise Performance Management Cloud. It discusses selecting the application type as standard, which builds advanced applications. It also covers setting up currencies, custom dimensions and metadata, and the calendar. The complete creation process involves 7 steps: 1) Creating the application 2) Loading metadata 3) Modifying metadata 4) Configuring components 5) Assigning security 6) Loading data 7) Creating and deploying business rules.
The document provides information about creating consolidation and elimination rules in HFM Calc Manager. It describes the default consolidation calculation process and functions like PCon and Con that are used to calculate the proportion and elimination members. It explains that custom rules can override the default process. A standard consolidation template is presented that can be used as a starting point, which uses PCon to get the consolidation percentage and Con to calculate proportions and eliminations.
This document discusses calculating return on assets (ROA) using a dynamic procedure in HFM Calc Manager. It defines ROA as net profit divided by average total assets. It then shows a dynamic sub routine that calculates periodic, quarter-to-date, half-year-to-date, and year-to-date ROA by dividing net income by assets over different time periods. An example calculation is provided to demonstrate how it works.
There are two modes for adding new members in the Oracle Hyperion Planning Smartview grid: Dimension Editor Mode and Submit without Refresh Mode. Dimension Editor Mode requires a refresh after each addition but is generally faster, and marks new members with an asterisk. Submit without Refresh Mode does not require a refresh but is slower, and does not mark new members. By default, the mode is Dimension Editor, but it can be changed to Submit without Refresh by setting a property to "True".
This document provides an overview of weekly distribution in Oracle Hyperion Planning 11.1.2.4 presented by Amit Sharma of BISP Solutions. It includes instructions for forecasting salaries, miscellaneous expenses, and total expenses by setting calculation options, fixing a forecast cell, and using formulas to calculate salaries based on headcount and average salaries and miscellaneous expenses as a percentage of salaries. It concludes by asking if there are any questions.
Hyperion planning scheduling data importAmit Sharma
This document discusses putting Oracle Hyperion Planning in maintenance mode via the command line, forecasting salaries and expenses in a salary forecast data form, and fixing a forecast for salaries, miscellaneous expenses, and total expenses based on headcount, average salaries, and an employee benefits percentage. It ends by asking if there are any questions.
Oracle Hyperion Planning 11.1.2.4 includes a new simplified interface designed for tablets with faster client-side scripting, rich planning dashboards combining forms, charts, links and commentary. The presentation discusses new features in Oracle Hyperion Planning 11.1.2.4, focusing on the simplified interface optimized for tablets and including rich dashboards combining different planning elements.
The document provides an overview and hands-on guide for using Oracle Application Express (APEX). It describes the key components of APEX including the Application Builder, SQL Workshop, and Administration. The SQL Workshop component allows users to browse, create, and manage database objects using the Object Browser, run SQL commands, work with SQL scripts, and use the Query Builder. Step-by-step instructions are provided on creating a workspace and logging in, using the Object Browser to create tables and insert data, and running SQL queries using the SQL Commands component.
The document provides instructions for creating different types of applications in Oracle Application Express (APEX) using the Application Builder component. It describes how to create database applications, spreadsheet applications, and websheet applications step-by-step. It also explains how to install pre-built packaged applications available in APEX. The goal is to provide beginners with guidance on building their first APEX applications through the different subcomponents of the Application Builder.
This document provides an overview of security and data access in Salesforce CRM, including how to restrict logins by hours, IP addresses, and profiles; set object, record, and field-level security; manage access with roles and permission sets; and handle exceptions. It discusses viewing and customizing field-level security for standard and custom objects.
The document provides a summary of Salesforce formulas and validation rules that are commonly asked about during interviews. It includes 17 questions related to formulas and validation rules, each with a description of the requirement and the solution in the form of Salesforce code. The document is intended to help both beginners and advanced learners prepare for Salesforce interviews by providing real-world examples of formulas and validation rules.
The document provides information about various data management tools in Salesforce including analytic snapshots, the data import wizard, export data, and mass transfer and delete records. It describes how to use these tools to import, export, and manage data in 3 steps or less for each tool. The analytic snapshots tool allows users to save report results as custom object records while the import wizard provides a unified interface to import standard and custom objects from a CSV file by mapping fields. Users can also export data on-demand or on a scheduled basis and mass transfer or delete multiple records at once.
1. Informatica Power Center 9.0.1
Building Financial Data Mode - Lab#17
Update Strategy transformation
Description:
BISP is committed to provide BEST learning material to the
beginners and advance learners. In the same series, we have
prepared a complete end-to end Hands-on Guide for building
financial data model in Informatica. The document focuses on how
the real world requirement should be interpreted. The mapping
document template with very simplified steps and screen shots
makes the complete learning so easy. The document focuses on
Update Strategy transformation. Join our professional training
program and learn from experts.
History:
Version Description Change Author Publish Date
0.1 Initial Draft Upendra Upadhyay 12th Aug 2011
0.1 Review#1 Amit Sharma 18th Aug 2011
www.bispsolutions.com | www.hyperionguru.com |
www.bisptrainings.com | Page 1
2. Table of Contents
Contents
Table of Contents......................................................................................................... 2
Contents....................................................................................................................... 2
Update Strategy transformation:..................................................................................3
Process:..................................................................................................................... 3
Importing Source and Target Table :............................................................................4
Create Mapping:........................................................................................................11
Create Workflow:........................................................................................................ 20
Execute Workflow, Review data and Check log File....................................................29
www.bispsolutions.com | www.hyperionguru.com |
www.bisptrainings.com | Page 2
3. Update Strategy transformation:
Incremental Update: The incremental update is the data warehouse concept and
it depend on your requirement how you want to implement it. In general the
related concepts are Slowly Changing Dimension (SCD) type 1, 2 and 3 and the
Change Data Capture (CDS). Incremental update means updating old rows and
inserting newly arrived rows, for this we use Update Strategy transformation. In
each and every real time data warehouse project this incremental loading is
important. so Update Strategy as well.
Data Driven: Data driven is a process, in which data is inserted/deleted/updated
or rejected based on the data. In update strategy transformation, DD means
DATA DRIVEN. When you are doing Data Driven then you need to have an
update strategy transformation.
Purpose :
The SRC_BANK_CD source tables will be used to create an TRG_BANK_CD target
table that has information about the bank_cd, created by, created date and
modify by etc. This will update the TRG_BANK_CD table to keep the insert,
delete, update or reject information of bank_cd , created by, created date and
modify by etc. information.
Objective :
Create and configure a Lookup and Update Strategy transformation to do an
incremental update on the trg_bank_cd.
Summary:
Source Table Name - SRC_BANK_CD
Target Table Name - TRG_BANK_CD
Process:
Import source and target table in Informatica Power Center Designer
Source analyzer and Target Designer.
Create mapping, import source and target table in mapping designer
window and create lookup and update strategy transformation. In update
strategy transformation write expression query. Then create mapping and
save it.
Create workflow and assign session and save it.
Execute workflow and view data.
www.bispsolutions.com | www.hyperionguru.com |
www.bisptrainings.com | Page 3
4. Source Table Target Table.
Importing Source and Target Table :
Import data from source and create target table (There are two types to create
target table, Manually or import from database). There are following step to
importing source and target database (Table).
Step-1 Click on Start > All Programs > Informatica 9.0.1 > Client > Power
Center Client> Power Center
Designer.
Step-2 Then Connect to Repository in Informatica Power Center Designer Right
click on repository name and click on Connect.
www.bispsolutions.com | www.hyperionguru.com |
www.bisptrainings.com | Page 4
5. Right Click on
InfoRepoUser.
Step-3 Then go to Tools Menu and click on Source Analyzer to import source
table.
Select Source Analyzer
Step-4 And then go to Sources Menu in Informatica Power Center Designer
Menu bar and select Import from database (Here some other options available
such as Import from Database(import source data from RDBMS), Import from
File(import source data from Flatfile), Import from Cobol File(import Cobol
source), Import XML Definition(import source data from XML) etc.).
Click on Import
from
Database.
Step-5 Specify Username, Owner name and password then click on connect.
Select source table and click on OK if you select all table, then click on select all
and click OK.
www.bispsolutions.com | www.hyperionguru.com |
www.bisptrainings.com | Page 5
6. Step-6 Source table in source analyzer tab, Then right click on Source table
and select Preview Data to view data.
Step-7 Specify Username, Owner name, Password and then click on Connect .
www.bispsolutions.com | www.hyperionguru.com |
www.bisptrainings.com | Page 6
7. Step-8 Now click on Target Designer. And then select Target menu in
Informatica Power Center Designer Menu bar and click on Import from database
to import target table. (Or create manually, In target menu click on create
select database type and click OK. Then add column in Edit window. If target
table stored in any RDBMS then select target table and then go to target menu
and click on Generate/Execute SQL... Generate/Execute window appears. Then
click on connect option and connect to database and specify information and
then click on Generate and Execute ).
Step-9 Specify Username, Owner name, password and then click on connect
and then select target table and click on OK.
www.bispsolutions.com | www.hyperionguru.com |
www.bisptrainings.com | Page 7
8. Step-10 Target table in Target Designer tab. Now view target table data, right
click on target table and select Preview Data.
www.bispsolutions.com | www.hyperionguru.com |
www.bisptrainings.com | Page 8
9. Step-11 Specify Username, Owner name, password and click on Connect then
close this window.
www.bispsolutions.com | www.hyperionguru.com |
www.bisptrainings.com | Page 9
11. Create Mapping:
Mappings represent the data flow b/w sources to targets. When the
Informatica Power Center Server executes a session, it uses the instructions
configured in the mapping to read, transform, and write data.
Every mapping must contain the following components:
Source definition: It describes the characteristics of a source.
Transformation: A transformation is a repository object which reads the data,
modifies the data and passes the data. Transformations in a mapping represent
the operations that the integration service performs on the data.
Target definition: It describes the target table.
Step-1 Go to Mapping Designer and Create New Mapping for the
Incremental update with Data Driven approach and then name of mapping and
click OK.
Step-2 Then drag and drop source and target table in Mapping Designer
Window.
www.bispsolutions.com | www.hyperionguru.com |
www.bisptrainings.com | Page 11
12. Step-3 Then Create lookup transformation, select Lookup in dropdown and
give name of lookup transformation and the click create then dialog box
appears choose target button and select TRG_BANK_CD lookup table for Lookup
Transformation in Dialog box and then click OK and click Done.
Select lookup table
from Flatfile or
RDBMS.
Select Lookup table
from Target
Designer Window.
Select Lookup
from Source
Qualifier
Select lookup
from Source
Analyzer
Step-4 Lookup Table in Mapping Designer window.
Lookup
table.
www.bispsolutions.com | www.hyperionguru.com |
www.bisptrainings.com | Page 12
14. Step-5 Then pass source qualifier column into lookup table.
pass bank_cd source
qualifier table columns into
lookup table.
Step-6 Now, Right click on Lookup table and select Edit.
Right click on
Lookup Table.
www.bispsolutions.com | www.hyperionguru.com |
www.bisptrainings.com | Page 14
15. Step-7 Edit lookup table.
Ports
Mixed.
"L" denotes lookup port.
"R" denotes port used as a return value (Unconnected Lookup only).
www.bispsolutions.com | www.hyperionguru.com |
www.bisptrainings.com | Page 15
16. Step-8 Then go to condition tab and apply lookup condition and then click OK.
Step-9 Then create Update Strategy transformation and give name of
transformation and click apply.
Update strategy : Transformation is an active and connected transformation.
Update strategy transformation is used to insert, update, and delete records in the
target table. It can also reject the records without reaching the target table. When you
design a target table, you need to decide what data should be stored in the target.
www.bispsolutions.com | www.hyperionguru.com |
www.bisptrainings.com | Page 16
17. Step-10 Then passes lookup table column into update strategy table and also
passes source qualifier column into update strategy table.
Step-11 Then right click on Update Strategy table and select Edit.
www.bispsolutions.com | www.hyperionguru.com |
www.bisptrainings.com | Page 17
18. Step-12 Then go to Properties tab and write Update Strategy Expression. Write
expression and validate it then click OK.
Click here to write
update strategy
expression.
www.bispsolutions.com | www.hyperionguru.com |
www.bisptrainings.com | Page 18
19. Step-13 Then Create Mapping.
Step-14 . Save this mapping.
www.bispsolutions.com | www.hyperionguru.com |
www.bisptrainings.com | Page 19
20. Create Workflow:
Workflow Manager: Workflow load the data between source to target b/w
sequential manner. And also Define run-time properties for a mapping, known
as sessions.
Step-1 Go to task developer and then click on Task Menu to create reusable
task (Reusable tasks means the task that is created in task developer and
create once time and used multiple times.)
Step-2 Select session and insert name of task.
Step-3 Select Mapping to associate with the session.
www.bispsolutions.com | www.hyperionguru.com |
www.bisptrainings.com | Page 20
21. Step-4 Reusable session in Task Developer.
Step-5 Now go to workflow designer and click on workflow menu to create
workflow. Specify name of workflow and click OK.
www.bispsolutions.com | www.hyperionguru.com |
www.bisptrainings.com | Page 21
22. Step-6 Now drag and drop s_Incremental_DD task into workflow designer
windows.
www.bispsolutions.com | www.hyperionguru.com |
www.bisptrainings.com | Page 22
23. Step-7 Now create flow B/W Workflow to Task. Select Line Task and link to
Start to Filter.
Step-8 Work Flow Designer Windows.
www.bispsolutions.com | www.hyperionguru.com |
www.bisptrainings.com | Page 23
24. Step-9 Now Configure Connection to Target, Then Right Click on Expression
and Edit, Then Click Mapping tab and configure connection for your Target
table schema in oracle 11g RDBMS. And then click OK.
Step-10 In general tab.
www.bispsolutions.com | www.hyperionguru.com |
www.bisptrainings.com | Page 24
25. Step-11 In Properties tab. Specify General Options and Performance.
Select Data Driven in
Treat source rows as.
www.bispsolutions.com | www.hyperionguru.com |
www.bisptrainings.com | Page 25
27. Step-13 In Mapping. Specify Connection and property.
Step-14 Set These property for target table.
• Insert: Check this option to insert a row in the target table.
• Delete: Check this option to delete a row in the target table.
• Truncate Table: check this option to truncate the target table before
loading the data.
• Update as Update: Update the row in the target table.
• Update as Insert: Insert the row which is flagged as update.
• Update else Insert: If the row exists in the target table, then update the
row. Otherwise, insert the row.
www.bispsolutions.com | www.hyperionguru.com |
www.bisptrainings.com | Page 27
28. Step-15 Now save (ctrl+s) this workflow and check it.
www.bispsolutions.com | www.hyperionguru.com |
www.bisptrainings.com | Page 28
29. Execute Workflow, Review data and Check log File
Workflow monitor: Workflow monitor is helpful in monitoring and tracking the
workflow created in Informatica power center.
Step-1 Now Start Workflow, Right click on Workflow Designer Window and Click
on Start Workflow.
Step-2 Check session in Informatica PowerCenter Workflow Monitor.
Session successfully
Step-3 Target Table. Succeeded
www.bispsolutions.com | www.hyperionguru.com |
www.bisptrainings.com | Page 29