Downloaded 123 times


![Data Structure
Q2
Zero to many points
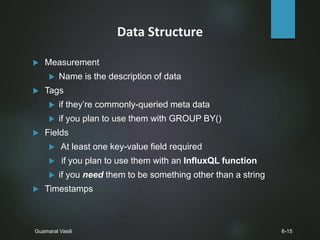
Measurement
Fields
Tags
Timestamp
Line protocol
Data type
5-15Guamaral Vasili
<measurement>[,<tag-key>=<tag-value>...]
<field-key>=<field-value>[,<field2-key>=<field2-value>...]
[unix-nano-timestamp]
String
Float, Int, Boolean, String](https://image.slidesharecdn.com/influx-db-160405075631/85/InfluxDb-6-320.jpg)


![Continuous Query
Q2
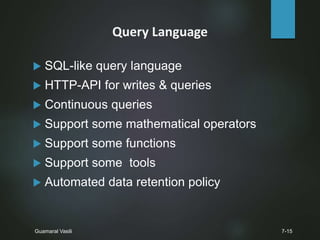
Runs automatically and periodically
Syntax
Meta syntax
Query syntax
12-15Guamaral Vasili
CREATE CONTINUOUS QUERY ON
<db_name> [RESAMPLE [EVERY <interval>]
[FOR <interval>]]
BEGIN
SELECT <function>(<stuff>)[,<function>(<stuff>)]
INTO <different_measurement>
FROM <current_measurement> [WHERE <stuff>]
GROUP BY time(<interval>)[,<stuff>]
END](https://image.slidesharecdn.com/influx-db-160405075631/85/InfluxDb-13-320.jpg)


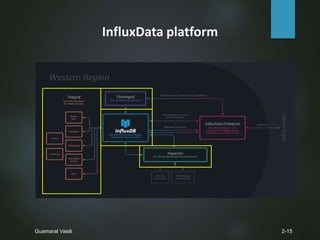
InfluxDB is an open source time series database that is written in Go. It is designed for storing large amounts of time series data and providing rapid query results. Data is stored in measurements, which contain tags, fields, and a timestamp. Queries use a SQL-like language to retrieve and aggregate time series data. Continuous queries allow data to be resampled and written to a different measurement on a periodic basis.


![Paul Dix [InfluxData] | InfluxDays Keynote: Future of InfluxDB | InfluxDays N...](https://cdn.slidesharecdn.com/ss_thumbnails/2021-10-26whytimeseries-influxdaysna-211026005527-thumbnail.jpg?width=640&height=640&fit=bounds)


