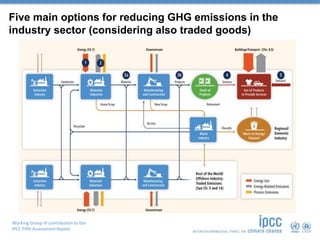
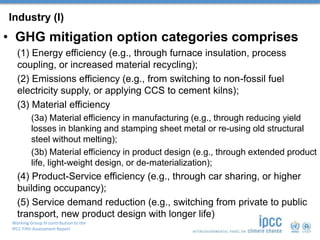
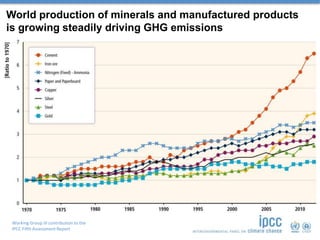
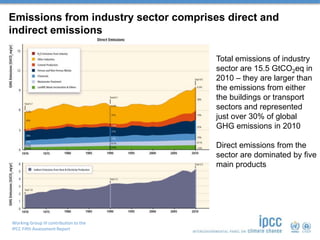
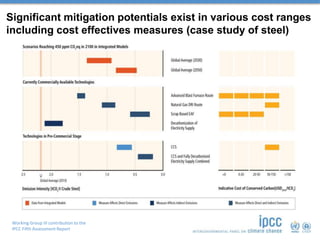
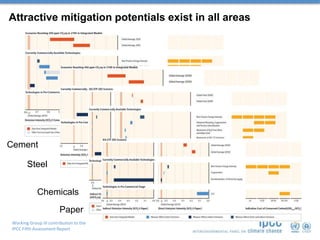
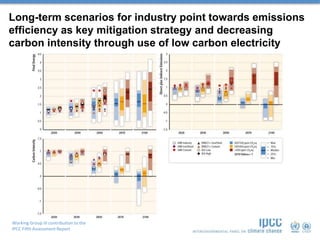
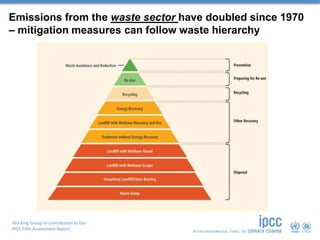
©Ocean/Corbis
CLIMATE CHANGE 2014
Mitigation of Climate Change
Working Group III contribution to the
IPCC Fifth Assessment Report
Working Group III contribution to the
IPCC Fifth Assessment Report
Five main options for reducing GHG emissions in the
industry sector (considering also traded goods)
Working Group III contribution to the
IPCC Fifth Assessment Report
Industry (I)
• GHG mitigation option categories comprises
(1) Energy efficiency (e.g., through furnace insulation, process
coupling, or increased material recycling);
(2) Emissions efficiency (e.g., from switching to non-fossil fuel
electricity supply, or applying CCS to cement kilns);
(3) Material efficiency
(3a) Material efficiency in manufacturing (e.g., through reducing yield
losses in blanking and stamping sheet metal or re-using old structural
steel without melting);
(3b) Material efficiency in product design (e.g., through extended product
life, light-weight design, or de-materialization);
(4) Product-Service efficiency (e.g., through car sharing, or higher
building occupancy);
(5) Service demand reduction (e.g., switching from private to public
transport, new product design with longer life)
Working Group III contribution to the
IPCC Fifth Assessment Report
World production of minerals and manufactured products
is growing steadily driving GHG emissions
Working Group III contribution to the
IPCC Fifth Assessment Report
Emissions from industry sector comprises direct and
indirect emissions
Total emissions of industry
sector are 15.5 GtCO2eq in
2010 – they are larger than
the emissions from either
the buildings or transport
sectors and represented
just over 30% of global
GHG emissions in 2010
Direct emissions from the
sector are dominated by five
main products
Working Group III contribution to the
IPCC Fifth Assessment Report
Significant mitigation potentials exist in various cost ranges
including cost effectives measures (case study of steel)
Working Group III contribution to the
IPCC Fifth Assessment Report
Attractive mitigation potentials exist in all areas
Paper
Chemicals
Steel
Cement
Working Group III contribution to the
IPCC Fifth Assessment Report
Long-term scenarios for industry point towards emissions
efficiency as key mitigation strategy and decreasing
carbon intensity through use of low carbon electricity
Working Group III contribution to the
IPCC Fifth Assessment Report
Emissions from the waste sector have doubled since 1970
– mitigation measures can follow waste hierarchy
Working Group III contribution to the
IPCC Fifth Assessment Report
Industry (II)
• From a short and mid-term perspective energy efficiency and
behaviour change could significantly contribute to GHG mitigation
– The energy intensity of the industry sector could be directly reduced by up to
approximately 25% compared to the current level through the wide-scale
deployment of best available technologies, upgrading/replacement, particularly in
countries where these are not in practice and in non-energy intensive industries
– Additional energy intensity reductions of up to approximately 20% may potentially
be realized through innovation
• In the long-term a shift to low-carbon electricity, radical product
innovations (e.g. alternatives to cement), or CCS (for mitigating i.a.
process emissions) could contribute to significant (absolute) GHG
emissions reductions
• Systemic approaches and collaborative activities across companies
and sectors and especially SMEs through clusters can reduce energy
and material consumption and thus GHG emissions
• Important options for mitigation in waste management is waste
reduction, followed by re-use, recycling and energy recovery
©Ocean/Corbis
CLIMATE CHANGE 2014
Mitigation of Climate Change
Working Group III contribution to the
IPCC Fifth Assessment Report

Industry: Mitigation Options

  • 1.
    ©Ocean/Corbis CLIMATE CHANGE 2014 Mitigationof Climate Change Working Group III contribution to the IPCC Fifth Assessment Report
  • 2.
    Working Group IIIcontribution to the IPCC Fifth Assessment Report Five main options for reducing GHG emissions in the industry sector (considering also traded goods)
  • 3.
    Working Group IIIcontribution to the IPCC Fifth Assessment Report Industry (I) • GHG mitigation option categories comprises (1) Energy efficiency (e.g., through furnace insulation, process coupling, or increased material recycling); (2) Emissions efficiency (e.g., from switching to non-fossil fuel electricity supply, or applying CCS to cement kilns); (3) Material efficiency (3a) Material efficiency in manufacturing (e.g., through reducing yield losses in blanking and stamping sheet metal or re-using old structural steel without melting); (3b) Material efficiency in product design (e.g., through extended product life, light-weight design, or de-materialization); (4) Product-Service efficiency (e.g., through car sharing, or higher building occupancy); (5) Service demand reduction (e.g., switching from private to public transport, new product design with longer life)
  • 4.
    Working Group IIIcontribution to the IPCC Fifth Assessment Report World production of minerals and manufactured products is growing steadily driving GHG emissions
  • 5.
    Working Group IIIcontribution to the IPCC Fifth Assessment Report Emissions from industry sector comprises direct and indirect emissions Total emissions of industry sector are 15.5 GtCO2eq in 2010 – they are larger than the emissions from either the buildings or transport sectors and represented just over 30% of global GHG emissions in 2010 Direct emissions from the sector are dominated by five main products
  • 6.
    Working Group IIIcontribution to the IPCC Fifth Assessment Report Significant mitigation potentials exist in various cost ranges including cost effectives measures (case study of steel)
  • 7.
    Working Group IIIcontribution to the IPCC Fifth Assessment Report Attractive mitigation potentials exist in all areas Paper Chemicals Steel Cement
  • 8.
    Working Group IIIcontribution to the IPCC Fifth Assessment Report Long-term scenarios for industry point towards emissions efficiency as key mitigation strategy and decreasing carbon intensity through use of low carbon electricity
  • 9.
    Working Group IIIcontribution to the IPCC Fifth Assessment Report Emissions from the waste sector have doubled since 1970 – mitigation measures can follow waste hierarchy
  • 10.
    Working Group IIIcontribution to the IPCC Fifth Assessment Report Industry (II) • From a short and mid-term perspective energy efficiency and behaviour change could significantly contribute to GHG mitigation – The energy intensity of the industry sector could be directly reduced by up to approximately 25% compared to the current level through the wide-scale deployment of best available technologies, upgrading/replacement, particularly in countries where these are not in practice and in non-energy intensive industries – Additional energy intensity reductions of up to approximately 20% may potentially be realized through innovation • In the long-term a shift to low-carbon electricity, radical product innovations (e.g. alternatives to cement), or CCS (for mitigating i.a. process emissions) could contribute to significant (absolute) GHG emissions reductions • Systemic approaches and collaborative activities across companies and sectors and especially SMEs through clusters can reduce energy and material consumption and thus GHG emissions • Important options for mitigation in waste management is waste reduction, followed by re-use, recycling and energy recovery
  • 11.
    ©Ocean/Corbis CLIMATE CHANGE 2014 Mitigationof Climate Change Working Group III contribution to the IPCC Fifth Assessment Report

Editor's Notes

  • #3 Figure 10.2 A schematic illustration of industrial activity over the supply chain. Options for climate change mitigation in the industry sector are indicated by the circled numbers: (1) Energy efficiency (e.g., through furnace insulation, process coupling, or increased material recycling); (2) Emissions efficiency (e.g., from switching to non-fossil fuel electricity supply, or applying CCS to cement kilns); (3a) Material efficiency in manufacturing (e.g., through reducing yield losses in blanking and stamping sheet metal or re-using old structural steel without melting); (3b) Material efficiency in product design (e.g., through extended product life, light-weight design, or de-materialization); (4) Product-Service efficiency (e.g., through car sharing, or higher building occupancy); (5) Service demand reduction (e.g., switching from private to public transport).
  • #5 Figure 10.3 World’s growth of main minerals and manufacturing products (1970=1). Sources: (WSA, 2012a; FAO, 2013; Kelly and Matos, 2013).
  • #6 Figure 10.4. Total global industry and waste/wastewater direct and indirect GHG emissions by source, 1970–2010 (GtCO2eq) (de la Rue du Can and Price, 2008; IEA, 2012a; JRC/PBL, 2012).(See also Annex II.9, Annex II.5) Global industry and waste/wastewater GHG emissions grew from 10.42 GtCO2eq in 1990 to 12.98 GtCO2eq in 2005 to 15.51 GtCO2eq in 2010. These emissions are larger than the emissions from either the buildings or transport end-use sectors and represent just over 30% of global GHG emissions in 2010 (just over 40% if AFOLU emissions are not included). These total emissions are comprised of: Direct energy-related CO2 emissions for industry (This also includes CO2 emissions from non-energy uses of fossil fuels) Indirect CO2 emissions from production of electricity and heat for industry Process CO2 emissions Non-CO2 GHG emissions Direct emissions for waste/wastewater
  • #7 This is an example from India to illustrate that developing countries are also spending on mitigation Figure 10.6. Range of unit cost of avoided CO2 emissions (USD2010/tCO2) in India. Source: Database of energy efficiency measures adopted by the winners of the National Awards on Energy Conservations for aluminium (26 measures), cement (42), chemicals (62), ISP: integrated steel plant (30), pulp and paper (46), and textile (75) industry in India during the period of 2007–2012 (BEE, 2012).
  • #10 Figure 10.11. Industry sector scenarios over the 21st century that lead to low (430–530 ppm CO2eq), medium (530–650 ppm CO2eq) and high (>650 ppm CO2eq) atmospheric CO2eq concentrations in 2100 (see Table 6.3 for definitions of categories). All results are indexed relative to 2010 values for each scenario. Panels show: (a) final energy demand; (b) direct plus indirect CO2eq emissions; (c) emission intensity (emissions from (b) divided by energy from (a)). Indirect emissions are emissions from industrial electricity demand. The median scenario (horizontal line symbol) surrounded by the darker colour bar (inner quartiles of scenarios) and lighter bar (full range) represent those 120 scenarios assessed in Chapter 6 with model default technology assumptions which submitted detailed final energy and emissions data for the industrial sector; white bars show the full range of scenarios including an additional 408, with alternate economic, resource, and technology assumptions (e.g., altering the economic and population growth rates, excluding some technology options or increasing response of energy efficiency improvement). Symbols are provided for selected scenarios for industry and industry sub-sectors (iron and steel, and cement) for the IEA ETP (IEA, 2012d), AIM Enduse model (Akashi et al., 2013 and Table 6.1) and DNE21+ (Sano et al., 2013a, b; and Table 6.1) for their baseline, 550 ppm and 450 ppm CO2eq scenarios to 2050.
  • #11 Clarification: Industry chapter also covers waste industry and its mitigation options within a stand-alone section (Section 10.14) The most effective option for mitigation in waste management is waste reduction, followed by re-use and recycling and energy recovery Figure 10.16: The hierarchy of waste management. The priority order and colour coding is based on the five main groups of waste hierarchy classification (Prevention; Preparing for Re-Use; Recycling; Other Recovery e.g., Energy Recovery; and Disposal) outlined by the European Commission