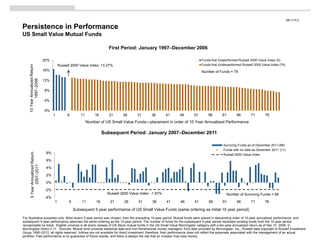
Download as PDF, PPTX

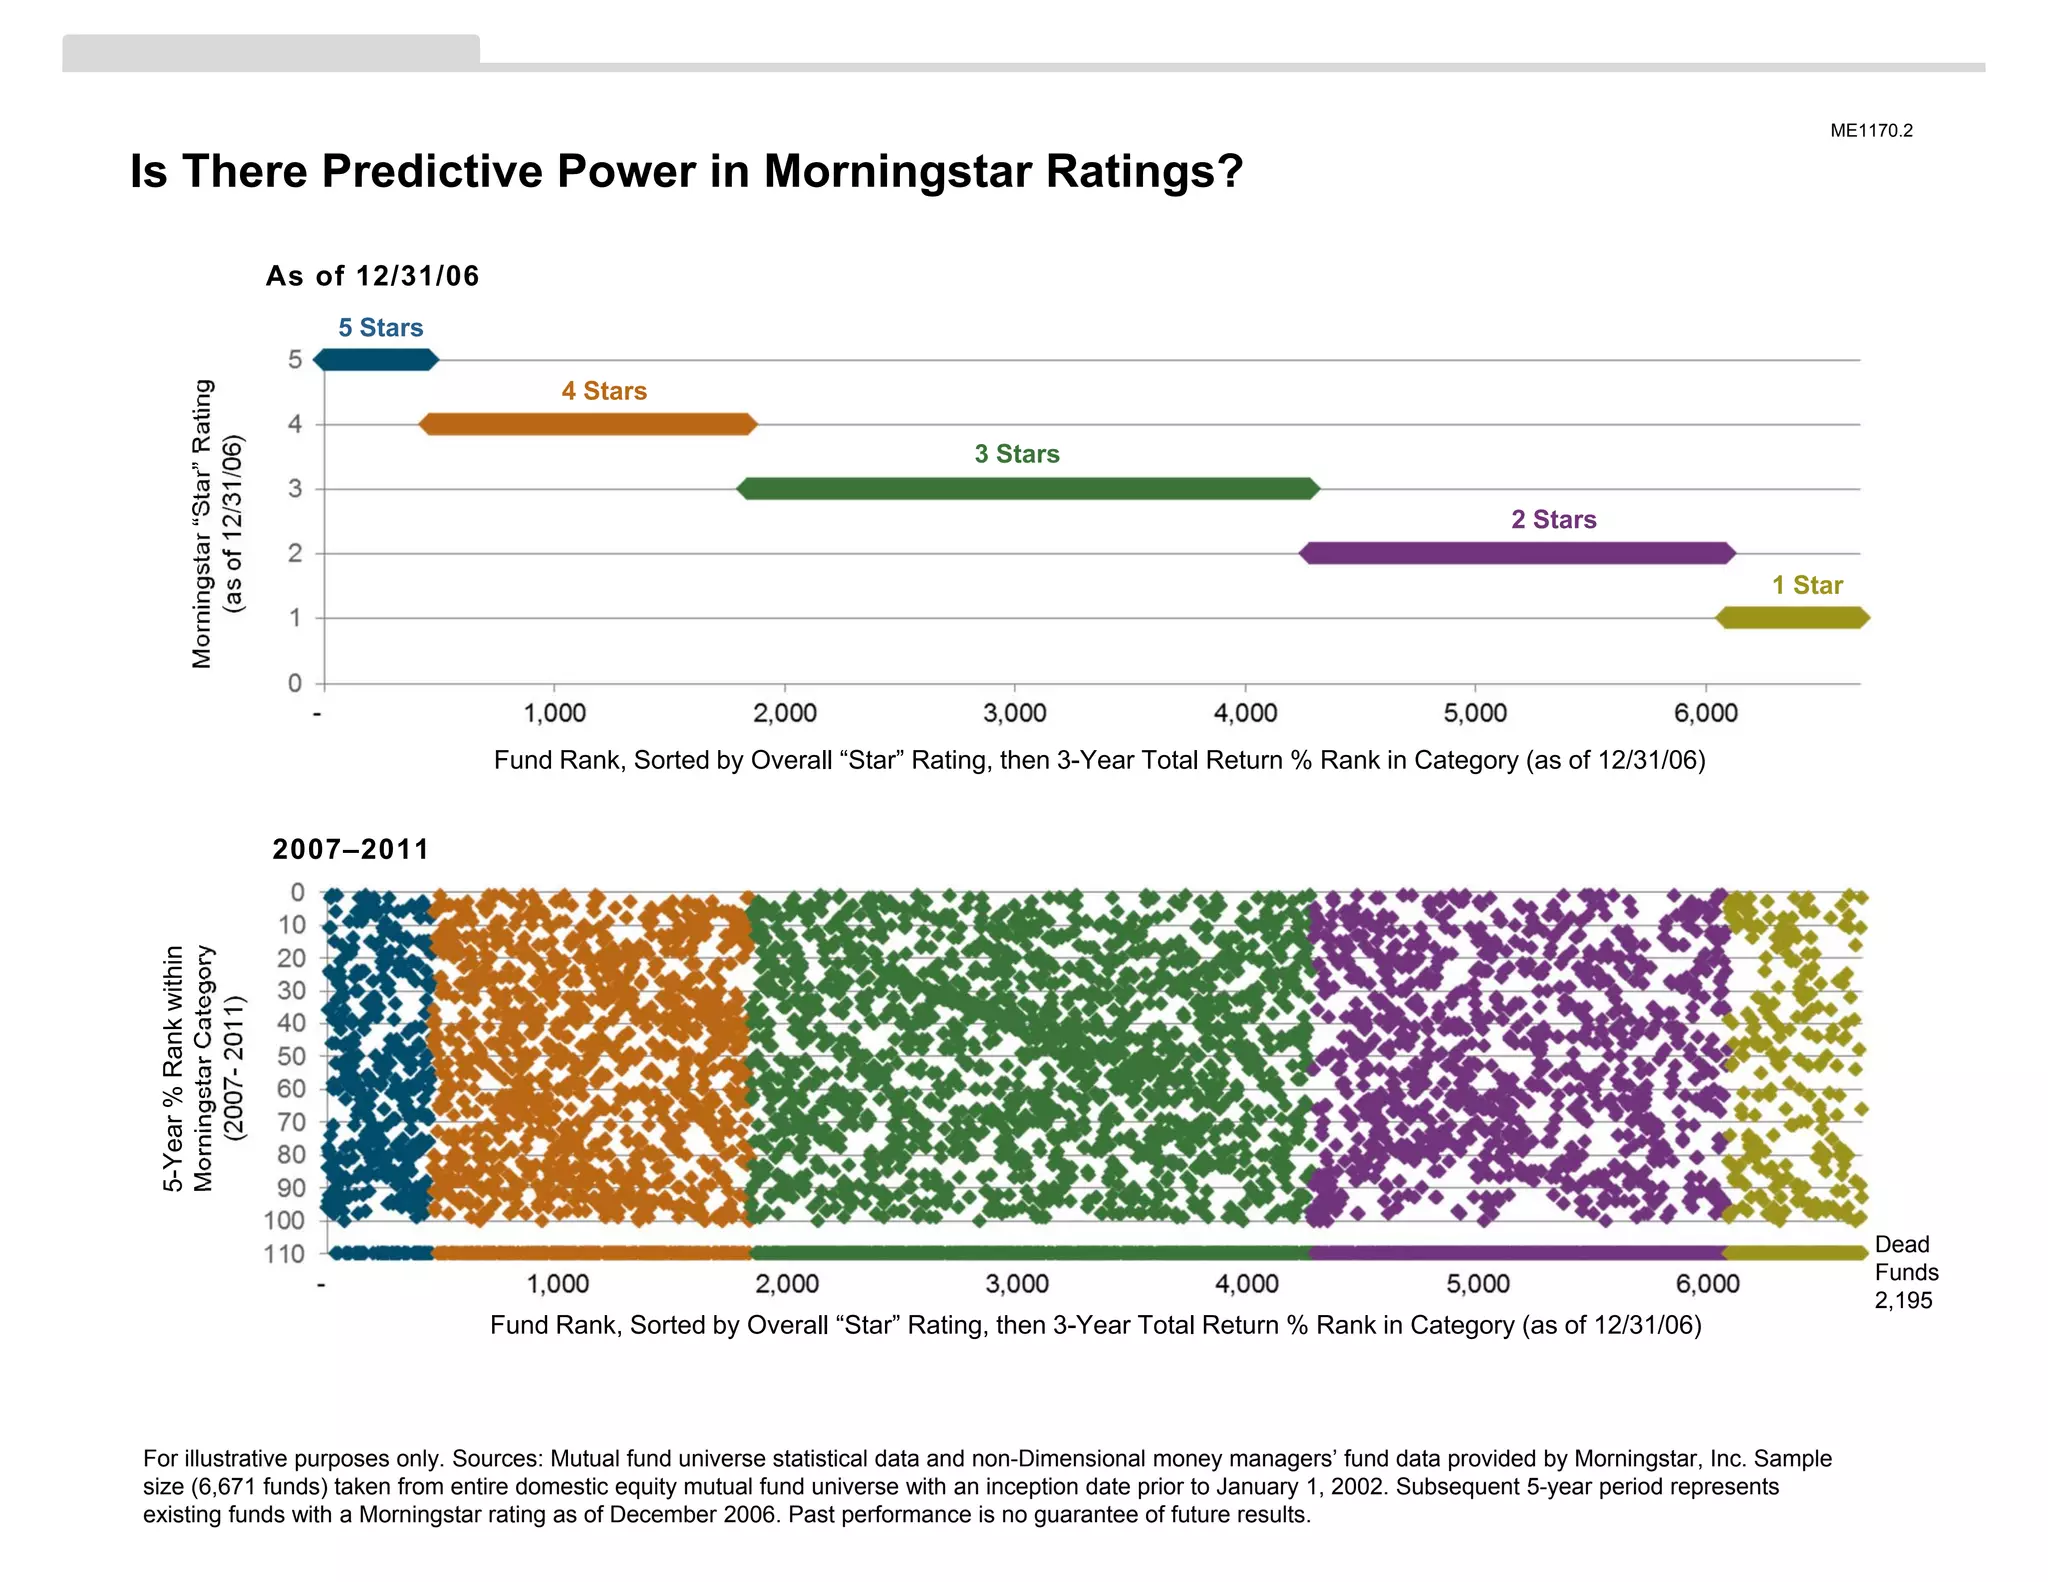
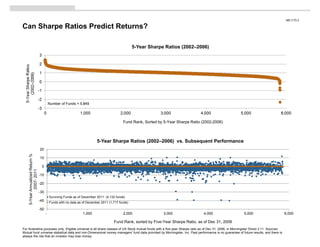
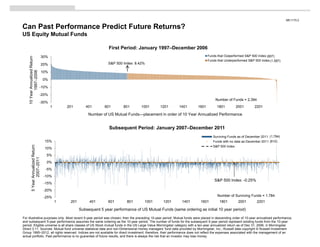
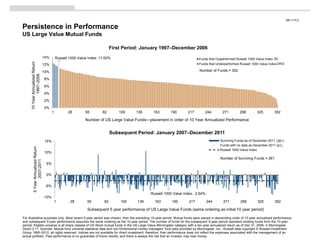

Morningstar ratings do not reliably predict future fund performance. Funds with 5-star ratings from 2006 tended to underperform relative to lower-rated funds in subsequent years. Similarly, high Sharpe ratios from 2002-2006 did not correlate with strong performance in later periods. Past performance also generally failed to persist - top-performing funds from 1997-2006 often underperformed in 2007-2011 compared to benchmarks like the S&P 500 index. Across large and small value funds, most previous top performers went on to trail their respective Russell index in the following 5-10 years. Star ratings, risk-adjusted returns, and prior raw returns all showed little predictive power regarding future mutual fund success.


