SlideShare a Scribd company logo
1 of 61
Download to read offline
DOCUMENT
DE TRAVAIL
N° 607
DIRECTION GÉNÉRALE DES ÉTUDES ET DES RELATIONS INTERNATIONALES
DOES THE VOLATILITY OF COMMODITY PRICES
REFLECT MACROECONOMIC UNCERTAINTY?
Marc Joëts, Valérie Mignon and Tovonony Razafindrabe
November 2016
DIRECTION GÉNÉRALE DES ÉTUDES ET DES RELATIONS INTERNATIONALES
DOES THE VOLATILITY OF COMMODITY PRICES
REFLECT MACROECONOMIC UNCERTAINTY?
Marc Joëts, Valérie Mignon and Tovonony Razafindrabe
November 2016
Les Documents de travail reflètent les idées personnelles de leurs auteurs et n'expriment pas
nécessairement la position de la Banque de France. Ce document est disponible sur le site internet de la
Banque de France « www.banque-france.fr ».
Working Papers reflect the opinions of the authors and do not necessarily express the views of the Banque
de France. This document is available on the Banque de France Website “www.banque-france.fr”.
Does the volatility of commodity prices reáect macroeconomic
uncertainty?!
Marc JoÎtsy
ValÈrie Mignonz
Tovonony RazaÖndrabex
3rd November 2016
!
We are grateful to Nathan Balke for providing us with his code for the TVAR estimations. We would like to
thank Nick Bloom, Bertrand Candelon, Soojin Jo, Lutz Kilian, and seminar/conference participants at Banque
de France, Dauphine University, University of Paris Ouest, Utrecht University, CFE, EEA, IAAE, and IAEE
for constructive comments and suggestions that helped us improve an earlier version of the paper. The usual
disclaimers apply.
y
Banque de France, International Macroeconomic Division, and EconomiX-CNRS, University of Paris Ouest,
France. E-mail: marc.joets@banque-france.fr
z
EconomiX-CNRS, University of Paris Ouest and CEPII, France. Corresponding author: ValÈrie Mignon,
EconomiX-CNRS, University of Paris Ouest, 200 avenue de la RÈpublique, 92001 Nanterre Cedex, France.
Phone: 33 1 40 97 58 60. E-mail: valerie.mignon@u-paris10.fr
x
University of Rennes and EconomiX-CNRS, University of Paris Ouest, France. E-mail:
trazafindrab@u-paris10.fr
1
RÈsumÈ franÁais
Bien quíil existe de nombreuses Ètudes sur les e§ets macroÈconomiques des chocs pÈtroliers et
des matiËres premiËres, la littÈrature ne dit rien sur líimpact de líincertitude macroÈconomique
sur les áuctuations des prix du pÈtrole et des matiËres premiËres. Le prÈsent article aborde
cette question par líestimation díun modËle vectoriel autorÈgressif ‡ seuil (TVAR) sur un
Èchantillion de 19 marchÈs de matiËres premiËres. Líobjectif central du papier est double:
(i) Èvaluer si líe§et des chocs díincetitude macroÈconomique sur les rendements des prix des
matiËres premiËres dÈpend du degrÈ díincertitude, et (ii) Ètudier le transfert de líincertitude
marcÈoconomique ‡ líincertitude des prix en developpant une nouvelle mesure de líincertitutde
des prix des produits de base. Nos rÈsultats montrent que les marchÈs agricoles et industriels
sont trËs sensibles ‡ la variabilitÈ et au niveau díincertitude macroÈconomique, tandis que
líimpact sur les mÈtaux prÈcieux est plus parcimonieux compte tenu de leur rÙle de valeur
refuge en pÈriode de turbulences Èconomiques. De plus, nous constatons que la rÈcente rÈcession
de 2007-2009 a engendrÈ un Èpisode sans prÈcÈdent díincertitude pour de nombreux prix des
matiËres premiËres. Notre analyse rÈvËle en outre que la volatilitÈ et líincertitude des prix
peuvent Ítre dÈconnectÈes. Cela est particuliËrement vrai pour le marchÈ pÈtrolier car de
nombreux chocs dans les annÈes 1990 et au dÈbut des annÈes 2000 conduisant ‡ des pics de
volatilitÈ níont pas gÈnÈrÈ díincertitude des prix, soulignant la pertinence de notre mesure
díincertitude liant incertitude ‡ prÈvisibilitÈ plutÙt quí‡ la volatilitÈ.
Mots-clÈs: incertitude macroÈconomique, prix des matiËres premiËres, modËle vectoriel autorÈ-
gressif ‡ seuil.
Code JEL: Q02, E32, C32.
Abstract
While there exists numerous studies on the macroeconomic e§ects of oil and commodity shocks,
the literature is quite silent on the impact of macroeconomic uncertainty on oil and commodity
prices and, especially, on their volatility. This paper tackles this issue through the estimation
of a threshold vector autoregressive (TVAR) model on a sample of 19 commodity markets.
We aim at (i) assessing whether the e§ect of macroeconomic uncertainty shocks on commodity
price returns depends on the degree of uncertainty, and (ii) investigating the transfer from mac-
roeconomic uncertainty to price uncertainty using a newly developed measure of commodity
price uncertainty. Our Öndings show that both agricultural and industrial markets are highly
sensitive to the variability and the level of macroeconomic uncertainty, while the impact on
precious metals is more parsimonious given their well-identiÖed safe-haven role in time of eco-
nomic turmoil. In addition, we Önd evidence that the recent 2007-09 recession has generated
an unprecedented episode of high uncertainty in numerous commodity prices. Interestingly,
our analysis further reveals that volatility and uncertainty in prices can be disconnected. This
is especially true for the oil market as most important shocks in the 1990s and the beginning
of the 2000s that lead to price volatility do not generate price uncertainty, highlighting the
relevance of our uncertainty measure in linking uncertainty to predictability rather than to
2
volatility.
Keywords: macroeconomic uncertainty, commodity prices, threshold vector autoregressive
model.
JEL ClassiÖcation: Q02, E32, C32.
3
Non-technical summary
The literature on commodity prices during the last decade showed the importance to identify
and understand the causes and consequences of oil price shocks. Some of the key insights
regarding the origins of prices áuctuations (Kilian, 2008a) are that (i) most commodity prices
are endogenous with respect to the global business cycle, and (ii) demand shocks cause delayed
and sustained price movements while supply shocks have small and transitory e§ects. Whereas
disentangling the supply and demand components in a structural model is now common in the
empirical literature to understand commodity price dynamics, some important concerns are
missing regarding the e§ect of macroeconomic uncertainty.
So far, the previous literature is indeed silent on the e§ects of macroeconomic uncertainty
on the volatility of commodity prices. This issue is nevertheless worthy of investigation since
the impact of uncertainty on the global economy has been widely documented. At a micro
level, commodity Örms in several sectors are confronted to high costs and should be impacted
by uncertainty about returns to investment. Similarly, at a macro level, as prices are related
to global supply and demand conditions, uncertainty about macroeconomic aggregates should
also a§ect commodity prices.
This paper addresses this question on a large sample of 19 raw materials (energy, precious
metals, agriculture, and industry) through a non-linear model. Our objective is twofold: (i)
To assess whether the e§ect of macroeconomic uncertainty shocks on commodity price returns
depends on the degree of uncertainty; (ii) To investigate the transfer from macroeconomic
uncertainty to price uncertainty using an innovative measure of commodity price uncertainty.
The main message of the paper is that most of commodity price returns are a§ected by mac-
roeconomic uncertainty, the e§ect being more important for commodities that are strongly re-
lated to the global business cycle. Then, in addition to traditional supply and demand shocks,
macroeconomic uncertainty constitutes another key channel through which economic funda-
mentals may impact commodity prices. Moreover, duration seems also to matter depending
on the commodity type; long-run uncertainty having more e§ect on agricultural and indus-
trial cumulative price dynamics, while other markets being more sensitive to short-run impacts.
Focusing on the case of oil, Figure 1 below displays oil price uncertainty , together with
the evolution of corresponding price and volatility . As shown, the sensitivity of oil price
uncertainty depends on the period considered. For example, the period following the invasion
of Kuwait in 1990 or, to a lesser extent, the Iraq War in 2002-03 are characterized by sharp
spikes in oil prices. The Iran-Iraq War starting at the beginning of the 1980s is, in contrast,
associated with small price movements. As stressed by Barsky and Kilian (2004), a simplistic
view should be that major war episodes cause price uncertainty to increase through a rise in
precautionary demand for oil. However, among all episodes of important áuctuations in oil
prices, only two seem to be accompanied by uncertainty: (i) the 2007-09 recession, and (ii)
the 1984-86 period. During the 2007-09 recession, oil price uncertainty is indeed very sensitive
4
Figure 1: Oil price uncertainty
.00
.04
.08
.12
.16 0
40
80
120
160
82 84 86 88 90 92 94 96 98 00 02 04 06 08 10 12 14
Oilpriceuncertainty WTI WTIprice volatility
Note: The figure depicts uncertainty proxy for oil market at 1 month (left axis, blue line).
The horizontal red bar corresponds to 1.65 standard-deviation above the mean of the
series (left axis). Vertical gray bands represent macroeconomic uncertainty periods
(according to Jurado et al. 2015). Volatility (green line) is proxied by the daily squared
returns of prices (left axis). Black line refers to price series (right axis).
to macroeconomic uncertainty, this result is not surprising given the relationship that exists
between economic activity and the oil market. This episode of high oil price uncertainty is
accompanied by the biggest oil price spike in the postwar experience and results from various
macroeconomic factors. The 1984-1986 period is also characterized by heightened oil price
uncertainty, but it does not coincide with macroeconomic uncertainty. This episode seems
to be related to the conjunction of two events: (i) the production shutdown in Saudi Arabia
between 1981 and 1985, which caused a strong price decrease; and to a lesser extent (ii) the
OPEC collapse in 1986. Overall, the recent 2007-09 recession generated an unprecedented
episode of uncertainty in the price of oil. In addition, most important shocks that occurred in
the 1990s and the beginning of the 2000s that lead to price volatility do not generate systematic
price uncertainty, meaning that most of these movements were predictable at this period and
emphasizing the relevance of our uncertainty measure in linking uncertainty to predictability
rather than to volatility.
5
1 Introduction
The literature on oil and commodity markets during the last decade has shown the importance
to identify and understand the causes and consequences of commodity price shocks. Some
of the key insights (Kilian, 2008a) are that (i) most commodity prices are endogenous with
respect to the global business cycle, and (ii) demand shocks cause delayed and sustained price
movements while supply shocks have small and transitory e§ects. Whereas disentangling the
supply and demand components in a structural model is now common in the empirical literat-
ure to understand commodity price dynamics (especially for crude oil price), some important
concerns are missing regarding the e§ect of second-order moments (especially the one related
to uncertainty).
So far, the previous literature is indeed silent on the e§ects of macroeconomic uncertainty
on the volatility of commodity prices. This issue is nevertheless worthy of investigation since
the impact of uncertainty on the global economy has been widely documented. For instance,
theories of investment under uncertainty explain why under irreversibility condition or Öxed
costs, uncertainty over future returns reduces current investment, hiring, and consumption
through an ìoption value to waitî.1 The starting point is that at a micro level, uncertainty
may diminish the willingness of Örms to commit resources to irreversible investment and the
readiness of consumers to spend or allocate their earning and wages. It follows that micro-level
uncertainty may be transmitted to the macro level because uncertainty about the return to
investment at a micro level may create cyclical áuctuations in aggregate investment at a macro
level (see Bernanke, 1983).2 The crucial point here is that there is no reason why such mech-
anism at both micro and macro levels should not be extended to commodity markets. Indeed,
at a micro level, commodity Örms in several sectors (especially in oil industry) are confronted
to high costs and should be impacted by uncertainty about returns to investment. Similarly,
at a macro level, as prices are related to global supply and demand conditions, uncertainty
about macroeconomic aggregates should also a§ect commodity prices.
In the wake of the literature about the origins of commodity price movements, the aim of this
paper is to investigate the impact of uncertainty on commodity price returns and volatility.
Regarding the previous literature, the bulk of the studies have looked at the reverse relationship
and highlighted the signiÖcance of uncertainty in oil prices in explaining economic áuctuations
and in exacerbating asymmetry in the oil price-economic activity nexus.3 All of them suggest
that oil price uncertainty impacts output, investment, and consumption in the U.S. and G-7
1
See Bernanke (1983), Gibson and Schwartz (1990), Bloom et al. (2007), and Bloom (2009) among others.
2
This could be due to two reasons: (i) the macroeconomy is insu¢ciently diversiÖed and cannot be protec-
ted from micro-level áuctuations; and (ii) under imperfect information, agents may confound transitory and
permanent shocks, thereby converting a transitory shock into a persistent shock.
3
See Kilian (2014) for a review. The reader may also refer to the theoretical papers of Bernanke (1983) and
Pindyck (1991), and to the empirical studies of Elder and Serletis (2010) and Jo (2014) to name few. Note that,
as underlined by Kilian (2014), Elder and Serletis do not directly test for symmetry in the e§ect of oil prices,
but rather test the null of no feedback e§ect from the conditional variance of oil prices to the conditional mean.
6
countries in an asymmetric way. While providing interesting results, these studies su§er from
an important drawback since it is well known that the e§ect of uncertainty in the oil priceóand
commodity prices in generalóon the macroeconomy should be small, by construction of the
underlying economic models. As argued by Kilian (2014), energy is indeed not necessarily a key
component of the cash áow of investment projects, making the e§ect of oil price uncertainty on
output not plausible. It follows that looking at the reverse transmission from macroeconomic
uncertainty to the volatility of commodity prices is more relevant with regard to the modern
view of the endogenous component of prices. As stressed above, this question has not been
widely addressed in the literature. Some limited exceptions can, however, be mentioned. First,
regarding theoretical papers, (i) Pindyck (1980) discusses the implications of uncertainty asso-
ciated with oil demand and reserves on the oil price behavior; (ii) Litzenberger and Rabinowitz
(1995) analyze backwardation behavior in oil futures contracts; and (iii) Alquist and Kilian
(2010) allow for endogenous convenience yield and endogenous inventories, and stress that it
is uncertainty about the shortfall of supply relative to demand that matters. Second, among
empirical papers, one may refer to (i) Kilian (2009) and Kilian and Murphy (2014) who design
as a precautionary demand shock a shock that reáects shifts in uncertainty and treat mac-
roeconomic uncertainty as unobserved; and (ii) Van Robays (2013) who investigates whether
observed macroeconomic uncertainty changes the responsiveness of the oil price to shocks in
oil demand and supply.
Our paper extends this literature on the relationship between macroeconomic uncertainty and
commodity prices in several ways. SpeciÖcally, we address this question by examining the in-
áuence of macroeconomic uncertainty on a large panel of commodity markets. More precisely,
we consider four groups of 19 raw materials (energy, precious metals, agriculture, and industry)
to investigate whether the impact of macroeconomic uncertainty on commodity prices di§ers
depending on the type of market. In addition, with uncertainty evolving through time, we
account for this feature by assessing its impact at various horizonsónamely short-, medium-,
and long-run horizonsóto test whether its e§ect varies according to its maturity. From a
theoretical viewpoint, áuctuations in uncertainty may indeed have di§erent impacts through
time on the economy (Bloom, 2014), with usually two negative channels in the short run (the
real option and risk aversion/risk premium e§ects4) and two positive channels in the long run
(the growth option and Oi-Hartman-Abel e§ects5).6 Turning to methodological issues, our
contribution is threefold. First, we retain a nonlinear threshold vector autoregressive (TVAR)
speciÖcation that allows us to identify di§erent uncertainty states, and we investigate whether
4
The real option hypothesis refers to an option value to wait and suggests that uncertainty encourages Örms
to become cautious about adjustment costs. The risk aversion/risk premium e§ect refers to the cost of Önance,
which may increase in times of greater uncertainty.
5
See Bloom (2014) for a review of the related literature. The growth option argument is based on the idea
that uncertainty can encourage investment and R&D if it increases the size of the potential prize. The Oi-
Hartman-Abel e§ect refers to the fact that Örms can expand to exploit good outcomes and contract to insure
against bad outcomes, diminishing the potential impact of uncertainty.
6
Note that we do not explicitly investigate the channels through which uncertainty impacts commodity
marketsóa question that we leave for future researchóbut examine whether this impact may di§er across
levels of maturity.
7
the impact of uncertainty varies according to its level and variability. Second, because mac-
roeconomic uncertainty is unobservable, assessing its e§ect on commodity markets obviously
requires us to Önd an adequate proxy. To this end, we rely on Jurado et al. (2015) and con-
sider a robust approach to measuring macroeconomic uncertainty. The retained proxy uses a
wide range of monthly macroeconomic and Önancial indicators and is based on the underly-
ing idea of a link between uncertainty and predictability. In this sense, we go further than
the previous literatureóparticularly compared with Van Robays (2013)ís paper, which is the
closest to oursówhich generally relies on dispersion measures such as conditional volatility
(e.g. conditional variance of world industrial production growth or of U.S. GDP growth es-
timated from a GARCH(1,1) process) or the VXO index of Bloom (2009). As we will see, an
important drawback in using GARCH-type models to proxy uncertainty is that they are in-
herently backward-looking, whereas investorsí expectations tend to be forward-looking. More
generally, and thanks to a detailed robustness analysis, we show that the choice of the un-
certainty measure is crucial to avoid erroneously attributing to uncertainty áuctuations that
are actually predictable. Third, for the sake of completeness, we also investigate how macroe-
conomic uncertainty can generate uncertainty in commodity prices, looking at second-order
moments transfer. To this end, we construct a robust proxy of commodity market uncertainty
based on macroeconomic uncertainty, and provide a historical decomposition that allows us
to determine the contribution of macroeconomic uncertainty to commodity price uncertainty.
For the speciÖc case of oil, we further disentangle supply and demand components of oil price
uncertainty to assess their respective contribution during periods of uncertainty in the market.
The central message of the paper is that most of commodity price returns are a§ected by
macroeconomic uncertainty, the e§ect being more important for commodities that are strongly
related to the global business cycle (such as oil, agricultural, and industrial markets). Then,
in addition to traditional supply and demand shocks, macroeconomic uncertainty constitutes
another key channel through which economic fundamentals may impact commodity prices.
Maturity seems to matter depending on the commodity type; long-run uncertainty having
more e§ect on agricultural and industrial cumulative price dynamics, while other markets be-
ing more sensitive to short-run impacts. Furthermore, our new commodity price uncertainty
indicator shows for most considered series a transfer from macroeconomic uncertainty to price
uncertainty during the 2007-09 great recession period. It further reveals that volatility and
uncertainty in prices are disconnected. It is especially the case for oil as we Önd that most
important shocks that occurred in the 1990s and the beginning of the 2000s that lead to price
volatility do not generate systematic price uncertainty, meaning that most of these movements
were predictable at this period and emphasizing the relevance of our uncertainty measure in
linking uncertainty to predictability rather than to volatility.
The rest of the paper is organized as follows. Section 2 presents the uncertainty measure
and discusses the corresponding theoretical framework. Section 3 addresses methodological
issues by presenting the TVAR speciÖcation as well as our data. Section 4 displays the res-
ults regarding the impact of macroeconomic uncertainty on commodity markets. Section 5 is
8
devoted to the link between macroeconomic uncertainty and the uncertainty of each commod-
ity market, and disentangles the respective contribution of supply and demand shocks to oil
price uncertainty. Section 6 provides some robustness checks regarding the choice of both the
macroeconomic uncertainty measure and our measure of price uncertainty. Finally, Section 7
concludes the paper.
2 Uncertainty measure
2.1 Measuring macroeconomic uncertainty
Measuring uncertainty and examining its impact on market dynamics is a challenging question
for economists because no objective measure exists. Although in a general sense uncertainty is
deÖned as the conditional volatility of an unforecastable disturbance,7 the empirical literature
to date has usually relied on proxies. The most common measures used are the implied or
realized volatility of stock market returns, the cross-sectional dispersion of Örm proÖts, stock
returns, or productivity, and the cross-sectional dispersion of survey-based forecasts. However,
their adequacy to correctly proxy uncertainty is questionable, and such measures are even
misspeciÖed with regard to the theoretical notion of uncertainty, as highlighted by Jurado et
al. (2015). Indeed, stock market volatility, cross-sectional dispersion in stock returns and Örm
proÖts can vary over time due to several factorsósuch as risk aversion, the leverage e§ect,
and heterogeneity between Örmsóeven if there is no signiÖcant change in uncertainty. In
other words, áuctuations that are actually predictable can be erroneously attributed to uncer-
tainty, putting forward the importance of distinguishing between uncertainty in a series and
its conditional volatility. SpeciÖcally, properly measuring uncertainty requires to remove the
forecastable component of the considered series before computing the conditional volatility. In
this sense, uncertainty in a series is not equivalent to the conditional volatility of the raw series.
Another important characteristic of Jurado et al. (2015)ís approach is that macroeconomic
uncertainty is deÖned as the common variation in uncertainty across many series rather than
uncertainty related to any single series. This is in line with the uncertainty-based business
cycle theories which implicitly assume a common variation in uncertainty across a large num-
ber of series.
Accordingly, to provide a consistent measure of macroeconomic uncertainty, we follow the
deÖnition of Jurado et al. (2015) by linking uncertainty to predictability. SpeciÖcally, the h-
period-ahead uncertainty in the variable yjt 2 Yt =
!
y1t; :::; yNyt
"0
is deÖned as the conditional
volatility Uy
jt (h) of the purely unforecastable component of the future value of the series:
Uy
jt (h) #
r
E
h
(yjt+h $ E [yjt+h jJt ])2
jJt
i
; (1)
where j = 1; :::; Ny, E (: jJt ) is the conditional expectation of the considered variable and Jt
denotes the information set available at time t. Uncertainty related to the variable yjt+h is
7
See Bloom (2009), Bloom et al. (2010), Fernandez-Villaverde et al. (2011), Bloom et al. (2012), Gilchrist
et al. (2014), and Baker et al. (2015) among others.
9
therefore deÖned as the expectation of the squared error forecast. Aggregating over j indi-
vidual uncertainty measures Uy
jt (h) equally weighted by wj leads to the following expression
of aggregate or macroeconomic uncertainty:
Uy
t (h) # plimNy!1
Ny
X
j=1
wjUy
jt(h) # Ew
h
Uy
jt (h)
i
: (2)
As discussed by Jurado et al. (2015), the estimation of Equations (1) and (2) requires three
fundamental steps. The Örst step is to replace the conditional expectation E [yjt+h jJt ] in
Equation (1) by a forecast in order to compute forecast errors. It is a crucial step since the
forecastable component should be then removed from the conditional volatility computation.
To do so, an as rich as possible predictive model based on factors from a large set of N
predictors fXitg; i = 1; :::; N, is considered, taking the following approximated form:
Xit = +F0
i Ft + eX
it ; (3)
where Ft is a rf (1 vector of latent common factors, +F
i is the vector of latent factor loadings,
and eX
it is a vector of idiosyncratic errors which allows for some cross-sectional correlations. To
account for time-varying omitted-information bias, Jurado et al. (2015) further include estim-
ated factors, as well as non-linear functions of these factors in the forecasting model through
a di§usion forecast index. The second step consists of (i) deÖning the h-step-ahead forecast
error by V y
jt+h = yjt+h $ E [yjt+h jJt ], and (ii) estimating the related conditional volatility,
namely E
h!
V y
t+h
"2
jJt
i
. To account for time-varying volatility in the errors of the predictor
variables, E
h!
V y
t+h
"2
jJt
i
is recursively multistep-ahead computed for h > 1.8 In the third,
Önal step, macroeconomic uncertainty Uy
t (h) is constructed from the individual uncertainty
measures Uy
jt (h) through an equally-weighted average.
Using large datasets on economic activity, Jurado et al. (2015) provide two types of uncertainty
measures that are as free as possible from both the restrictions of theoretical models and/or de-
pendencies on a handful of economic indicators. The Örst one is the ìcommon macroeconomic
uncertaintyî based on the information contained in hundreds of primarily macroeconomic and
Önancial monthly indicators,9 and the second one is the ìcommon microeconomic uncertaintyî
8
From a statistical viewpoint, it is worth noting that time-varying uncertainty is decomposed into four
sources: an autoregressive component, a common factor component, a stochastic volatility component, and a
covariance term (see Jurado et al., 2015).
9
More speciÖcally, 132 macroeconomic time series are considered, including real output and income, employ-
ment and hours, real retail, manufacturing and trade sales, consumer spending, housing starts, inventories and
inventory sales ratios, orders and unÖlled orders, compensation and labor costs, capacity utilization measures,
price indexes, bond and stock market indexes, and foreign exchange measures. Turning to the Önancial indic-
ators, 147 time series are retained, including dividend-price and earning-price ratios, growth rates of aggregate
dividends and prices, default and term spreads, yields on corporate bonds of di§erent ratings grades, yields on
Treasuries and yield spreads, and a broad cross-section of industry equity returns. Both sets of data are used to
estimate the forecasting factors, but macroeconomic uncertainty is proxied using the 132 macroeconomic time
series only.
10
based on 155 quarterly Örm-level observations on proÖt growth normalized by sales.10,11 Empir-
ically, these measures have the advantage of providing far fewer important uncertainty episodes
than do popular proxies. As an example, though Bloom (2009) identiÖes 17 uncertainty periods
based on stock market volatility, Jurado et al. (2015) Önd evidence of only three episodes of
uncertainty over the 1959-2011 period: the month surrounding the 1973-74 and 1981-82 reces-
sions and the recent 2007-09 great recession. As stressed above, this illustrates that popular
uncertainty proxies based on volatility measures usually erroneously attribute to uncertainty
áuctuations that are actually forecastable. In addition, with the proposed measures deÖned
for di§erent values of h, they allow us to investigate uncertainty transmission in commodity
markets for distinct maturities.
2.2 Endogenous and exogenous components of uncertainty
One important issue when investigating the impact of macroeconomic uncertainty on com-
modity prices is to understand the intrinsic nature of uncertainty with respect to prices. In
other words, it is important to disentangle the endogenous and exogenous components of mac-
roeconomic uncertainty (i.e., whether macroeconomic uncertainty is demand-driven or supply-
driven with respect to commodity prices). Since 1974, the price of oilóas the price of other
commoditiesóhas become endogenous with respect to global macroeconomic conditions (see
Alquist et al., 2013). Since then, the empirical literature has provided overwhelming evid-
ence that commodity prices have been driven by global demand shocks.12 As pointed out by
Barsky and Kilian (2002), the 1973-74 episode of dramatic surge in the price of oil and indus-
trial commodities is the most striking example where the price increase was explained for 25%
by exogenous events and for 75% by shifts in the demand side. With the predominant role of
áow demand on prices, another important channel of transmission is the role of expectations
in the physical market (see among others, Kilian, 2009; Alquist and Kilian, 2010; and Kilian,
2014). The underlying idea is that anyone who expects the price to increase in the future
will be prompted to store oil now for future use leading to a shock from the demand of oil
inventories. Kilian and Murphy (2014) demonstrate that shifts in expectations through oil
inventories have played an important role during the oil price surge in 1979 and 1990, and the
price collapse in 1986.13
The aggregate speciÖcation of our proxy has the particularity to be ìglobalî, accounting for
a lot of information regarding uncertainty in the supply and demand channels. While it is
10
Dealing with monthly data and focusing on macroeconomic uncertainty, we consider in this paper the
ìcommon macroeconomic uncertaintyî measure.
11
The approach developed by Jurado et al. (2015) is mainly focused on U.S. data, and so the relationship
between macro and commodity prices is through the U.S. perspectives.
12
One exception for the case of oil is the 1990s, where the áow supply shocks have played an important role
(see Kilian and Murphy, 2014).
13
This shock is also often called ìspeculative demand shockî since it involves a forward-looking strategy (see
Kilian and Murphy, 2014).
11
quite di¢cult in this framework to identify the proportion of unanticipated demand or supply,
some reasonable assumptions about the e§ect of demand and supply shocks on prices may
give us some insight about the mechanisms behind the relationship between macroeconomic
uncertainty and commodity prices. In our analysis, we follow the dominant view about the
endogenous nature of commodity prices with respect to macroeconomic conditions, consider-
ing the aggregate demand channel as a primary source of price áuctuations (see Mabro, 1998;
Barsky and Kilian, 2002, 2004; Kilian, 2008a; and Hamilton, 2009). In line with the previous
literature, we therefore assume that exogenous events coming from the supply channelósuch as
cartel decisions, oil embargoes or the e§ects of political uncertainty from the Middle Eastóare
secondary, being mainly an indirect consequence of the macroeconomic environment. By con-
struction, our approach accounts for both channels, the demand channel being a direct e§ect
of macroeconomic aggregate and the supply channel an indirect e§ect of macroeconomic con-
ditions on exogenous events. In other words, our macroeconomic uncertainty proxy primarily
reáects uncertainty about the demand side.14
2.3 Backward-looking vs. forward-looking uncertainty
As previously discussed, it is quite di¢cult to approximate uncertainty because it is not observ-
able. One important issue regarding usual proxies based on conditional volatility is that they
are often backward-looking, whereas investorsí expectations tend to be forward-looking (Kilian
and Vigfusson, 2011). As an illustrative purpose, Figure ?? provides a comparison between
three uncertainty proxies. SpeciÖcally, the green line is the conditional volatility estimated
from a one-month GARCH(1,1) process for the U.S. GDP growth,15 the blue line is the VXO
stock market volatility index of Bloom (2009), and the red line is the common macroeconomic
uncertainty proxy of Jurado et al. (2015); the gray bands corresponding to the NBER recession
dates. Looking at the recent Önancial crisis, all proxies identify this episode as an important
source of macroeconomic uncertainty since a peak occurred for each series around 2008. How-
ever, some systematic di§erences regarding the identiÖed macroeconomic uncertainty periods
can be highlighted. The measure based on the GARCH speciÖcation starts to peak in Janu-
ary 2009, while the VXO index begins to peak in May 2008. The implied volatility proxy is
therefore more forward-looking than the one based on the conditional variance. Meanwhile,
the proxy developed by Jurado et al. (2015) peaks in June 2007, pointing out that it is the
most forward-looking measure. Moreover, comparing periods of uncertainty for each proxy
with NBER recession dates (December 2007-June 2009), we Önd that both GARCH and VXO
proxies are too backward-looking, while the macroeconomic uncertainty proxy we use peaks
just few months before the starting date of the recession. In other words, our retained measure
of macroeconomic uncertainty that accounts for forward-looking behavior of agents (whatever
14
Recall that assuming small e§ects for supply disruptions does not mean that exogenous political events do
not matter. Indeed, they also a§ect prices by shifting expectations about future shortfalls of supply relative to
demand (see Kilian, 2009; and Alquist and Kilian, 2010).
15
We focus on this series rather than on the world industrial production growth because it is designed to
reáect the overall uncertainty of the macroeconomic environment (see Van Robays, 2013).
12
the maturity considered) is the most appropriate one, and other approaches usually erroneously
attribute to uncertainty áuctuations that are actually predictable. Jurado et al. (2015) have
further documented that shocks to macroeconomic uncertainty lead to an increase in the VXO
index, the reverse e§ect being not veriÖed.16
Figure 2: Alternative measures of macroeconomic uncertainty
The concept of uncertainty is basically related to the perception of agents about potential fu-
ture evolutions. Together with the notion of time variability, it implies that di§erent horizons
lead to distinct perceptions of uncertainty, and thus disparate economic behaviors. As shown
by Jurado et al. (2015), uncertainty is generally higher for medium- and long-run maturities
(respectively 3 and 12 months) than for short-run horizons (1 month). In addition, the relative
importance of macroeconomic uncertainty in the total uncertainty (i.e., uncertainty accounting
for all series) grows as the forecast horizon increases. Accounting for the maturity is thus of
great importance to fully apprehend the impact of uncertainty on macroeconomic dynamics.
As shown by Jurado et al. (2015), uncertainty shocks with shorter uncertainty horizons tend
to be associated with a larger fraction of the forecast error variance in aggregates than those
16
See Figure 6 of Jurado et al. (2015)ís paper. Section 6.1 of our paper compares both proxies in the
context of commodity prices and conÖrms that the predictability-based approach of Jurado et al. (2015) is more
appropriated than the VXO index of Bloom (2009) to approximate macroeconomic uncertainty.
13
with longer uncertainty horizons.17
In the context of commodity prices and especially oil prices, the discussion is of primary im-
portance. The ongoing debate in the literature about the e§ect of maturity has been mainly
oriented toward the consequences of oil price uncertainty on economic activity. Kilian and Vig-
fusson (2011) provide an interesting comparison between the long-run theoretical uncertainty
measure of Bernanke (1983) and Pindyck (1991), and the empirical short-run uncertainty proxy
of Elder and Serletis (2010). According to the authors, the former deÖnition is related to un-
certainty at horizons relevant to investment decisions, while the latter is more appropriate to
capture the reallocation e§ect of Hamilton (1988) since it measures the current real oil price
volatility. Clearly, the e§ect of oil price uncertainty on activity depends on the impact of
the oil price on investment, but also on how companies face to uncertainty regarding their
investment decision plans. Indeed, depending on the sectors, the delay from the investment
decision to the beginning of the production can di§er, and short-run uncertainty can thus have
no impact for long-run investment strategies. All in all, accounting for the e§ect of maturity
when investigating the impact of uncertainty is thus of crucial importance.
3 Data and model speciÖcation
We consider a large dataset of 19 principal commodity markets, classiÖed into four categories:
energy, precious metals, agriculture, and industry. Related price series are monthly, starting
in October 1978 for energy markets, February 1976 for precious metals markets, and February
1980 for agricultural and industrial markets. The period ends in April 2015 for all groups of
commodities. All series are transformed into Örst-logarithmic di§erences (i.e., price returns),18
as described in Table 1 in Appendix A, which also provides data sources. Turning to data
related to macroeconomic uncertainty measures for distinct maturities, they are freely available
on Ludvigsonís homepage.19
3.1 Threshold VAR model
To analyze whether uncertainty a§ects commodity pricesí behavior depending on the level
of uncertainty, we consider that uncertainty may be a nonlinear propagator of shocks across
markets, captured by a threshold vector autoregressive model.20 A threshold VAR model is
17
More precisely, the authors show that when h = 1, common macroeconomic uncertainty shocks account
for between 3.59% and 15.13% of the forecast error variance in industrial production, compared to 0.52% and
10.56% for h = 12. For a review on the e§ects of maturity on uncertainty, see Bloom (2014).
18
The results of unit root tests are available upon request to the authors and show that all price return series
are stationary at conventional statistical levels.
19
http://www.econ.nyu.edu/user/ludvigsons/.
20
See Balke (2000), Tong (2010), and Hansen (2011) for more details on these models. It is important to note
that nonlinearities may arise in many di§erent forms. So far, empirical papers on the energy prices-economic
activity nexus have mainly focused on asymmetric speciÖcations (see e.g. Hamilton, 1996; Kilian and Vigfusson,
2011; Venditti, 2013). Our main purpose in this paper is to investigate whether the e§ect of macroeconomic
uncertainty on commodity price returns depends on the regime of uncertainty, justifying the use of a threshold
14
a nonlinear multivariate system of equations that models nonlinearity additively and can be
estimated by OLS. In addition to providing an intuitive way to capture the nonlinear e§ects of
uncertainty on markets, the TVAR model has the advantage of endogenously identifying dif-
ferent uncertainty states. Indeed, according to this speciÖcation, observations can be divided,
for example, into two states delimited by a threshold reached by uncertainty, with estimated
coe¢cients that vary depending on the considered state (low- and high-uncertainty states). In
other words, the TVAR speciÖcation allows uncertainty states to switch as a result of shocks
to commodity markets.
For each of our four groups of commodity markets, we consider a TVAR model of the form:
Yt = 41 + A1
Yt + B1
(L) Yt'1 +
!
42 + A2
Yt + B2
(L) Yt'1
"
It (ct'd ) :) + ut; (4)
where Yt is a vector of endogenous variables containing both the price returns of all commodit-
ies belonging to the considered group (energy, precious metals, industry, and agriculture) and
the measure of macroeconomic uncertainty,21 A1 and A2 reáect the contemporaneous relation-
ships in the two states, respectively, B1 (L) and B2 (L) are lag polynomial matrices, 41 and
42 are vectors of constants, and ut denotes the vector of orthogonalized error terms. ct'd is
the d-lagged threshold variable, which is a function of uncertainty (this hypothesis is discussed
and tested below, as well as the choice of the optimal value of d). It (ct'd ) :) is an indicator
function that equals 1 when ct'd ) : and 0 otherwise, where : denotes the threshold uncer-
tainty critical value that has to be endogenously estimated. In other words, two states are
identiÖed: the low-uncertainty state corresponding to a weak degree of uncertainty (It(:) = 0)
and the high-uncertainty state related to a high degree of uncertainty (It(:) = 1). As shown by
Equation (4), the coe¢cients of the TVAR model are allowed to change across states depending
on the level of uncertainty. Given the common belief in the literature since the beginning of
the 1970s about the endogenous nature of commodity prices with respect to macroeconomic
aggregates,22 we follow Kilian and Vega (2011) and adopt a recursive structure23 in A1 and
A2 based on a prespeciÖed causal order (to orthogonalize the residuals), ordering commodity
prices Örst and macroeconomic uncertainty last.24 With this speciÖc ordering, the response of
commodity prices to changes in macroeconomic uncertainty is assumed to occur with a delay
(see e.g. Kilian and Vega, 2011).
An essential step in TVAR approach is to test for the existence of a threshold e§ect with
respect to uncertainty. However, the testing procedure is not straightforward because under
speciÖcation.
21
We have four di§erent equations, one equation per group of commodity prices: (i) energy: oil, gas, uncer-
tainty proxy; (ii) precious metals: gold, silver, platinum, uncertainty proxy; (iii) agricultural: cocoa, cotton,
corn, co§ee, lumber, soybeans, sugar, wheat, uncertainty proxy; and (iv) industry: aluminium, copper, lead,
nickel, tin, zinc, uncertainty proxy.
22
See among others, Blanchard and Gali (2007), and Kilian and Park (2009).
23
We extend to the conditional variance the predeterminedness assumption of Kilian and Vega (2011) on the
conditional mean.
24
Results from this speciÖcation are those we present in the empirical part of the paper. However, our
conclusions are robust to di§erent ordering, i.e., macroeconomic uncertainty Örst and prices last.
15
the null hypothesis of no threshold e§ect, the threshold value is not known a priori and has
to be estimated.25 Here, the threshold is determined endogenously by a grid search over all
possible values of the threshold variable where the grid is trimmed at a lower and upper bound
to ensure a su¢cient number of data points for the estimation procedure in each regime.26 To
test for a threshold e§ect, we rely on nonstandard inference and estimate the model by least
squares for all possible threshold values. Conditionally to each possible threshold, we generate
three Wald-type statistics using Hansen (1996)ís simulation method to test the null hypothesis
of no di§erence between states: the maximum Wald statistic over all possible threshold values
(sup-Wald), the average Wald statistic over all possible values (avg-Wald), and a function of
the sum of exponential Wald statistics (exp-Wald). Because the asymptotic distribution of
Wald statistics is nonstandard, we use Hansen (1996)ís bootstrap procedure to simulate the
related distribution and conduct inference. The estimated threshold values are those that
maximize the log-determinant of the variance-covariance matrix of residuals.
Once the TVAR speciÖcation is estimated, another important concern consists in analyzing
nonlinear impulse-response functions (IRFs). In a nonlinear setup, impulse responses are more
complicated than in standard linear VAR models because responses to a shock are history-
dependent. Indeed, in a linear framework impulse responses are computed under the assump-
tion that shocks hit the series only at a particular point in time (i.e., neither before, nor during
the forecasting horizon). Unlike the standard framework, in our case the reaction of the endo-
genous variable to a shock depends on the past history, the state of the economy and the size
and the sign of all the shocks hitting the economy within the period of interest. In order to
average out the ináuences of shocks on the system, we compute generalized impulse-response
functions (GIRFs, see Koop et al., 1996). By relying on data simulation depending on the re-
gime of the system at the time of the shock hits the variables, this approach has the advantage
to allow for regime-dependent responses, as well as to look at the e§ects of shocks of di§erent
sizes and directions.
A GIRF can be deÖned by the following expression:
GIRFy (h; .t'1; ut) = E [yt+h j .t'1; ut] $ E [yt+h j .t'1] (5)
where .t'1 is the information set at time t $ 1 and ut is a particular realization of exogenous
shocks. The response of the variable y at horizon h is calculated by simulating the evolution of
the model conditionally on the initial condition .t'1 and a given realization of ut. The general
idea is to simulate the model for any possible starting point in the time horizon. We do this by
drawing vectors of shocks ut+j with j = 1; :::; k; and simulating the model conditionally on the
initial condition and given realization. We repeat the procedure for $ut+j in order to eliminate
any asymmetry that may arise from sampling variation in the draws of ut+j. The approach is
repeated 500 times. In order to generate IRFs conditionally to the location of the system with
respect to the threshold variable, the simulations are repeated for several histories depending
25
If the threshold value was known, it would be possible to simply test "2 = A2
= B2
(L) = 0.
26
The level of trimming is 15% as it is common in the literature.
16
on the considered regime. Finally, the response to shocks speciÖc to a particular regime is the
estimated conditional expectation based upon the average of the simulation results.27
3.2 Endogeneity and strict exogeneity between macroeconomic and com-
modity prices
As mentioned above, another complication when estimating TVAR models concerns the endo-
geneity issue. Endogeneity may come from the fact that the threshold variable (our uncertainty
measure) is allowed to endogenously respond to commodity price shocks. One way to address
this problem is to assume strict exogeneity between variables. However, as discussed by Van
Robays (2013) among others, assuming strict exogeneity between oil prices (and commodity
prices in general) and macroeconomic uncertainty is not realistic because it is well known
that a strong relationship exists between the oil market and economic activity. Therefore, a
common approach is to impose the threshold variable to switch across states with a delay.
This implies that we only evaluate commodity price shocks that occur within a certain state.
Another common assumption in the TVAR literature is to deÖne the threshold variable as a
moving average process that requires some persistence in the variation of the threshold variable
before shocks cause the regime switching. To fully address the issue of endogeneity, we combine
these two approaches in the present paper by considering a three-period moving average of our
one-period-lagged threshold variable.28
4 Uncertainty transmission across states
We now use the TVAR approach to apprehend the impact of macroeconomic uncertainty
on commodity prices. We Örst present threshold test results and related comments. We
then complement the analysis by conducting nonlinear IRF analysis under high- and low-
uncertainty states to investigate whether the transmission of macroeconomic uncertainty shocks
into commodity markets di§ers across states. Finally, we assess the ináuence of the considered
maturity.
4.1 Threshold test results
Tables 2 to 5 in Appendix A report the three threshold test results for each group of commodity
markets at di§erent maturities together with the ìpercentage of high uncertaintyî correspond-
ing to the percentage of observations such that the threshold variable is above the estimated
threshold critical value.29 Our main results can be summarized as follows.
27
The algorithm used to derive the GIRFs is described in Appendix A.
28
Results (available upon request to the authors) are robust to di§erent lag speciÖcations.
29
Following Jurado et al. (2015), we retain three maturities corresponding to macroeconomic uncertainty at
1, 3, and 12 months, referring to short-, medium-, and long-run perceptions, respectively.
17
First, the null hypothesis is always rejected in favor of the presence of threshold e§ects for each
group of markets and the maturity considered. The TVAR speciÖcation is thus appropriate
because it accounts for varying e§ects of uncertainty depending on the degree of uncertainty.
Second, the estimated threshold values increase with the maturity, meaning that as h increases,
the switching mechanism between low- and high-uncertainty states is delayed. This Önding
reáects a di§erent perception of the level of uncertainty as the horizon increases (Bloom, 2014)
and is also consistent with Jurado et al. (2015)ís conclusions, highlighting that the level of un-
certainty tends to augment along with the maturity. Third, turning to the percentage of high
uncertainty, the results deserve some detailed comments. Whatever the maturity considered,
agricultural and industrial markets display the highest percentages, whereas energy and pre-
cious metals markets are characterized by similar lower values. Moreover, high-uncertainty
percentage values are quite stable, regardless of the considered maturity for the latter two
markets. Regarding precious metals, this result can be explained by their safe-haven role
across all horizons during times of economic turmoil (Bredin et al., 2014), making them an
interesting tool to transfer short-run uncertainty to longer one. Concerning energy markets,
the limited substitution e§ects at relatively short-term horizons may explain the stability of
the high-uncertainty percentage values. Turning to agricultural markets, this sector is highly
sensitive to the unexpected changes in economy (Baumeister and Kilian, 2014), explaining why
the high-uncertainty percentage value is higher at the short-run, one-month maturity. Finally,
the observation that the percentage of high uncertainty increases with the maturity in the
case of industrial markets results from the sensitivity of this sector to structural factors that
are more at play in the long run. Indeed, to design proper R&D investment strategies, Örms
usually have to focus on longer horizons. Fourth, the evolution of the percentage of high un-
certainty according to the value of h also provides useful information regarding the sensitivity
of commodity markets to the level and variability of uncertainty. Indeed, as shown by Jurado
et al. (2015), the level of uncertainty increases with h, whereas its variability is a decreasing
function of h because the forecast value tends to the unconditional mean as the forecast hori-
zon tends to inÖnity. Consequently, the percentage of high uncertainty in agricultural markets
seems to be more sensitive to the variability of uncertainty (short-run uncertainty), but for
industrial markets, this percentage increases with h and seems to be more sensitive to the level
(long-run uncertainty).
Figure 1B in Appendix B presents these Öndings in a more dynamic way by showing the evol-
ution of our macroeconomic uncertainty measure at one month over the whole period together
with the corresponding threshold value. For almost all markets, periods of high uncertainty co-
incide with episodes of heightened macroeconomic uncertainty, such as the 1981-82 and 2007-09
recessions. These Ögures also illustrate the relevance of our measure of uncertainty. As stressed
above, we identify a few high-uncertainty episodes compared with studies that rely on stand-
ard volatility-type proxies, such as Bloom (2009) and Van Robays (2013). Consequently, most
of the áuctuations attributed to uncertainty using popular proxies are in fact not associated
with a broad-based movement in economic uncertainty. In other words, much of the variation
in traditional uncertainty proxies is not driven by uncertainty itself, again highlighting the
18
interest of our retained measure.
4.2 Nonlinear impulse-response function analysis
Figures 1C to 4C in Appendix C depict the impact of macroeconomic uncertainty for h = 1
on each commodity price return series. As shown, four lines are displayed, corresponding to
positive and negative nonlinear IRFs under high- and low-uncertainty states following a two-
standard-deviation macroeconomic uncertainty shock. For almost all series and as expected,
positive macroeconomic uncertainty shocks (i.e., increase in macroeconomic uncertainty) af-
fect commodity price returns negatively on average, whereas negative shocks (i.e., decrease
in macroeconomic uncertainty) impact price returns positively on average. This is a quite lo-
gical result, conÖrming that Jurado et al. (2015)ís macroeconomic uncertainty proxy is clearly
countercyclical. Moreover, the IRF analysis puts forward asymmetric behavior. Indeed, the
impact of macroeconomic uncertainty is generally stronger in high-uncertainty states compared
with low-uncertainty states, with commodity price returns being more sensitive to events that
lessen the predictability of macroeconomic variables. These Öndings illustrate the interest of
the TVAR speciÖcation by showing that the impact of macroeconomic uncertainty on com-
modity markets depends on its intensity.
At a more detailed level, considering the cases of energy and precious metals, the responses of
oil, gold, platinum, and silver markets are unequivocal because price returns strongly react to
macroeconomic uncertainty shocks in high-uncertainty states (between 4% to 7% for oil, gold
and platinum and approximately 10% for silver). Moreover, though the responses to positive
and negative shocks are quite persistent (eight months) and symmetric for oil and platinum,
the responses of gold and, to a lesser extent, silver are more transient (approximately four
months) and asymmetric. The safe-haven role of gold and silver markets during periods of
economic downturn could be one plausible explanation about the rapid overshooting reaction
of both prices. Recall that the proxy is countercyclical meaning that increases in uncertainty
correspond to recessionary periods. Therefore, for gold and silver prices two e§ects seem to be
at play: (i) macroeconomic uncertainty decreases the general price level since the economy is
in recession, and (ii) after a certain delay, the safe-haven role of precious metals leads to rapid
strong overshooting behaviors. The main drivers of oil and platinum markets are sensitive
to macroeconomic uncertainty shocks because they are strongly related to economic activity
through industry purposes. A di§erent pattern is observed for the gas market, for which the
response to macroeconomic uncertainty shocks is more important in low-uncertainty states.
The regional organization of this market may explain its relatively weak sensitivity to high
macroeconomic uncertainty. Turning to the industrial and agricultural sectors, all industrial
markets but the zinc follow quite similar patterns signiÖcantly reacting to uncertainty, as do
agricultural markets with the exception of co§eeówhich is a highly volatile marketóand, to
a lesser extent, sugar and wheat.
19
4.3 Does maturity matter?
Examining the ináuence of maturity when investigating the impact of uncertainty on prices
is of particular importance given the multiple channels and di§erent e§ects at play at short-,
medium-, and long-run horizons (see Bloom, 2014, for a review). Understanding the maturity
perception in assessing uncertainty is also of primary importance for commodity prices since
maturity may capture di§erent behaviors. For instance, short- and medium-run uncertainty
may capture a kind of reallocation e§ect (Hamilton, 1988) since such maturities focus on cur-
rent behaviors, while a long-run perception of uncertainty may be more related to Bernanke
(1983)ís framework because it corresponds to horizons relevant to purchase and investment
decisions.30 Our results in Section 4.1 give us a Örst insight about the static sensitivity of
prices to maturity.
Turning now to the dynamic analysis, Figure 1D in Appendix D reports the average (per
group of markets) cumulative responses of prices to positive high uncertainty two-standard
deviations shocks at maturity h. As before, three values of h are consideredónamely, 1, 3 and
12 months. The results are consistent with those of Section 4.1 revealing that maturity matters
for some markets. Though the percentage of high uncertainty is quite stable across maturity
for energy and precious metals markets, the responses of both groups to a positive shock are
quite similar giving more importance to the short-run e§ect. While the impact of short-run
uncertainty is clear for energy markets (in line with the close relationship that exists between
energy and economic activity in the short run), the response of precious metals markets seems
to be more sensitive to long-run uncertainty after a certain delay.31 The speciÖc behavior of
precious metals markets may come from the well-known safe-haven property transferring un-
certainty at 1 month to longer horizons (12 months). For industrial markets the conclusion is
more straightforward, uncertainty at longer maturity (h = 12) has a greater immediate impact
on price returns, conÖrming the high sensitivity of such markets to structural factors and the
reactiveness of industrial Örms to horizons relevant to long-run investments. Regarding the
agricultural sector, markets also appear to be more sensitive to long-run uncertainty, which
is quite logical since agricultural Örms may face longer horizons with respect to agricultural
investment decisions. On the whole, the important point regarding the impact on commodity
prices is not only the percentage of high uncertainty but also how shocks are incorporated into
the system and, in turn, their implications for economic behaviors.
30
Recall that, by construction, the level and the variability of our proxy of uncertainty respectively increases
and decreases with h. This property allows us to apprehend the sensitivity of commodity prices to both the
level and the variability of uncertainty.
31
Given the importance of the oil market in the literature, Figure 2D in Appendix D reports the speciÖc
response of the oil price to positive (left side) and negative (right side) macroeconomic shocks across maturity.
As for the whole energy markets group, the oil price is more sensitive to short-run uncertainty after a positive
shock. Looking at negative shocks (i.e., decrease in macroeconomic uncertainty), the response is quite symmetric
to the positive one, highlighting the importance of short-run uncertainty.
20
5 Does macroeconomic uncertainty generate commodity un-
certainty?
To provide a complete description of the links between macroeconomic uncertainty and com-
modity markets, we go a step further and investigate how macroeconomic uncertainty can
a§ect each commodity market uncertainty. To this end, we must deÖne an uncertainty meas-
ure for each market and then assess the transmission mechanism of macroeconomic uncertainty
to each speciÖc commodity market uncertainty.
5.1 Measuring commodity market uncertainty
Let us Örst consider the determination of the commodity market uncertainty proxy. We rely
on Equation (1) and proceed in two steps. In a Örst step, we use the previously estimated
TVAR model to generate the h-period-ahead forecast of the considered price return series,
accounting for the information about macroeconomic uncertainty. Let E [yt+h=Jt; uu
t ] be the
obtained forecast, where y is the considered commodity price return series, Jt the information
set available at time t, and uu
t the macroeconomic uncertainty shock at time t. As seen, our
forecast value accounts for information about macroeconomic uncertainty. Given this forecast,
we deÖne in a second step the h-period-ahead forecast error as the di§erence between yt+h and
E [yt+h=Jt; uu
t ], the forecast that accounts for information about macroeconomic uncertainty.
The underlying idea is that a way to understand the transmission mechanism of macroeco-
nomic uncertainty to commodity markets is to assess how the forecast of our considered variable
changes if we add information about macroeconomic uncertainty. The commodity market un-
certainty measure is then given by the volatility of this forecast error.
To account for the volatility-clustering phenomenon, which is a typical feature of commodity
markets, we rely on time-varying volatility speciÖcations and consider the moving average
stochastic volatility model developed by Chan and Jeliazkov (2009) and Chan and Hsiao (2013)
given by:32
xt = B + vt; (6)
where xt denotes the forecast error, i.e., the di§erence between the forecast of y that does not
account for information about macroeconomic uncertainty and the forecast that accounts for
such information. The error term vt is assumed to be serially dependent, following a MA(q)
process of the form:
vt = "t + 1"t'1 + ::: + q"t'q; (7)
32
For robustness checks, the GARCH, standard stochastic, and heavy-tailed stochastic volatility models have
also been considered to estimate the volatility of forecast errors. The corresponding results, available upon
request to the authors, are quite similar between models.
21
ht = Bh + Gh (ht'1 $ Bh) + Ht; (8)
where "t * N
!
0; eht
"
and Ht * N
!
0; I2
h
"
are independent of each other, "0 = "'1 = ::: =
"'q+1 = 0, and the roots of the polynomial associated with the MA coe¢cients =
!
1; :::; q
"0
are assumed to be outside the unit circle. ht is the log-volatility evolving as a stationary AR(1)
process. Following Chan and Hsiao (2013), under the moving average extension, the conditional
variance of the series xt is given by:
V (xt j B; ; h) = eht
+ 2
1eht'1
+ ::: + 2
qeht'q
: (9)
This speciÖcation allows us to capture two nonlinear channels of macroeconomic uncertainty:
(i) the one coming from the moving average of the q + 1 most recent variances eht + ::: + eht'q,
and (ii) the other from the AR(1) log-volatility stationary process given by Equation (8).
Given the challenge of estimating this kind of nonlinear model due to high-dimensional and
nonstandard dataówith the conditional density of the states being non-Gaussianóa Bayesian
estimation using Markov chain Monte Carlo methods is hardly tractable. We follow Chan
and Hsiao (2013) and estimate the conditional variance of forecast errors by band-matrix al-
gorithms instead of using conventional methods based on the Kalman Ölter.33
5.2 Transmission of macroeconomic uncertainty to commodity market un-
certainty
Figures 1E to 4E in Appendix E depict the evolution of uncertainty in commodity markets
for 1 month (blue line), together with the evolution of corresponding prices (black line) and
volatility (green line). The horizontal bar corresponds to 1.65 standard deviation above the
mean of each commodity-related uncertainty series. When uncertainty in commodity markets
exceeds the horizontal bar, this refers to episodes of heightened uncertainty for the considered
price return series. When commodity price uncertainty coincides with the vertical gray bands,
it indicates a potential transfer from macroeconomic to commodity market uncertainty (with
both uncertainty episodes occurring in the same period).34 Otherwise, uncertainty is attribut-
able to the own characteristics of the considered raw materials market.
Consider Örst the case of energy markets. As shown in Figure 1E (Appendix E), the sensitivity
of oil price uncertainty to macroeconomic uncertainty di§ers depending on the retained period,
highlighting that oil shocks do not all follow the same pattern. For example, the period that
just follows the invasion of Kuwait in 1990, the Afghan war in 2001, and the Iraq War in
33
See Chan and Jeliazkov (2009) and Chan and Hsiao (2013) for more details. The Matlab code used to
estimate the moving average stochastic volatility model is freely available from the website of Joshua Chan. We
obtain 20000 draws from the posterior distribution using the Gibbs sampler after a burn-in period of 1000.
34
Recall that the gray bands correspond to episodes of important macroeconomic uncertainty: the months
surrounding the 1973-74 and 1981-82 recessions and the 2007-09 great recession.
22
2002-03 are episodes characterized by sharp spikes in oil prices. The Iran-Iraq war in 1980 and
the 1999 OPEC meeting are, in contrast, associated with small price movements. As stressed
by Barsky and Kilian (2004), a simplistic view should be that major war episodes cause price
uncertainty to increase through a rise in precautionary demand for oil. However, among all
episodes of important áuctuations in oil prices, only two seem to be accompanied by uncer-
tainty:35 (i) the 2007-09 recession, and (ii) the 1984-86 period. During the 2007-09 recession,
oil price uncertainty is indeed very sensitive to macroeconomic uncertainty, a result that is not
surprising given the well-known relationship that exists between economic activity and the oil
market.36 This episode of high oil price uncertainty is accompanied by the biggest oil price
spike in the postwar experience and results from various macroeconomic factors. A common
explanation lies in the global economic growth starting in 2003, as illustrated by the increase
in real gross world product combined with the stagnant oil production from Saudi Arabia from
2005 to 2007.37 Whatever the origin of price surges, this period of macroeconomic uncertainty
is reáected in oil market uncertainty by an unprecedented oil price increase. The 1984-86
period is also characterized by heightened oil price uncertainty, but it does not coincide with
macroeconomic uncertainty. This episode seems to be related to the conjunction of two events:
(i) the production shutdown in Saudi Arabia between 1981 and 1985, which caused a strong
price decrease;38 and to a lesser extent (ii) the OPEC collapse in 1986. On the whole, our
results are in line with the literature that has recently stressed the limited impact of exogenous
events on oil price áuctuations. Another interesting period is the one from June 2014 up to now
where the WTI crude oil price has fallen from US$ 105.8 to around US$ 40 per barrel. Most of
this decline appeared between June 2014 and January 2015 where the price fell by nearly 44%
leading to severe economic stress on oil producers. Because sustained declines in the price of oil
are rare events, many observers and authors have conjectured that unexpected factors speciÖc
to the oil market have played an important role. Arezki and Blanchard (2014), for example,
attribute a large part of the steep decline in the price of oil to a shift in expectations about the
future path of global oil production (especially from the Libyan and Iraqi oil production, and
the OPEC November 2014 announcement). Competing with this view, Baumeister and Kilian
(2016) suggest that more than half of the observed decline was predictable and must reáect
the cumulative e§ect of earlier oil demand and supply shocks. Looking at our oil price uncer-
tainty indicator reveals that, whatever the origin of the oil price slump, most of the decline was
predictable until the end of our sample (April 2015) with no particular episode of uncertainty.
Turning to gas, the conclusion is somewhat di§erent given the well-known regional organization
of the market which may exempt the price from several international shocks. Results indeed
show that macroeconomic uncertainty does not generate uncertainty in the gas market. In
35
In Section 5.2 we precisely investigate what types of shocks tend to increase oil price uncertainty.
36
See Barksy and Kilian (2002, 2004), Kilian (2008a,b, 2009), Kilian and Murphy (2014) to name a few.
37
According to the U.S. Energy Information Administration, the total Saudi Arabia crude oil production
signiÖcantly decreases from 9,550.136 thousand barrels per day in 2005 to 8,721.5068 thousand barrels per day
in 2007.
38
At the beginning of the 1980s, the strategy of Saudi Arabia to shut down production (compensating higher
oil production elsewhere in the world) was initiated to prevent an oil price decline, without success. Saudi
Arabia Önally decided to ramp production back up in 1986, causing an oil shock from $27/barrel in 1985 to
$12/barrel in 1986 (see Kilian and Murphy, 2014).
23
particular, we do not observe heightened movements during the 2007-09 recession conÖrming
that the gas price should be more ináuenced by microeconomic events related to industrial
considerations. Some exceptions can be highlighted in 1996, 2001, and 2005, where the gas
market experienced short-lived periods of price increase and strong volatility. These events are
however more related to extreme climatic events (unusually cold weather in 1996 and the Kat-
rina/Rita hurricanes in 2005) and do not lead to episodes of extreme uncertainty (Kilian, 2010).
As discussed by Jurado et al. (2015) and conÖrmed by our previous analysis, macroeconomic
uncertainty is strongly countercyclical,39 roughly doubling in importance during recessions.
Given the role of precious metals (especially gold and silver) as safe havens and hedging in-
struments during Önancial and macroeconomic turmoils, their prices are often countercyclical
as well (see Christie-David et al., 2000; Roache and Rossi, 2009; Creti et al., 2013) and should
increase in periods of macroeconomic uncertainty, at least in the short run. Regarding the 2007-
09 recession, it seems (Figures 2E in Appendix E) that increases in gold and silver prices were
largely anticipated because the related uncertainty remained relatively low. In other words,
macroeconomic uncertainty did not spread to precious metals markets. This Önding conÖrms
the safe-heaven role of gold and silver given that macroeconomic uncertainty surrounding the
global crisis pushed up their prices, but did not induce uncertainty in their respective markets.
However, at the beginning of the 1980s, the high-uncertainty period associated with gold and
silver prices coincided with the 1981-82 recession. The gold market, which is often used as a
hedging instrument against ináation pressures, experienced huge movements in 1980 due to the
continued stop-and-go monetary policy of the Fed raising its rate to 20%, then lowering it to
8%, and augmenting it again to 20%.40 Uncertainty in the gold price was further ampliÖed in
1981, when Reagan decided to establish a Gold Commission to reject the return of the United
States to the gold standard system, leading the Fed to implement a contractionary policy that
reduced ináation but favored recession. Other events likely to ináuence gold prices, such as the
bombing of the Twin Towers in September 2001 or the launch of the Electronic Trading Funds
(ETFís) in the gold market in 2003, do not lead to price uncertainty. The silver price displays
a similar behavior as the gold price, but uncertainty appears to be ampliÖed, particularly
at the beginning of the 1980s. Among the several causes of silver price movements, various
political eventsóincluding the continuous U.S. hostage crisis in Iran and the Soviet invasion of
Afghanistanómotivated an increasing demand for silver, keeping the price at relatively high
levels in 1980 and leading to high uncertainty in the silver market. Another well-known epis-
ode a§ecting the silver price evolution around this period is the Hunt Brothersí story from the
1970s to the end of the 1980s.41 The worldwide 1981-82 recession strengthened this period
39
One reason is that exogenous shocks that often cause recessionsósuch as wars or Önancial panicsóalso
directly increase uncertainty (see Bloom, 2014).
40
On January 21, 1980, the gold price reached a record level of $850.
41
At the beginning of the 1970s, the Hunt Brothers began accumulating large amounts of silver to hedge
against oil investment, totaling almost the global market by 1979 (with an estimated holdings of the one third
of the entire silver world supply). This accumulation rose the price of silver from $11 per ounce at the end of
1979 to $50 per ounce in January 1980. In response to this speculative accumulation, the COMEX adopted
on January 7, 1980 the ìSilver Rule 7î placing heavy restrictions on the purchase of this commodity. Three
24
of uncertainty. The propagation mechanism at play during this recessionary episode was in-
trinsically linked to precious metals markets through ináation targeting and the Fed interest
rate policy, contrary to the recent Önancial crisis. Unlike gold, which is mainly used in jewelry
and as a store of value, platinum is a crucial resource in industryóautomotive industry, for
instance, represented approximately 60% of the total demand for platinum in 2007 (Johnson
Matthey Plc., 2008). Its price is thus strongly related to economic activity, and episodes of
high macroeconomic uncertainty tend to a§ect platinum price uncertainty, as it was the case
during the 2007-09 recession.
As the oil price, most of industrial markets are strongly connected to global economic activ-
ity. This important link is evidenced by the transfer of uncertainty from the macroeconomic
level to commodity prices, especially for copper, lead, nickel and tin prices (see Figures 3E
in Appendix E). For instance, because copper is primarily employed for industrial purposes42
(such as massive construction projects, infrastructure renewal, and telecommunication modi-
Öcations), it is usually strongly related to global economic activity, and its price is often used
as an indicator of global development. Therefore, the 2007-09 period of macroeconomic uncer-
tainty is closely related to copper price uncertainty, as shown in Figure 3E. Similar patterns are
observed for the other industrial markets, which are also strongly related to global economic
conditions.
The transfer of macroeconomic uncertainty to agricultural and food prices uncertainty is of
primary importance given the strong economical, political and social implications for both
developing and developed countries. The increase in agricultural commodity prices since the
mid-2000s has attracted particular attention among policymakers with regard to a global food
shortage and ináationary pressures.43 Though a popular perception is that higher agricultural
and food prices have been associated in recent yearsóespecially during the 2007-09 periodó
with oil price surges, this general statement has been recently contradicted by Baumeister and
Kilian (2014), who argue that agricultural and food price increases should not be interpreted as
the causal e§ect of higher oil prices, but are rather the result of unexpected changes in demand
associated with shifts in global real economic activity. Our Öndings (Figure 4E in Appendix E)
conÖrm this interpretation, especially for corn, soybeans and wheat, for which price uncertainty
occurs during the most striking episodes of macroeconomic uncertainty. Unexpected shifts in
global economic activity would therefore be the main cause of uncertainty in agricultural prices
during the 2007-09 recession. Periods for which agricultural price uncertainty is not related
to macroeconomic uncertainty di§er depending on the market. For instance, the most salient
episode of co§ee price uncertainty appears during 1994-97, when the price started a brief re-
months after (on March 27, 1980), the silver price collapsed to below $11 per ounce. This event is known as the
ìSilver Thursdayî.
42
Over the past century, the demand for reÖned copper has increased from 500,000 metric tons to over 19
million metric tons.
43
As documented by Baumeister and Kilian (2014), in the Monday 23, 2007 edition, the Financial Times
reported that ìretail food prices are heading for their biggest annual increase in as much as 30 years, raising
fears that the world faces an unprecedented period of food price ináationî.
25
covery after an intense Brazilian frost episode in 1994, which reduced Brazilís co§ee exports.
In 1989, the co§ee price experienced a volatility spike after the end of the co§ee agreement, but
this episode did not lead to uncertainty because it was largely anticipated. Another example
is the cotton market, which is characterized by a strong uncertainty episode that occurred in
2011, with a huge unanticipated price increase that could be explained by a constellation of
events such as gradually tightening stocks, an unexpected freeze in Chinaís cotton producing
areas, historic áoods in Pakistan and a ban on exports from India.
Overall, though the results are obviously somewhat heterogeneous across markets, the recent
2007-09 recession generated an unprecedented episode of uncertainty in the price of numer-
ous commodities, particularly oil, platinum, various agricultural commodities and, especially,
all industrial raw materials. The main exception concerns uncertainty related to gold and
silver prices, a fact that can be explained by their roles as safe havens and hedging instru-
ments. An additional result is that, as clearly shown by Figures 1E to 4E in Appendix E,
uncertainty episodes are not necessarily accompanied by high volatility in commodity prices.
This major Önding illustrates the interest of our retained measure of uncertainty, underlin-
ing that uncertainty is more related to predictability than to volatility. The relevance of the
predictability-based approach could be explained by some speciÖc properties of the commodity
markets. In particular, these markets are known to be characterized by a low elastic demand
together with a strong inertial supply, making any unexpected adjustment di¢cult and costly.
5.3 Historical decomposition analysis
To assess the contribution of macroeconomic uncertainty to commodity prices uncertainty,
we perform a historical decomposition analysis of each commodity market uncertainty with
respect to macroeconomic uncertainty. Based on the estimation of VAR models,44 Figure
1F in Appendix F reports the historical decomposition associated with oil and copper prices
uncertainty.45 Results in Appendix F conÖrm those of the previous section. Indeed, look-
ing at the crude oil market, we Önd a strong proportion of macroeconomic uncertainty in
oil price uncertainty during the recent 2007-09 Önancial crisis (around 35% of oil price un-
certainty is explained by macroeconomic uncertainty during this period). Recalling that our
proxy of macroeconomic uncertainty is demand-driven, these conclusions are in line with the
literature. During the 1986-87 episode, oil price uncertainty is not explained by macroeco-
nomic uncertainty and the proportion of macroeconomic uncertainty appears to be negative.
This suggests that other shocks not related to economic activity have been at play during this
period. Turning to the copper price, we also Önd a transfer from macroeconomic uncertainty to
price uncertainty, the share of macroeconomic uncertainty being around 12% during the recent
44
The lag order of the VAR speciÖcation is 3, as selected by usual information criteria.
45
Due to space constraints, we only report the results for oil and copper, two series that are strongly related
to the macroeconomic context. The results for the other series, available upon request to the authors, show
that the contribution of macroeconomic uncertainty to commodity price uncertainty is somewhat heterogeneous
between markets.
26
Önancial turmoil. Overall, these results show that a signiÖcant component of price uncertainty
can be explained by macroeconomic uncertainty. A key Önding is that the recent oil price
movements in 2005-08 associated with a rise in oil price uncertainty appear to be mainly the
consequence of macroeconomic uncertainty, conÖrming the endogeneity of the oil price with
respect to economic activity (i.e., the demand-driven characteristic).
5.4 Distinguishing between di§erent types of shocks: the special case of oil
As stressed above, macroeconomic uncertainty contributes to a large extent to price uncer-
tainty. This result is of primary importance, particularly for the oil market since it shows that
oil price uncertainty during the 2005-08 period can be partly explained by macroeconomic
uncertainty. Besides, the oil price uncertainty indicator (see Figure 1E in Appendix E) also
reveals that the volatility of the crude oil price can be sometimes disconnected to price uncer-
tainty, some shocks leading to uncertainty and volatility while some others not. One reason
could be the origin of price shocks that can have di§erent impacts on price uncertainty. Spe-
ciÖcally, four types of shocks can be distinguished (see, e.g., Kilian, 2009; and Baumeister and
Peersman, 2013): (i) shocks to the áow supply of oil, (ii) shocks to the áow demand for crude
oil reáecting the state of the global business cycle, (iii) shocks to the speculative demand for
oil stocks above the ground, and (iv) other idiosyncratic oil demand shocks. These di§erent
shocks may also be reáected in the degree of oil price uncertainty movements. SpeciÖcally, we
aim here at investigating which type of shock contributes the most to oil price uncertainty.
As it is common in the literature, we proxy the áow supply in two ways: by the data on Saudi
Arabia crude oil production, and by the global crude oil productionóboth series being from
the Energy Information Agency (EIA).46 Our measure of áuctuations in global real activity is
the dry cargo shipping rate index developed by Kilian (2009). Finally, turning to the speculat-
ive component of the oil demand, we rely on data for the U.S. crude oil inventories provided by
the EIA.47 Figure 1G in Appendix G allows us to assess the quantitative importance of each
type of shock (supply, demand, and speculation) on oil price uncertainty. Results show that
the contribution of each shock to price uncertainty varies depending on the period, and that
the nature of the shock matters in explaining oil price uncertainty. For instance, while Kilian
(2009) identiÖed the invasion of Kuwait in 199048 and the Iraq War in 2002-0349 as episodes
46
We only report results with Saudi Arabia crude oil production because they are more signiÖcant. Results
from the global crude oil production are available upon request to the authors.
47
As Kilian and Murphy (2014), we scaled the data on crude oil inventories by the ratio of OECD petroleum
stocks over U.S. petroleum stocks for each time period.
48
Hamilton (2009) rejected the hypothesis that shifts in speculative demand were behind the sharp increase
in the crude oil price in 1990. Rather, he suggested that the price increase was the consequence of oil supply
shocks. More recently, Kilian and Murphy (2014) found that the oil price increase was represented by two shocks
occurring simultaneously: an unexpected áow supply disruption and an unexpected increase in speculative
demand.
49
Two e§ects on the oil price are at play during this period: a positive speculative demand shock due to the
Iraq War in 2002-03, and a negative áow supply shock due to the Venezuelan crisis (see Kilian and Murphy,
27
of surges in speculative demand for oil responsible for sharp price increases, we Önd that these
events are not associated with important oil price uncertainty. More importantly, the contri-
bution of the speculative shocks appears to be very limited or even negative compared to the
contribution of áow supply (around 17%) and áow demand (4%) shocks in 1990.
Several events in the oil market history have appeared during the 1986-87 period. The two
most important are the decision of Saudi Arabia to shut down the crude oil production to prop
up the price of oil, and the OPEC collapse. While the latter is known to have limited impact
on the crude oil price (Barsky and Kilian, 2004), the former created a major positive shock
to the áow supply droving down the price of oil. As we have seen, this period has lead to an
important movement in oil price uncertainty. Figure 1G in Appendix G shows that this event
is mainly supply-driven: around 18% of oil price uncertainty is explained by the shut down of
Saudi Arabia crude oil production against less than 4% by the áow demand.
The most interesting episode over the last decades is obviously the unprecedented price surge
after 2003 and, in particular, in 2007-08, which led to the most heightened period of oil price
uncertainty. According to a popular view, this price increase was the consequence of speculat-
ive behaviors on the market (i.e., growing Önancialization of oil futures markets) and could not
be explained by changes in economic fundamentals (see Fattouh et al., 2013, for a discussion).
The standard interpretation is that oil traders in spot markets buy crude oil now and store
it in anticipation of higher future oil prices. On the contrary, the recent literature supports
the conclusion that the surge in the oil price during this period was mainly caused by shifts in
the áow demand driven by the global business cycle (see Kilian, 2009; and Kilian and Hicks,
2013). Our Öndings corroborate this view that oil price uncertainty has been primarily driven
by global macroeconomic conditions. Indeed, as shown in Figure 1G, the contribution of spec-
ulative demand to price uncertainty is very small (around 5%) compared to the proportion of
the áow demand from the global business cycle in 2008 (around 40%). An alternative view
regarding speculation is that OPEC held back its production by using oil below ground in
anticipation of higher oil prices. As discussed by Kilian and Murphy (2014), this behavior
would be classiÖed as a negative oil supply shock. Our results provide no evidence that such
negative oil supply shocks have signiÖcantly contributed to oil price uncertainty, contrary to
demand shocks.
Finally, looking at Figure 2G in Appendix G, which reports the simultaneous contribution of
each shock (áow demand, áow supply, speculative demand, and macroeconomic uncertainty)
to oil price uncertainty, we Önd that the 2007-08 period of heightened oil price uncertainty is
mainly the consequence of shocks coming from the global business cycle and macroeconomic
uncertainty.
2014, for a discussion).
28
6 Robustness checks
6.1 Volatility-based vs. predictability-based uncertainty measure
To conÖrm the relevance of our predictability-based measure in the case of commodity markets,
we assess the robustness of our Öndings to the choice of the proxy retained for uncertainty. As
stressed above, uncertainty is an abstract concept that may have di§erent meanings. Indeed,
according to behavioral theories, it reáects a psychological state about possible futures,50 but
it is also a broad concept linked to macro or micro phenomena (like GDP growth or the growth
rate of Örms among others).51 Whatever the considered deÖnition, there is no perfect measure
of uncertainty but instead a broad range of proxies. As described in Section 2, several studies
have used stock market volatility as a proxy for uncertainty.52 In an ináuential paper, Bloom
(2009) proposes a popular measure of uncertainty based on the VXO index, constructed by the
Chicago Board of Options Exchange from the prices of options contracts written on the S&P
100 index. He identiÖes around 17 uncertainty dates, whereas Jurado et al. (2015) report far
fewer uncertainty episodes, suggesting that variability in stock markets is much more related
to volatility than to uncertainty a§ecting the whole economy. Therefore, comparing these two
approaches allows us to compare both measures of uncertainty, namely the volatility-based
and predictability-based proxies. Theoretically, each measure relies on di§erent econometric
concepts: the former approach approximates uncertainty by conditional volatility, while the
latter requires to remove the forecastable component of the series before computing its con-
ditional volatility. In other words, the predictability-based proxy distinguishes uncertainty
in a series and its conditional volatility, while the volatility-based measure does not. As an
illustrative purpose, Figure ?? reports the VXO index of Bloom (2009) and the macroeco-
nomic uncertainty proxy (h = 1) introduced by Jurado et al. (2015) in standardized units.
As shown, the predictability-based proxy allows us to identify only three episodes of uncer-
tainty, which is far fewer than the 17 uncertainty dates detected using Bloom (2009)ís measure.
Figure 1H in Appendix H reports the response of commodity markets (for oil, gold, copper
and cotton prices) following a positive two-standard-deviation VXO index and macroeconomic
uncertainty shocks in the high-uncertainty state.53,54 In both cases, the level of oil and cot-
ton prices is reduced following the shock, leading to similar conclusions whatever the retained
50
In many behavioral theories, psychological uncertainty is assumed to be an important mediator of human
in situations with unknown outcomes (see Windschitl and Wells, 1996).
51
See Bloom (2014) for more details.
52
See e.g. Romer (1990), Hassler (2001), Greasley and Madsen (2006), Bloom et al. (2007), and Gilchrist et
al. (2014).
53
Due to space constraints, we only report the results for one series per group of commodities, and focus on
positive shocks (i.e., increase in uncertainty) in the high-uncertainty regime. Complete results are available
upon request to the authors.
54
Following Bloom (2009), we include the log of the S&P500 stock market index as the Örst variable in the
VAR estimations to ensure the impact of stock market levels is already controlled for when looking at the e§ect
of volatility shocks. Results are robust to alternative ordering.
29
Figure 3: Bloom (2009)ís index vs. Jurado et al. (2015)ís measure for uncertainty
proxy for uncertainty. The pattern is quite di§erent for the other markets. Indeed, the re-
sponse of gold and copper prices following a VXO index shock is very low compared to that
obtained with the macroeconomic uncertainty proxy. This particularity has also been noted
by Jurado et al. (2015) regarding the response of production and employment, Önding that
the magnitude is larger when the shock comes from macroeconomic uncertainty at 1 month
rather than from the VXO index. Moreover, macroeconomic uncertainty shocks generate a less
signiÖcant ìvolatility overshootî in commodity prices than the VXO index (with the excep-
tion of the cotton price). While the e§ect of macroeconomic uncertainty on commodity prices
(especially for oil and copper prices) is more protracted (around 7 months), the response of
prices after the VXO index shock is more transient (around 4 months for oil prices). This
result further conÖrms that the macroeconomic uncertainty proxy is more persistent compared
to popular volatility-based uncertainty proxies.
To complete our comparison, we follow the same procedure as in Section 5, and investigate
how volatility-based uncertainty linked to the VXO index can generate commodity uncertainty.
Figure 2H in Appendix H reports the evolution of commodity uncertainty for oil, gold, copper,
and cotton prices for both the VXO and macroeconomic uncertainty proxies at 1 month (h = 1).
30
When uncertainty in commodity markets exceeds the horizontal bar, this refers to episodes of
heightened uncertainty for the considered price return series. When commodity uncertainty
coincides with vertical bands, it indicates that uncertainty episodes occur at the same period
than macroeconomic uncertainty (green bands for the VXO-based uncertainty measure and
gray bands for our macroeconomic uncertainty proxy). As shown in Figure 2H, both proxies
generate quite similar commodity uncertainty dynamics. An interesting result concerns the
case of the oil market for which commodity uncertainty is found to be more pronounced during
the recent crisis using our retained macroeconomic uncertainty measure than with the VXO-
based uncertainty measure. This is in line with our previous results showing that uncertainty
episodes are not necessarily accompanied by high volatility in commodity prices. Moreover,
macroeconomic uncertainty rightly a§ects the gold market during the 1981-82 recession, a
characteristic that we identify using our predictability-based measure but not with Bloom
(2009)ís proxy. On the whole, these Öndings illustrate the robustness of our conclusions to the
retained proxy of uncertainty, and highlight the relevance of our measure in linking uncertainty
to predictability rather than to volatility.
6.2 Robustness of our proxy of oil price uncertainty
An important query regarding our results in Section 5 refers to the robustness of our proxy
of commodity price uncertainty. This question is of primary importance since, as discussed in
the literature,55 one reason why previous studies do not Önd plausible empirical evidence of
oil price uncertainty impact on GDP lies in the choice of an appropriate measure of uncertainty.
Theoretically, our approach implicitly assumes that oil price uncertainty (and commodity price
uncertainty in general) is endogenous with respect to macroeconomic activity. As discussed in
Section 2, this debate regarding the endogenous/exogenous nature of oil prices is of primary
importance since it conditions the framework used to investigate the economy-oil price nexus.
Considering that commodity price uncertainty is endogenous with respect to macroeconomic
uncertainty does not mean that exogenous e§ects are null or without interest, but rather that
they are secondary or indirect. By constructing our proxy of uncertainty based on the global
measure of Jurado et al. (2015), we allow both the supply and demand components of the
price to exist, but condition the latter to be the primary channel. With regard to this property,
our measure of oil price uncertainty is thus theoretically robust, compared to those based on
conditional volatility or implied volatility.
Empirically, existing proxies of oil price uncertainty have been so far either based on conditional
volatility, implied or realized volatility. However, due to their backward- or forward-looking
nature, it is unclear how these proxies can properly capture oil price uncertainty. To illustrate
this issue, Figure ?? reports the one-month implied crude oil volatility from the daily CBOE
VXO volatility index (Panel A), the realized volatility estimate constructed from daily percent
55
See Kilian and Vigfusson (2011) for a discussion.
31
Figure 4: Alternative measures of oil price uncertainty
0
20
40
60
80
100
1990 1995 2000 2005 2010
Panel A: One-month implied volatility
.00
.02
.04
.06
.08
.10
.12
1990 1995 2000 2005 2010
Panel B: Realized volatility
.04
.08
.12
.16
.20
.24
.28
1990 1995 2000 2005 2010
Panel C: Conditional GARCH(1,1) variance
.04
.06
.08
.10
.12
.14
1985 1990 1995 2000 2005 2010
Panel D: Oil price uncertainty
changes in the WTI crude oil spot price56 (Panel B), the conditional variance of the percent
change of WTI crude oil spot price based on the estimation of a GARCH(1,1) model (Panel C),
and our oil price uncertainty measure based on the variance of the forecast errors conditional
on macroeconomic uncertainty (Panel D). For almost all series, the most important peak
corresponds to the recent, 2007-09 Önancial turmoil and occurs near the end of 2008. However,
major di§erences between the four proxies can be highlighted regarding their backward- and
forward-looking degree. The GARCH-based proxy which peaks on January 2009 is the most
backward-looking measure compared to the realized and implied volatility approaches which
both peak on December 2008. Our oil price uncertainty proxy conditional on macroeconomic
uncertainty is the most forward-looking measure since it peaks on October 2008. Therefore,
given the forward-looking nature of investorsí expectations, our proxy appears to be the most
suitable measure of uncertainty.57
56
See Bachmeier, Li and Liu (2008).
57
Another way to compare alternative measures of oil price uncertainty is to test which approach leads to the
best predictor of volatility. Alquist et al. (2013) showed that the oil futures price is of limited use in forecasting
the oil price, questioning the interest of using the implied volatility to measure uncertainty.
32
7 Conclusion
The aim of this paper is to analyze the impact of macroeconomic uncertainty on various raw
materials markets. To this end, we consider a large sample of 19 commodities and rely on
a robust measure of macroeconomic uncertainty based on a wide range of monthly macroe-
conomic and Önancial indicators. To assess whether the e§ect of macroeconomic uncertainty
on commodity price returns depends on the degree of uncertainty, we estimate a nonlinear
threshold vector autoregressive model. Our Öndings show that whereas the safe-haven role of
precious metals is conÖrmed, agricultural and industrial markets are highly sensitive to the
variability and the level of macroeconomic uncertainty, respectively. In addition, investigating
the links between macroeconomic uncertainty and commodity price uncertainty, we show that
the recent 2007-09 recession has generated an unprecedented episode of high uncertainty in the
price of numerous raw materials, especially those that are linked to global economic activity.
Finally, we Önd evidence that uncertainty episodes are not necessarily accompanied by high
volatility in commodity prices, highlighting the relevance of our uncertainty measure in linking
uncertainty to predictability rather than to volatility.
33
Incertitude économique et volatilité des prix des matières premières

More Related Content

What's hot

Financial Programming and Oil Dynamics
Financial Programming and  Oil DynamicsFinancial Programming and  Oil Dynamics
Financial Programming and Oil DynamicsHELIOSPADILLAMAYER
 
11.0004www.iiste.org call for paper. 46-64
11.0004www.iiste.org call for paper. 46-6411.0004www.iiste.org call for paper. 46-64
11.0004www.iiste.org call for paper. 46-64Alexander Decker
 
Chapter 2 supply and demand
Chapter 2 supply and demandChapter 2 supply and demand
Chapter 2 supply and demandYesica Adicondro
 
Classical vs keynesian theory
Classical vs keynesian theoryClassical vs keynesian theory
Classical vs keynesian theoryRyan Reardon
 
2010 Kelly work example Analytical report for Siemens - High oil and gas pr...
2010 Kelly work example   Analytical report for Siemens - High oil and gas pr...2010 Kelly work example   Analytical report for Siemens - High oil and gas pr...
2010 Kelly work example Analytical report for Siemens - High oil and gas pr...JAKIRL
 
Chap1(the science of macroeconomics)
Chap1(the science of macroeconomics)Chap1(the science of macroeconomics)
Chap1(the science of macroeconomics)BaserAhmad
 

What's hot (8)

Financial Programming and Oil Dynamics
Financial Programming and  Oil DynamicsFinancial Programming and  Oil Dynamics
Financial Programming and Oil Dynamics
 
4. 46 64
4. 46 644. 46 64
4. 46 64
 
11.0004www.iiste.org call for paper. 46-64
11.0004www.iiste.org call for paper. 46-6411.0004www.iiste.org call for paper. 46-64
11.0004www.iiste.org call for paper. 46-64
 
Chapter 2 supply and demand
Chapter 2 supply and demandChapter 2 supply and demand
Chapter 2 supply and demand
 
Classical vs keynesian theory
Classical vs keynesian theoryClassical vs keynesian theory
Classical vs keynesian theory
 
2010 Kelly work example Analytical report for Siemens - High oil and gas pr...
2010 Kelly work example   Analytical report for Siemens - High oil and gas pr...2010 Kelly work example   Analytical report for Siemens - High oil and gas pr...
2010 Kelly work example Analytical report for Siemens - High oil and gas pr...
 
1. capítulo 1
1. capítulo 11. capítulo 1
1. capítulo 1
 
Chap1(the science of macroeconomics)
Chap1(the science of macroeconomics)Chap1(the science of macroeconomics)
Chap1(the science of macroeconomics)
 

Viewers also liked

Openobject contribute
Openobject contributeOpenobject contribute
Openobject contributeAli Mashduqi
 
การพยาบาลผู้ป่วยผู้ใหญ่ที่มีปัญหาเกี่ยวกับระบบสืบพันธุ์และนรีเวชวิทยา
การพยาบาลผู้ป่วยผู้ใหญ่ที่มีปัญหาเกี่ยวกับระบบสืบพันธุ์และนรีเวชวิทยาการพยาบาลผู้ป่วยผู้ใหญ่ที่มีปัญหาเกี่ยวกับระบบสืบพันธุ์และนรีเวชวิทยา
การพยาบาลผู้ป่วยผู้ใหญ่ที่มีปัญหาเกี่ยวกับระบบสืบพันธุ์และนรีเวชวิทยาChutchavarn Wongsaree
 
เอกสารประกอบการสอน : การพยาบาลผู้ป่วยผู้ใหญ่ที่มีปัญหาเกี่ยวกับระบบสืบพันธุ์แ...
เอกสารประกอบการสอน : การพยาบาลผู้ป่วยผู้ใหญ่ที่มีปัญหาเกี่ยวกับระบบสืบพันธุ์แ...เอกสารประกอบการสอน : การพยาบาลผู้ป่วยผู้ใหญ่ที่มีปัญหาเกี่ยวกับระบบสืบพันธุ์แ...
เอกสารประกอบการสอน : การพยาบาลผู้ป่วยผู้ใหญ่ที่มีปัญหาเกี่ยวกับระบบสืบพันธุ์แ...Chutchavarn Wongsaree
 
08 f10--market research
08 f10--market research08 f10--market research
08 f10--market researchAli Mashduqi
 
Boxmesh Presentation
Boxmesh PresentationBoxmesh Presentation
Boxmesh PresentationBoxmesh
 
Protéger ses données: mission impossible?
Protéger ses données: mission impossible?Protéger ses données: mission impossible?
Protéger ses données: mission impossible?Antoine Vigneron
 
The Higher Ed Analytics Revolution
The Higher Ed Analytics RevolutionThe Higher Ed Analytics Revolution
The Higher Ed Analytics RevolutionKarine Joly
 
The 2012 State of Social Media and Web Analytics in Higher Ed
The 2012 State of Social Media and Web Analytics in Higher EdThe 2012 State of Social Media and Web Analytics in Higher Ed
The 2012 State of Social Media and Web Analytics in Higher EdKarine Joly
 
Trabajo arte
Trabajo arte Trabajo arte
Trabajo arte jaionetxu
 
Arte Gótico
Arte GóticoArte Gótico
Arte Góticojaionetxu
 
Arte románico
Arte románicoArte románico
Arte románicojaionetxu
 
ARCHINT: Hotel Design 1.0
ARCHINT: Hotel Design 1.0ARCHINT: Hotel Design 1.0
ARCHINT: Hotel Design 1.0ArchiEducPH
 

Viewers also liked (19)

Openobject contribute
Openobject contributeOpenobject contribute
Openobject contribute
 
Openobject bi
Openobject biOpenobject bi
Openobject bi
 
การพยาบาลผู้ป่วยผู้ใหญ่ที่มีปัญหาเกี่ยวกับระบบสืบพันธุ์และนรีเวชวิทยา
การพยาบาลผู้ป่วยผู้ใหญ่ที่มีปัญหาเกี่ยวกับระบบสืบพันธุ์และนรีเวชวิทยาการพยาบาลผู้ป่วยผู้ใหญ่ที่มีปัญหาเกี่ยวกับระบบสืบพันธุ์และนรีเวชวิทยา
การพยาบาลผู้ป่วยผู้ใหญ่ที่มีปัญหาเกี่ยวกับระบบสืบพันธุ์และนรีเวชวิทยา
 
เอกสารประกอบการสอน : การพยาบาลผู้ป่วยผู้ใหญ่ที่มีปัญหาเกี่ยวกับระบบสืบพันธุ์แ...
เอกสารประกอบการสอน : การพยาบาลผู้ป่วยผู้ใหญ่ที่มีปัญหาเกี่ยวกับระบบสืบพันธุ์แ...เอกสารประกอบการสอน : การพยาบาลผู้ป่วยผู้ใหญ่ที่มีปัญหาเกี่ยวกับระบบสืบพันธุ์แ...
เอกสารประกอบการสอน : การพยาบาลผู้ป่วยผู้ใหญ่ที่มีปัญหาเกี่ยวกับระบบสืบพันธุ์แ...
 
08 f10--market research
08 f10--market research08 f10--market research
08 f10--market research
 
Barfdoll
BarfdollBarfdoll
Barfdoll
 
Boxmesh Presentation
Boxmesh PresentationBoxmesh Presentation
Boxmesh Presentation
 
H5 g sklas2
H5 g sklas2H5 g sklas2
H5 g sklas2
 
Protéger ses données: mission impossible?
Protéger ses données: mission impossible?Protéger ses données: mission impossible?
Protéger ses données: mission impossible?
 
Intro to Apache Spark
Intro to Apache SparkIntro to Apache Spark
Intro to Apache Spark
 
The Higher Ed Analytics Revolution
The Higher Ed Analytics RevolutionThe Higher Ed Analytics Revolution
The Higher Ed Analytics Revolution
 
Insee prix du pétrole
Insee prix du pétroleInsee prix du pétrole
Insee prix du pétrole
 
The 2012 State of Social Media and Web Analytics in Higher Ed
The 2012 State of Social Media and Web Analytics in Higher EdThe 2012 State of Social Media and Web Analytics in Higher Ed
The 2012 State of Social Media and Web Analytics in Higher Ed
 
Kibana
KibanaKibana
Kibana
 
Trabajo arte
Trabajo arte Trabajo arte
Trabajo arte
 
Arte Gótico
Arte GóticoArte Gótico
Arte Gótico
 
Arte románico
Arte románicoArte románico
Arte románico
 
Big Data Trends
Big Data TrendsBig Data Trends
Big Data Trends
 
ARCHINT: Hotel Design 1.0
ARCHINT: Hotel Design 1.0ARCHINT: Hotel Design 1.0
ARCHINT: Hotel Design 1.0
 

Similar to Incertitude économique et volatilité des prix des matières premières

Oil production, entrepreneurship, and the allocation of talent
Oil production, entrepreneurship, and the allocation of talent Oil production, entrepreneurship, and the allocation of talent
Oil production, entrepreneurship, and the allocation of talent Economic Research Forum
 
Exchange rate and macroeconomic aggregates in nigeria
Exchange rate and macroeconomic aggregates in nigeriaExchange rate and macroeconomic aggregates in nigeria
Exchange rate and macroeconomic aggregates in nigeriaAlexander Decker
 
11.exchange rate and macroeconomic aggregates in nigeria
11.exchange rate and macroeconomic aggregates in nigeria11.exchange rate and macroeconomic aggregates in nigeria
11.exchange rate and macroeconomic aggregates in nigeriaAlexander Decker
 
The choice of the exchange policies in the primary commodity exporting countr...
The choice of the exchange policies in the primary commodity exporting countr...The choice of the exchange policies in the primary commodity exporting countr...
The choice of the exchange policies in the primary commodity exporting countr...Alexander Decker
 
Oil Prices and the Global Economy: Is It Di¤erent This Time Around?
Oil Prices and the Global Economy: Is It Di¤erent This Time Around?Oil Prices and the Global Economy: Is It Di¤erent This Time Around?
Oil Prices and the Global Economy: Is It Di¤erent This Time Around?Economic Research Forum
 
Cause & effect relationshipt research paper qta -kashif ahmed saeed
Cause & effect relationshipt   research paper qta -kashif ahmed saeedCause & effect relationshipt   research paper qta -kashif ahmed saeed
Cause & effect relationshipt research paper qta -kashif ahmed saeedKashif Ahmed Saeed
 
mankiw11e_lecture_slides_ch01.pptx
mankiw11e_lecture_slides_ch01.pptxmankiw11e_lecture_slides_ch01.pptx
mankiw11e_lecture_slides_ch01.pptxmseconomics
 
11.crude oil price, stock price and some selected macroeconomic indicators
11.crude oil price, stock price and some selected macroeconomic indicators11.crude oil price, stock price and some selected macroeconomic indicators
11.crude oil price, stock price and some selected macroeconomic indicatorsAlexander Decker
 
Sovereign credit risk, liquidity, and the ecb intervention: deus ex machina? ...
Sovereign credit risk, liquidity, and the ecb intervention: deus ex machina? ...Sovereign credit risk, liquidity, and the ecb intervention: deus ex machina? ...
Sovereign credit risk, liquidity, and the ecb intervention: deus ex machina? ...SYRTO Project
 
Fighting inflation in a dollarized economy the case of vietnam
Fighting inflation in a dollarized economy the case of vietnamFighting inflation in a dollarized economy the case of vietnam
Fighting inflation in a dollarized economy the case of vietnamPhan Phuong
 
The impact of oil demand and oil supply shocks on the real price of oil and o...
The impact of oil demand and oil supply shocks on the real price of oil and o...The impact of oil demand and oil supply shocks on the real price of oil and o...
The impact of oil demand and oil supply shocks on the real price of oil and o...Fundación Ramón Areces
 
International Review of Financial Analysis 48 (2016) 376–387.docx
International Review of Financial Analysis 48 (2016) 376–387.docxInternational Review of Financial Analysis 48 (2016) 376–387.docx
International Review of Financial Analysis 48 (2016) 376–387.docxvrickens
 
week 6 Discussion 1 Chapter 12 –From the chapter reading, we l.docx
week 6 Discussion 1 Chapter 12 –From the chapter reading, we l.docxweek 6 Discussion 1 Chapter 12 –From the chapter reading, we l.docx
week 6 Discussion 1 Chapter 12 –From the chapter reading, we l.docxhelzerpatrina
 
Exchange rate pass-through: What has changed since the crisis?
Exchange rate pass-through: What has changed since the crisis?Exchange rate pass-through: What has changed since the crisis?
Exchange rate pass-through: What has changed since the crisis?Eesti Pank
 

Similar to Incertitude économique et volatilité des prix des matières premières (20)

Oil production, entrepreneurship, and the allocation of talent
Oil production, entrepreneurship, and the allocation of talent Oil production, entrepreneurship, and the allocation of talent
Oil production, entrepreneurship, and the allocation of talent
 
Exchange rate and macroeconomic aggregates in nigeria
Exchange rate and macroeconomic aggregates in nigeriaExchange rate and macroeconomic aggregates in nigeria
Exchange rate and macroeconomic aggregates in nigeria
 
11.exchange rate and macroeconomic aggregates in nigeria
11.exchange rate and macroeconomic aggregates in nigeria11.exchange rate and macroeconomic aggregates in nigeria
11.exchange rate and macroeconomic aggregates in nigeria
 
The choice of the exchange policies in the primary commodity exporting countr...
The choice of the exchange policies in the primary commodity exporting countr...The choice of the exchange policies in the primary commodity exporting countr...
The choice of the exchange policies in the primary commodity exporting countr...
 
Oil Prices and the Global Economy: Is It Di¤erent This Time Around?
Oil Prices and the Global Economy: Is It Di¤erent This Time Around?Oil Prices and the Global Economy: Is It Di¤erent This Time Around?
Oil Prices and the Global Economy: Is It Di¤erent This Time Around?
 
5-ECON939 Project
5-ECON939 Project5-ECON939 Project
5-ECON939 Project
 
Transfer Pricing of Multinational Corporations and Macroeconomic Volatility: ...
Transfer Pricing of Multinational Corporations and Macroeconomic Volatility: ...Transfer Pricing of Multinational Corporations and Macroeconomic Volatility: ...
Transfer Pricing of Multinational Corporations and Macroeconomic Volatility: ...
 
Cause & effect relationshipt research paper qta -kashif ahmed saeed
Cause & effect relationshipt   research paper qta -kashif ahmed saeedCause & effect relationshipt   research paper qta -kashif ahmed saeed
Cause & effect relationshipt research paper qta -kashif ahmed saeed
 
mankiw11e_lecture_slides_ch01.pptx
mankiw11e_lecture_slides_ch01.pptxmankiw11e_lecture_slides_ch01.pptx
mankiw11e_lecture_slides_ch01.pptx
 
opec_12048_Rev2
opec_12048_Rev2opec_12048_Rev2
opec_12048_Rev2
 
Opec 12048 rev2
Opec 12048 rev2Opec 12048 rev2
Opec 12048 rev2
 
11.crude oil price, stock price and some selected macroeconomic indicators
11.crude oil price, stock price and some selected macroeconomic indicators11.crude oil price, stock price and some selected macroeconomic indicators
11.crude oil price, stock price and some selected macroeconomic indicators
 
CASE Network Studies and Analyses 224 - Predicting Currency Crises, the Ultim...
CASE Network Studies and Analyses 224 - Predicting Currency Crises, the Ultim...CASE Network Studies and Analyses 224 - Predicting Currency Crises, the Ultim...
CASE Network Studies and Analyses 224 - Predicting Currency Crises, the Ultim...
 
Sovereign credit risk, liquidity, and the ecb intervention: deus ex machina? ...
Sovereign credit risk, liquidity, and the ecb intervention: deus ex machina? ...Sovereign credit risk, liquidity, and the ecb intervention: deus ex machina? ...
Sovereign credit risk, liquidity, and the ecb intervention: deus ex machina? ...
 
Fighting inflation in a dollarized economy the case of vietnam
Fighting inflation in a dollarized economy the case of vietnamFighting inflation in a dollarized economy the case of vietnam
Fighting inflation in a dollarized economy the case of vietnam
 
The impact of oil demand and oil supply shocks on the real price of oil and o...
The impact of oil demand and oil supply shocks on the real price of oil and o...The impact of oil demand and oil supply shocks on the real price of oil and o...
The impact of oil demand and oil supply shocks on the real price of oil and o...
 
International Review of Financial Analysis 48 (2016) 376–387.docx
International Review of Financial Analysis 48 (2016) 376–387.docxInternational Review of Financial Analysis 48 (2016) 376–387.docx
International Review of Financial Analysis 48 (2016) 376–387.docx
 
Impact of Oil Price Volatility on Macroeconomic Variables and Sustainable Dev...
Impact of Oil Price Volatility on Macroeconomic Variables and Sustainable Dev...Impact of Oil Price Volatility on Macroeconomic Variables and Sustainable Dev...
Impact of Oil Price Volatility on Macroeconomic Variables and Sustainable Dev...
 
week 6 Discussion 1 Chapter 12 –From the chapter reading, we l.docx
week 6 Discussion 1 Chapter 12 –From the chapter reading, we l.docxweek 6 Discussion 1 Chapter 12 –From the chapter reading, we l.docx
week 6 Discussion 1 Chapter 12 –From the chapter reading, we l.docx
 
Exchange rate pass-through: What has changed since the crisis?
Exchange rate pass-through: What has changed since the crisis?Exchange rate pass-through: What has changed since the crisis?
Exchange rate pass-through: What has changed since the crisis?
 

More from Société Tripalio

Documents officiels du dossier Epstein, délivrés par la Justice
Documents officiels du dossier Epstein, délivrés par la JusticeDocuments officiels du dossier Epstein, délivrés par la Justice
Documents officiels du dossier Epstein, délivrés par la JusticeSociété Tripalio
 
Charte du candidat Prenons-nous en main pour 2024
Charte du candidat Prenons-nous en main pour 2024Charte du candidat Prenons-nous en main pour 2024
Charte du candidat Prenons-nous en main pour 2024Société Tripalio
 
Prenons-nous en main 2024 : le programme !
Prenons-nous en main 2024 : le programme !Prenons-nous en main 2024 : le programme !
Prenons-nous en main 2024 : le programme !Société Tripalio
 
Conclusions de la COP 28 de Dubai, décembre 2023
Conclusions de la COP 28 de Dubai, décembre 2023Conclusions de la COP 28 de Dubai, décembre 2023
Conclusions de la COP 28 de Dubai, décembre 2023Société Tripalio
 
l16t0197_texte-adopte-seance.pdf
l16t0197_texte-adopte-seance.pdfl16t0197_texte-adopte-seance.pdf
l16t0197_texte-adopte-seance.pdfSociété Tripalio
 
ecb.sp231121_1~8df317dc17.en.pdf
ecb.sp231121_1~8df317dc17.en.pdfecb.sp231121_1~8df317dc17.en.pdf
ecb.sp231121_1~8df317dc17.en.pdfSociété Tripalio
 
2023-11-14-allocution-laurent-fabius (1).pdf
2023-11-14-allocution-laurent-fabius (1).pdf2023-11-14-allocution-laurent-fabius (1).pdf
2023-11-14-allocution-laurent-fabius (1).pdfSociété Tripalio
 
RCP pfizer octobre 2023 anx_160809_fr.pdf
RCP pfizer octobre 2023 anx_160809_fr.pdfRCP pfizer octobre 2023 anx_160809_fr.pdf
RCP pfizer octobre 2023 anx_160809_fr.pdfSociété Tripalio
 
Circulaire_relative_à_la_lutte_contre_les_infractions_susceptibles_d'être_c...
Circulaire_relative_à_la_lutte_contre_les_infractions_susceptibles_d'être_c...Circulaire_relative_à_la_lutte_contre_les_infractions_susceptibles_d'être_c...
Circulaire_relative_à_la_lutte_contre_les_infractions_susceptibles_d'être_c...Société Tripalio
 
Dr Broussalian réponse pour Olivier Soulier.pdf
Dr Broussalian réponse pour Olivier Soulier.pdfDr Broussalian réponse pour Olivier Soulier.pdf
Dr Broussalian réponse pour Olivier Soulier.pdfSociété Tripalio
 
dffe1cf9ec241b5152a8688602d58ff1e640e4c1.pdf
dffe1cf9ec241b5152a8688602d58ff1e640e4c1.pdfdffe1cf9ec241b5152a8688602d58ff1e640e4c1.pdf
dffe1cf9ec241b5152a8688602d58ff1e640e4c1.pdfSociété Tripalio
 
2023-incidences-economiques-rapport-pisani-5juin.pdf
2023-incidences-economiques-rapport-pisani-5juin.pdf2023-incidences-economiques-rapport-pisani-5juin.pdf
2023-incidences-economiques-rapport-pisani-5juin.pdfSociété Tripalio
 

More from Société Tripalio (20)

Documents officiels du dossier Epstein, délivrés par la Justice
Documents officiels du dossier Epstein, délivrés par la JusticeDocuments officiels du dossier Epstein, délivrés par la Justice
Documents officiels du dossier Epstein, délivrés par la Justice
 
Charte du candidat Prenons-nous en main pour 2024
Charte du candidat Prenons-nous en main pour 2024Charte du candidat Prenons-nous en main pour 2024
Charte du candidat Prenons-nous en main pour 2024
 
Prenons-nous en main 2024 : le programme !
Prenons-nous en main 2024 : le programme !Prenons-nous en main 2024 : le programme !
Prenons-nous en main 2024 : le programme !
 
Conclusions de la COP 28 de Dubai, décembre 2023
Conclusions de la COP 28 de Dubai, décembre 2023Conclusions de la COP 28 de Dubai, décembre 2023
Conclusions de la COP 28 de Dubai, décembre 2023
 
Rapport AME 04122023_vf.pdf
Rapport AME 04122023_vf.pdfRapport AME 04122023_vf.pdf
Rapport AME 04122023_vf.pdf
 
l16t0197_texte-adopte-seance.pdf
l16t0197_texte-adopte-seance.pdfl16t0197_texte-adopte-seance.pdf
l16t0197_texte-adopte-seance.pdf
 
ecb.sp231121_1~8df317dc17.en.pdf
ecb.sp231121_1~8df317dc17.en.pdfecb.sp231121_1~8df317dc17.en.pdf
ecb.sp231121_1~8df317dc17.en.pdf
 
ST-15732-2023-INIT_fr.pdf
ST-15732-2023-INIT_fr.pdfST-15732-2023-INIT_fr.pdf
ST-15732-2023-INIT_fr.pdf
 
ST-15631-2023-INIT_en.pdf
ST-15631-2023-INIT_en.pdfST-15631-2023-INIT_en.pdf
ST-15631-2023-INIT_en.pdf
 
2023-11-14-allocution-laurent-fabius (1).pdf
2023-11-14-allocution-laurent-fabius (1).pdf2023-11-14-allocution-laurent-fabius (1).pdf
2023-11-14-allocution-laurent-fabius (1).pdf
 
RCP pfizer octobre 2023 anx_160809_fr.pdf
RCP pfizer octobre 2023 anx_160809_fr.pdfRCP pfizer octobre 2023 anx_160809_fr.pdf
RCP pfizer octobre 2023 anx_160809_fr.pdf
 
Circulaire_relative_à_la_lutte_contre_les_infractions_susceptibles_d'être_c...
Circulaire_relative_à_la_lutte_contre_les_infractions_susceptibles_d'être_c...Circulaire_relative_à_la_lutte_contre_les_infractions_susceptibles_d'être_c...
Circulaire_relative_à_la_lutte_contre_les_infractions_susceptibles_d'être_c...
 
pjl22-434.pdf
pjl22-434.pdfpjl22-434.pdf
pjl22-434.pdf
 
Guide AMF prospectus.pdf
Guide AMF prospectus.pdfGuide AMF prospectus.pdf
Guide AMF prospectus.pdf
 
Budget de la Présidence
Budget de la PrésidenceBudget de la Présidence
Budget de la Présidence
 
PLAN DE GOBIERNO - JM.pdf
PLAN DE GOBIERNO - JM.pdfPLAN DE GOBIERNO - JM.pdf
PLAN DE GOBIERNO - JM.pdf
 
Dr Broussalian réponse pour Olivier Soulier.pdf
Dr Broussalian réponse pour Olivier Soulier.pdfDr Broussalian réponse pour Olivier Soulier.pdf
Dr Broussalian réponse pour Olivier Soulier.pdf
 
dffe1cf9ec241b5152a8688602d58ff1e640e4c1.pdf
dffe1cf9ec241b5152a8688602d58ff1e640e4c1.pdfdffe1cf9ec241b5152a8688602d58ff1e640e4c1.pdf
dffe1cf9ec241b5152a8688602d58ff1e640e4c1.pdf
 
2023-incidences-economiques-rapport-pisani-5juin.pdf
2023-incidences-economiques-rapport-pisani-5juin.pdf2023-incidences-economiques-rapport-pisani-5juin.pdf
2023-incidences-economiques-rapport-pisani-5juin.pdf
 
COM_2023_610_1_FR.PDF
COM_2023_610_1_FR.PDFCOM_2023_610_1_FR.PDF
COM_2023_610_1_FR.PDF
 

Recently uploaded

The Economic History of the U.S. Lecture 20.pdf
The Economic History of the U.S. Lecture 20.pdfThe Economic History of the U.S. Lecture 20.pdf
The Economic History of the U.S. Lecture 20.pdfGale Pooley
 
06_Joeri Van Speybroek_Dell_MeetupDora&Cybersecurity.pdf
06_Joeri Van Speybroek_Dell_MeetupDora&Cybersecurity.pdf06_Joeri Van Speybroek_Dell_MeetupDora&Cybersecurity.pdf
06_Joeri Van Speybroek_Dell_MeetupDora&Cybersecurity.pdfFinTech Belgium
 
Instant Issue Debit Cards - High School Spirit
Instant Issue Debit Cards - High School SpiritInstant Issue Debit Cards - High School Spirit
Instant Issue Debit Cards - High School Spiritegoetzinger
 
Solution Manual for Principles of Corporate Finance 14th Edition by Richard B...
Solution Manual for Principles of Corporate Finance 14th Edition by Richard B...Solution Manual for Principles of Corporate Finance 14th Edition by Richard B...
Solution Manual for Principles of Corporate Finance 14th Edition by Richard B...ssifa0344
 
Call Girls Service Nagpur Maya Call 7001035870 Meet With Nagpur Escorts
Call Girls Service Nagpur Maya Call 7001035870 Meet With Nagpur EscortsCall Girls Service Nagpur Maya Call 7001035870 Meet With Nagpur Escorts
Call Girls Service Nagpur Maya Call 7001035870 Meet With Nagpur Escortsranjana rawat
 
The Economic History of the U.S. Lecture 19.pdf
The Economic History of the U.S. Lecture 19.pdfThe Economic History of the U.S. Lecture 19.pdf
The Economic History of the U.S. Lecture 19.pdfGale Pooley
 
Monthly Market Risk Update: April 2024 [SlideShare]
Monthly Market Risk Update: April 2024 [SlideShare]Monthly Market Risk Update: April 2024 [SlideShare]
Monthly Market Risk Update: April 2024 [SlideShare]Commonwealth
 
20240429 Calibre April 2024 Investor Presentation.pdf
20240429 Calibre April 2024 Investor Presentation.pdf20240429 Calibre April 2024 Investor Presentation.pdf
20240429 Calibre April 2024 Investor Presentation.pdfAdnet Communications
 
VIP Call Girls LB Nagar ( Hyderabad ) Phone 8250192130 | ₹5k To 25k With Room...
VIP Call Girls LB Nagar ( Hyderabad ) Phone 8250192130 | ₹5k To 25k With Room...VIP Call Girls LB Nagar ( Hyderabad ) Phone 8250192130 | ₹5k To 25k With Room...
VIP Call Girls LB Nagar ( Hyderabad ) Phone 8250192130 | ₹5k To 25k With Room...Suhani Kapoor
 
Interimreport1 January–31 March2024 Elo Mutual Pension Insurance Company
Interimreport1 January–31 March2024 Elo Mutual Pension Insurance CompanyInterimreport1 January–31 March2024 Elo Mutual Pension Insurance Company
Interimreport1 January–31 March2024 Elo Mutual Pension Insurance CompanyTyöeläkeyhtiö Elo
 
Dharavi Russian callg Girls, { 09892124323 } || Call Girl In Mumbai ...
Dharavi Russian callg Girls, { 09892124323 } || Call Girl In Mumbai ...Dharavi Russian callg Girls, { 09892124323 } || Call Girl In Mumbai ...
Dharavi Russian callg Girls, { 09892124323 } || Call Girl In Mumbai ...Pooja Nehwal
 
Bladex Earnings Call Presentation 1Q2024
Bladex Earnings Call Presentation 1Q2024Bladex Earnings Call Presentation 1Q2024
Bladex Earnings Call Presentation 1Q2024Bladex
 
OAT_RI_Ep19 WeighingTheRisks_Apr24_TheYellowMetal.pptx
OAT_RI_Ep19 WeighingTheRisks_Apr24_TheYellowMetal.pptxOAT_RI_Ep19 WeighingTheRisks_Apr24_TheYellowMetal.pptx
OAT_RI_Ep19 WeighingTheRisks_Apr24_TheYellowMetal.pptxhiddenlevers
 
(ANIKA) Budhwar Peth Call Girls Just Call 7001035870 [ Cash on Delivery ] Pun...
(ANIKA) Budhwar Peth Call Girls Just Call 7001035870 [ Cash on Delivery ] Pun...(ANIKA) Budhwar Peth Call Girls Just Call 7001035870 [ Cash on Delivery ] Pun...
(ANIKA) Budhwar Peth Call Girls Just Call 7001035870 [ Cash on Delivery ] Pun...ranjana rawat
 
Best VIP Call Girls Noida Sector 18 Call Me: 8448380779
Best VIP Call Girls Noida Sector 18 Call Me: 8448380779Best VIP Call Girls Noida Sector 18 Call Me: 8448380779
Best VIP Call Girls Noida Sector 18 Call Me: 8448380779Delhi Call girls
 
The Economic History of the U.S. Lecture 18.pdf
The Economic History of the U.S. Lecture 18.pdfThe Economic History of the U.S. Lecture 18.pdf
The Economic History of the U.S. Lecture 18.pdfGale Pooley
 
Instant Issue Debit Cards - School Designs
Instant Issue Debit Cards - School DesignsInstant Issue Debit Cards - School Designs
Instant Issue Debit Cards - School Designsegoetzinger
 
Vip B Aizawl Call Girls #9907093804 Contact Number Escorts Service Aizawl
Vip B Aizawl Call Girls #9907093804 Contact Number Escorts Service AizawlVip B Aizawl Call Girls #9907093804 Contact Number Escorts Service Aizawl
Vip B Aizawl Call Girls #9907093804 Contact Number Escorts Service Aizawlmakika9823
 
VVIP Pune Call Girls Katraj (7001035870) Pune Escorts Nearby with Complete Sa...
VVIP Pune Call Girls Katraj (7001035870) Pune Escorts Nearby with Complete Sa...VVIP Pune Call Girls Katraj (7001035870) Pune Escorts Nearby with Complete Sa...
VVIP Pune Call Girls Katraj (7001035870) Pune Escorts Nearby with Complete Sa...Call Girls in Nagpur High Profile
 
The Economic History of the U.S. Lecture 21.pdf
The Economic History of the U.S. Lecture 21.pdfThe Economic History of the U.S. Lecture 21.pdf
The Economic History of the U.S. Lecture 21.pdfGale Pooley
 

Recently uploaded (20)

The Economic History of the U.S. Lecture 20.pdf
The Economic History of the U.S. Lecture 20.pdfThe Economic History of the U.S. Lecture 20.pdf
The Economic History of the U.S. Lecture 20.pdf
 
06_Joeri Van Speybroek_Dell_MeetupDora&Cybersecurity.pdf
06_Joeri Van Speybroek_Dell_MeetupDora&Cybersecurity.pdf06_Joeri Van Speybroek_Dell_MeetupDora&Cybersecurity.pdf
06_Joeri Van Speybroek_Dell_MeetupDora&Cybersecurity.pdf
 
Instant Issue Debit Cards - High School Spirit
Instant Issue Debit Cards - High School SpiritInstant Issue Debit Cards - High School Spirit
Instant Issue Debit Cards - High School Spirit
 
Solution Manual for Principles of Corporate Finance 14th Edition by Richard B...
Solution Manual for Principles of Corporate Finance 14th Edition by Richard B...Solution Manual for Principles of Corporate Finance 14th Edition by Richard B...
Solution Manual for Principles of Corporate Finance 14th Edition by Richard B...
 
Call Girls Service Nagpur Maya Call 7001035870 Meet With Nagpur Escorts
Call Girls Service Nagpur Maya Call 7001035870 Meet With Nagpur EscortsCall Girls Service Nagpur Maya Call 7001035870 Meet With Nagpur Escorts
Call Girls Service Nagpur Maya Call 7001035870 Meet With Nagpur Escorts
 
The Economic History of the U.S. Lecture 19.pdf
The Economic History of the U.S. Lecture 19.pdfThe Economic History of the U.S. Lecture 19.pdf
The Economic History of the U.S. Lecture 19.pdf
 
Monthly Market Risk Update: April 2024 [SlideShare]
Monthly Market Risk Update: April 2024 [SlideShare]Monthly Market Risk Update: April 2024 [SlideShare]
Monthly Market Risk Update: April 2024 [SlideShare]
 
20240429 Calibre April 2024 Investor Presentation.pdf
20240429 Calibre April 2024 Investor Presentation.pdf20240429 Calibre April 2024 Investor Presentation.pdf
20240429 Calibre April 2024 Investor Presentation.pdf
 
VIP Call Girls LB Nagar ( Hyderabad ) Phone 8250192130 | ₹5k To 25k With Room...
VIP Call Girls LB Nagar ( Hyderabad ) Phone 8250192130 | ₹5k To 25k With Room...VIP Call Girls LB Nagar ( Hyderabad ) Phone 8250192130 | ₹5k To 25k With Room...
VIP Call Girls LB Nagar ( Hyderabad ) Phone 8250192130 | ₹5k To 25k With Room...
 
Interimreport1 January–31 March2024 Elo Mutual Pension Insurance Company
Interimreport1 January–31 March2024 Elo Mutual Pension Insurance CompanyInterimreport1 January–31 March2024 Elo Mutual Pension Insurance Company
Interimreport1 January–31 March2024 Elo Mutual Pension Insurance Company
 
Dharavi Russian callg Girls, { 09892124323 } || Call Girl In Mumbai ...
Dharavi Russian callg Girls, { 09892124323 } || Call Girl In Mumbai ...Dharavi Russian callg Girls, { 09892124323 } || Call Girl In Mumbai ...
Dharavi Russian callg Girls, { 09892124323 } || Call Girl In Mumbai ...
 
Bladex Earnings Call Presentation 1Q2024
Bladex Earnings Call Presentation 1Q2024Bladex Earnings Call Presentation 1Q2024
Bladex Earnings Call Presentation 1Q2024
 
OAT_RI_Ep19 WeighingTheRisks_Apr24_TheYellowMetal.pptx
OAT_RI_Ep19 WeighingTheRisks_Apr24_TheYellowMetal.pptxOAT_RI_Ep19 WeighingTheRisks_Apr24_TheYellowMetal.pptx
OAT_RI_Ep19 WeighingTheRisks_Apr24_TheYellowMetal.pptx
 
(ANIKA) Budhwar Peth Call Girls Just Call 7001035870 [ Cash on Delivery ] Pun...
(ANIKA) Budhwar Peth Call Girls Just Call 7001035870 [ Cash on Delivery ] Pun...(ANIKA) Budhwar Peth Call Girls Just Call 7001035870 [ Cash on Delivery ] Pun...
(ANIKA) Budhwar Peth Call Girls Just Call 7001035870 [ Cash on Delivery ] Pun...
 
Best VIP Call Girls Noida Sector 18 Call Me: 8448380779
Best VIP Call Girls Noida Sector 18 Call Me: 8448380779Best VIP Call Girls Noida Sector 18 Call Me: 8448380779
Best VIP Call Girls Noida Sector 18 Call Me: 8448380779
 
The Economic History of the U.S. Lecture 18.pdf
The Economic History of the U.S. Lecture 18.pdfThe Economic History of the U.S. Lecture 18.pdf
The Economic History of the U.S. Lecture 18.pdf
 
Instant Issue Debit Cards - School Designs
Instant Issue Debit Cards - School DesignsInstant Issue Debit Cards - School Designs
Instant Issue Debit Cards - School Designs
 
Vip B Aizawl Call Girls #9907093804 Contact Number Escorts Service Aizawl
Vip B Aizawl Call Girls #9907093804 Contact Number Escorts Service AizawlVip B Aizawl Call Girls #9907093804 Contact Number Escorts Service Aizawl
Vip B Aizawl Call Girls #9907093804 Contact Number Escorts Service Aizawl
 
VVIP Pune Call Girls Katraj (7001035870) Pune Escorts Nearby with Complete Sa...
VVIP Pune Call Girls Katraj (7001035870) Pune Escorts Nearby with Complete Sa...VVIP Pune Call Girls Katraj (7001035870) Pune Escorts Nearby with Complete Sa...
VVIP Pune Call Girls Katraj (7001035870) Pune Escorts Nearby with Complete Sa...
 
The Economic History of the U.S. Lecture 21.pdf
The Economic History of the U.S. Lecture 21.pdfThe Economic History of the U.S. Lecture 21.pdf
The Economic History of the U.S. Lecture 21.pdf
 

Incertitude économique et volatilité des prix des matières premières

  • 1. DOCUMENT DE TRAVAIL N° 607 DIRECTION GÉNÉRALE DES ÉTUDES ET DES RELATIONS INTERNATIONALES DOES THE VOLATILITY OF COMMODITY PRICES REFLECT MACROECONOMIC UNCERTAINTY? Marc Joëts, Valérie Mignon and Tovonony Razafindrabe November 2016
  • 2. DIRECTION GÉNÉRALE DES ÉTUDES ET DES RELATIONS INTERNATIONALES DOES THE VOLATILITY OF COMMODITY PRICES REFLECT MACROECONOMIC UNCERTAINTY? Marc Joëts, Valérie Mignon and Tovonony Razafindrabe November 2016 Les Documents de travail reflètent les idées personnelles de leurs auteurs et n'expriment pas nécessairement la position de la Banque de France. Ce document est disponible sur le site internet de la Banque de France « www.banque-france.fr ». Working Papers reflect the opinions of the authors and do not necessarily express the views of the Banque de France. This document is available on the Banque de France Website “www.banque-france.fr”.
  • 3. Does the volatility of commodity prices reáect macroeconomic uncertainty?! Marc JoÎtsy ValÈrie Mignonz Tovonony RazaÖndrabex 3rd November 2016 ! We are grateful to Nathan Balke for providing us with his code for the TVAR estimations. We would like to thank Nick Bloom, Bertrand Candelon, Soojin Jo, Lutz Kilian, and seminar/conference participants at Banque de France, Dauphine University, University of Paris Ouest, Utrecht University, CFE, EEA, IAAE, and IAEE for constructive comments and suggestions that helped us improve an earlier version of the paper. The usual disclaimers apply. y Banque de France, International Macroeconomic Division, and EconomiX-CNRS, University of Paris Ouest, France. E-mail: marc.joets@banque-france.fr z EconomiX-CNRS, University of Paris Ouest and CEPII, France. Corresponding author: ValÈrie Mignon, EconomiX-CNRS, University of Paris Ouest, 200 avenue de la RÈpublique, 92001 Nanterre Cedex, France. Phone: 33 1 40 97 58 60. E-mail: valerie.mignon@u-paris10.fr x University of Rennes and EconomiX-CNRS, University of Paris Ouest, France. E-mail: trazafindrab@u-paris10.fr 1
  • 4. RÈsumÈ franÁais Bien quíil existe de nombreuses Ètudes sur les e§ets macroÈconomiques des chocs pÈtroliers et des matiËres premiËres, la littÈrature ne dit rien sur líimpact de líincertitude macroÈconomique sur les áuctuations des prix du pÈtrole et des matiËres premiËres. Le prÈsent article aborde cette question par líestimation díun modËle vectoriel autorÈgressif ‡ seuil (TVAR) sur un Èchantillion de 19 marchÈs de matiËres premiËres. Líobjectif central du papier est double: (i) Èvaluer si líe§et des chocs díincetitude macroÈconomique sur les rendements des prix des matiËres premiËres dÈpend du degrÈ díincertitude, et (ii) Ètudier le transfert de líincertitude marcÈoconomique ‡ líincertitude des prix en developpant une nouvelle mesure de líincertitutde des prix des produits de base. Nos rÈsultats montrent que les marchÈs agricoles et industriels sont trËs sensibles ‡ la variabilitÈ et au niveau díincertitude macroÈconomique, tandis que líimpact sur les mÈtaux prÈcieux est plus parcimonieux compte tenu de leur rÙle de valeur refuge en pÈriode de turbulences Èconomiques. De plus, nous constatons que la rÈcente rÈcession de 2007-2009 a engendrÈ un Èpisode sans prÈcÈdent díincertitude pour de nombreux prix des matiËres premiËres. Notre analyse rÈvËle en outre que la volatilitÈ et líincertitude des prix peuvent Ítre dÈconnectÈes. Cela est particuliËrement vrai pour le marchÈ pÈtrolier car de nombreux chocs dans les annÈes 1990 et au dÈbut des annÈes 2000 conduisant ‡ des pics de volatilitÈ níont pas gÈnÈrÈ díincertitude des prix, soulignant la pertinence de notre mesure díincertitude liant incertitude ‡ prÈvisibilitÈ plutÙt quí‡ la volatilitÈ. Mots-clÈs: incertitude macroÈconomique, prix des matiËres premiËres, modËle vectoriel autorÈ- gressif ‡ seuil. Code JEL: Q02, E32, C32. Abstract While there exists numerous studies on the macroeconomic e§ects of oil and commodity shocks, the literature is quite silent on the impact of macroeconomic uncertainty on oil and commodity prices and, especially, on their volatility. This paper tackles this issue through the estimation of a threshold vector autoregressive (TVAR) model on a sample of 19 commodity markets. We aim at (i) assessing whether the e§ect of macroeconomic uncertainty shocks on commodity price returns depends on the degree of uncertainty, and (ii) investigating the transfer from mac- roeconomic uncertainty to price uncertainty using a newly developed measure of commodity price uncertainty. Our Öndings show that both agricultural and industrial markets are highly sensitive to the variability and the level of macroeconomic uncertainty, while the impact on precious metals is more parsimonious given their well-identiÖed safe-haven role in time of eco- nomic turmoil. In addition, we Önd evidence that the recent 2007-09 recession has generated an unprecedented episode of high uncertainty in numerous commodity prices. Interestingly, our analysis further reveals that volatility and uncertainty in prices can be disconnected. This is especially true for the oil market as most important shocks in the 1990s and the beginning of the 2000s that lead to price volatility do not generate price uncertainty, highlighting the relevance of our uncertainty measure in linking uncertainty to predictability rather than to 2
  • 5. volatility. Keywords: macroeconomic uncertainty, commodity prices, threshold vector autoregressive model. JEL ClassiÖcation: Q02, E32, C32. 3
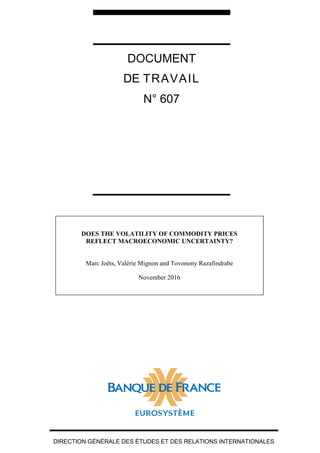
  • 6. Non-technical summary The literature on commodity prices during the last decade showed the importance to identify and understand the causes and consequences of oil price shocks. Some of the key insights regarding the origins of prices áuctuations (Kilian, 2008a) are that (i) most commodity prices are endogenous with respect to the global business cycle, and (ii) demand shocks cause delayed and sustained price movements while supply shocks have small and transitory e§ects. Whereas disentangling the supply and demand components in a structural model is now common in the empirical literature to understand commodity price dynamics, some important concerns are missing regarding the e§ect of macroeconomic uncertainty. So far, the previous literature is indeed silent on the e§ects of macroeconomic uncertainty on the volatility of commodity prices. This issue is nevertheless worthy of investigation since the impact of uncertainty on the global economy has been widely documented. At a micro level, commodity Örms in several sectors are confronted to high costs and should be impacted by uncertainty about returns to investment. Similarly, at a macro level, as prices are related to global supply and demand conditions, uncertainty about macroeconomic aggregates should also a§ect commodity prices. This paper addresses this question on a large sample of 19 raw materials (energy, precious metals, agriculture, and industry) through a non-linear model. Our objective is twofold: (i) To assess whether the e§ect of macroeconomic uncertainty shocks on commodity price returns depends on the degree of uncertainty; (ii) To investigate the transfer from macroeconomic uncertainty to price uncertainty using an innovative measure of commodity price uncertainty. The main message of the paper is that most of commodity price returns are a§ected by mac- roeconomic uncertainty, the e§ect being more important for commodities that are strongly re- lated to the global business cycle. Then, in addition to traditional supply and demand shocks, macroeconomic uncertainty constitutes another key channel through which economic funda- mentals may impact commodity prices. Moreover, duration seems also to matter depending on the commodity type; long-run uncertainty having more e§ect on agricultural and indus- trial cumulative price dynamics, while other markets being more sensitive to short-run impacts. Focusing on the case of oil, Figure 1 below displays oil price uncertainty , together with the evolution of corresponding price and volatility . As shown, the sensitivity of oil price uncertainty depends on the period considered. For example, the period following the invasion of Kuwait in 1990 or, to a lesser extent, the Iraq War in 2002-03 are characterized by sharp spikes in oil prices. The Iran-Iraq War starting at the beginning of the 1980s is, in contrast, associated with small price movements. As stressed by Barsky and Kilian (2004), a simplistic view should be that major war episodes cause price uncertainty to increase through a rise in precautionary demand for oil. However, among all episodes of important áuctuations in oil prices, only two seem to be accompanied by uncertainty: (i) the 2007-09 recession, and (ii) the 1984-86 period. During the 2007-09 recession, oil price uncertainty is indeed very sensitive 4
  • 7. Figure 1: Oil price uncertainty .00 .04 .08 .12 .16 0 40 80 120 160 82 84 86 88 90 92 94 96 98 00 02 04 06 08 10 12 14 Oilpriceuncertainty WTI WTIprice volatility Note: The figure depicts uncertainty proxy for oil market at 1 month (left axis, blue line). The horizontal red bar corresponds to 1.65 standard-deviation above the mean of the series (left axis). Vertical gray bands represent macroeconomic uncertainty periods (according to Jurado et al. 2015). Volatility (green line) is proxied by the daily squared returns of prices (left axis). Black line refers to price series (right axis). to macroeconomic uncertainty, this result is not surprising given the relationship that exists between economic activity and the oil market. This episode of high oil price uncertainty is accompanied by the biggest oil price spike in the postwar experience and results from various macroeconomic factors. The 1984-1986 period is also characterized by heightened oil price uncertainty, but it does not coincide with macroeconomic uncertainty. This episode seems to be related to the conjunction of two events: (i) the production shutdown in Saudi Arabia between 1981 and 1985, which caused a strong price decrease; and to a lesser extent (ii) the OPEC collapse in 1986. Overall, the recent 2007-09 recession generated an unprecedented episode of uncertainty in the price of oil. In addition, most important shocks that occurred in the 1990s and the beginning of the 2000s that lead to price volatility do not generate systematic price uncertainty, meaning that most of these movements were predictable at this period and emphasizing the relevance of our uncertainty measure in linking uncertainty to predictability rather than to volatility. 5
  • 8. 1 Introduction The literature on oil and commodity markets during the last decade has shown the importance to identify and understand the causes and consequences of commodity price shocks. Some of the key insights (Kilian, 2008a) are that (i) most commodity prices are endogenous with respect to the global business cycle, and (ii) demand shocks cause delayed and sustained price movements while supply shocks have small and transitory e§ects. Whereas disentangling the supply and demand components in a structural model is now common in the empirical literat- ure to understand commodity price dynamics (especially for crude oil price), some important concerns are missing regarding the e§ect of second-order moments (especially the one related to uncertainty). So far, the previous literature is indeed silent on the e§ects of macroeconomic uncertainty on the volatility of commodity prices. This issue is nevertheless worthy of investigation since the impact of uncertainty on the global economy has been widely documented. For instance, theories of investment under uncertainty explain why under irreversibility condition or Öxed costs, uncertainty over future returns reduces current investment, hiring, and consumption through an ìoption value to waitî.1 The starting point is that at a micro level, uncertainty may diminish the willingness of Örms to commit resources to irreversible investment and the readiness of consumers to spend or allocate their earning and wages. It follows that micro-level uncertainty may be transmitted to the macro level because uncertainty about the return to investment at a micro level may create cyclical áuctuations in aggregate investment at a macro level (see Bernanke, 1983).2 The crucial point here is that there is no reason why such mech- anism at both micro and macro levels should not be extended to commodity markets. Indeed, at a micro level, commodity Örms in several sectors (especially in oil industry) are confronted to high costs and should be impacted by uncertainty about returns to investment. Similarly, at a macro level, as prices are related to global supply and demand conditions, uncertainty about macroeconomic aggregates should also a§ect commodity prices. In the wake of the literature about the origins of commodity price movements, the aim of this paper is to investigate the impact of uncertainty on commodity price returns and volatility. Regarding the previous literature, the bulk of the studies have looked at the reverse relationship and highlighted the signiÖcance of uncertainty in oil prices in explaining economic áuctuations and in exacerbating asymmetry in the oil price-economic activity nexus.3 All of them suggest that oil price uncertainty impacts output, investment, and consumption in the U.S. and G-7 1 See Bernanke (1983), Gibson and Schwartz (1990), Bloom et al. (2007), and Bloom (2009) among others. 2 This could be due to two reasons: (i) the macroeconomy is insu¢ciently diversiÖed and cannot be protec- ted from micro-level áuctuations; and (ii) under imperfect information, agents may confound transitory and permanent shocks, thereby converting a transitory shock into a persistent shock. 3 See Kilian (2014) for a review. The reader may also refer to the theoretical papers of Bernanke (1983) and Pindyck (1991), and to the empirical studies of Elder and Serletis (2010) and Jo (2014) to name few. Note that, as underlined by Kilian (2014), Elder and Serletis do not directly test for symmetry in the e§ect of oil prices, but rather test the null of no feedback e§ect from the conditional variance of oil prices to the conditional mean. 6
  • 9. countries in an asymmetric way. While providing interesting results, these studies su§er from an important drawback since it is well known that the e§ect of uncertainty in the oil priceóand commodity prices in generalóon the macroeconomy should be small, by construction of the underlying economic models. As argued by Kilian (2014), energy is indeed not necessarily a key component of the cash áow of investment projects, making the e§ect of oil price uncertainty on output not plausible. It follows that looking at the reverse transmission from macroeconomic uncertainty to the volatility of commodity prices is more relevant with regard to the modern view of the endogenous component of prices. As stressed above, this question has not been widely addressed in the literature. Some limited exceptions can, however, be mentioned. First, regarding theoretical papers, (i) Pindyck (1980) discusses the implications of uncertainty asso- ciated with oil demand and reserves on the oil price behavior; (ii) Litzenberger and Rabinowitz (1995) analyze backwardation behavior in oil futures contracts; and (iii) Alquist and Kilian (2010) allow for endogenous convenience yield and endogenous inventories, and stress that it is uncertainty about the shortfall of supply relative to demand that matters. Second, among empirical papers, one may refer to (i) Kilian (2009) and Kilian and Murphy (2014) who design as a precautionary demand shock a shock that reáects shifts in uncertainty and treat mac- roeconomic uncertainty as unobserved; and (ii) Van Robays (2013) who investigates whether observed macroeconomic uncertainty changes the responsiveness of the oil price to shocks in oil demand and supply. Our paper extends this literature on the relationship between macroeconomic uncertainty and commodity prices in several ways. SpeciÖcally, we address this question by examining the in- áuence of macroeconomic uncertainty on a large panel of commodity markets. More precisely, we consider four groups of 19 raw materials (energy, precious metals, agriculture, and industry) to investigate whether the impact of macroeconomic uncertainty on commodity prices di§ers depending on the type of market. In addition, with uncertainty evolving through time, we account for this feature by assessing its impact at various horizonsónamely short-, medium-, and long-run horizonsóto test whether its e§ect varies according to its maturity. From a theoretical viewpoint, áuctuations in uncertainty may indeed have di§erent impacts through time on the economy (Bloom, 2014), with usually two negative channels in the short run (the real option and risk aversion/risk premium e§ects4) and two positive channels in the long run (the growth option and Oi-Hartman-Abel e§ects5).6 Turning to methodological issues, our contribution is threefold. First, we retain a nonlinear threshold vector autoregressive (TVAR) speciÖcation that allows us to identify di§erent uncertainty states, and we investigate whether 4 The real option hypothesis refers to an option value to wait and suggests that uncertainty encourages Örms to become cautious about adjustment costs. The risk aversion/risk premium e§ect refers to the cost of Önance, which may increase in times of greater uncertainty. 5 See Bloom (2014) for a review of the related literature. The growth option argument is based on the idea that uncertainty can encourage investment and R&D if it increases the size of the potential prize. The Oi- Hartman-Abel e§ect refers to the fact that Örms can expand to exploit good outcomes and contract to insure against bad outcomes, diminishing the potential impact of uncertainty. 6 Note that we do not explicitly investigate the channels through which uncertainty impacts commodity marketsóa question that we leave for future researchóbut examine whether this impact may di§er across levels of maturity. 7
  • 10. the impact of uncertainty varies according to its level and variability. Second, because mac- roeconomic uncertainty is unobservable, assessing its e§ect on commodity markets obviously requires us to Önd an adequate proxy. To this end, we rely on Jurado et al. (2015) and con- sider a robust approach to measuring macroeconomic uncertainty. The retained proxy uses a wide range of monthly macroeconomic and Önancial indicators and is based on the underly- ing idea of a link between uncertainty and predictability. In this sense, we go further than the previous literatureóparticularly compared with Van Robays (2013)ís paper, which is the closest to oursówhich generally relies on dispersion measures such as conditional volatility (e.g. conditional variance of world industrial production growth or of U.S. GDP growth es- timated from a GARCH(1,1) process) or the VXO index of Bloom (2009). As we will see, an important drawback in using GARCH-type models to proxy uncertainty is that they are in- herently backward-looking, whereas investorsí expectations tend to be forward-looking. More generally, and thanks to a detailed robustness analysis, we show that the choice of the un- certainty measure is crucial to avoid erroneously attributing to uncertainty áuctuations that are actually predictable. Third, for the sake of completeness, we also investigate how macroe- conomic uncertainty can generate uncertainty in commodity prices, looking at second-order moments transfer. To this end, we construct a robust proxy of commodity market uncertainty based on macroeconomic uncertainty, and provide a historical decomposition that allows us to determine the contribution of macroeconomic uncertainty to commodity price uncertainty. For the speciÖc case of oil, we further disentangle supply and demand components of oil price uncertainty to assess their respective contribution during periods of uncertainty in the market. The central message of the paper is that most of commodity price returns are a§ected by macroeconomic uncertainty, the e§ect being more important for commodities that are strongly related to the global business cycle (such as oil, agricultural, and industrial markets). Then, in addition to traditional supply and demand shocks, macroeconomic uncertainty constitutes another key channel through which economic fundamentals may impact commodity prices. Maturity seems to matter depending on the commodity type; long-run uncertainty having more e§ect on agricultural and industrial cumulative price dynamics, while other markets be- ing more sensitive to short-run impacts. Furthermore, our new commodity price uncertainty indicator shows for most considered series a transfer from macroeconomic uncertainty to price uncertainty during the 2007-09 great recession period. It further reveals that volatility and uncertainty in prices are disconnected. It is especially the case for oil as we Önd that most important shocks that occurred in the 1990s and the beginning of the 2000s that lead to price volatility do not generate systematic price uncertainty, meaning that most of these movements were predictable at this period and emphasizing the relevance of our uncertainty measure in linking uncertainty to predictability rather than to volatility. The rest of the paper is organized as follows. Section 2 presents the uncertainty measure and discusses the corresponding theoretical framework. Section 3 addresses methodological issues by presenting the TVAR speciÖcation as well as our data. Section 4 displays the res- ults regarding the impact of macroeconomic uncertainty on commodity markets. Section 5 is 8
  • 11. devoted to the link between macroeconomic uncertainty and the uncertainty of each commod- ity market, and disentangles the respective contribution of supply and demand shocks to oil price uncertainty. Section 6 provides some robustness checks regarding the choice of both the macroeconomic uncertainty measure and our measure of price uncertainty. Finally, Section 7 concludes the paper. 2 Uncertainty measure 2.1 Measuring macroeconomic uncertainty Measuring uncertainty and examining its impact on market dynamics is a challenging question for economists because no objective measure exists. Although in a general sense uncertainty is deÖned as the conditional volatility of an unforecastable disturbance,7 the empirical literature to date has usually relied on proxies. The most common measures used are the implied or realized volatility of stock market returns, the cross-sectional dispersion of Örm proÖts, stock returns, or productivity, and the cross-sectional dispersion of survey-based forecasts. However, their adequacy to correctly proxy uncertainty is questionable, and such measures are even misspeciÖed with regard to the theoretical notion of uncertainty, as highlighted by Jurado et al. (2015). Indeed, stock market volatility, cross-sectional dispersion in stock returns and Örm proÖts can vary over time due to several factorsósuch as risk aversion, the leverage e§ect, and heterogeneity between Örmsóeven if there is no signiÖcant change in uncertainty. In other words, áuctuations that are actually predictable can be erroneously attributed to uncer- tainty, putting forward the importance of distinguishing between uncertainty in a series and its conditional volatility. SpeciÖcally, properly measuring uncertainty requires to remove the forecastable component of the considered series before computing the conditional volatility. In this sense, uncertainty in a series is not equivalent to the conditional volatility of the raw series. Another important characteristic of Jurado et al. (2015)ís approach is that macroeconomic uncertainty is deÖned as the common variation in uncertainty across many series rather than uncertainty related to any single series. This is in line with the uncertainty-based business cycle theories which implicitly assume a common variation in uncertainty across a large num- ber of series. Accordingly, to provide a consistent measure of macroeconomic uncertainty, we follow the deÖnition of Jurado et al. (2015) by linking uncertainty to predictability. SpeciÖcally, the h- period-ahead uncertainty in the variable yjt 2 Yt = ! y1t; :::; yNyt "0 is deÖned as the conditional volatility Uy jt (h) of the purely unforecastable component of the future value of the series: Uy jt (h) # r E h (yjt+h $ E [yjt+h jJt ])2 jJt i ; (1) where j = 1; :::; Ny, E (: jJt ) is the conditional expectation of the considered variable and Jt denotes the information set available at time t. Uncertainty related to the variable yjt+h is 7 See Bloom (2009), Bloom et al. (2010), Fernandez-Villaverde et al. (2011), Bloom et al. (2012), Gilchrist et al. (2014), and Baker et al. (2015) among others. 9
  • 12. therefore deÖned as the expectation of the squared error forecast. Aggregating over j indi- vidual uncertainty measures Uy jt (h) equally weighted by wj leads to the following expression of aggregate or macroeconomic uncertainty: Uy t (h) # plimNy!1 Ny X j=1 wjUy jt(h) # Ew h Uy jt (h) i : (2) As discussed by Jurado et al. (2015), the estimation of Equations (1) and (2) requires three fundamental steps. The Örst step is to replace the conditional expectation E [yjt+h jJt ] in Equation (1) by a forecast in order to compute forecast errors. It is a crucial step since the forecastable component should be then removed from the conditional volatility computation. To do so, an as rich as possible predictive model based on factors from a large set of N predictors fXitg; i = 1; :::; N, is considered, taking the following approximated form: Xit = +F0 i Ft + eX it ; (3) where Ft is a rf (1 vector of latent common factors, +F i is the vector of latent factor loadings, and eX it is a vector of idiosyncratic errors which allows for some cross-sectional correlations. To account for time-varying omitted-information bias, Jurado et al. (2015) further include estim- ated factors, as well as non-linear functions of these factors in the forecasting model through a di§usion forecast index. The second step consists of (i) deÖning the h-step-ahead forecast error by V y jt+h = yjt+h $ E [yjt+h jJt ], and (ii) estimating the related conditional volatility, namely E h! V y t+h "2 jJt i . To account for time-varying volatility in the errors of the predictor variables, E h! V y t+h "2 jJt i is recursively multistep-ahead computed for h > 1.8 In the third, Önal step, macroeconomic uncertainty Uy t (h) is constructed from the individual uncertainty measures Uy jt (h) through an equally-weighted average. Using large datasets on economic activity, Jurado et al. (2015) provide two types of uncertainty measures that are as free as possible from both the restrictions of theoretical models and/or de- pendencies on a handful of economic indicators. The Örst one is the ìcommon macroeconomic uncertaintyî based on the information contained in hundreds of primarily macroeconomic and Önancial monthly indicators,9 and the second one is the ìcommon microeconomic uncertaintyî 8 From a statistical viewpoint, it is worth noting that time-varying uncertainty is decomposed into four sources: an autoregressive component, a common factor component, a stochastic volatility component, and a covariance term (see Jurado et al., 2015). 9 More speciÖcally, 132 macroeconomic time series are considered, including real output and income, employ- ment and hours, real retail, manufacturing and trade sales, consumer spending, housing starts, inventories and inventory sales ratios, orders and unÖlled orders, compensation and labor costs, capacity utilization measures, price indexes, bond and stock market indexes, and foreign exchange measures. Turning to the Önancial indic- ators, 147 time series are retained, including dividend-price and earning-price ratios, growth rates of aggregate dividends and prices, default and term spreads, yields on corporate bonds of di§erent ratings grades, yields on Treasuries and yield spreads, and a broad cross-section of industry equity returns. Both sets of data are used to estimate the forecasting factors, but macroeconomic uncertainty is proxied using the 132 macroeconomic time series only. 10
  • 13. based on 155 quarterly Örm-level observations on proÖt growth normalized by sales.10,11 Empir- ically, these measures have the advantage of providing far fewer important uncertainty episodes than do popular proxies. As an example, though Bloom (2009) identiÖes 17 uncertainty periods based on stock market volatility, Jurado et al. (2015) Önd evidence of only three episodes of uncertainty over the 1959-2011 period: the month surrounding the 1973-74 and 1981-82 reces- sions and the recent 2007-09 great recession. As stressed above, this illustrates that popular uncertainty proxies based on volatility measures usually erroneously attribute to uncertainty áuctuations that are actually forecastable. In addition, with the proposed measures deÖned for di§erent values of h, they allow us to investigate uncertainty transmission in commodity markets for distinct maturities. 2.2 Endogenous and exogenous components of uncertainty One important issue when investigating the impact of macroeconomic uncertainty on com- modity prices is to understand the intrinsic nature of uncertainty with respect to prices. In other words, it is important to disentangle the endogenous and exogenous components of mac- roeconomic uncertainty (i.e., whether macroeconomic uncertainty is demand-driven or supply- driven with respect to commodity prices). Since 1974, the price of oilóas the price of other commoditiesóhas become endogenous with respect to global macroeconomic conditions (see Alquist et al., 2013). Since then, the empirical literature has provided overwhelming evid- ence that commodity prices have been driven by global demand shocks.12 As pointed out by Barsky and Kilian (2002), the 1973-74 episode of dramatic surge in the price of oil and indus- trial commodities is the most striking example where the price increase was explained for 25% by exogenous events and for 75% by shifts in the demand side. With the predominant role of áow demand on prices, another important channel of transmission is the role of expectations in the physical market (see among others, Kilian, 2009; Alquist and Kilian, 2010; and Kilian, 2014). The underlying idea is that anyone who expects the price to increase in the future will be prompted to store oil now for future use leading to a shock from the demand of oil inventories. Kilian and Murphy (2014) demonstrate that shifts in expectations through oil inventories have played an important role during the oil price surge in 1979 and 1990, and the price collapse in 1986.13 The aggregate speciÖcation of our proxy has the particularity to be ìglobalî, accounting for a lot of information regarding uncertainty in the supply and demand channels. While it is 10 Dealing with monthly data and focusing on macroeconomic uncertainty, we consider in this paper the ìcommon macroeconomic uncertaintyî measure. 11 The approach developed by Jurado et al. (2015) is mainly focused on U.S. data, and so the relationship between macro and commodity prices is through the U.S. perspectives. 12 One exception for the case of oil is the 1990s, where the áow supply shocks have played an important role (see Kilian and Murphy, 2014). 13 This shock is also often called ìspeculative demand shockî since it involves a forward-looking strategy (see Kilian and Murphy, 2014). 11
  • 14. quite di¢cult in this framework to identify the proportion of unanticipated demand or supply, some reasonable assumptions about the e§ect of demand and supply shocks on prices may give us some insight about the mechanisms behind the relationship between macroeconomic uncertainty and commodity prices. In our analysis, we follow the dominant view about the endogenous nature of commodity prices with respect to macroeconomic conditions, consider- ing the aggregate demand channel as a primary source of price áuctuations (see Mabro, 1998; Barsky and Kilian, 2002, 2004; Kilian, 2008a; and Hamilton, 2009). In line with the previous literature, we therefore assume that exogenous events coming from the supply channelósuch as cartel decisions, oil embargoes or the e§ects of political uncertainty from the Middle Eastóare secondary, being mainly an indirect consequence of the macroeconomic environment. By con- struction, our approach accounts for both channels, the demand channel being a direct e§ect of macroeconomic aggregate and the supply channel an indirect e§ect of macroeconomic con- ditions on exogenous events. In other words, our macroeconomic uncertainty proxy primarily reáects uncertainty about the demand side.14 2.3 Backward-looking vs. forward-looking uncertainty As previously discussed, it is quite di¢cult to approximate uncertainty because it is not observ- able. One important issue regarding usual proxies based on conditional volatility is that they are often backward-looking, whereas investorsí expectations tend to be forward-looking (Kilian and Vigfusson, 2011). As an illustrative purpose, Figure ?? provides a comparison between three uncertainty proxies. SpeciÖcally, the green line is the conditional volatility estimated from a one-month GARCH(1,1) process for the U.S. GDP growth,15 the blue line is the VXO stock market volatility index of Bloom (2009), and the red line is the common macroeconomic uncertainty proxy of Jurado et al. (2015); the gray bands corresponding to the NBER recession dates. Looking at the recent Önancial crisis, all proxies identify this episode as an important source of macroeconomic uncertainty since a peak occurred for each series around 2008. How- ever, some systematic di§erences regarding the identiÖed macroeconomic uncertainty periods can be highlighted. The measure based on the GARCH speciÖcation starts to peak in Janu- ary 2009, while the VXO index begins to peak in May 2008. The implied volatility proxy is therefore more forward-looking than the one based on the conditional variance. Meanwhile, the proxy developed by Jurado et al. (2015) peaks in June 2007, pointing out that it is the most forward-looking measure. Moreover, comparing periods of uncertainty for each proxy with NBER recession dates (December 2007-June 2009), we Önd that both GARCH and VXO proxies are too backward-looking, while the macroeconomic uncertainty proxy we use peaks just few months before the starting date of the recession. In other words, our retained measure of macroeconomic uncertainty that accounts for forward-looking behavior of agents (whatever 14 Recall that assuming small e§ects for supply disruptions does not mean that exogenous political events do not matter. Indeed, they also a§ect prices by shifting expectations about future shortfalls of supply relative to demand (see Kilian, 2009; and Alquist and Kilian, 2010). 15 We focus on this series rather than on the world industrial production growth because it is designed to reáect the overall uncertainty of the macroeconomic environment (see Van Robays, 2013). 12
  • 15. the maturity considered) is the most appropriate one, and other approaches usually erroneously attribute to uncertainty áuctuations that are actually predictable. Jurado et al. (2015) have further documented that shocks to macroeconomic uncertainty lead to an increase in the VXO index, the reverse e§ect being not veriÖed.16 Figure 2: Alternative measures of macroeconomic uncertainty The concept of uncertainty is basically related to the perception of agents about potential fu- ture evolutions. Together with the notion of time variability, it implies that di§erent horizons lead to distinct perceptions of uncertainty, and thus disparate economic behaviors. As shown by Jurado et al. (2015), uncertainty is generally higher for medium- and long-run maturities (respectively 3 and 12 months) than for short-run horizons (1 month). In addition, the relative importance of macroeconomic uncertainty in the total uncertainty (i.e., uncertainty accounting for all series) grows as the forecast horizon increases. Accounting for the maturity is thus of great importance to fully apprehend the impact of uncertainty on macroeconomic dynamics. As shown by Jurado et al. (2015), uncertainty shocks with shorter uncertainty horizons tend to be associated with a larger fraction of the forecast error variance in aggregates than those 16 See Figure 6 of Jurado et al. (2015)ís paper. Section 6.1 of our paper compares both proxies in the context of commodity prices and conÖrms that the predictability-based approach of Jurado et al. (2015) is more appropriated than the VXO index of Bloom (2009) to approximate macroeconomic uncertainty. 13
  • 16. with longer uncertainty horizons.17 In the context of commodity prices and especially oil prices, the discussion is of primary im- portance. The ongoing debate in the literature about the e§ect of maturity has been mainly oriented toward the consequences of oil price uncertainty on economic activity. Kilian and Vig- fusson (2011) provide an interesting comparison between the long-run theoretical uncertainty measure of Bernanke (1983) and Pindyck (1991), and the empirical short-run uncertainty proxy of Elder and Serletis (2010). According to the authors, the former deÖnition is related to un- certainty at horizons relevant to investment decisions, while the latter is more appropriate to capture the reallocation e§ect of Hamilton (1988) since it measures the current real oil price volatility. Clearly, the e§ect of oil price uncertainty on activity depends on the impact of the oil price on investment, but also on how companies face to uncertainty regarding their investment decision plans. Indeed, depending on the sectors, the delay from the investment decision to the beginning of the production can di§er, and short-run uncertainty can thus have no impact for long-run investment strategies. All in all, accounting for the e§ect of maturity when investigating the impact of uncertainty is thus of crucial importance. 3 Data and model speciÖcation We consider a large dataset of 19 principal commodity markets, classiÖed into four categories: energy, precious metals, agriculture, and industry. Related price series are monthly, starting in October 1978 for energy markets, February 1976 for precious metals markets, and February 1980 for agricultural and industrial markets. The period ends in April 2015 for all groups of commodities. All series are transformed into Örst-logarithmic di§erences (i.e., price returns),18 as described in Table 1 in Appendix A, which also provides data sources. Turning to data related to macroeconomic uncertainty measures for distinct maturities, they are freely available on Ludvigsonís homepage.19 3.1 Threshold VAR model To analyze whether uncertainty a§ects commodity pricesí behavior depending on the level of uncertainty, we consider that uncertainty may be a nonlinear propagator of shocks across markets, captured by a threshold vector autoregressive model.20 A threshold VAR model is 17 More precisely, the authors show that when h = 1, common macroeconomic uncertainty shocks account for between 3.59% and 15.13% of the forecast error variance in industrial production, compared to 0.52% and 10.56% for h = 12. For a review on the e§ects of maturity on uncertainty, see Bloom (2014). 18 The results of unit root tests are available upon request to the authors and show that all price return series are stationary at conventional statistical levels. 19 http://www.econ.nyu.edu/user/ludvigsons/. 20 See Balke (2000), Tong (2010), and Hansen (2011) for more details on these models. It is important to note that nonlinearities may arise in many di§erent forms. So far, empirical papers on the energy prices-economic activity nexus have mainly focused on asymmetric speciÖcations (see e.g. Hamilton, 1996; Kilian and Vigfusson, 2011; Venditti, 2013). Our main purpose in this paper is to investigate whether the e§ect of macroeconomic uncertainty on commodity price returns depends on the regime of uncertainty, justifying the use of a threshold 14
  • 17. a nonlinear multivariate system of equations that models nonlinearity additively and can be estimated by OLS. In addition to providing an intuitive way to capture the nonlinear e§ects of uncertainty on markets, the TVAR model has the advantage of endogenously identifying dif- ferent uncertainty states. Indeed, according to this speciÖcation, observations can be divided, for example, into two states delimited by a threshold reached by uncertainty, with estimated coe¢cients that vary depending on the considered state (low- and high-uncertainty states). In other words, the TVAR speciÖcation allows uncertainty states to switch as a result of shocks to commodity markets. For each of our four groups of commodity markets, we consider a TVAR model of the form: Yt = 41 + A1 Yt + B1 (L) Yt'1 + ! 42 + A2 Yt + B2 (L) Yt'1 " It (ct'd ) :) + ut; (4) where Yt is a vector of endogenous variables containing both the price returns of all commodit- ies belonging to the considered group (energy, precious metals, industry, and agriculture) and the measure of macroeconomic uncertainty,21 A1 and A2 reáect the contemporaneous relation- ships in the two states, respectively, B1 (L) and B2 (L) are lag polynomial matrices, 41 and 42 are vectors of constants, and ut denotes the vector of orthogonalized error terms. ct'd is the d-lagged threshold variable, which is a function of uncertainty (this hypothesis is discussed and tested below, as well as the choice of the optimal value of d). It (ct'd ) :) is an indicator function that equals 1 when ct'd ) : and 0 otherwise, where : denotes the threshold uncer- tainty critical value that has to be endogenously estimated. In other words, two states are identiÖed: the low-uncertainty state corresponding to a weak degree of uncertainty (It(:) = 0) and the high-uncertainty state related to a high degree of uncertainty (It(:) = 1). As shown by Equation (4), the coe¢cients of the TVAR model are allowed to change across states depending on the level of uncertainty. Given the common belief in the literature since the beginning of the 1970s about the endogenous nature of commodity prices with respect to macroeconomic aggregates,22 we follow Kilian and Vega (2011) and adopt a recursive structure23 in A1 and A2 based on a prespeciÖed causal order (to orthogonalize the residuals), ordering commodity prices Örst and macroeconomic uncertainty last.24 With this speciÖc ordering, the response of commodity prices to changes in macroeconomic uncertainty is assumed to occur with a delay (see e.g. Kilian and Vega, 2011). An essential step in TVAR approach is to test for the existence of a threshold e§ect with respect to uncertainty. However, the testing procedure is not straightforward because under speciÖcation. 21 We have four di§erent equations, one equation per group of commodity prices: (i) energy: oil, gas, uncer- tainty proxy; (ii) precious metals: gold, silver, platinum, uncertainty proxy; (iii) agricultural: cocoa, cotton, corn, co§ee, lumber, soybeans, sugar, wheat, uncertainty proxy; and (iv) industry: aluminium, copper, lead, nickel, tin, zinc, uncertainty proxy. 22 See among others, Blanchard and Gali (2007), and Kilian and Park (2009). 23 We extend to the conditional variance the predeterminedness assumption of Kilian and Vega (2011) on the conditional mean. 24 Results from this speciÖcation are those we present in the empirical part of the paper. However, our conclusions are robust to di§erent ordering, i.e., macroeconomic uncertainty Örst and prices last. 15
  • 18. the null hypothesis of no threshold e§ect, the threshold value is not known a priori and has to be estimated.25 Here, the threshold is determined endogenously by a grid search over all possible values of the threshold variable where the grid is trimmed at a lower and upper bound to ensure a su¢cient number of data points for the estimation procedure in each regime.26 To test for a threshold e§ect, we rely on nonstandard inference and estimate the model by least squares for all possible threshold values. Conditionally to each possible threshold, we generate three Wald-type statistics using Hansen (1996)ís simulation method to test the null hypothesis of no di§erence between states: the maximum Wald statistic over all possible threshold values (sup-Wald), the average Wald statistic over all possible values (avg-Wald), and a function of the sum of exponential Wald statistics (exp-Wald). Because the asymptotic distribution of Wald statistics is nonstandard, we use Hansen (1996)ís bootstrap procedure to simulate the related distribution and conduct inference. The estimated threshold values are those that maximize the log-determinant of the variance-covariance matrix of residuals. Once the TVAR speciÖcation is estimated, another important concern consists in analyzing nonlinear impulse-response functions (IRFs). In a nonlinear setup, impulse responses are more complicated than in standard linear VAR models because responses to a shock are history- dependent. Indeed, in a linear framework impulse responses are computed under the assump- tion that shocks hit the series only at a particular point in time (i.e., neither before, nor during the forecasting horizon). Unlike the standard framework, in our case the reaction of the endo- genous variable to a shock depends on the past history, the state of the economy and the size and the sign of all the shocks hitting the economy within the period of interest. In order to average out the ináuences of shocks on the system, we compute generalized impulse-response functions (GIRFs, see Koop et al., 1996). By relying on data simulation depending on the re- gime of the system at the time of the shock hits the variables, this approach has the advantage to allow for regime-dependent responses, as well as to look at the e§ects of shocks of di§erent sizes and directions. A GIRF can be deÖned by the following expression: GIRFy (h; .t'1; ut) = E [yt+h j .t'1; ut] $ E [yt+h j .t'1] (5) where .t'1 is the information set at time t $ 1 and ut is a particular realization of exogenous shocks. The response of the variable y at horizon h is calculated by simulating the evolution of the model conditionally on the initial condition .t'1 and a given realization of ut. The general idea is to simulate the model for any possible starting point in the time horizon. We do this by drawing vectors of shocks ut+j with j = 1; :::; k; and simulating the model conditionally on the initial condition and given realization. We repeat the procedure for $ut+j in order to eliminate any asymmetry that may arise from sampling variation in the draws of ut+j. The approach is repeated 500 times. In order to generate IRFs conditionally to the location of the system with respect to the threshold variable, the simulations are repeated for several histories depending 25 If the threshold value was known, it would be possible to simply test "2 = A2 = B2 (L) = 0. 26 The level of trimming is 15% as it is common in the literature. 16
  • 19. on the considered regime. Finally, the response to shocks speciÖc to a particular regime is the estimated conditional expectation based upon the average of the simulation results.27 3.2 Endogeneity and strict exogeneity between macroeconomic and com- modity prices As mentioned above, another complication when estimating TVAR models concerns the endo- geneity issue. Endogeneity may come from the fact that the threshold variable (our uncertainty measure) is allowed to endogenously respond to commodity price shocks. One way to address this problem is to assume strict exogeneity between variables. However, as discussed by Van Robays (2013) among others, assuming strict exogeneity between oil prices (and commodity prices in general) and macroeconomic uncertainty is not realistic because it is well known that a strong relationship exists between the oil market and economic activity. Therefore, a common approach is to impose the threshold variable to switch across states with a delay. This implies that we only evaluate commodity price shocks that occur within a certain state. Another common assumption in the TVAR literature is to deÖne the threshold variable as a moving average process that requires some persistence in the variation of the threshold variable before shocks cause the regime switching. To fully address the issue of endogeneity, we combine these two approaches in the present paper by considering a three-period moving average of our one-period-lagged threshold variable.28 4 Uncertainty transmission across states We now use the TVAR approach to apprehend the impact of macroeconomic uncertainty on commodity prices. We Örst present threshold test results and related comments. We then complement the analysis by conducting nonlinear IRF analysis under high- and low- uncertainty states to investigate whether the transmission of macroeconomic uncertainty shocks into commodity markets di§ers across states. Finally, we assess the ináuence of the considered maturity. 4.1 Threshold test results Tables 2 to 5 in Appendix A report the three threshold test results for each group of commodity markets at di§erent maturities together with the ìpercentage of high uncertaintyî correspond- ing to the percentage of observations such that the threshold variable is above the estimated threshold critical value.29 Our main results can be summarized as follows. 27 The algorithm used to derive the GIRFs is described in Appendix A. 28 Results (available upon request to the authors) are robust to di§erent lag speciÖcations. 29 Following Jurado et al. (2015), we retain three maturities corresponding to macroeconomic uncertainty at 1, 3, and 12 months, referring to short-, medium-, and long-run perceptions, respectively. 17
  • 20. First, the null hypothesis is always rejected in favor of the presence of threshold e§ects for each group of markets and the maturity considered. The TVAR speciÖcation is thus appropriate because it accounts for varying e§ects of uncertainty depending on the degree of uncertainty. Second, the estimated threshold values increase with the maturity, meaning that as h increases, the switching mechanism between low- and high-uncertainty states is delayed. This Önding reáects a di§erent perception of the level of uncertainty as the horizon increases (Bloom, 2014) and is also consistent with Jurado et al. (2015)ís conclusions, highlighting that the level of un- certainty tends to augment along with the maturity. Third, turning to the percentage of high uncertainty, the results deserve some detailed comments. Whatever the maturity considered, agricultural and industrial markets display the highest percentages, whereas energy and pre- cious metals markets are characterized by similar lower values. Moreover, high-uncertainty percentage values are quite stable, regardless of the considered maturity for the latter two markets. Regarding precious metals, this result can be explained by their safe-haven role across all horizons during times of economic turmoil (Bredin et al., 2014), making them an interesting tool to transfer short-run uncertainty to longer one. Concerning energy markets, the limited substitution e§ects at relatively short-term horizons may explain the stability of the high-uncertainty percentage values. Turning to agricultural markets, this sector is highly sensitive to the unexpected changes in economy (Baumeister and Kilian, 2014), explaining why the high-uncertainty percentage value is higher at the short-run, one-month maturity. Finally, the observation that the percentage of high uncertainty increases with the maturity in the case of industrial markets results from the sensitivity of this sector to structural factors that are more at play in the long run. Indeed, to design proper R&D investment strategies, Örms usually have to focus on longer horizons. Fourth, the evolution of the percentage of high un- certainty according to the value of h also provides useful information regarding the sensitivity of commodity markets to the level and variability of uncertainty. Indeed, as shown by Jurado et al. (2015), the level of uncertainty increases with h, whereas its variability is a decreasing function of h because the forecast value tends to the unconditional mean as the forecast hori- zon tends to inÖnity. Consequently, the percentage of high uncertainty in agricultural markets seems to be more sensitive to the variability of uncertainty (short-run uncertainty), but for industrial markets, this percentage increases with h and seems to be more sensitive to the level (long-run uncertainty). Figure 1B in Appendix B presents these Öndings in a more dynamic way by showing the evol- ution of our macroeconomic uncertainty measure at one month over the whole period together with the corresponding threshold value. For almost all markets, periods of high uncertainty co- incide with episodes of heightened macroeconomic uncertainty, such as the 1981-82 and 2007-09 recessions. These Ögures also illustrate the relevance of our measure of uncertainty. As stressed above, we identify a few high-uncertainty episodes compared with studies that rely on stand- ard volatility-type proxies, such as Bloom (2009) and Van Robays (2013). Consequently, most of the áuctuations attributed to uncertainty using popular proxies are in fact not associated with a broad-based movement in economic uncertainty. In other words, much of the variation in traditional uncertainty proxies is not driven by uncertainty itself, again highlighting the 18
  • 21. interest of our retained measure. 4.2 Nonlinear impulse-response function analysis Figures 1C to 4C in Appendix C depict the impact of macroeconomic uncertainty for h = 1 on each commodity price return series. As shown, four lines are displayed, corresponding to positive and negative nonlinear IRFs under high- and low-uncertainty states following a two- standard-deviation macroeconomic uncertainty shock. For almost all series and as expected, positive macroeconomic uncertainty shocks (i.e., increase in macroeconomic uncertainty) af- fect commodity price returns negatively on average, whereas negative shocks (i.e., decrease in macroeconomic uncertainty) impact price returns positively on average. This is a quite lo- gical result, conÖrming that Jurado et al. (2015)ís macroeconomic uncertainty proxy is clearly countercyclical. Moreover, the IRF analysis puts forward asymmetric behavior. Indeed, the impact of macroeconomic uncertainty is generally stronger in high-uncertainty states compared with low-uncertainty states, with commodity price returns being more sensitive to events that lessen the predictability of macroeconomic variables. These Öndings illustrate the interest of the TVAR speciÖcation by showing that the impact of macroeconomic uncertainty on com- modity markets depends on its intensity. At a more detailed level, considering the cases of energy and precious metals, the responses of oil, gold, platinum, and silver markets are unequivocal because price returns strongly react to macroeconomic uncertainty shocks in high-uncertainty states (between 4% to 7% for oil, gold and platinum and approximately 10% for silver). Moreover, though the responses to positive and negative shocks are quite persistent (eight months) and symmetric for oil and platinum, the responses of gold and, to a lesser extent, silver are more transient (approximately four months) and asymmetric. The safe-haven role of gold and silver markets during periods of economic downturn could be one plausible explanation about the rapid overshooting reaction of both prices. Recall that the proxy is countercyclical meaning that increases in uncertainty correspond to recessionary periods. Therefore, for gold and silver prices two e§ects seem to be at play: (i) macroeconomic uncertainty decreases the general price level since the economy is in recession, and (ii) after a certain delay, the safe-haven role of precious metals leads to rapid strong overshooting behaviors. The main drivers of oil and platinum markets are sensitive to macroeconomic uncertainty shocks because they are strongly related to economic activity through industry purposes. A di§erent pattern is observed for the gas market, for which the response to macroeconomic uncertainty shocks is more important in low-uncertainty states. The regional organization of this market may explain its relatively weak sensitivity to high macroeconomic uncertainty. Turning to the industrial and agricultural sectors, all industrial markets but the zinc follow quite similar patterns signiÖcantly reacting to uncertainty, as do agricultural markets with the exception of co§eeówhich is a highly volatile marketóand, to a lesser extent, sugar and wheat. 19
  • 22. 4.3 Does maturity matter? Examining the ináuence of maturity when investigating the impact of uncertainty on prices is of particular importance given the multiple channels and di§erent e§ects at play at short-, medium-, and long-run horizons (see Bloom, 2014, for a review). Understanding the maturity perception in assessing uncertainty is also of primary importance for commodity prices since maturity may capture di§erent behaviors. For instance, short- and medium-run uncertainty may capture a kind of reallocation e§ect (Hamilton, 1988) since such maturities focus on cur- rent behaviors, while a long-run perception of uncertainty may be more related to Bernanke (1983)ís framework because it corresponds to horizons relevant to purchase and investment decisions.30 Our results in Section 4.1 give us a Örst insight about the static sensitivity of prices to maturity. Turning now to the dynamic analysis, Figure 1D in Appendix D reports the average (per group of markets) cumulative responses of prices to positive high uncertainty two-standard deviations shocks at maturity h. As before, three values of h are consideredónamely, 1, 3 and 12 months. The results are consistent with those of Section 4.1 revealing that maturity matters for some markets. Though the percentage of high uncertainty is quite stable across maturity for energy and precious metals markets, the responses of both groups to a positive shock are quite similar giving more importance to the short-run e§ect. While the impact of short-run uncertainty is clear for energy markets (in line with the close relationship that exists between energy and economic activity in the short run), the response of precious metals markets seems to be more sensitive to long-run uncertainty after a certain delay.31 The speciÖc behavior of precious metals markets may come from the well-known safe-haven property transferring un- certainty at 1 month to longer horizons (12 months). For industrial markets the conclusion is more straightforward, uncertainty at longer maturity (h = 12) has a greater immediate impact on price returns, conÖrming the high sensitivity of such markets to structural factors and the reactiveness of industrial Örms to horizons relevant to long-run investments. Regarding the agricultural sector, markets also appear to be more sensitive to long-run uncertainty, which is quite logical since agricultural Örms may face longer horizons with respect to agricultural investment decisions. On the whole, the important point regarding the impact on commodity prices is not only the percentage of high uncertainty but also how shocks are incorporated into the system and, in turn, their implications for economic behaviors. 30 Recall that, by construction, the level and the variability of our proxy of uncertainty respectively increases and decreases with h. This property allows us to apprehend the sensitivity of commodity prices to both the level and the variability of uncertainty. 31 Given the importance of the oil market in the literature, Figure 2D in Appendix D reports the speciÖc response of the oil price to positive (left side) and negative (right side) macroeconomic shocks across maturity. As for the whole energy markets group, the oil price is more sensitive to short-run uncertainty after a positive shock. Looking at negative shocks (i.e., decrease in macroeconomic uncertainty), the response is quite symmetric to the positive one, highlighting the importance of short-run uncertainty. 20
  • 23. 5 Does macroeconomic uncertainty generate commodity un- certainty? To provide a complete description of the links between macroeconomic uncertainty and com- modity markets, we go a step further and investigate how macroeconomic uncertainty can a§ect each commodity market uncertainty. To this end, we must deÖne an uncertainty meas- ure for each market and then assess the transmission mechanism of macroeconomic uncertainty to each speciÖc commodity market uncertainty. 5.1 Measuring commodity market uncertainty Let us Örst consider the determination of the commodity market uncertainty proxy. We rely on Equation (1) and proceed in two steps. In a Örst step, we use the previously estimated TVAR model to generate the h-period-ahead forecast of the considered price return series, accounting for the information about macroeconomic uncertainty. Let E [yt+h=Jt; uu t ] be the obtained forecast, where y is the considered commodity price return series, Jt the information set available at time t, and uu t the macroeconomic uncertainty shock at time t. As seen, our forecast value accounts for information about macroeconomic uncertainty. Given this forecast, we deÖne in a second step the h-period-ahead forecast error as the di§erence between yt+h and E [yt+h=Jt; uu t ], the forecast that accounts for information about macroeconomic uncertainty. The underlying idea is that a way to understand the transmission mechanism of macroeco- nomic uncertainty to commodity markets is to assess how the forecast of our considered variable changes if we add information about macroeconomic uncertainty. The commodity market un- certainty measure is then given by the volatility of this forecast error. To account for the volatility-clustering phenomenon, which is a typical feature of commodity markets, we rely on time-varying volatility speciÖcations and consider the moving average stochastic volatility model developed by Chan and Jeliazkov (2009) and Chan and Hsiao (2013) given by:32 xt = B + vt; (6) where xt denotes the forecast error, i.e., the di§erence between the forecast of y that does not account for information about macroeconomic uncertainty and the forecast that accounts for such information. The error term vt is assumed to be serially dependent, following a MA(q) process of the form: vt = "t + 1"t'1 + ::: + q"t'q; (7) 32 For robustness checks, the GARCH, standard stochastic, and heavy-tailed stochastic volatility models have also been considered to estimate the volatility of forecast errors. The corresponding results, available upon request to the authors, are quite similar between models. 21
  • 24. ht = Bh + Gh (ht'1 $ Bh) + Ht; (8) where "t * N ! 0; eht " and Ht * N ! 0; I2 h " are independent of each other, "0 = "'1 = ::: = "'q+1 = 0, and the roots of the polynomial associated with the MA coe¢cients = ! 1; :::; q "0 are assumed to be outside the unit circle. ht is the log-volatility evolving as a stationary AR(1) process. Following Chan and Hsiao (2013), under the moving average extension, the conditional variance of the series xt is given by: V (xt j B; ; h) = eht + 2 1eht'1 + ::: + 2 qeht'q : (9) This speciÖcation allows us to capture two nonlinear channels of macroeconomic uncertainty: (i) the one coming from the moving average of the q + 1 most recent variances eht + ::: + eht'q, and (ii) the other from the AR(1) log-volatility stationary process given by Equation (8). Given the challenge of estimating this kind of nonlinear model due to high-dimensional and nonstandard dataówith the conditional density of the states being non-Gaussianóa Bayesian estimation using Markov chain Monte Carlo methods is hardly tractable. We follow Chan and Hsiao (2013) and estimate the conditional variance of forecast errors by band-matrix al- gorithms instead of using conventional methods based on the Kalman Ölter.33 5.2 Transmission of macroeconomic uncertainty to commodity market un- certainty Figures 1E to 4E in Appendix E depict the evolution of uncertainty in commodity markets for 1 month (blue line), together with the evolution of corresponding prices (black line) and volatility (green line). The horizontal bar corresponds to 1.65 standard deviation above the mean of each commodity-related uncertainty series. When uncertainty in commodity markets exceeds the horizontal bar, this refers to episodes of heightened uncertainty for the considered price return series. When commodity price uncertainty coincides with the vertical gray bands, it indicates a potential transfer from macroeconomic to commodity market uncertainty (with both uncertainty episodes occurring in the same period).34 Otherwise, uncertainty is attribut- able to the own characteristics of the considered raw materials market. Consider Örst the case of energy markets. As shown in Figure 1E (Appendix E), the sensitivity of oil price uncertainty to macroeconomic uncertainty di§ers depending on the retained period, highlighting that oil shocks do not all follow the same pattern. For example, the period that just follows the invasion of Kuwait in 1990, the Afghan war in 2001, and the Iraq War in 33 See Chan and Jeliazkov (2009) and Chan and Hsiao (2013) for more details. The Matlab code used to estimate the moving average stochastic volatility model is freely available from the website of Joshua Chan. We obtain 20000 draws from the posterior distribution using the Gibbs sampler after a burn-in period of 1000. 34 Recall that the gray bands correspond to episodes of important macroeconomic uncertainty: the months surrounding the 1973-74 and 1981-82 recessions and the 2007-09 great recession. 22
  • 25. 2002-03 are episodes characterized by sharp spikes in oil prices. The Iran-Iraq war in 1980 and the 1999 OPEC meeting are, in contrast, associated with small price movements. As stressed by Barsky and Kilian (2004), a simplistic view should be that major war episodes cause price uncertainty to increase through a rise in precautionary demand for oil. However, among all episodes of important áuctuations in oil prices, only two seem to be accompanied by uncer- tainty:35 (i) the 2007-09 recession, and (ii) the 1984-86 period. During the 2007-09 recession, oil price uncertainty is indeed very sensitive to macroeconomic uncertainty, a result that is not surprising given the well-known relationship that exists between economic activity and the oil market.36 This episode of high oil price uncertainty is accompanied by the biggest oil price spike in the postwar experience and results from various macroeconomic factors. A common explanation lies in the global economic growth starting in 2003, as illustrated by the increase in real gross world product combined with the stagnant oil production from Saudi Arabia from 2005 to 2007.37 Whatever the origin of price surges, this period of macroeconomic uncertainty is reáected in oil market uncertainty by an unprecedented oil price increase. The 1984-86 period is also characterized by heightened oil price uncertainty, but it does not coincide with macroeconomic uncertainty. This episode seems to be related to the conjunction of two events: (i) the production shutdown in Saudi Arabia between 1981 and 1985, which caused a strong price decrease;38 and to a lesser extent (ii) the OPEC collapse in 1986. On the whole, our results are in line with the literature that has recently stressed the limited impact of exogenous events on oil price áuctuations. Another interesting period is the one from June 2014 up to now where the WTI crude oil price has fallen from US$ 105.8 to around US$ 40 per barrel. Most of this decline appeared between June 2014 and January 2015 where the price fell by nearly 44% leading to severe economic stress on oil producers. Because sustained declines in the price of oil are rare events, many observers and authors have conjectured that unexpected factors speciÖc to the oil market have played an important role. Arezki and Blanchard (2014), for example, attribute a large part of the steep decline in the price of oil to a shift in expectations about the future path of global oil production (especially from the Libyan and Iraqi oil production, and the OPEC November 2014 announcement). Competing with this view, Baumeister and Kilian (2016) suggest that more than half of the observed decline was predictable and must reáect the cumulative e§ect of earlier oil demand and supply shocks. Looking at our oil price uncer- tainty indicator reveals that, whatever the origin of the oil price slump, most of the decline was predictable until the end of our sample (April 2015) with no particular episode of uncertainty. Turning to gas, the conclusion is somewhat di§erent given the well-known regional organization of the market which may exempt the price from several international shocks. Results indeed show that macroeconomic uncertainty does not generate uncertainty in the gas market. In 35 In Section 5.2 we precisely investigate what types of shocks tend to increase oil price uncertainty. 36 See Barksy and Kilian (2002, 2004), Kilian (2008a,b, 2009), Kilian and Murphy (2014) to name a few. 37 According to the U.S. Energy Information Administration, the total Saudi Arabia crude oil production signiÖcantly decreases from 9,550.136 thousand barrels per day in 2005 to 8,721.5068 thousand barrels per day in 2007. 38 At the beginning of the 1980s, the strategy of Saudi Arabia to shut down production (compensating higher oil production elsewhere in the world) was initiated to prevent an oil price decline, without success. Saudi Arabia Önally decided to ramp production back up in 1986, causing an oil shock from $27/barrel in 1985 to $12/barrel in 1986 (see Kilian and Murphy, 2014). 23
  • 26. particular, we do not observe heightened movements during the 2007-09 recession conÖrming that the gas price should be more ináuenced by microeconomic events related to industrial considerations. Some exceptions can be highlighted in 1996, 2001, and 2005, where the gas market experienced short-lived periods of price increase and strong volatility. These events are however more related to extreme climatic events (unusually cold weather in 1996 and the Kat- rina/Rita hurricanes in 2005) and do not lead to episodes of extreme uncertainty (Kilian, 2010). As discussed by Jurado et al. (2015) and conÖrmed by our previous analysis, macroeconomic uncertainty is strongly countercyclical,39 roughly doubling in importance during recessions. Given the role of precious metals (especially gold and silver) as safe havens and hedging in- struments during Önancial and macroeconomic turmoils, their prices are often countercyclical as well (see Christie-David et al., 2000; Roache and Rossi, 2009; Creti et al., 2013) and should increase in periods of macroeconomic uncertainty, at least in the short run. Regarding the 2007- 09 recession, it seems (Figures 2E in Appendix E) that increases in gold and silver prices were largely anticipated because the related uncertainty remained relatively low. In other words, macroeconomic uncertainty did not spread to precious metals markets. This Önding conÖrms the safe-heaven role of gold and silver given that macroeconomic uncertainty surrounding the global crisis pushed up their prices, but did not induce uncertainty in their respective markets. However, at the beginning of the 1980s, the high-uncertainty period associated with gold and silver prices coincided with the 1981-82 recession. The gold market, which is often used as a hedging instrument against ináation pressures, experienced huge movements in 1980 due to the continued stop-and-go monetary policy of the Fed raising its rate to 20%, then lowering it to 8%, and augmenting it again to 20%.40 Uncertainty in the gold price was further ampliÖed in 1981, when Reagan decided to establish a Gold Commission to reject the return of the United States to the gold standard system, leading the Fed to implement a contractionary policy that reduced ináation but favored recession. Other events likely to ináuence gold prices, such as the bombing of the Twin Towers in September 2001 or the launch of the Electronic Trading Funds (ETFís) in the gold market in 2003, do not lead to price uncertainty. The silver price displays a similar behavior as the gold price, but uncertainty appears to be ampliÖed, particularly at the beginning of the 1980s. Among the several causes of silver price movements, various political eventsóincluding the continuous U.S. hostage crisis in Iran and the Soviet invasion of Afghanistanómotivated an increasing demand for silver, keeping the price at relatively high levels in 1980 and leading to high uncertainty in the silver market. Another well-known epis- ode a§ecting the silver price evolution around this period is the Hunt Brothersí story from the 1970s to the end of the 1980s.41 The worldwide 1981-82 recession strengthened this period 39 One reason is that exogenous shocks that often cause recessionsósuch as wars or Önancial panicsóalso directly increase uncertainty (see Bloom, 2014). 40 On January 21, 1980, the gold price reached a record level of $850. 41 At the beginning of the 1970s, the Hunt Brothers began accumulating large amounts of silver to hedge against oil investment, totaling almost the global market by 1979 (with an estimated holdings of the one third of the entire silver world supply). This accumulation rose the price of silver from $11 per ounce at the end of 1979 to $50 per ounce in January 1980. In response to this speculative accumulation, the COMEX adopted on January 7, 1980 the ìSilver Rule 7î placing heavy restrictions on the purchase of this commodity. Three 24
  • 27. of uncertainty. The propagation mechanism at play during this recessionary episode was in- trinsically linked to precious metals markets through ináation targeting and the Fed interest rate policy, contrary to the recent Önancial crisis. Unlike gold, which is mainly used in jewelry and as a store of value, platinum is a crucial resource in industryóautomotive industry, for instance, represented approximately 60% of the total demand for platinum in 2007 (Johnson Matthey Plc., 2008). Its price is thus strongly related to economic activity, and episodes of high macroeconomic uncertainty tend to a§ect platinum price uncertainty, as it was the case during the 2007-09 recession. As the oil price, most of industrial markets are strongly connected to global economic activ- ity. This important link is evidenced by the transfer of uncertainty from the macroeconomic level to commodity prices, especially for copper, lead, nickel and tin prices (see Figures 3E in Appendix E). For instance, because copper is primarily employed for industrial purposes42 (such as massive construction projects, infrastructure renewal, and telecommunication modi- Öcations), it is usually strongly related to global economic activity, and its price is often used as an indicator of global development. Therefore, the 2007-09 period of macroeconomic uncer- tainty is closely related to copper price uncertainty, as shown in Figure 3E. Similar patterns are observed for the other industrial markets, which are also strongly related to global economic conditions. The transfer of macroeconomic uncertainty to agricultural and food prices uncertainty is of primary importance given the strong economical, political and social implications for both developing and developed countries. The increase in agricultural commodity prices since the mid-2000s has attracted particular attention among policymakers with regard to a global food shortage and ináationary pressures.43 Though a popular perception is that higher agricultural and food prices have been associated in recent yearsóespecially during the 2007-09 periodó with oil price surges, this general statement has been recently contradicted by Baumeister and Kilian (2014), who argue that agricultural and food price increases should not be interpreted as the causal e§ect of higher oil prices, but are rather the result of unexpected changes in demand associated with shifts in global real economic activity. Our Öndings (Figure 4E in Appendix E) conÖrm this interpretation, especially for corn, soybeans and wheat, for which price uncertainty occurs during the most striking episodes of macroeconomic uncertainty. Unexpected shifts in global economic activity would therefore be the main cause of uncertainty in agricultural prices during the 2007-09 recession. Periods for which agricultural price uncertainty is not related to macroeconomic uncertainty di§er depending on the market. For instance, the most salient episode of co§ee price uncertainty appears during 1994-97, when the price started a brief re- months after (on March 27, 1980), the silver price collapsed to below $11 per ounce. This event is known as the ìSilver Thursdayî. 42 Over the past century, the demand for reÖned copper has increased from 500,000 metric tons to over 19 million metric tons. 43 As documented by Baumeister and Kilian (2014), in the Monday 23, 2007 edition, the Financial Times reported that ìretail food prices are heading for their biggest annual increase in as much as 30 years, raising fears that the world faces an unprecedented period of food price ináationî. 25
  • 28. covery after an intense Brazilian frost episode in 1994, which reduced Brazilís co§ee exports. In 1989, the co§ee price experienced a volatility spike after the end of the co§ee agreement, but this episode did not lead to uncertainty because it was largely anticipated. Another example is the cotton market, which is characterized by a strong uncertainty episode that occurred in 2011, with a huge unanticipated price increase that could be explained by a constellation of events such as gradually tightening stocks, an unexpected freeze in Chinaís cotton producing areas, historic áoods in Pakistan and a ban on exports from India. Overall, though the results are obviously somewhat heterogeneous across markets, the recent 2007-09 recession generated an unprecedented episode of uncertainty in the price of numer- ous commodities, particularly oil, platinum, various agricultural commodities and, especially, all industrial raw materials. The main exception concerns uncertainty related to gold and silver prices, a fact that can be explained by their roles as safe havens and hedging instru- ments. An additional result is that, as clearly shown by Figures 1E to 4E in Appendix E, uncertainty episodes are not necessarily accompanied by high volatility in commodity prices. This major Önding illustrates the interest of our retained measure of uncertainty, underlin- ing that uncertainty is more related to predictability than to volatility. The relevance of the predictability-based approach could be explained by some speciÖc properties of the commodity markets. In particular, these markets are known to be characterized by a low elastic demand together with a strong inertial supply, making any unexpected adjustment di¢cult and costly. 5.3 Historical decomposition analysis To assess the contribution of macroeconomic uncertainty to commodity prices uncertainty, we perform a historical decomposition analysis of each commodity market uncertainty with respect to macroeconomic uncertainty. Based on the estimation of VAR models,44 Figure 1F in Appendix F reports the historical decomposition associated with oil and copper prices uncertainty.45 Results in Appendix F conÖrm those of the previous section. Indeed, look- ing at the crude oil market, we Önd a strong proportion of macroeconomic uncertainty in oil price uncertainty during the recent 2007-09 Önancial crisis (around 35% of oil price un- certainty is explained by macroeconomic uncertainty during this period). Recalling that our proxy of macroeconomic uncertainty is demand-driven, these conclusions are in line with the literature. During the 1986-87 episode, oil price uncertainty is not explained by macroeco- nomic uncertainty and the proportion of macroeconomic uncertainty appears to be negative. This suggests that other shocks not related to economic activity have been at play during this period. Turning to the copper price, we also Önd a transfer from macroeconomic uncertainty to price uncertainty, the share of macroeconomic uncertainty being around 12% during the recent 44 The lag order of the VAR speciÖcation is 3, as selected by usual information criteria. 45 Due to space constraints, we only report the results for oil and copper, two series that are strongly related to the macroeconomic context. The results for the other series, available upon request to the authors, show that the contribution of macroeconomic uncertainty to commodity price uncertainty is somewhat heterogeneous between markets. 26
  • 29. Önancial turmoil. Overall, these results show that a signiÖcant component of price uncertainty can be explained by macroeconomic uncertainty. A key Önding is that the recent oil price movements in 2005-08 associated with a rise in oil price uncertainty appear to be mainly the consequence of macroeconomic uncertainty, conÖrming the endogeneity of the oil price with respect to economic activity (i.e., the demand-driven characteristic). 5.4 Distinguishing between di§erent types of shocks: the special case of oil As stressed above, macroeconomic uncertainty contributes to a large extent to price uncer- tainty. This result is of primary importance, particularly for the oil market since it shows that oil price uncertainty during the 2005-08 period can be partly explained by macroeconomic uncertainty. Besides, the oil price uncertainty indicator (see Figure 1E in Appendix E) also reveals that the volatility of the crude oil price can be sometimes disconnected to price uncer- tainty, some shocks leading to uncertainty and volatility while some others not. One reason could be the origin of price shocks that can have di§erent impacts on price uncertainty. Spe- ciÖcally, four types of shocks can be distinguished (see, e.g., Kilian, 2009; and Baumeister and Peersman, 2013): (i) shocks to the áow supply of oil, (ii) shocks to the áow demand for crude oil reáecting the state of the global business cycle, (iii) shocks to the speculative demand for oil stocks above the ground, and (iv) other idiosyncratic oil demand shocks. These di§erent shocks may also be reáected in the degree of oil price uncertainty movements. SpeciÖcally, we aim here at investigating which type of shock contributes the most to oil price uncertainty. As it is common in the literature, we proxy the áow supply in two ways: by the data on Saudi Arabia crude oil production, and by the global crude oil productionóboth series being from the Energy Information Agency (EIA).46 Our measure of áuctuations in global real activity is the dry cargo shipping rate index developed by Kilian (2009). Finally, turning to the speculat- ive component of the oil demand, we rely on data for the U.S. crude oil inventories provided by the EIA.47 Figure 1G in Appendix G allows us to assess the quantitative importance of each type of shock (supply, demand, and speculation) on oil price uncertainty. Results show that the contribution of each shock to price uncertainty varies depending on the period, and that the nature of the shock matters in explaining oil price uncertainty. For instance, while Kilian (2009) identiÖed the invasion of Kuwait in 199048 and the Iraq War in 2002-0349 as episodes 46 We only report results with Saudi Arabia crude oil production because they are more signiÖcant. Results from the global crude oil production are available upon request to the authors. 47 As Kilian and Murphy (2014), we scaled the data on crude oil inventories by the ratio of OECD petroleum stocks over U.S. petroleum stocks for each time period. 48 Hamilton (2009) rejected the hypothesis that shifts in speculative demand were behind the sharp increase in the crude oil price in 1990. Rather, he suggested that the price increase was the consequence of oil supply shocks. More recently, Kilian and Murphy (2014) found that the oil price increase was represented by two shocks occurring simultaneously: an unexpected áow supply disruption and an unexpected increase in speculative demand. 49 Two e§ects on the oil price are at play during this period: a positive speculative demand shock due to the Iraq War in 2002-03, and a negative áow supply shock due to the Venezuelan crisis (see Kilian and Murphy, 27
  • 30. of surges in speculative demand for oil responsible for sharp price increases, we Önd that these events are not associated with important oil price uncertainty. More importantly, the contri- bution of the speculative shocks appears to be very limited or even negative compared to the contribution of áow supply (around 17%) and áow demand (4%) shocks in 1990. Several events in the oil market history have appeared during the 1986-87 period. The two most important are the decision of Saudi Arabia to shut down the crude oil production to prop up the price of oil, and the OPEC collapse. While the latter is known to have limited impact on the crude oil price (Barsky and Kilian, 2004), the former created a major positive shock to the áow supply droving down the price of oil. As we have seen, this period has lead to an important movement in oil price uncertainty. Figure 1G in Appendix G shows that this event is mainly supply-driven: around 18% of oil price uncertainty is explained by the shut down of Saudi Arabia crude oil production against less than 4% by the áow demand. The most interesting episode over the last decades is obviously the unprecedented price surge after 2003 and, in particular, in 2007-08, which led to the most heightened period of oil price uncertainty. According to a popular view, this price increase was the consequence of speculat- ive behaviors on the market (i.e., growing Önancialization of oil futures markets) and could not be explained by changes in economic fundamentals (see Fattouh et al., 2013, for a discussion). The standard interpretation is that oil traders in spot markets buy crude oil now and store it in anticipation of higher future oil prices. On the contrary, the recent literature supports the conclusion that the surge in the oil price during this period was mainly caused by shifts in the áow demand driven by the global business cycle (see Kilian, 2009; and Kilian and Hicks, 2013). Our Öndings corroborate this view that oil price uncertainty has been primarily driven by global macroeconomic conditions. Indeed, as shown in Figure 1G, the contribution of spec- ulative demand to price uncertainty is very small (around 5%) compared to the proportion of the áow demand from the global business cycle in 2008 (around 40%). An alternative view regarding speculation is that OPEC held back its production by using oil below ground in anticipation of higher oil prices. As discussed by Kilian and Murphy (2014), this behavior would be classiÖed as a negative oil supply shock. Our results provide no evidence that such negative oil supply shocks have signiÖcantly contributed to oil price uncertainty, contrary to demand shocks. Finally, looking at Figure 2G in Appendix G, which reports the simultaneous contribution of each shock (áow demand, áow supply, speculative demand, and macroeconomic uncertainty) to oil price uncertainty, we Önd that the 2007-08 period of heightened oil price uncertainty is mainly the consequence of shocks coming from the global business cycle and macroeconomic uncertainty. 2014, for a discussion). 28
  • 31. 6 Robustness checks 6.1 Volatility-based vs. predictability-based uncertainty measure To conÖrm the relevance of our predictability-based measure in the case of commodity markets, we assess the robustness of our Öndings to the choice of the proxy retained for uncertainty. As stressed above, uncertainty is an abstract concept that may have di§erent meanings. Indeed, according to behavioral theories, it reáects a psychological state about possible futures,50 but it is also a broad concept linked to macro or micro phenomena (like GDP growth or the growth rate of Örms among others).51 Whatever the considered deÖnition, there is no perfect measure of uncertainty but instead a broad range of proxies. As described in Section 2, several studies have used stock market volatility as a proxy for uncertainty.52 In an ináuential paper, Bloom (2009) proposes a popular measure of uncertainty based on the VXO index, constructed by the Chicago Board of Options Exchange from the prices of options contracts written on the S&P 100 index. He identiÖes around 17 uncertainty dates, whereas Jurado et al. (2015) report far fewer uncertainty episodes, suggesting that variability in stock markets is much more related to volatility than to uncertainty a§ecting the whole economy. Therefore, comparing these two approaches allows us to compare both measures of uncertainty, namely the volatility-based and predictability-based proxies. Theoretically, each measure relies on di§erent econometric concepts: the former approach approximates uncertainty by conditional volatility, while the latter requires to remove the forecastable component of the series before computing its con- ditional volatility. In other words, the predictability-based proxy distinguishes uncertainty in a series and its conditional volatility, while the volatility-based measure does not. As an illustrative purpose, Figure ?? reports the VXO index of Bloom (2009) and the macroeco- nomic uncertainty proxy (h = 1) introduced by Jurado et al. (2015) in standardized units. As shown, the predictability-based proxy allows us to identify only three episodes of uncer- tainty, which is far fewer than the 17 uncertainty dates detected using Bloom (2009)ís measure. Figure 1H in Appendix H reports the response of commodity markets (for oil, gold, copper and cotton prices) following a positive two-standard-deviation VXO index and macroeconomic uncertainty shocks in the high-uncertainty state.53,54 In both cases, the level of oil and cot- ton prices is reduced following the shock, leading to similar conclusions whatever the retained 50 In many behavioral theories, psychological uncertainty is assumed to be an important mediator of human in situations with unknown outcomes (see Windschitl and Wells, 1996). 51 See Bloom (2014) for more details. 52 See e.g. Romer (1990), Hassler (2001), Greasley and Madsen (2006), Bloom et al. (2007), and Gilchrist et al. (2014). 53 Due to space constraints, we only report the results for one series per group of commodities, and focus on positive shocks (i.e., increase in uncertainty) in the high-uncertainty regime. Complete results are available upon request to the authors. 54 Following Bloom (2009), we include the log of the S&P500 stock market index as the Örst variable in the VAR estimations to ensure the impact of stock market levels is already controlled for when looking at the e§ect of volatility shocks. Results are robust to alternative ordering. 29
  • 32. Figure 3: Bloom (2009)ís index vs. Jurado et al. (2015)ís measure for uncertainty proxy for uncertainty. The pattern is quite di§erent for the other markets. Indeed, the re- sponse of gold and copper prices following a VXO index shock is very low compared to that obtained with the macroeconomic uncertainty proxy. This particularity has also been noted by Jurado et al. (2015) regarding the response of production and employment, Önding that the magnitude is larger when the shock comes from macroeconomic uncertainty at 1 month rather than from the VXO index. Moreover, macroeconomic uncertainty shocks generate a less signiÖcant ìvolatility overshootî in commodity prices than the VXO index (with the excep- tion of the cotton price). While the e§ect of macroeconomic uncertainty on commodity prices (especially for oil and copper prices) is more protracted (around 7 months), the response of prices after the VXO index shock is more transient (around 4 months for oil prices). This result further conÖrms that the macroeconomic uncertainty proxy is more persistent compared to popular volatility-based uncertainty proxies. To complete our comparison, we follow the same procedure as in Section 5, and investigate how volatility-based uncertainty linked to the VXO index can generate commodity uncertainty. Figure 2H in Appendix H reports the evolution of commodity uncertainty for oil, gold, copper, and cotton prices for both the VXO and macroeconomic uncertainty proxies at 1 month (h = 1). 30
  • 33. When uncertainty in commodity markets exceeds the horizontal bar, this refers to episodes of heightened uncertainty for the considered price return series. When commodity uncertainty coincides with vertical bands, it indicates that uncertainty episodes occur at the same period than macroeconomic uncertainty (green bands for the VXO-based uncertainty measure and gray bands for our macroeconomic uncertainty proxy). As shown in Figure 2H, both proxies generate quite similar commodity uncertainty dynamics. An interesting result concerns the case of the oil market for which commodity uncertainty is found to be more pronounced during the recent crisis using our retained macroeconomic uncertainty measure than with the VXO- based uncertainty measure. This is in line with our previous results showing that uncertainty episodes are not necessarily accompanied by high volatility in commodity prices. Moreover, macroeconomic uncertainty rightly a§ects the gold market during the 1981-82 recession, a characteristic that we identify using our predictability-based measure but not with Bloom (2009)ís proxy. On the whole, these Öndings illustrate the robustness of our conclusions to the retained proxy of uncertainty, and highlight the relevance of our measure in linking uncertainty to predictability rather than to volatility. 6.2 Robustness of our proxy of oil price uncertainty An important query regarding our results in Section 5 refers to the robustness of our proxy of commodity price uncertainty. This question is of primary importance since, as discussed in the literature,55 one reason why previous studies do not Önd plausible empirical evidence of oil price uncertainty impact on GDP lies in the choice of an appropriate measure of uncertainty. Theoretically, our approach implicitly assumes that oil price uncertainty (and commodity price uncertainty in general) is endogenous with respect to macroeconomic activity. As discussed in Section 2, this debate regarding the endogenous/exogenous nature of oil prices is of primary importance since it conditions the framework used to investigate the economy-oil price nexus. Considering that commodity price uncertainty is endogenous with respect to macroeconomic uncertainty does not mean that exogenous e§ects are null or without interest, but rather that they are secondary or indirect. By constructing our proxy of uncertainty based on the global measure of Jurado et al. (2015), we allow both the supply and demand components of the price to exist, but condition the latter to be the primary channel. With regard to this property, our measure of oil price uncertainty is thus theoretically robust, compared to those based on conditional volatility or implied volatility. Empirically, existing proxies of oil price uncertainty have been so far either based on conditional volatility, implied or realized volatility. However, due to their backward- or forward-looking nature, it is unclear how these proxies can properly capture oil price uncertainty. To illustrate this issue, Figure ?? reports the one-month implied crude oil volatility from the daily CBOE VXO volatility index (Panel A), the realized volatility estimate constructed from daily percent 55 See Kilian and Vigfusson (2011) for a discussion. 31
  • 34. Figure 4: Alternative measures of oil price uncertainty 0 20 40 60 80 100 1990 1995 2000 2005 2010 Panel A: One-month implied volatility .00 .02 .04 .06 .08 .10 .12 1990 1995 2000 2005 2010 Panel B: Realized volatility .04 .08 .12 .16 .20 .24 .28 1990 1995 2000 2005 2010 Panel C: Conditional GARCH(1,1) variance .04 .06 .08 .10 .12 .14 1985 1990 1995 2000 2005 2010 Panel D: Oil price uncertainty changes in the WTI crude oil spot price56 (Panel B), the conditional variance of the percent change of WTI crude oil spot price based on the estimation of a GARCH(1,1) model (Panel C), and our oil price uncertainty measure based on the variance of the forecast errors conditional on macroeconomic uncertainty (Panel D). For almost all series, the most important peak corresponds to the recent, 2007-09 Önancial turmoil and occurs near the end of 2008. However, major di§erences between the four proxies can be highlighted regarding their backward- and forward-looking degree. The GARCH-based proxy which peaks on January 2009 is the most backward-looking measure compared to the realized and implied volatility approaches which both peak on December 2008. Our oil price uncertainty proxy conditional on macroeconomic uncertainty is the most forward-looking measure since it peaks on October 2008. Therefore, given the forward-looking nature of investorsí expectations, our proxy appears to be the most suitable measure of uncertainty.57 56 See Bachmeier, Li and Liu (2008). 57 Another way to compare alternative measures of oil price uncertainty is to test which approach leads to the best predictor of volatility. Alquist et al. (2013) showed that the oil futures price is of limited use in forecasting the oil price, questioning the interest of using the implied volatility to measure uncertainty. 32
  • 35. 7 Conclusion The aim of this paper is to analyze the impact of macroeconomic uncertainty on various raw materials markets. To this end, we consider a large sample of 19 commodities and rely on a robust measure of macroeconomic uncertainty based on a wide range of monthly macroe- conomic and Önancial indicators. To assess whether the e§ect of macroeconomic uncertainty on commodity price returns depends on the degree of uncertainty, we estimate a nonlinear threshold vector autoregressive model. Our Öndings show that whereas the safe-haven role of precious metals is conÖrmed, agricultural and industrial markets are highly sensitive to the variability and the level of macroeconomic uncertainty, respectively. In addition, investigating the links between macroeconomic uncertainty and commodity price uncertainty, we show that the recent 2007-09 recession has generated an unprecedented episode of high uncertainty in the price of numerous raw materials, especially those that are linked to global economic activity. Finally, we Önd evidence that uncertainty episodes are not necessarily accompanied by high volatility in commodity prices, highlighting the relevance of our uncertainty measure in linking uncertainty to predictability rather than to volatility. 33