Download as PDF, PPTX

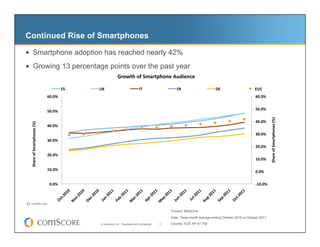
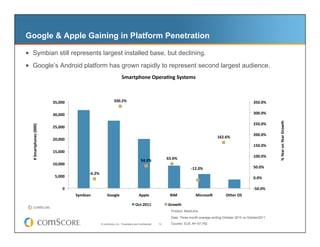
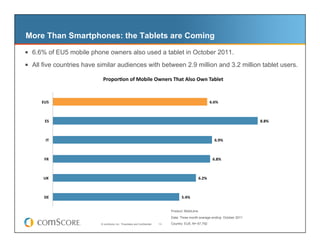
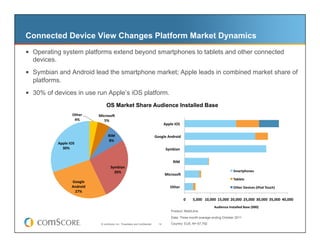
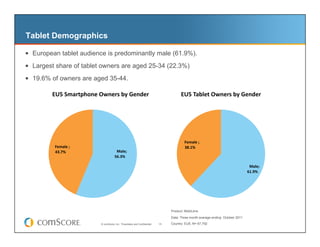
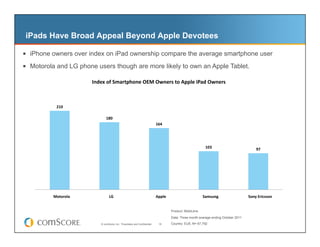

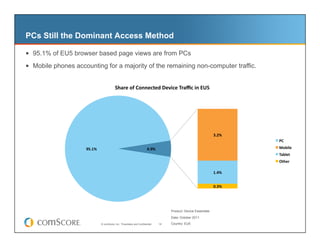
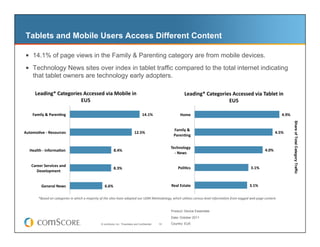
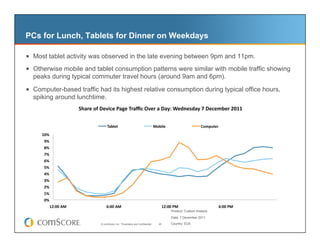
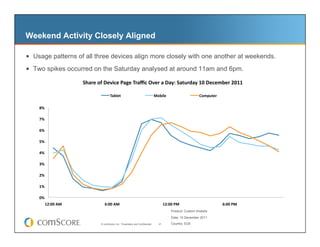

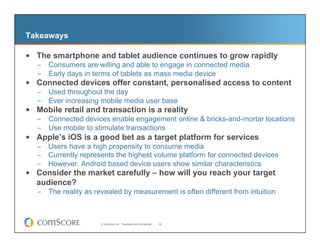

This document summarizes mobile device usage trends in Europe based on data from comScore. It finds that smartphone adoption continues to rise rapidly, with Android becoming the second most popular platform behind Symbian. Tablet usage is also growing, with over 6% of mobile phone owners also using a tablet. Usage patterns show PCs are still dominant for internet access but mobile and tablets are growing. Tablet usage peaks in the evenings while mobile peaks align with commuting hours.


![[Cimigo VN] Net citizens Việt Nam -2012](https://cdn.slidesharecdn.com/ss_thumbnails/cimigo-netcitizens-2012-120617013354-phpapp02-thumbnail.jpg?width=640&height=640&fit=bounds)


