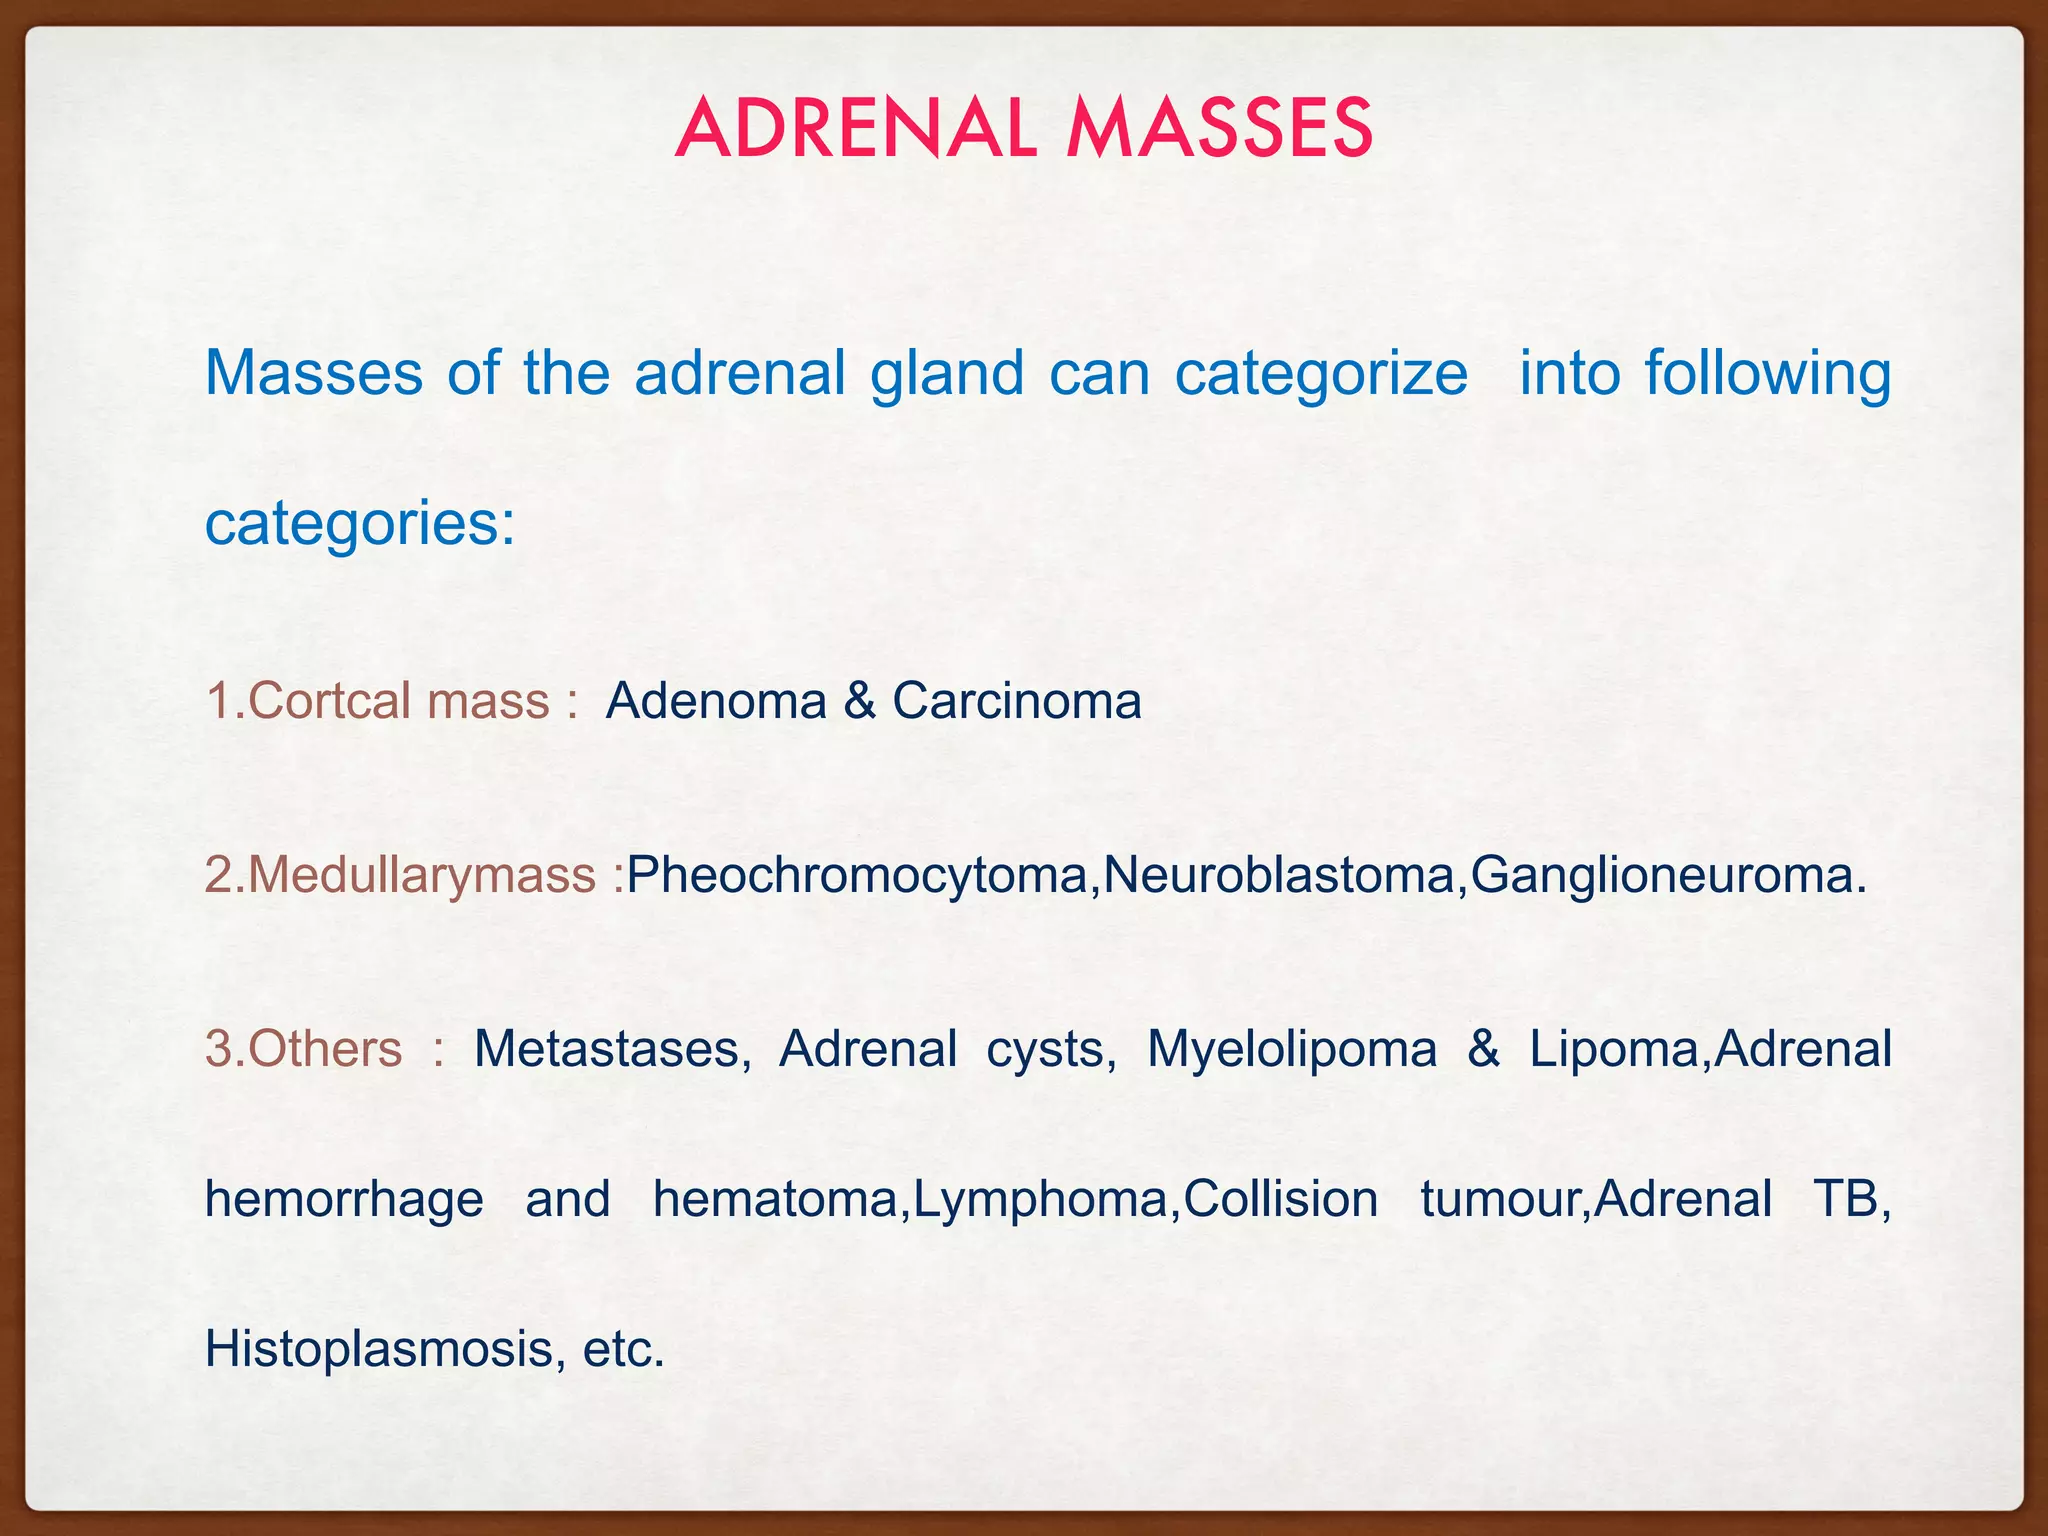
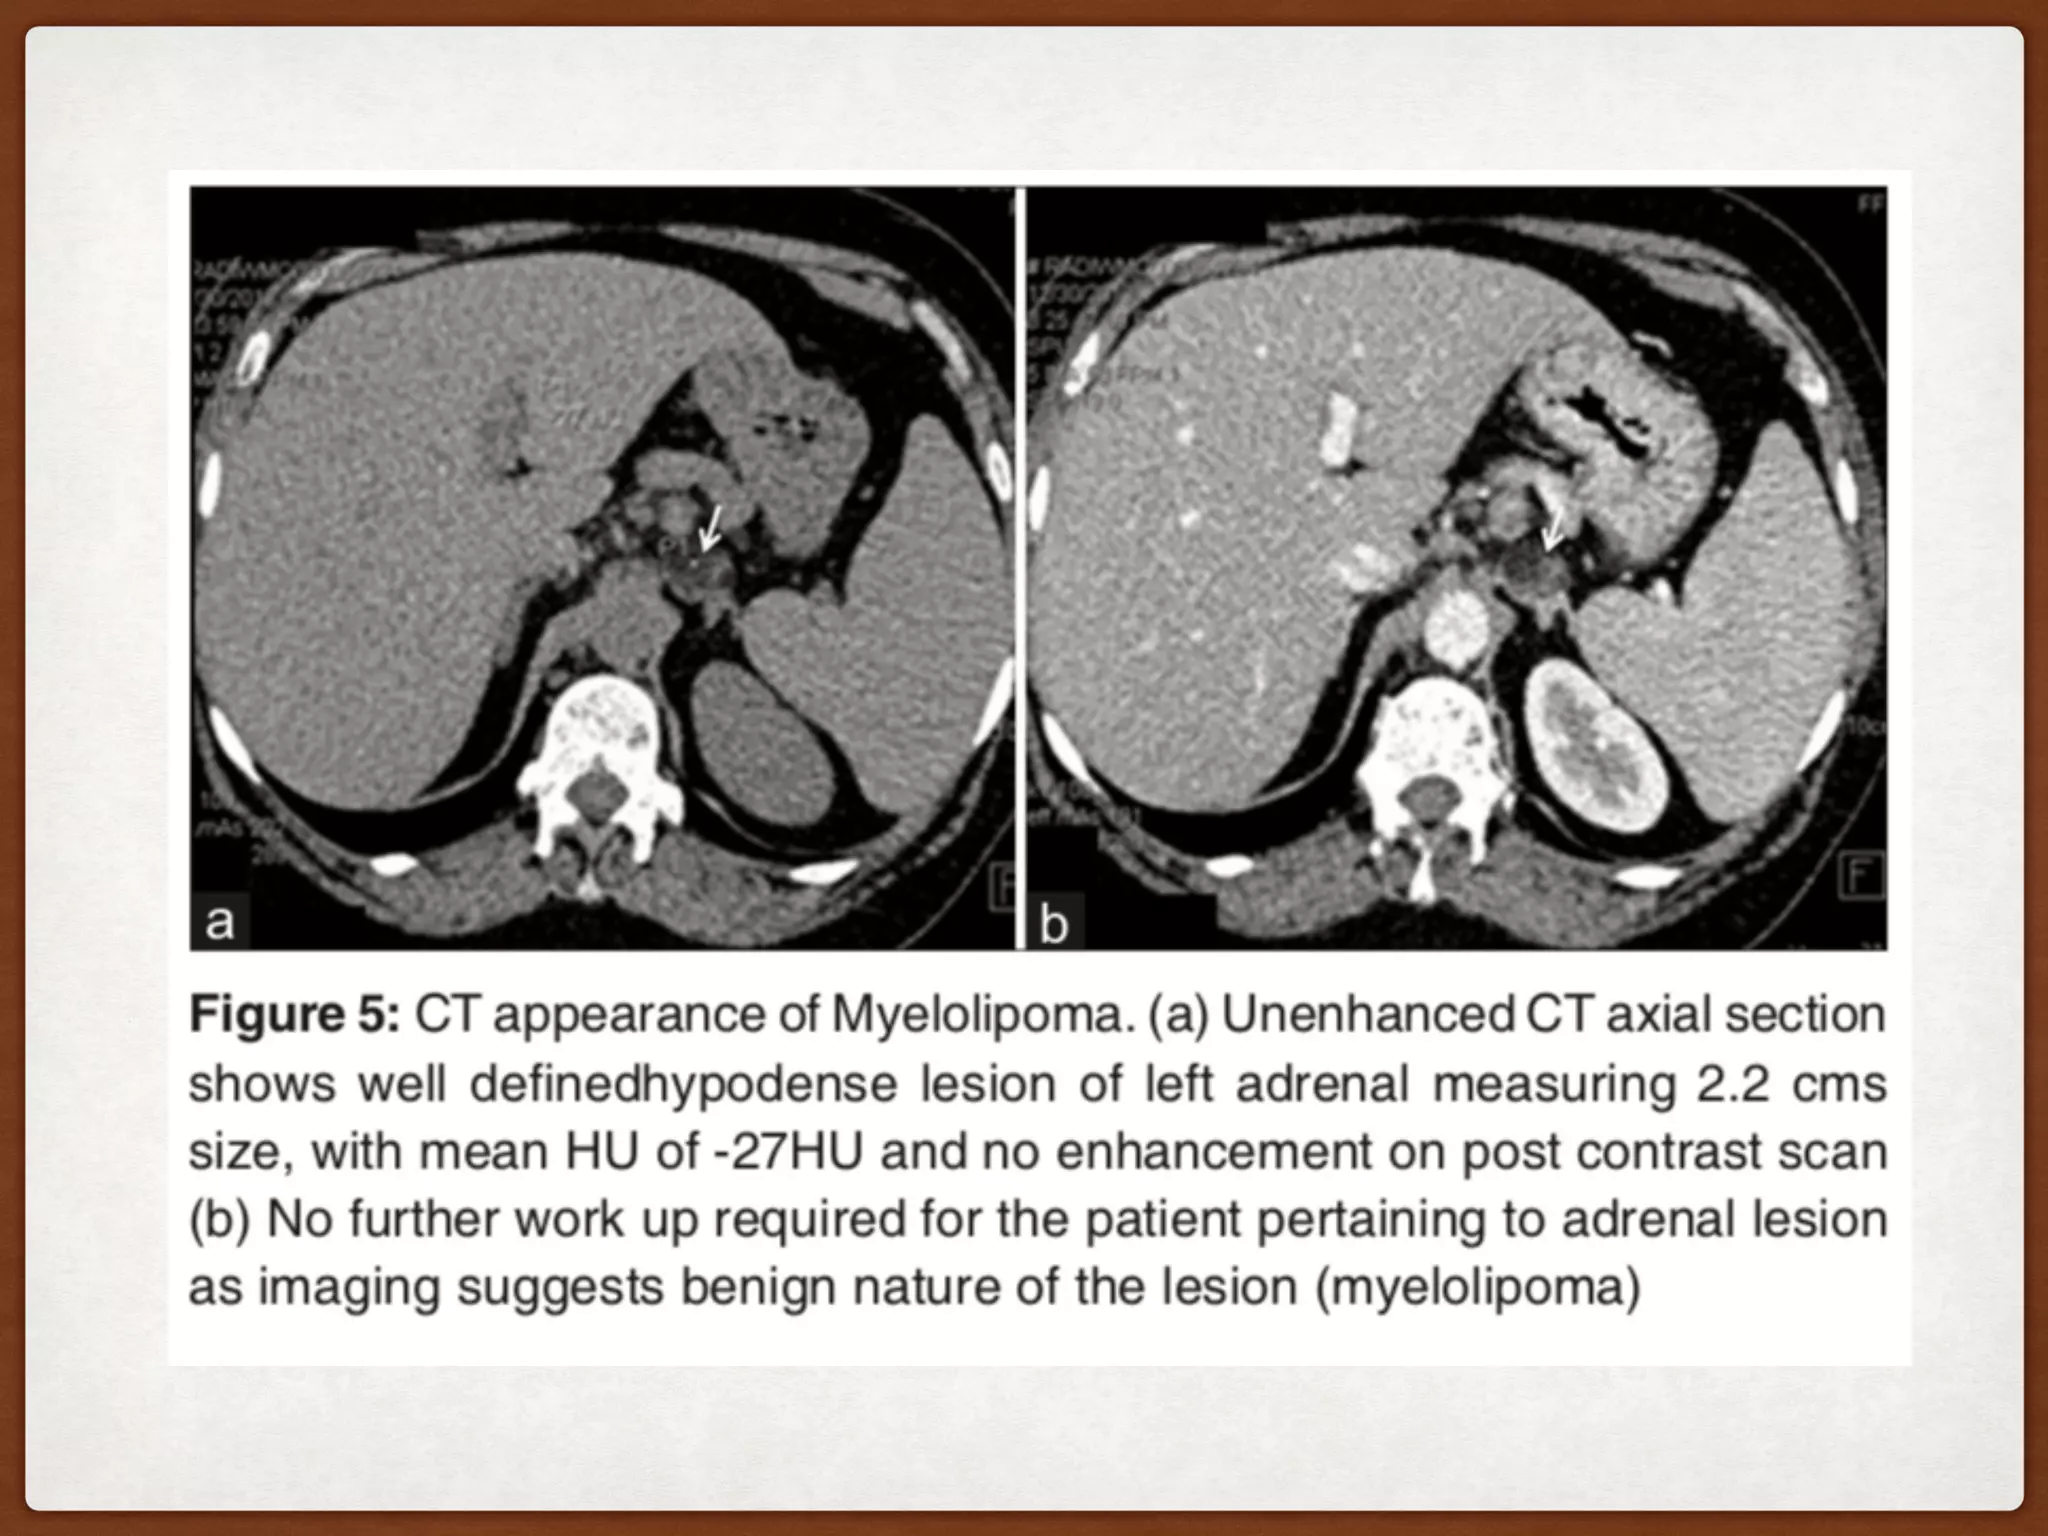
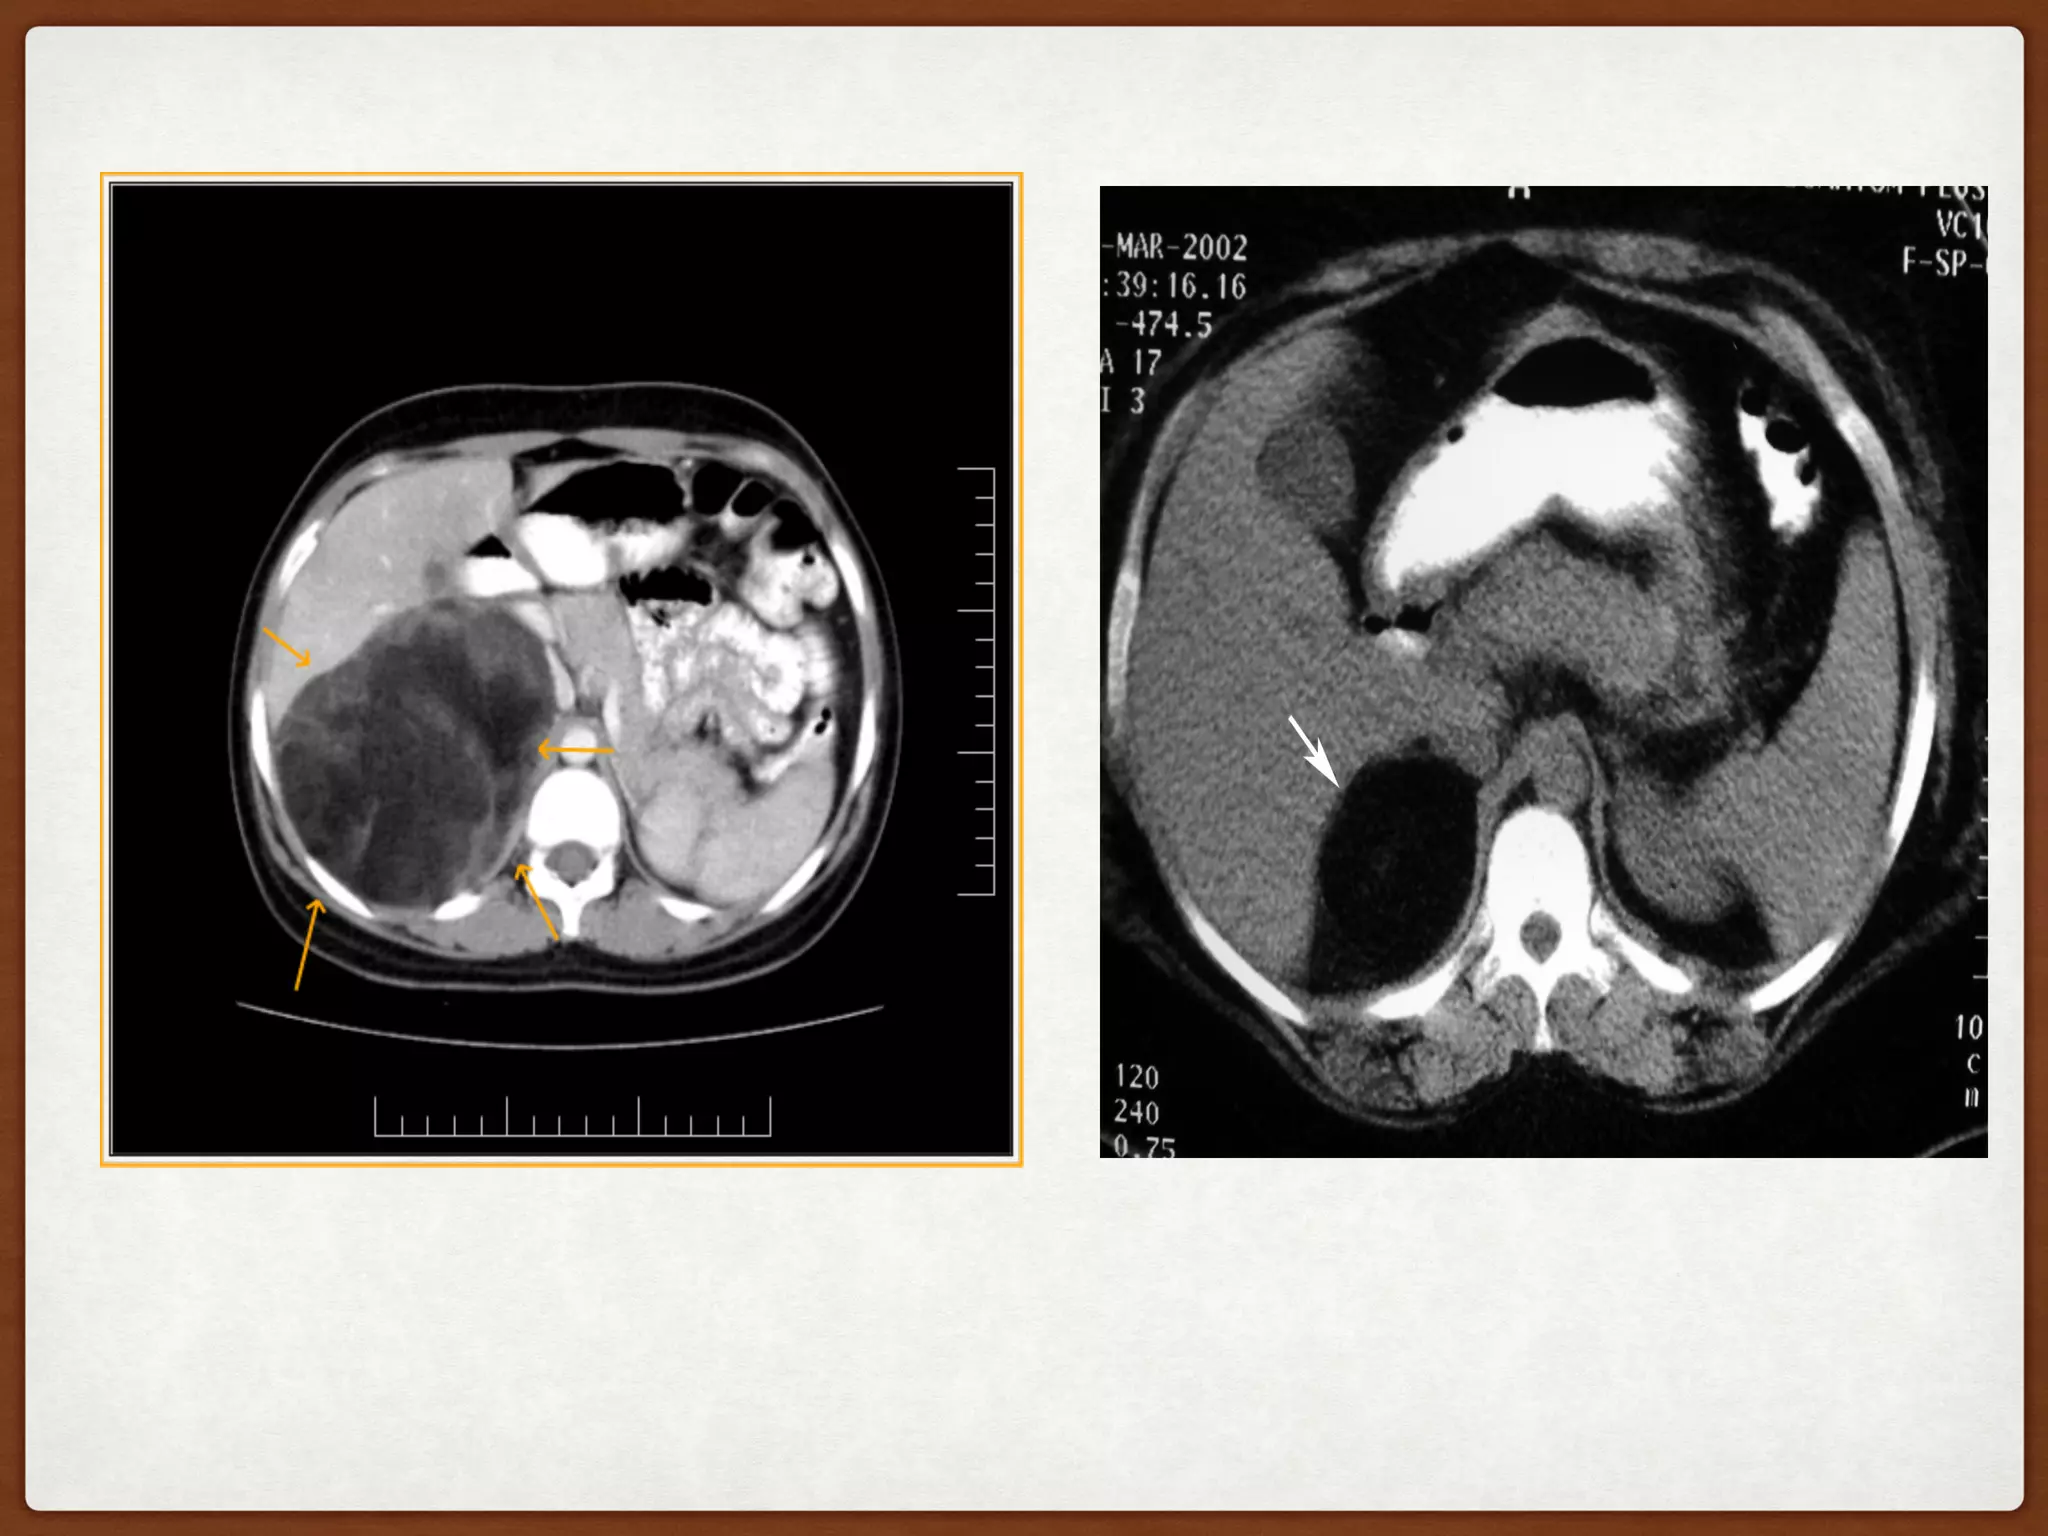
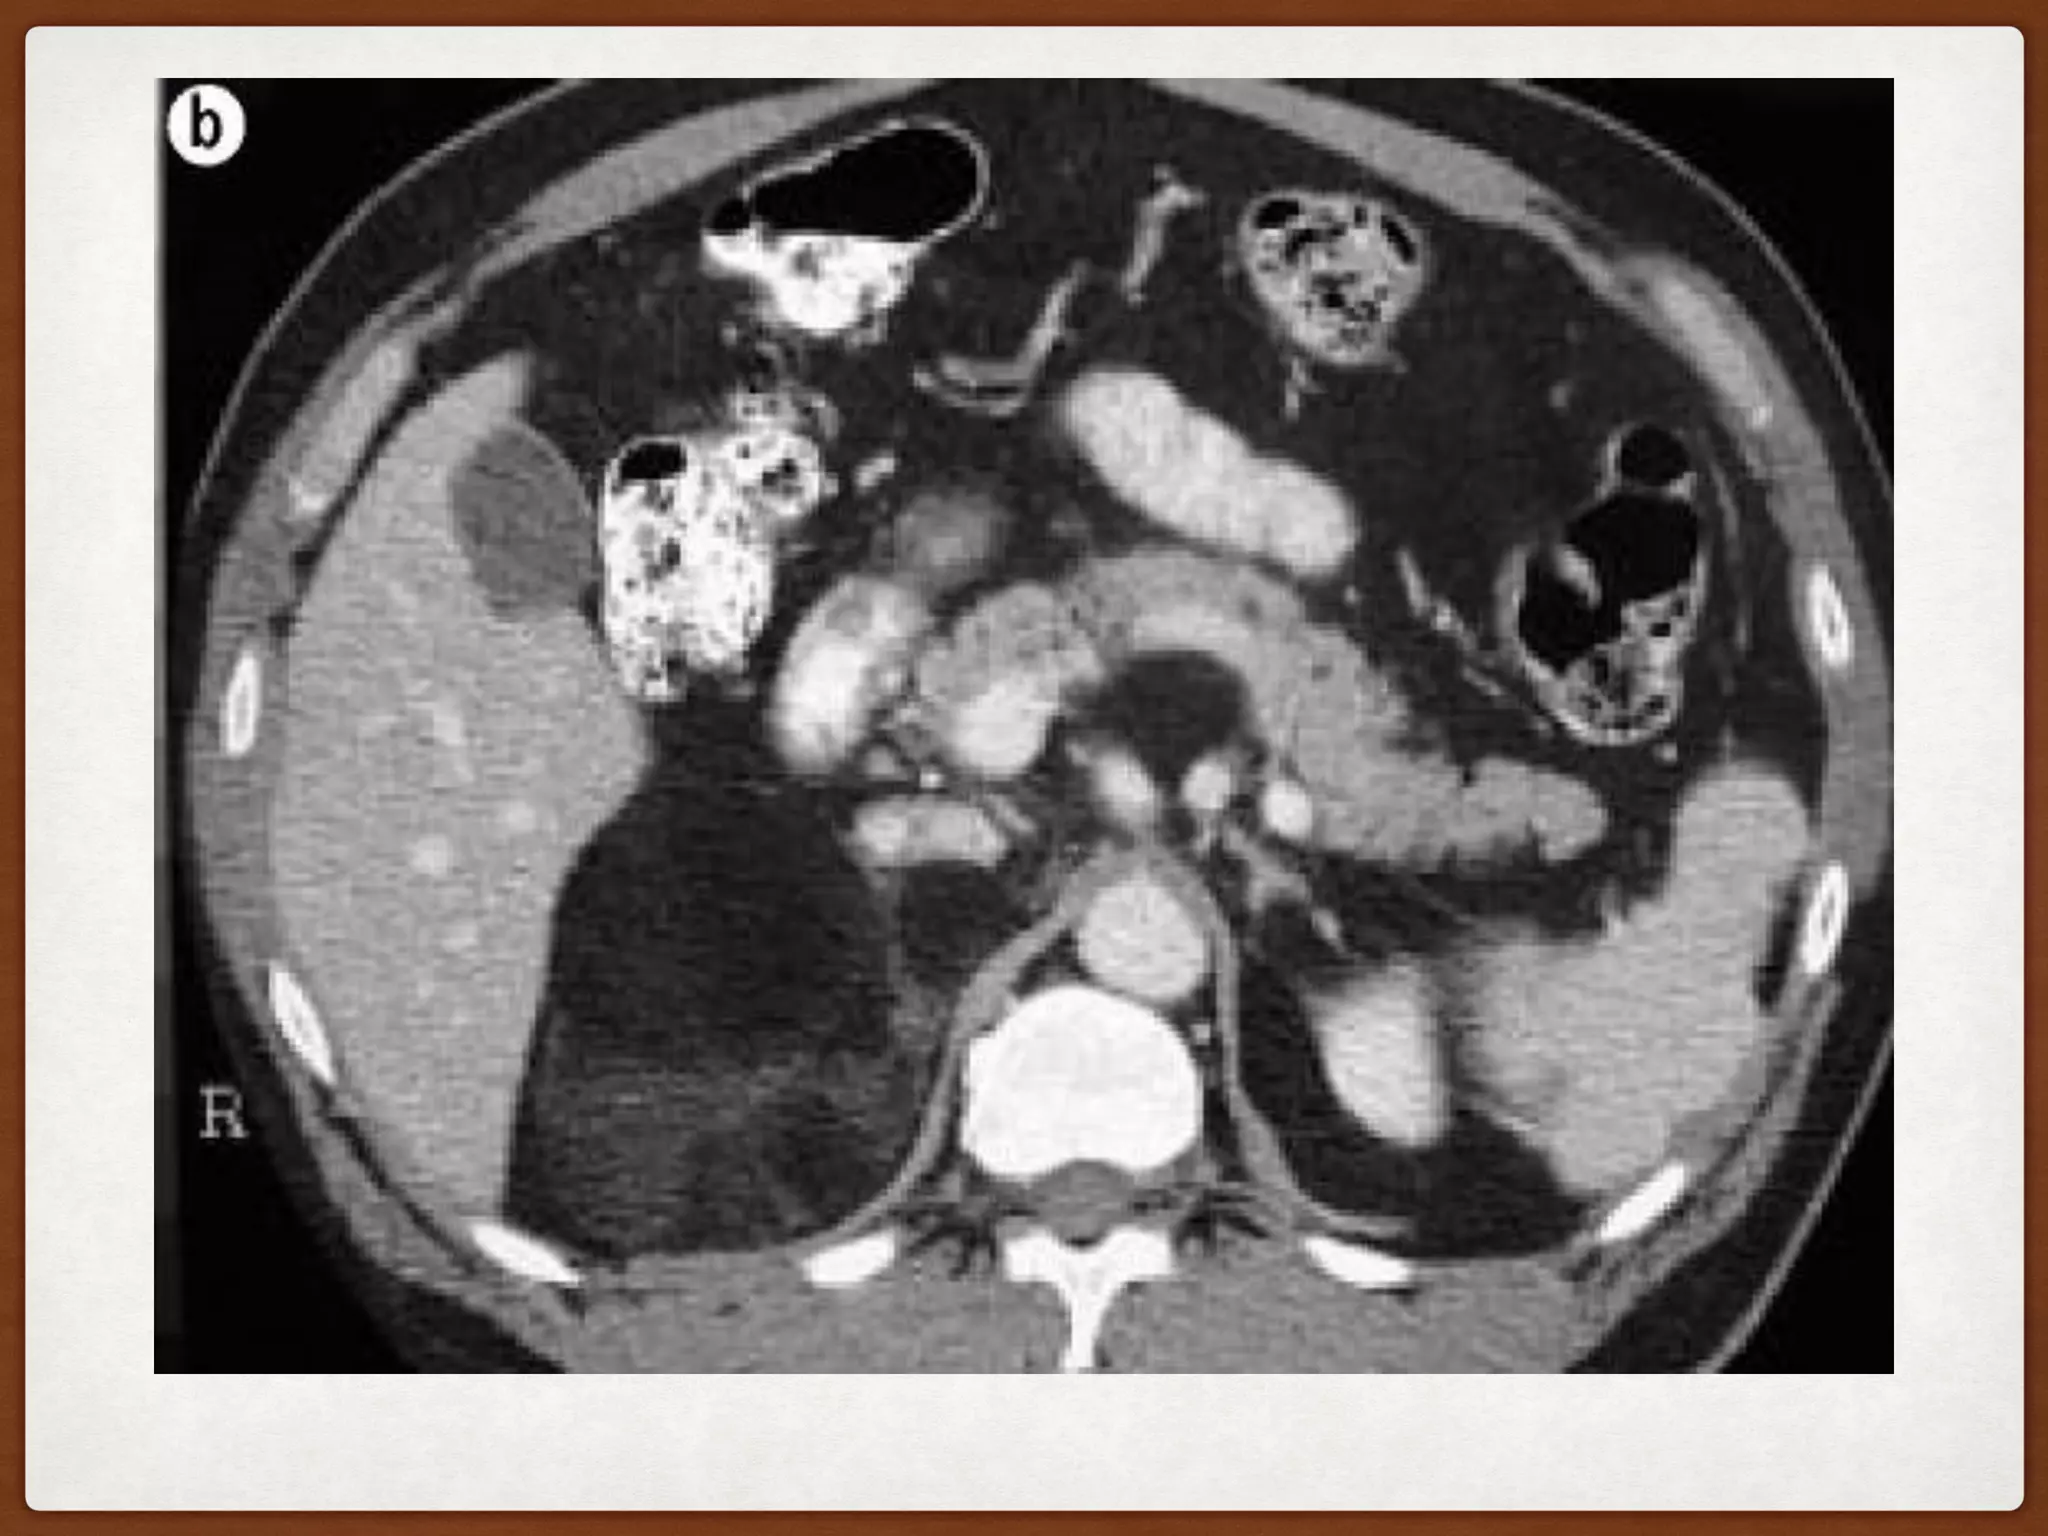
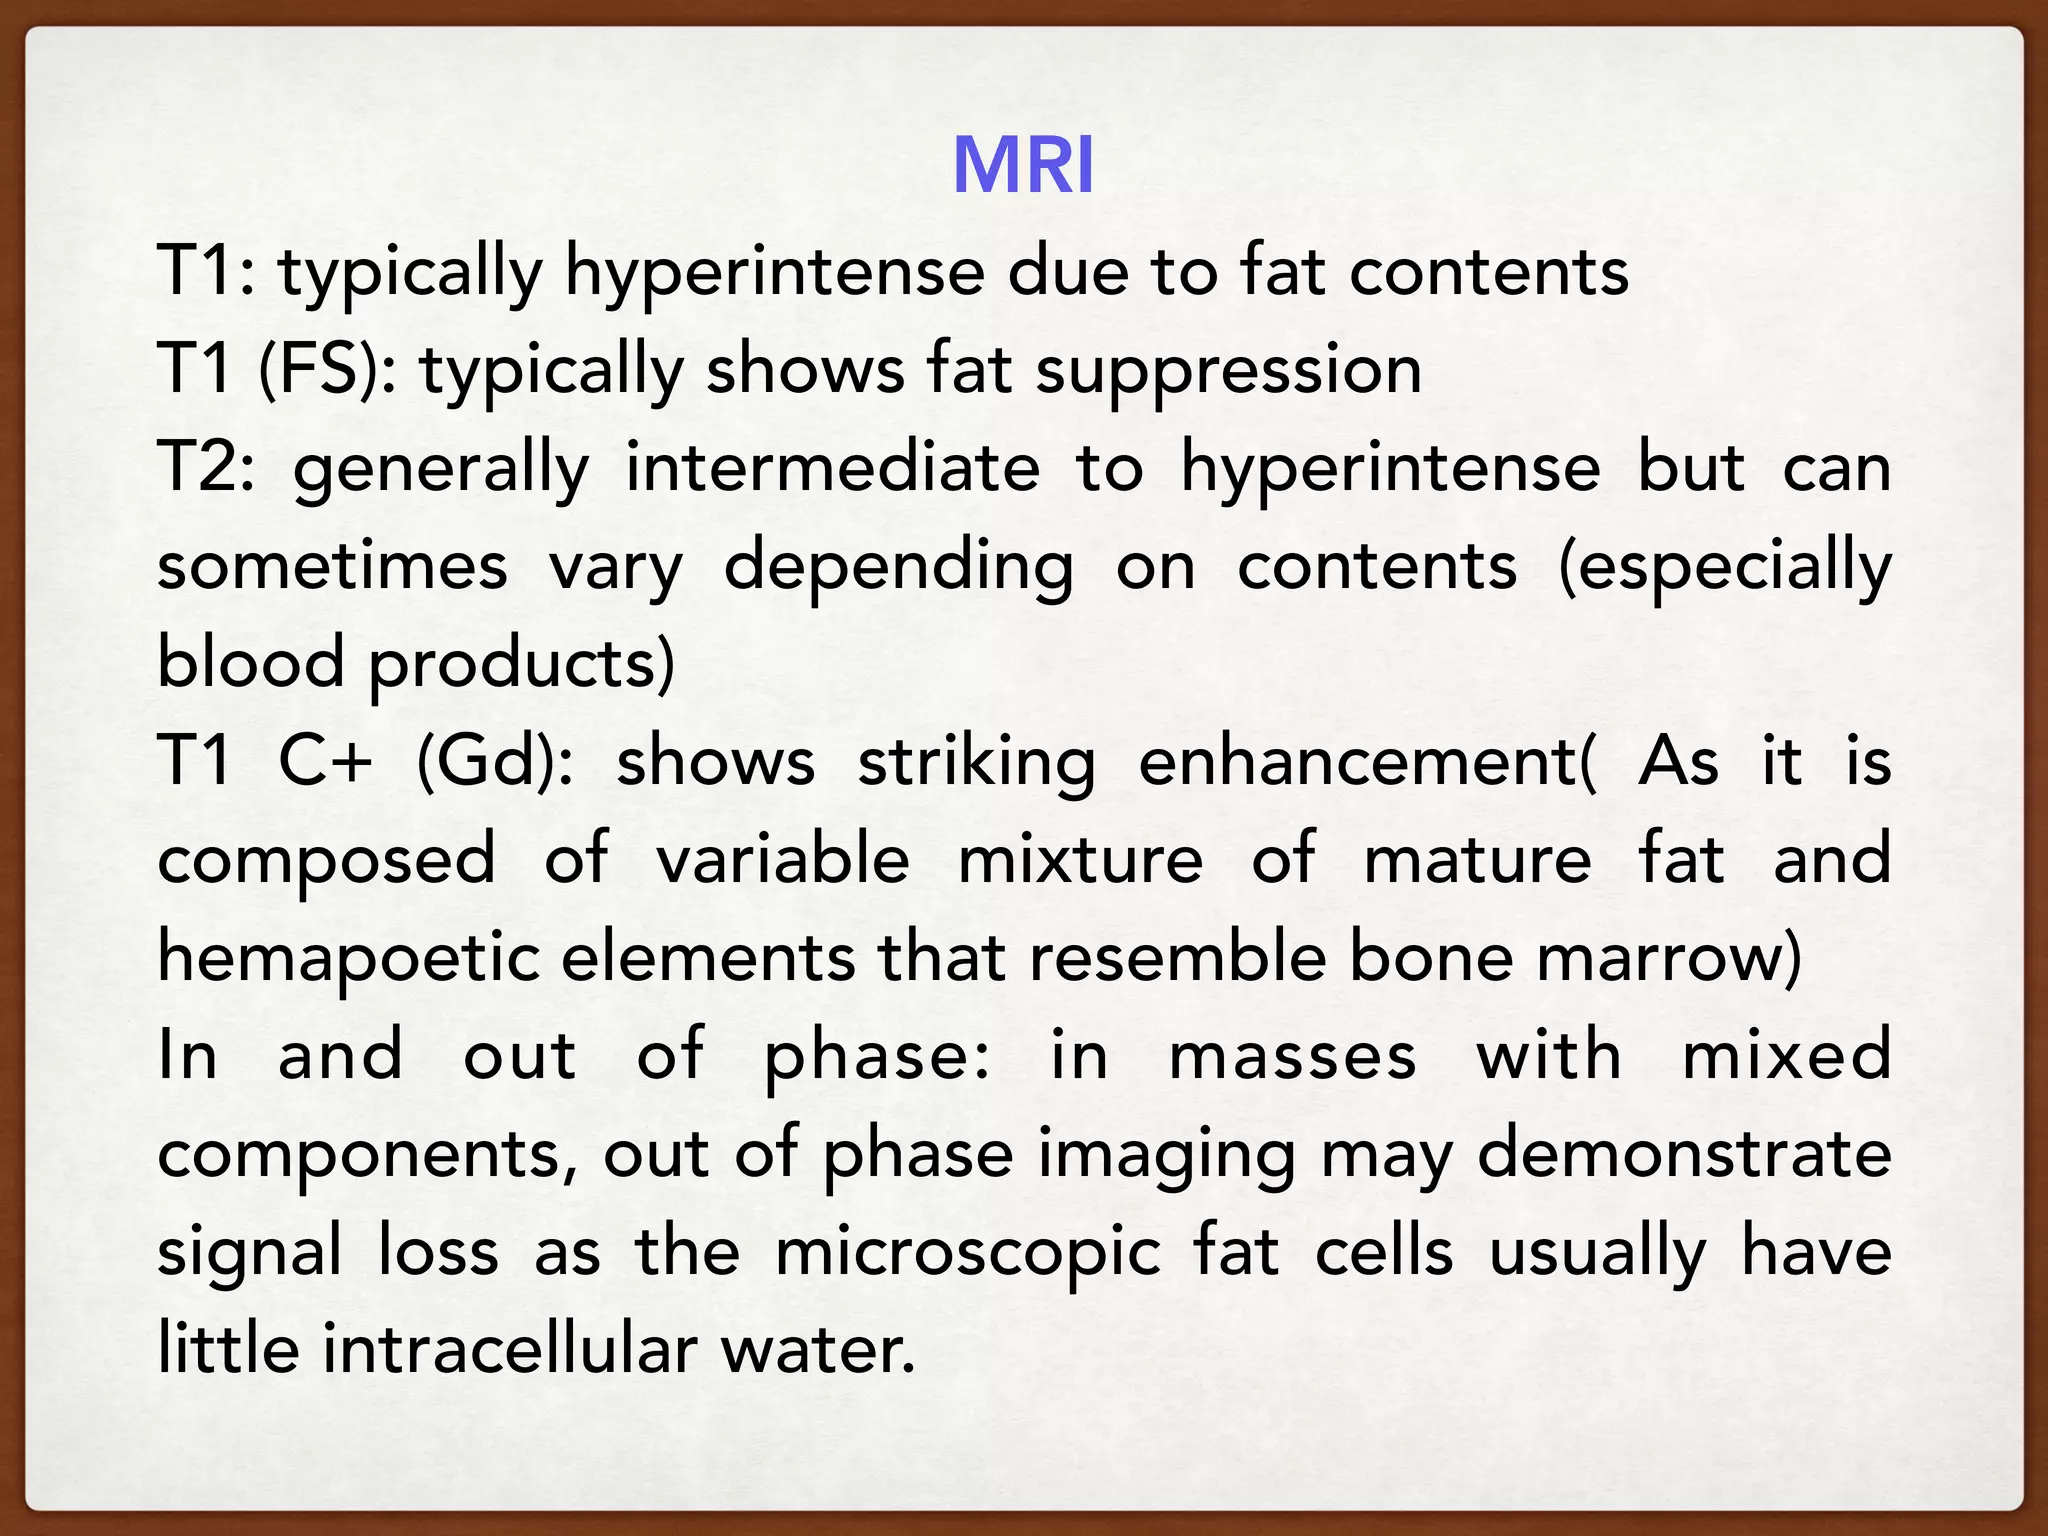
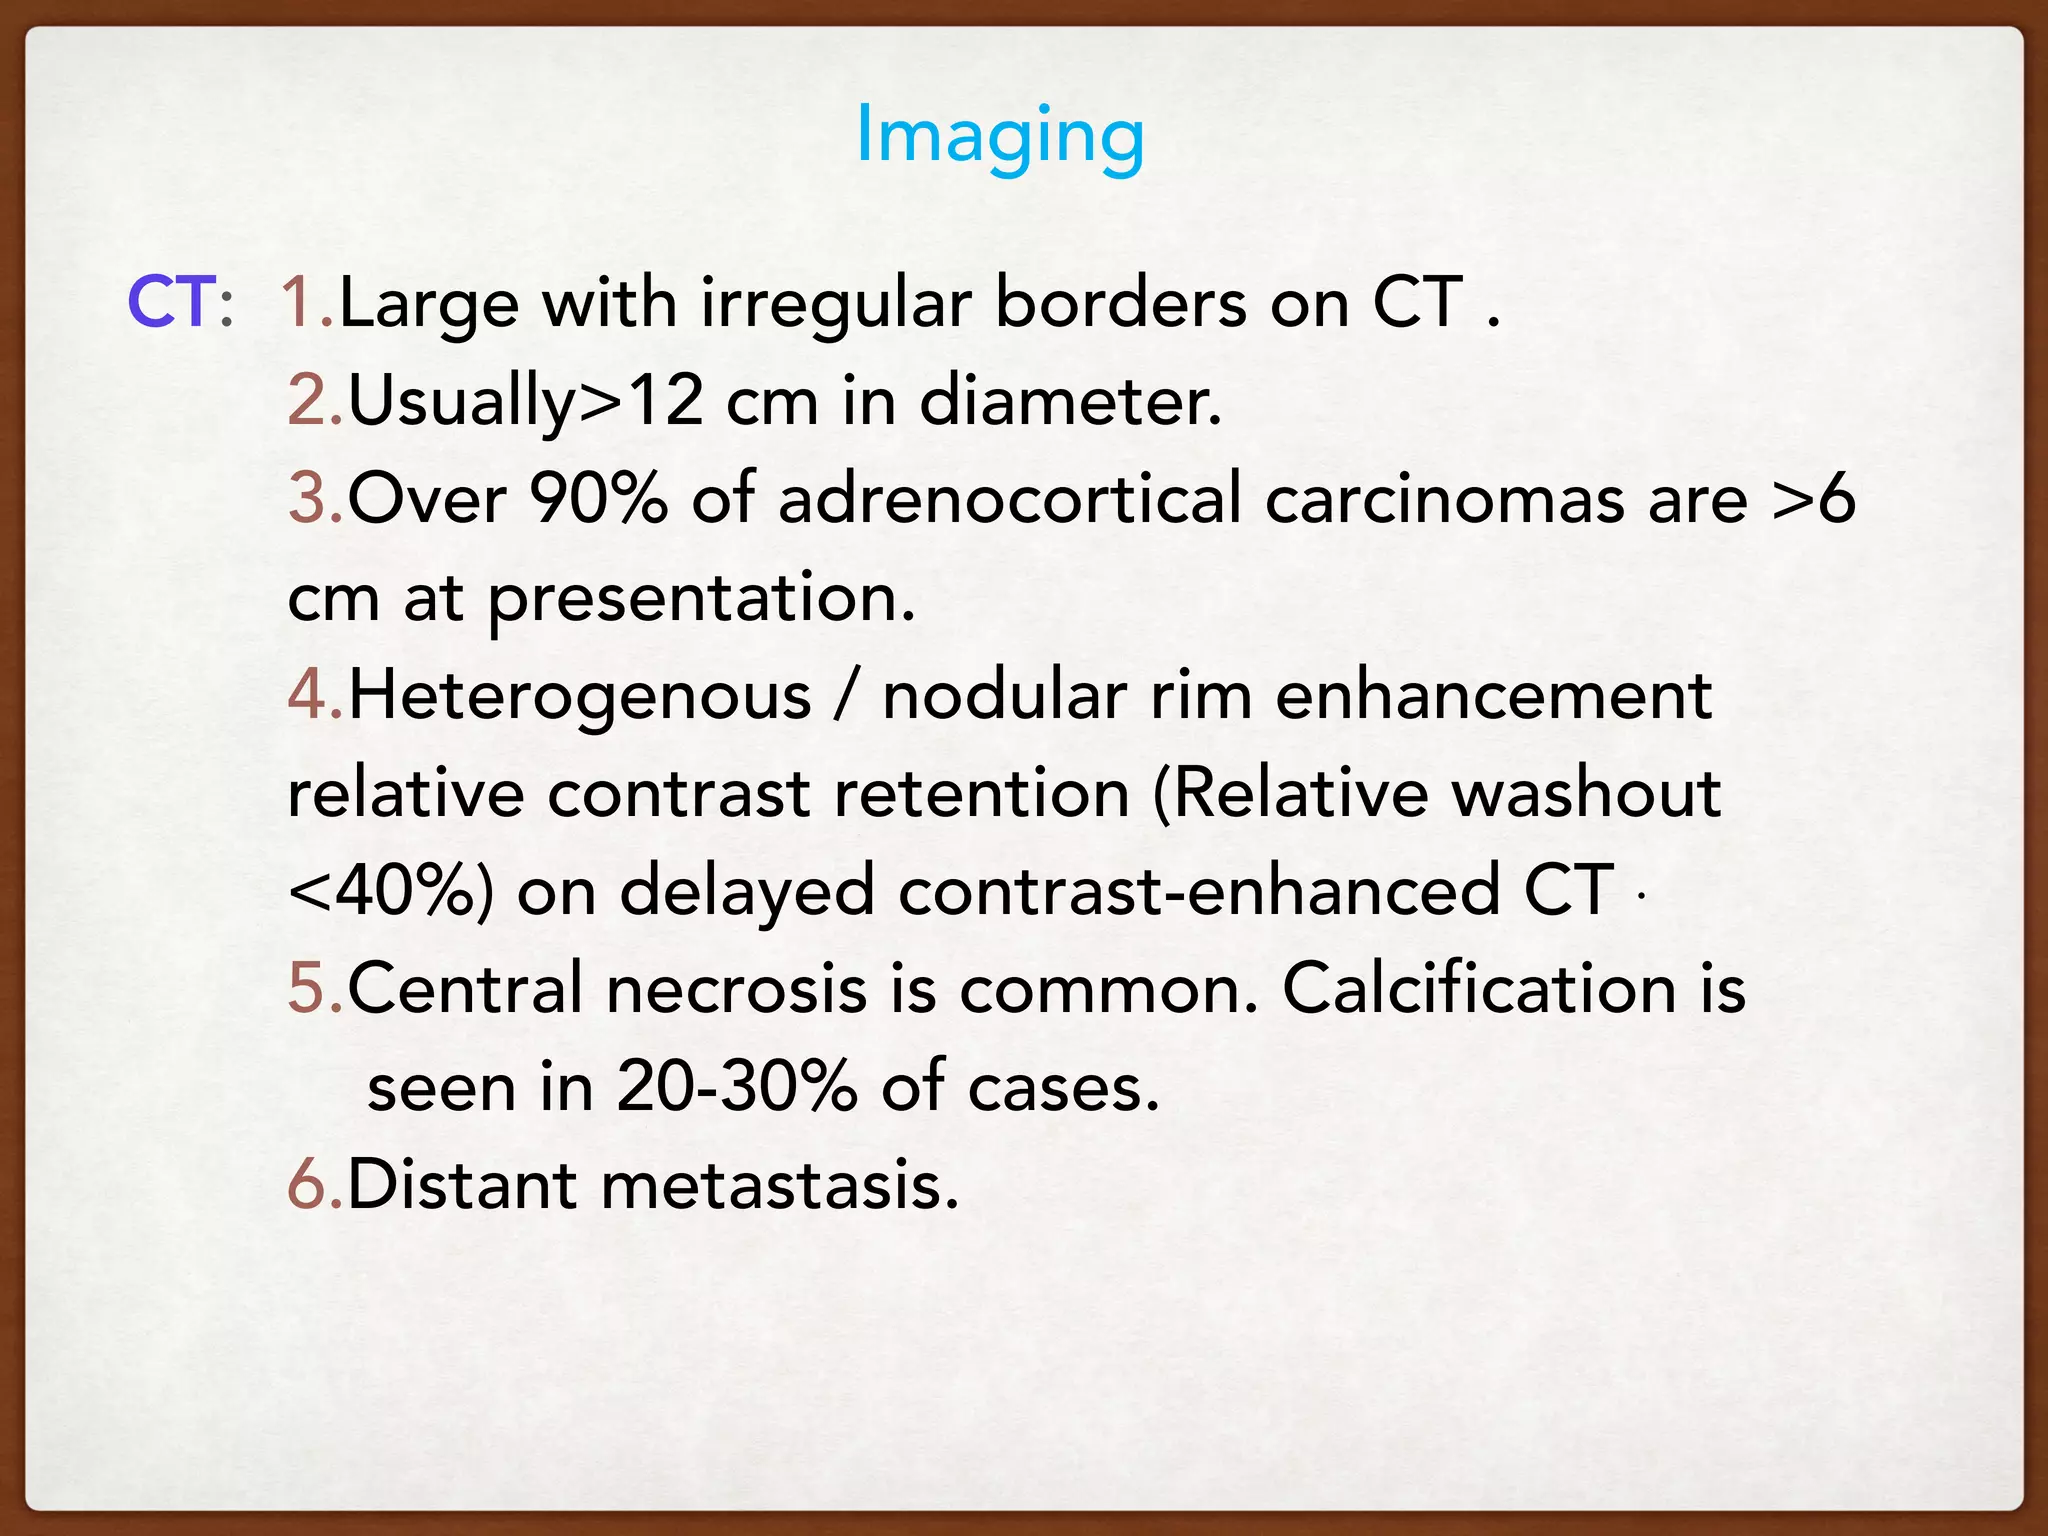
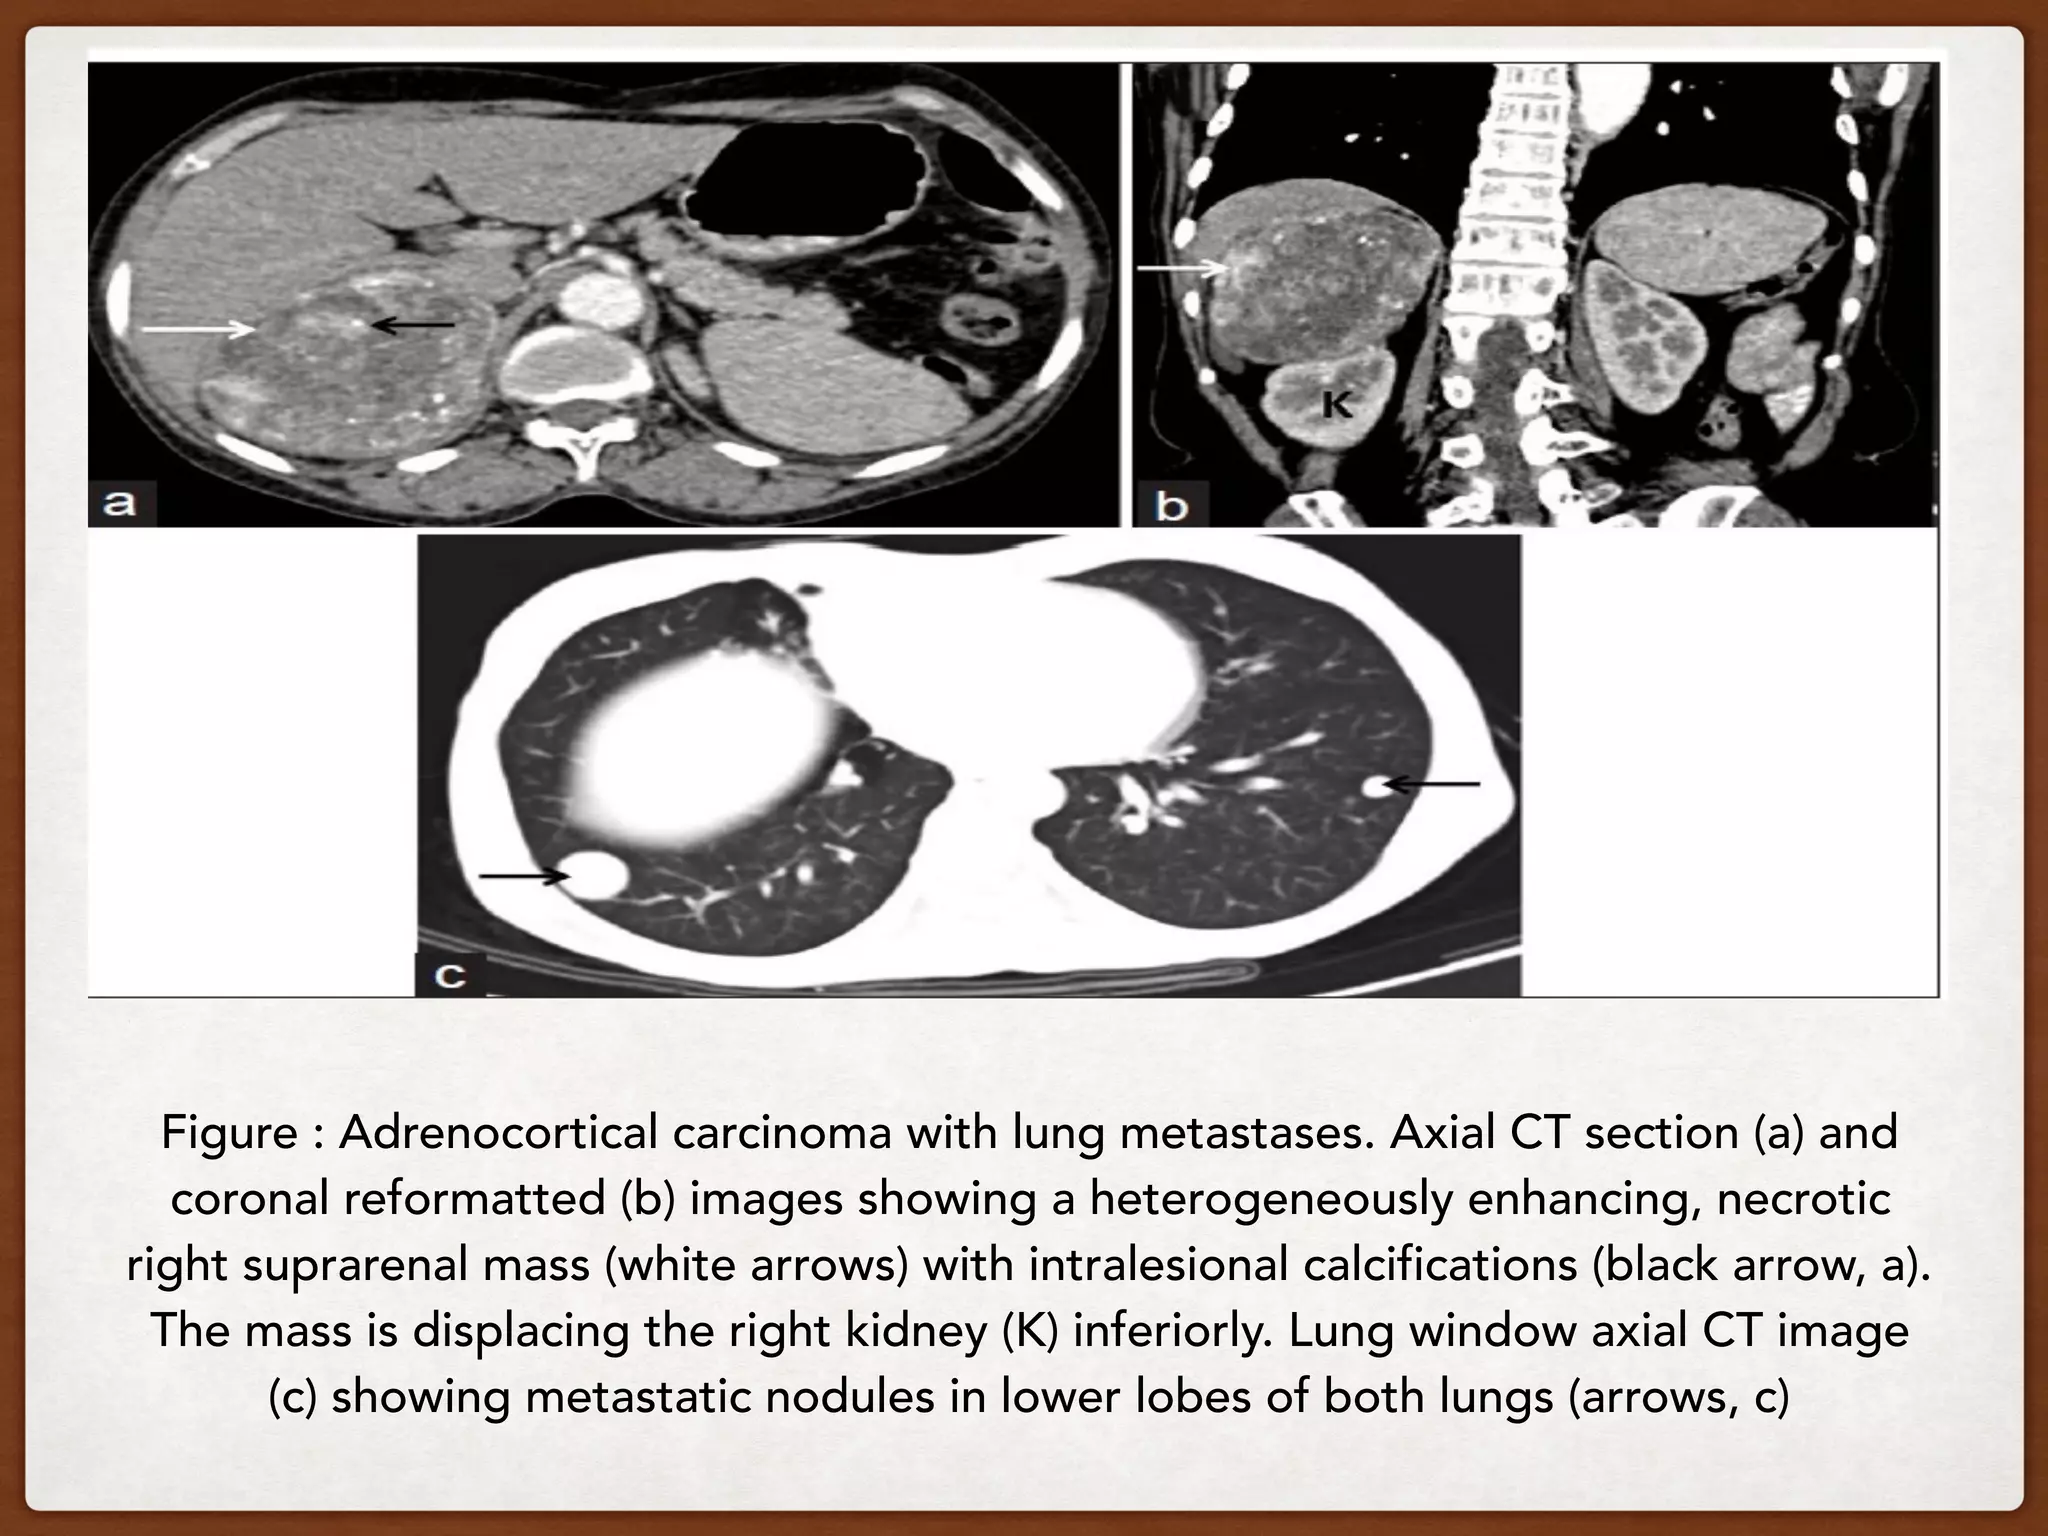
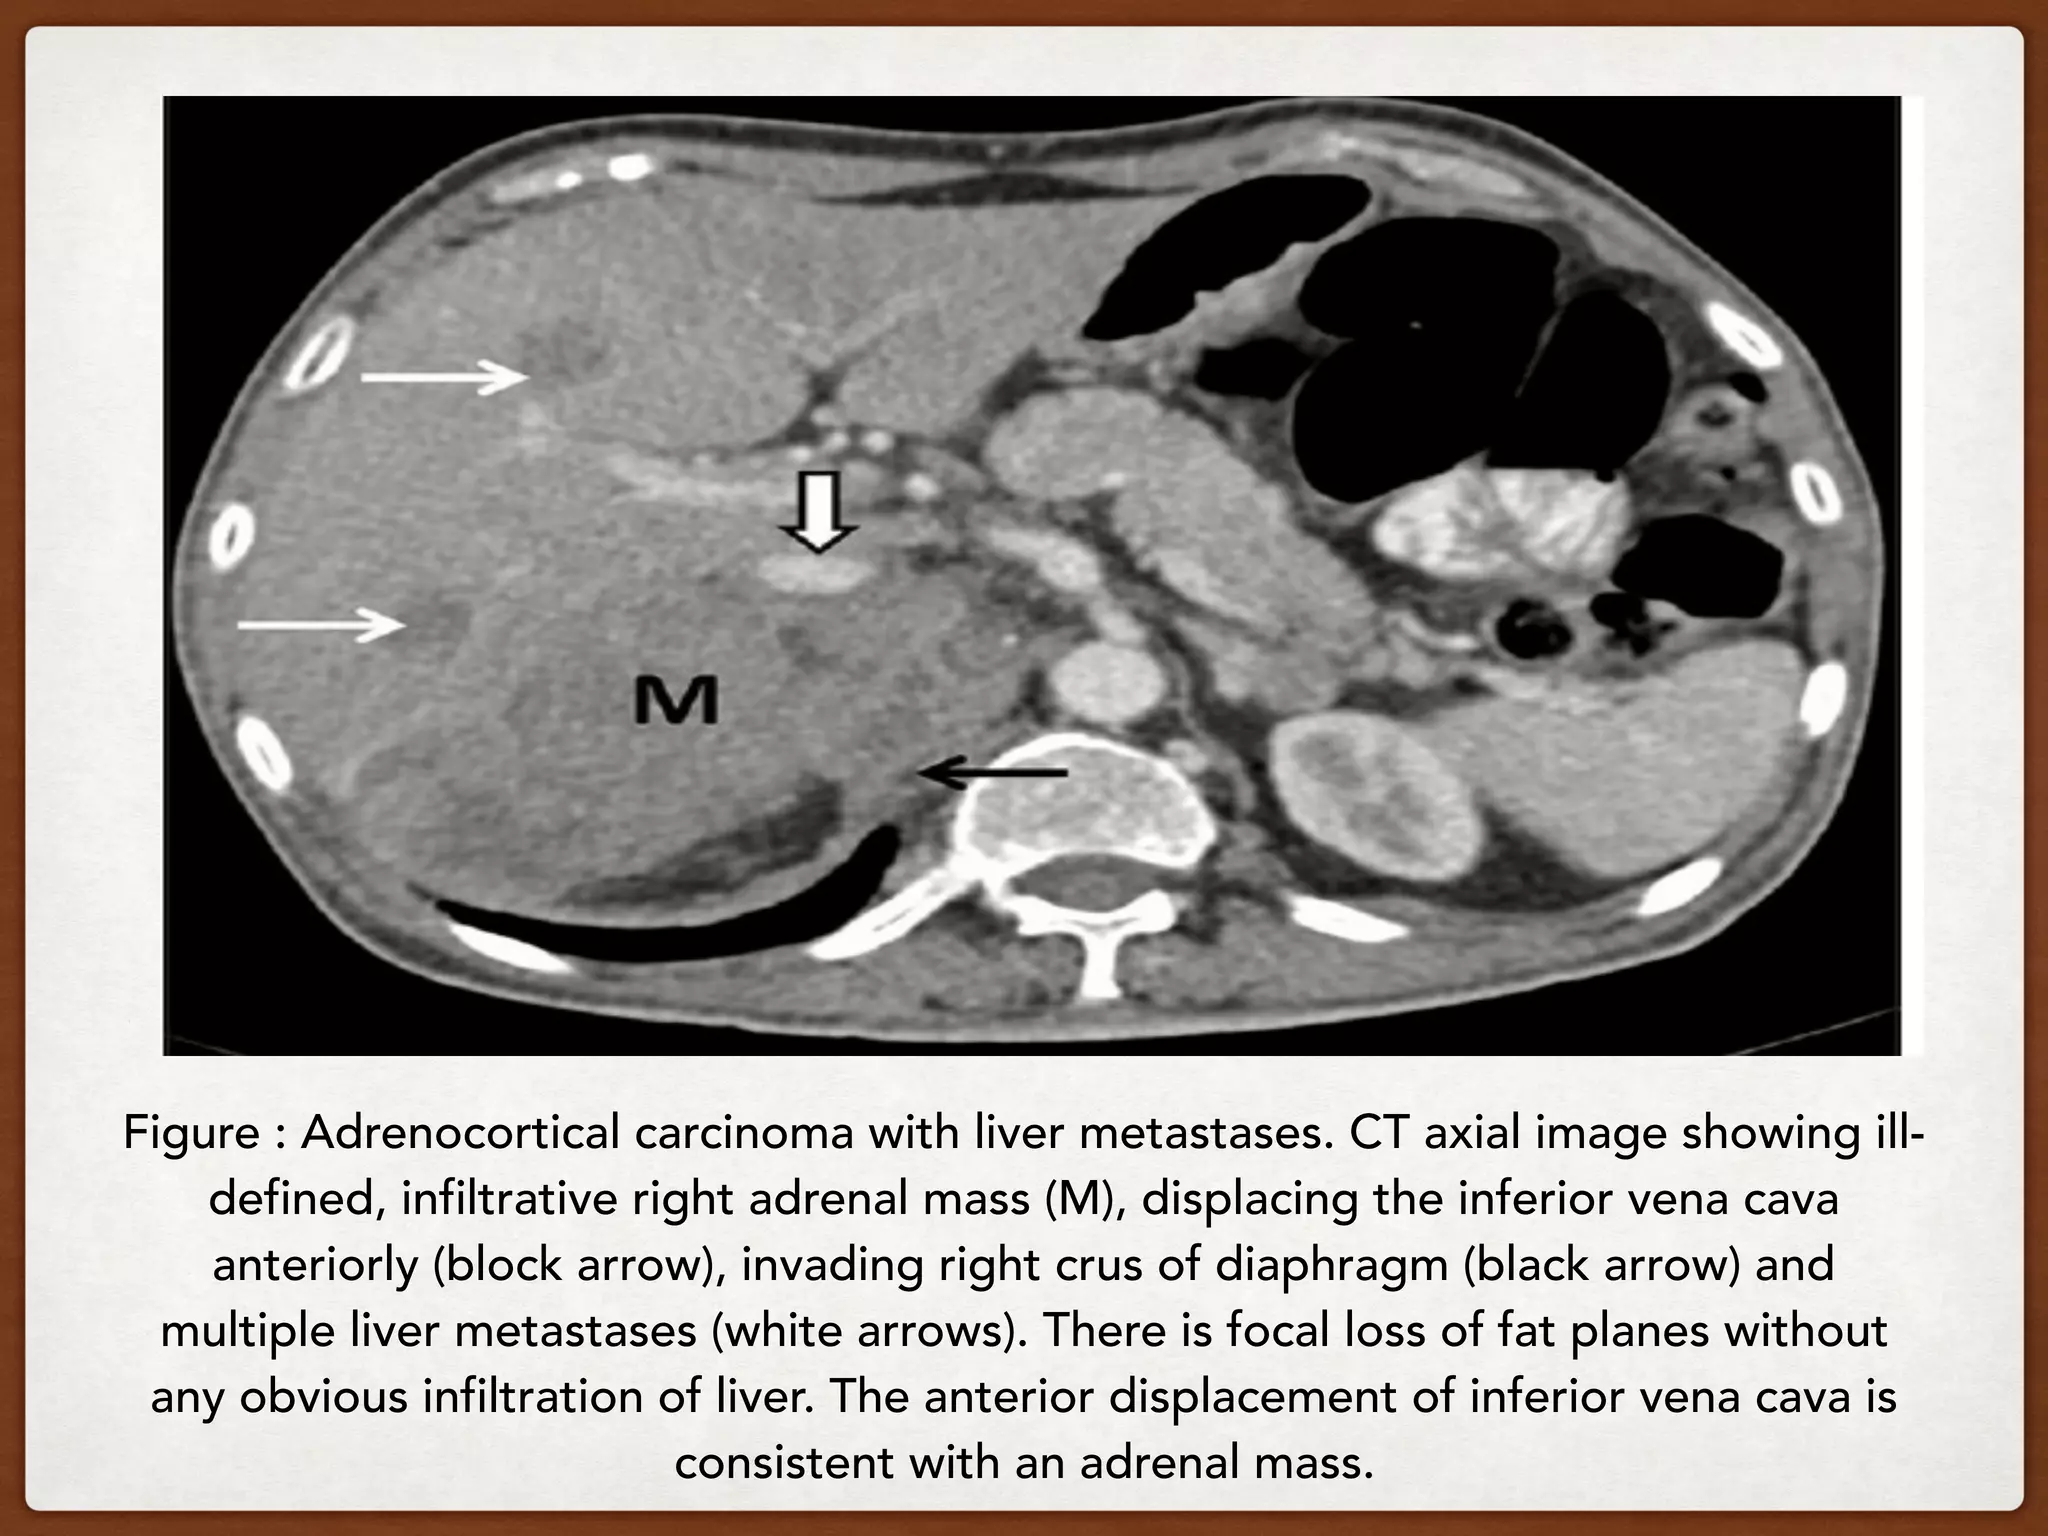
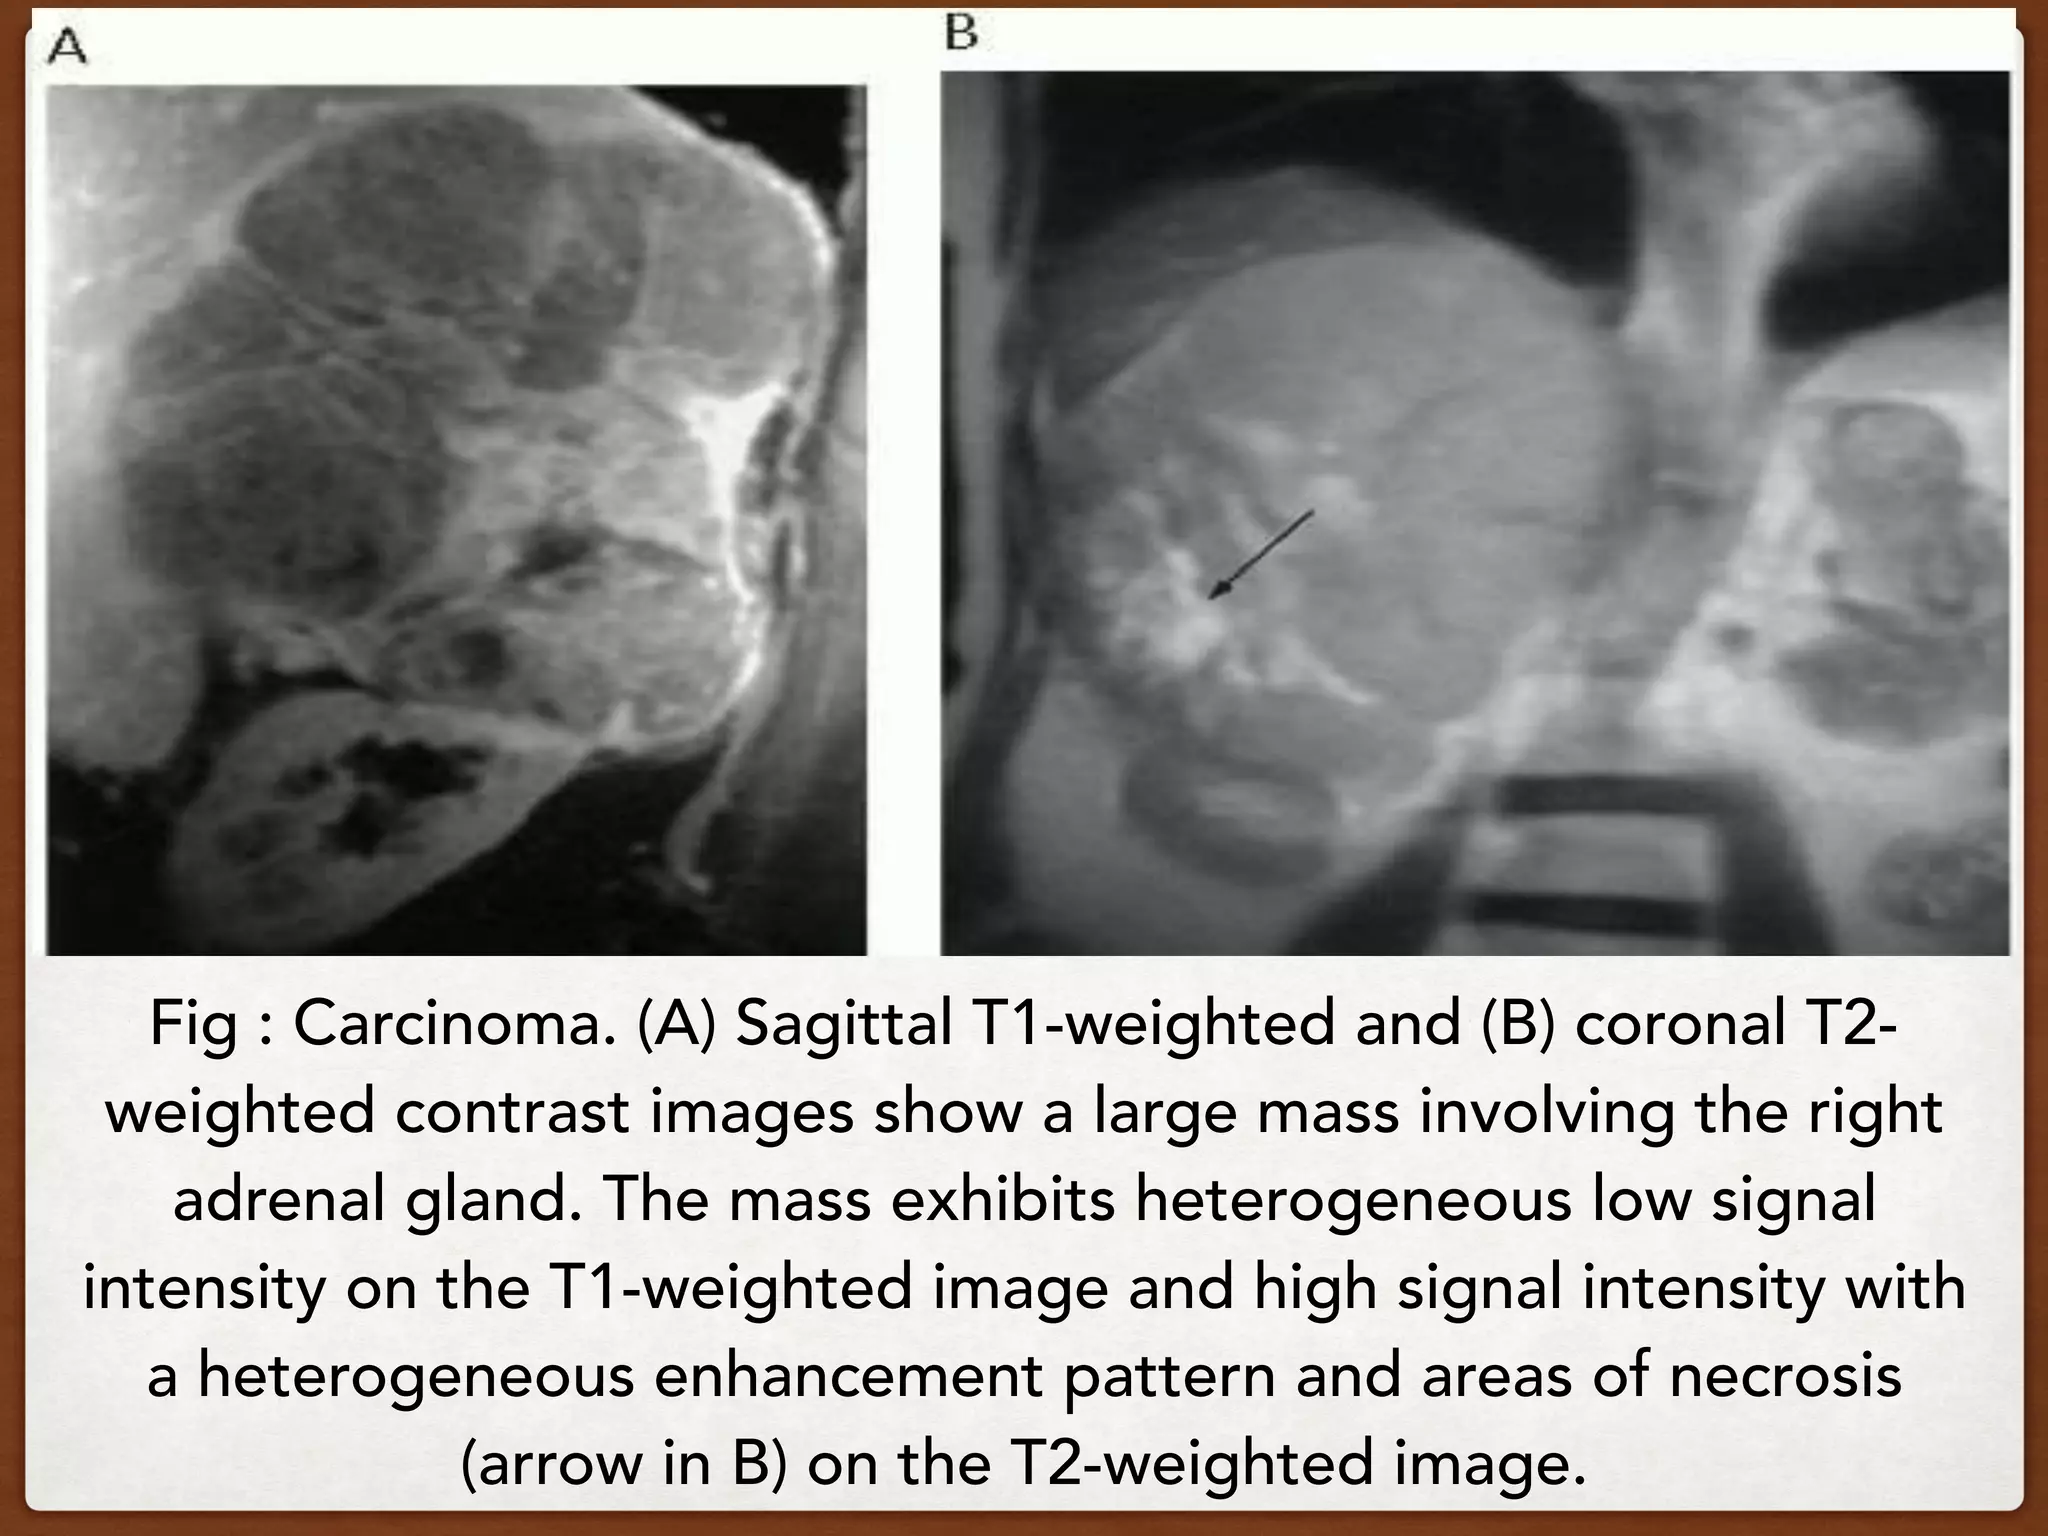
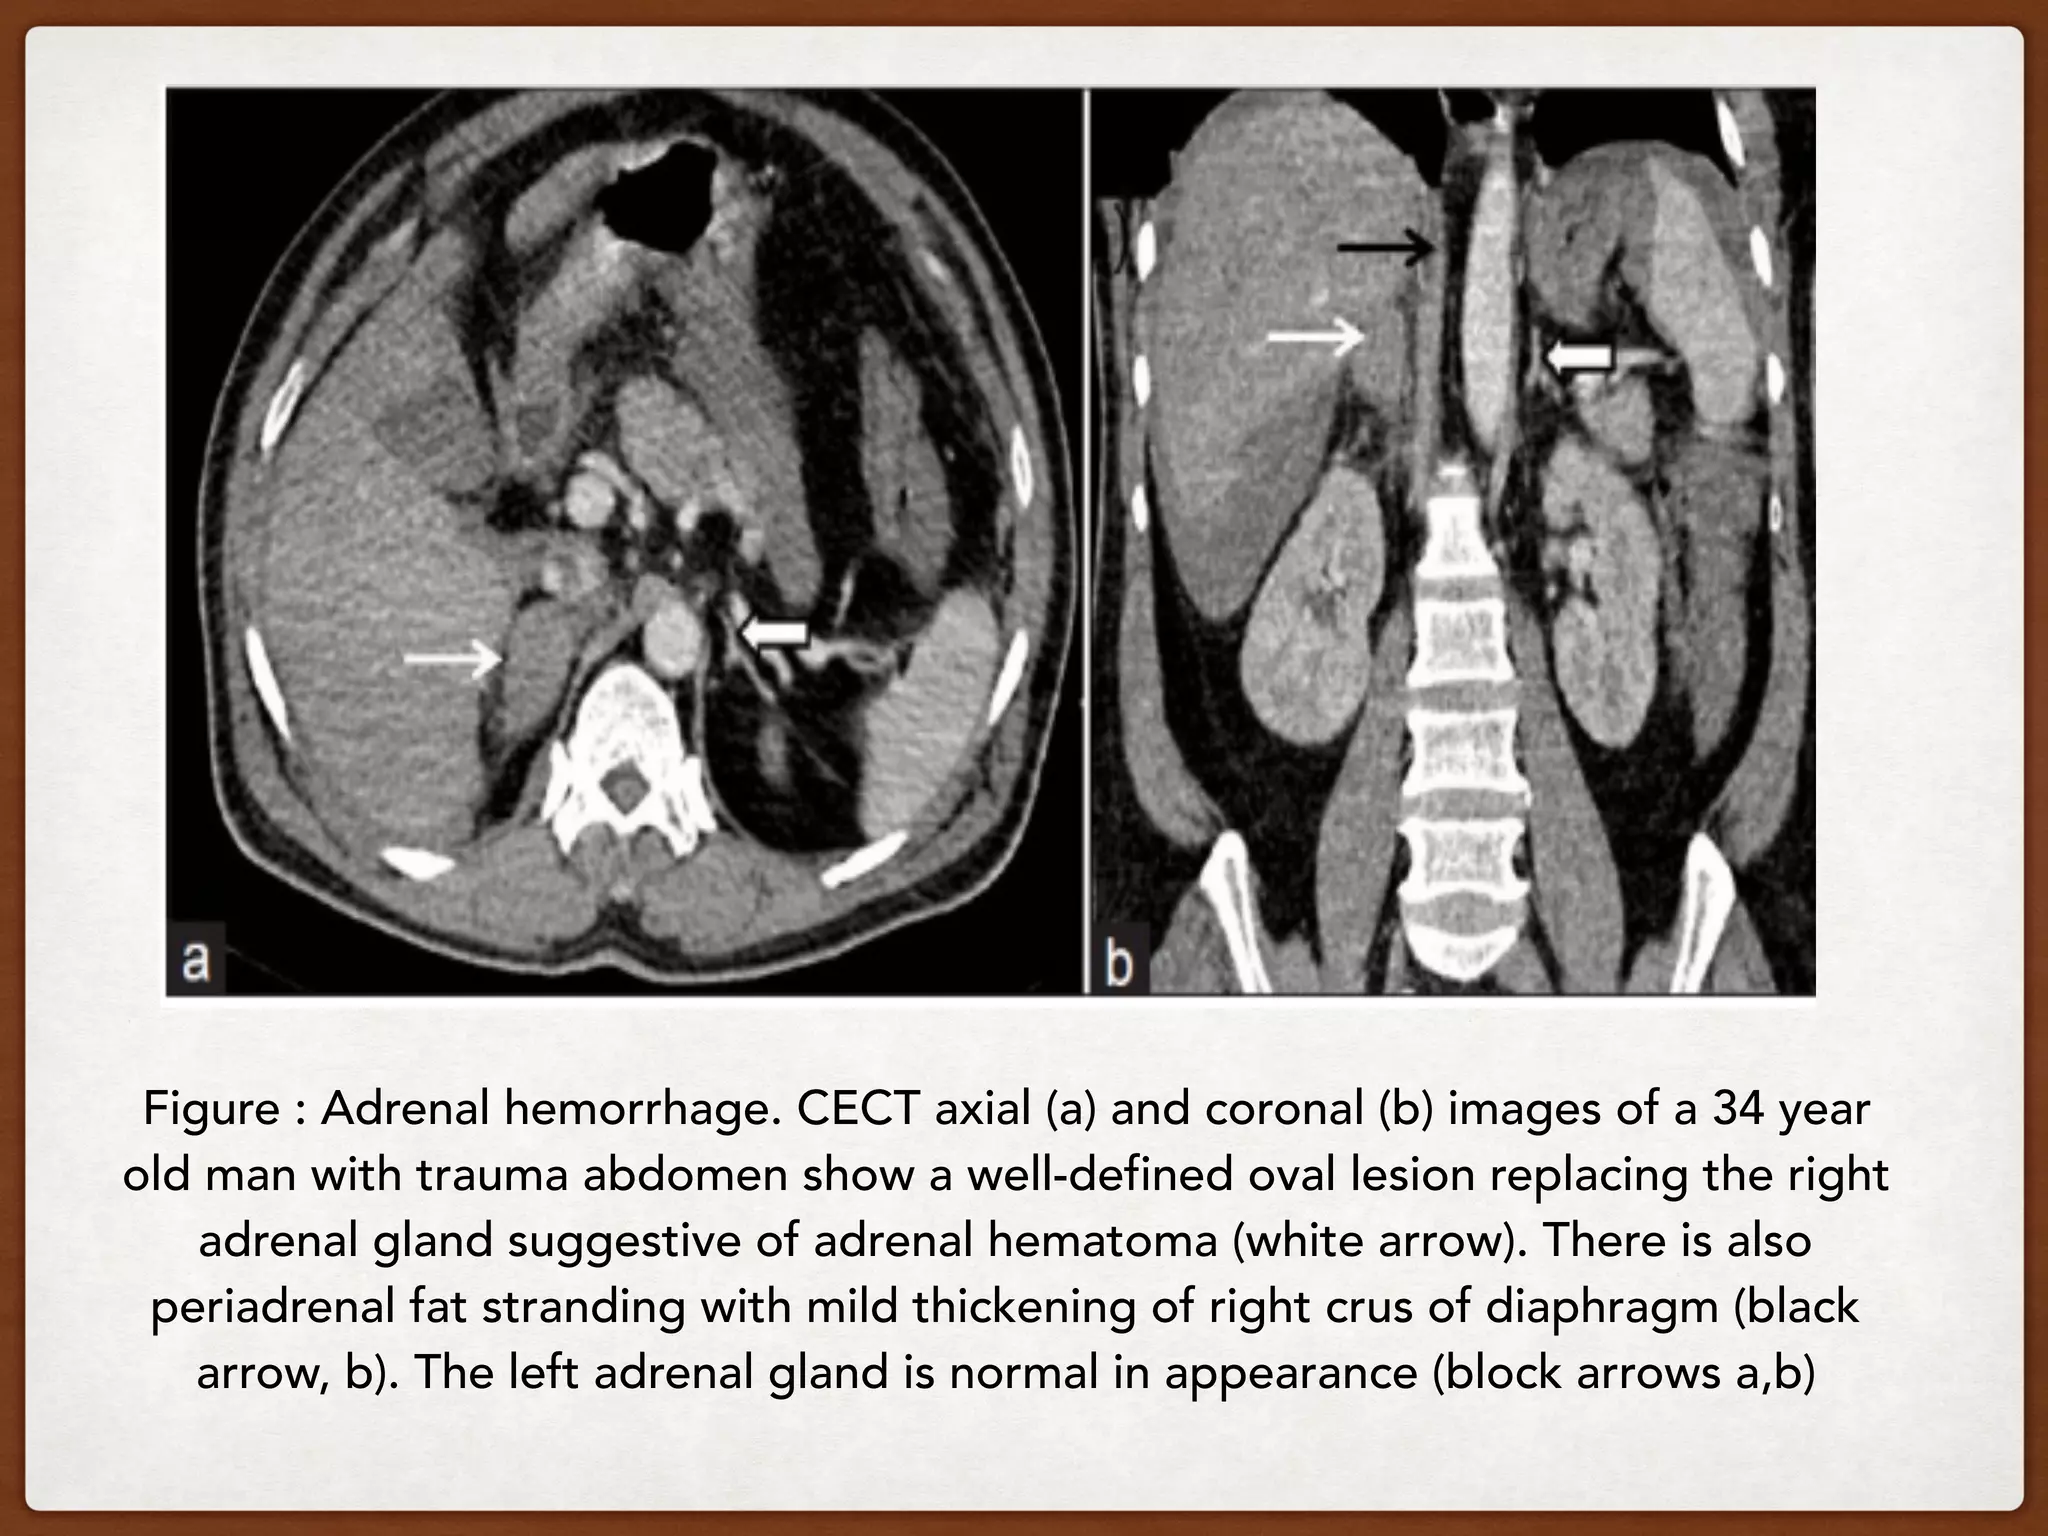
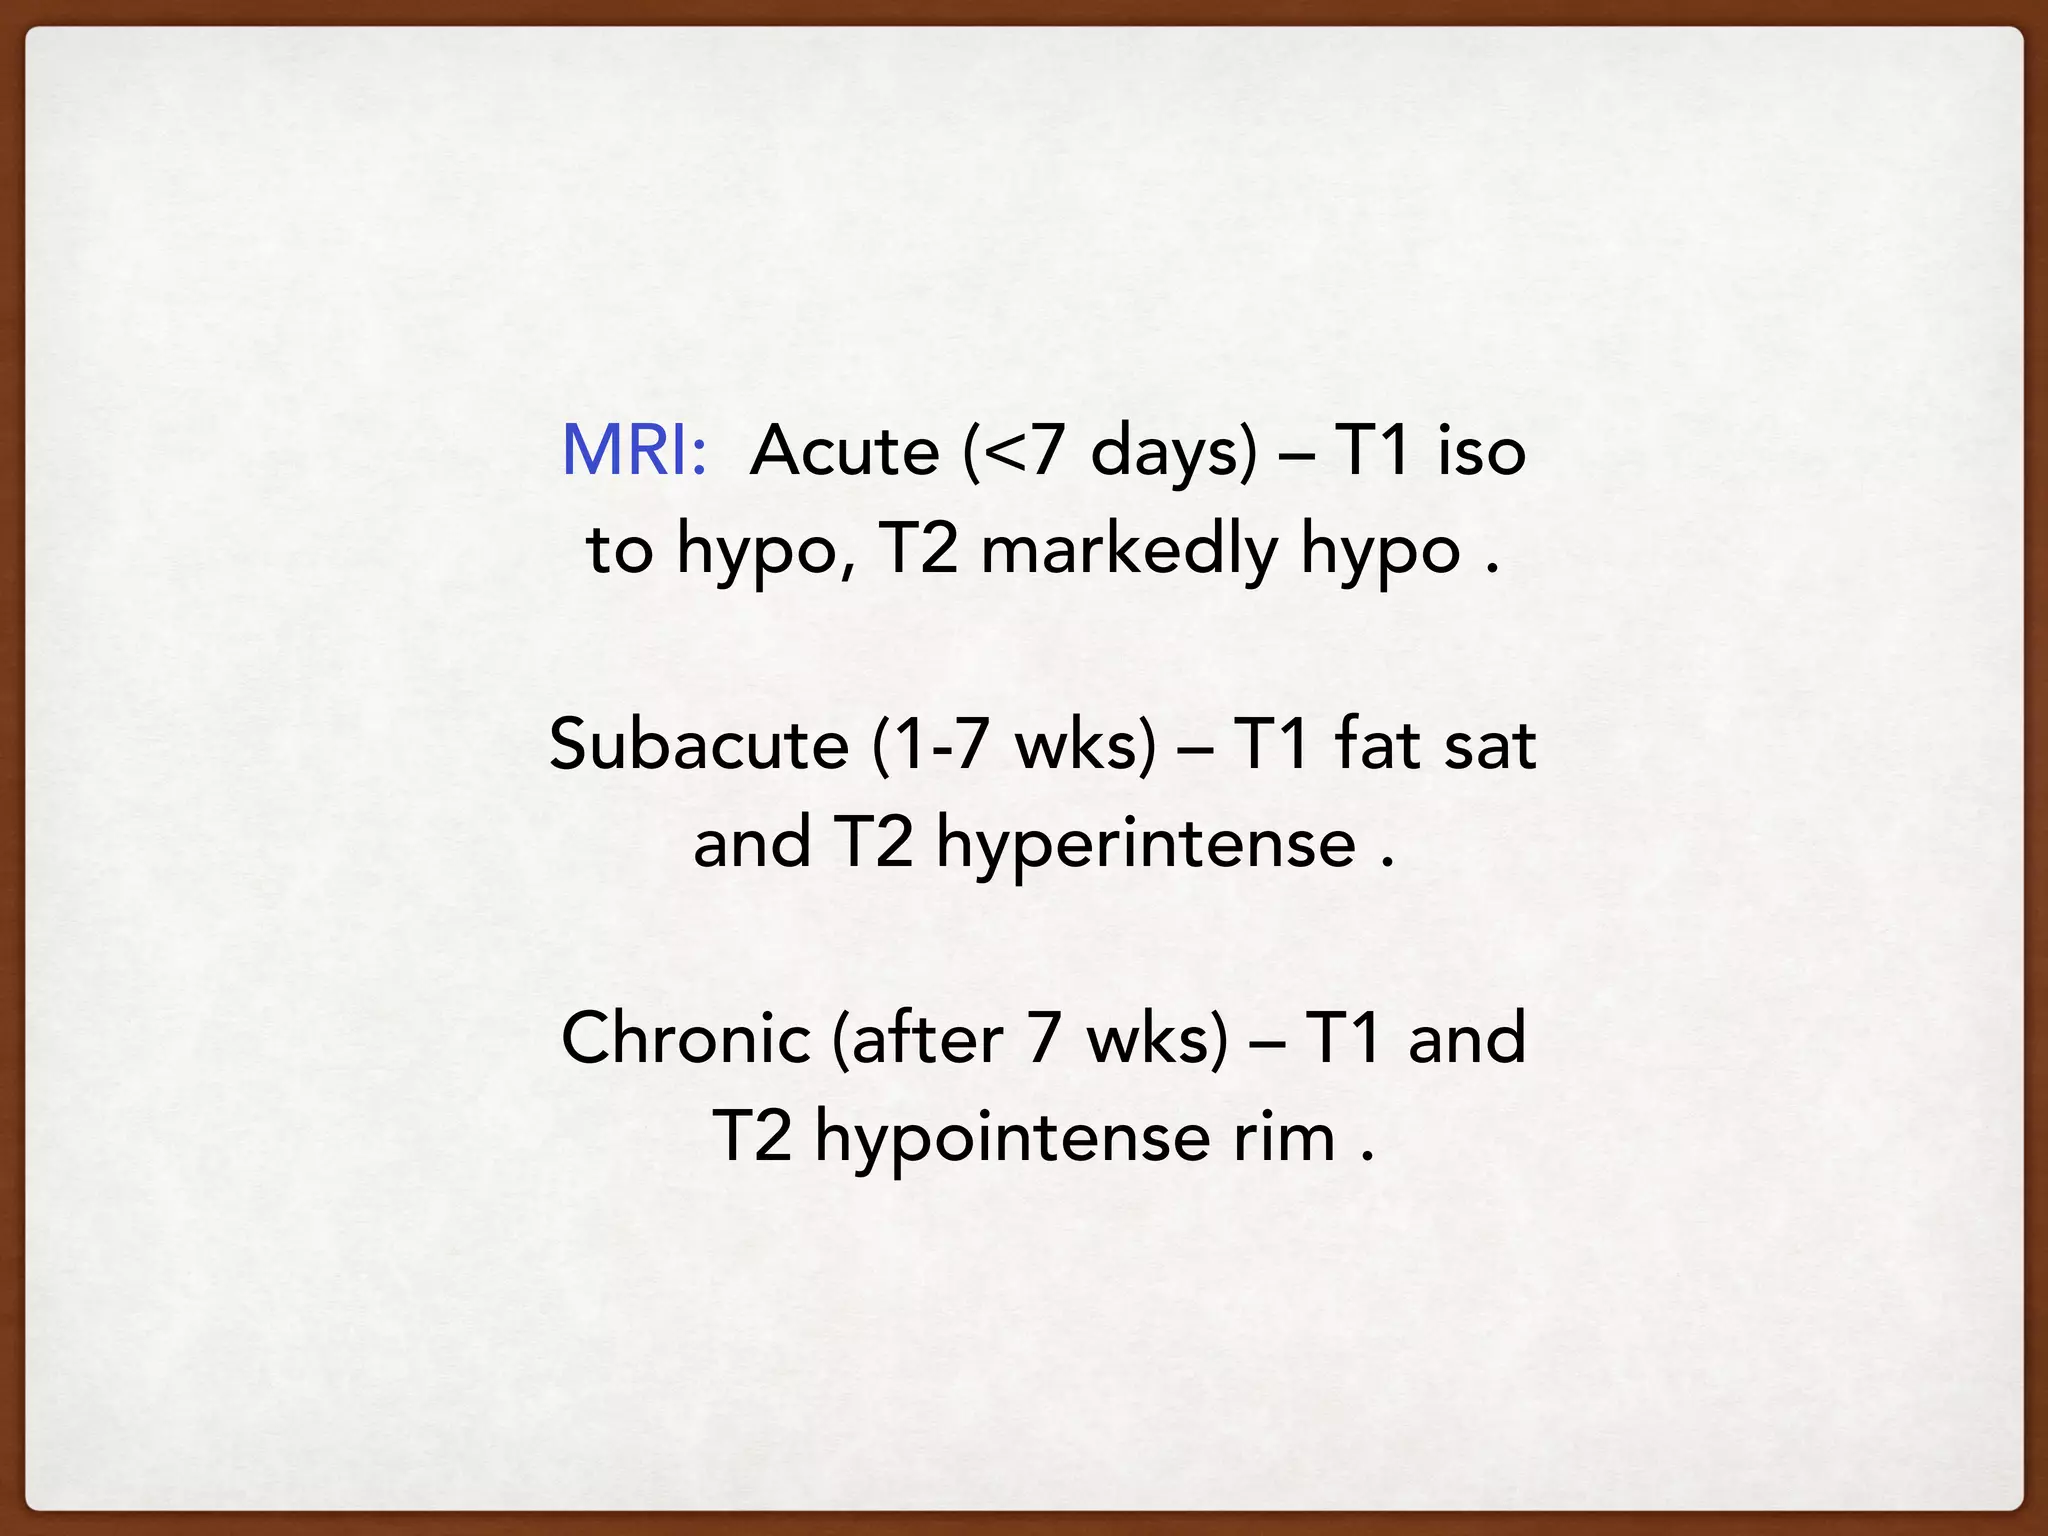
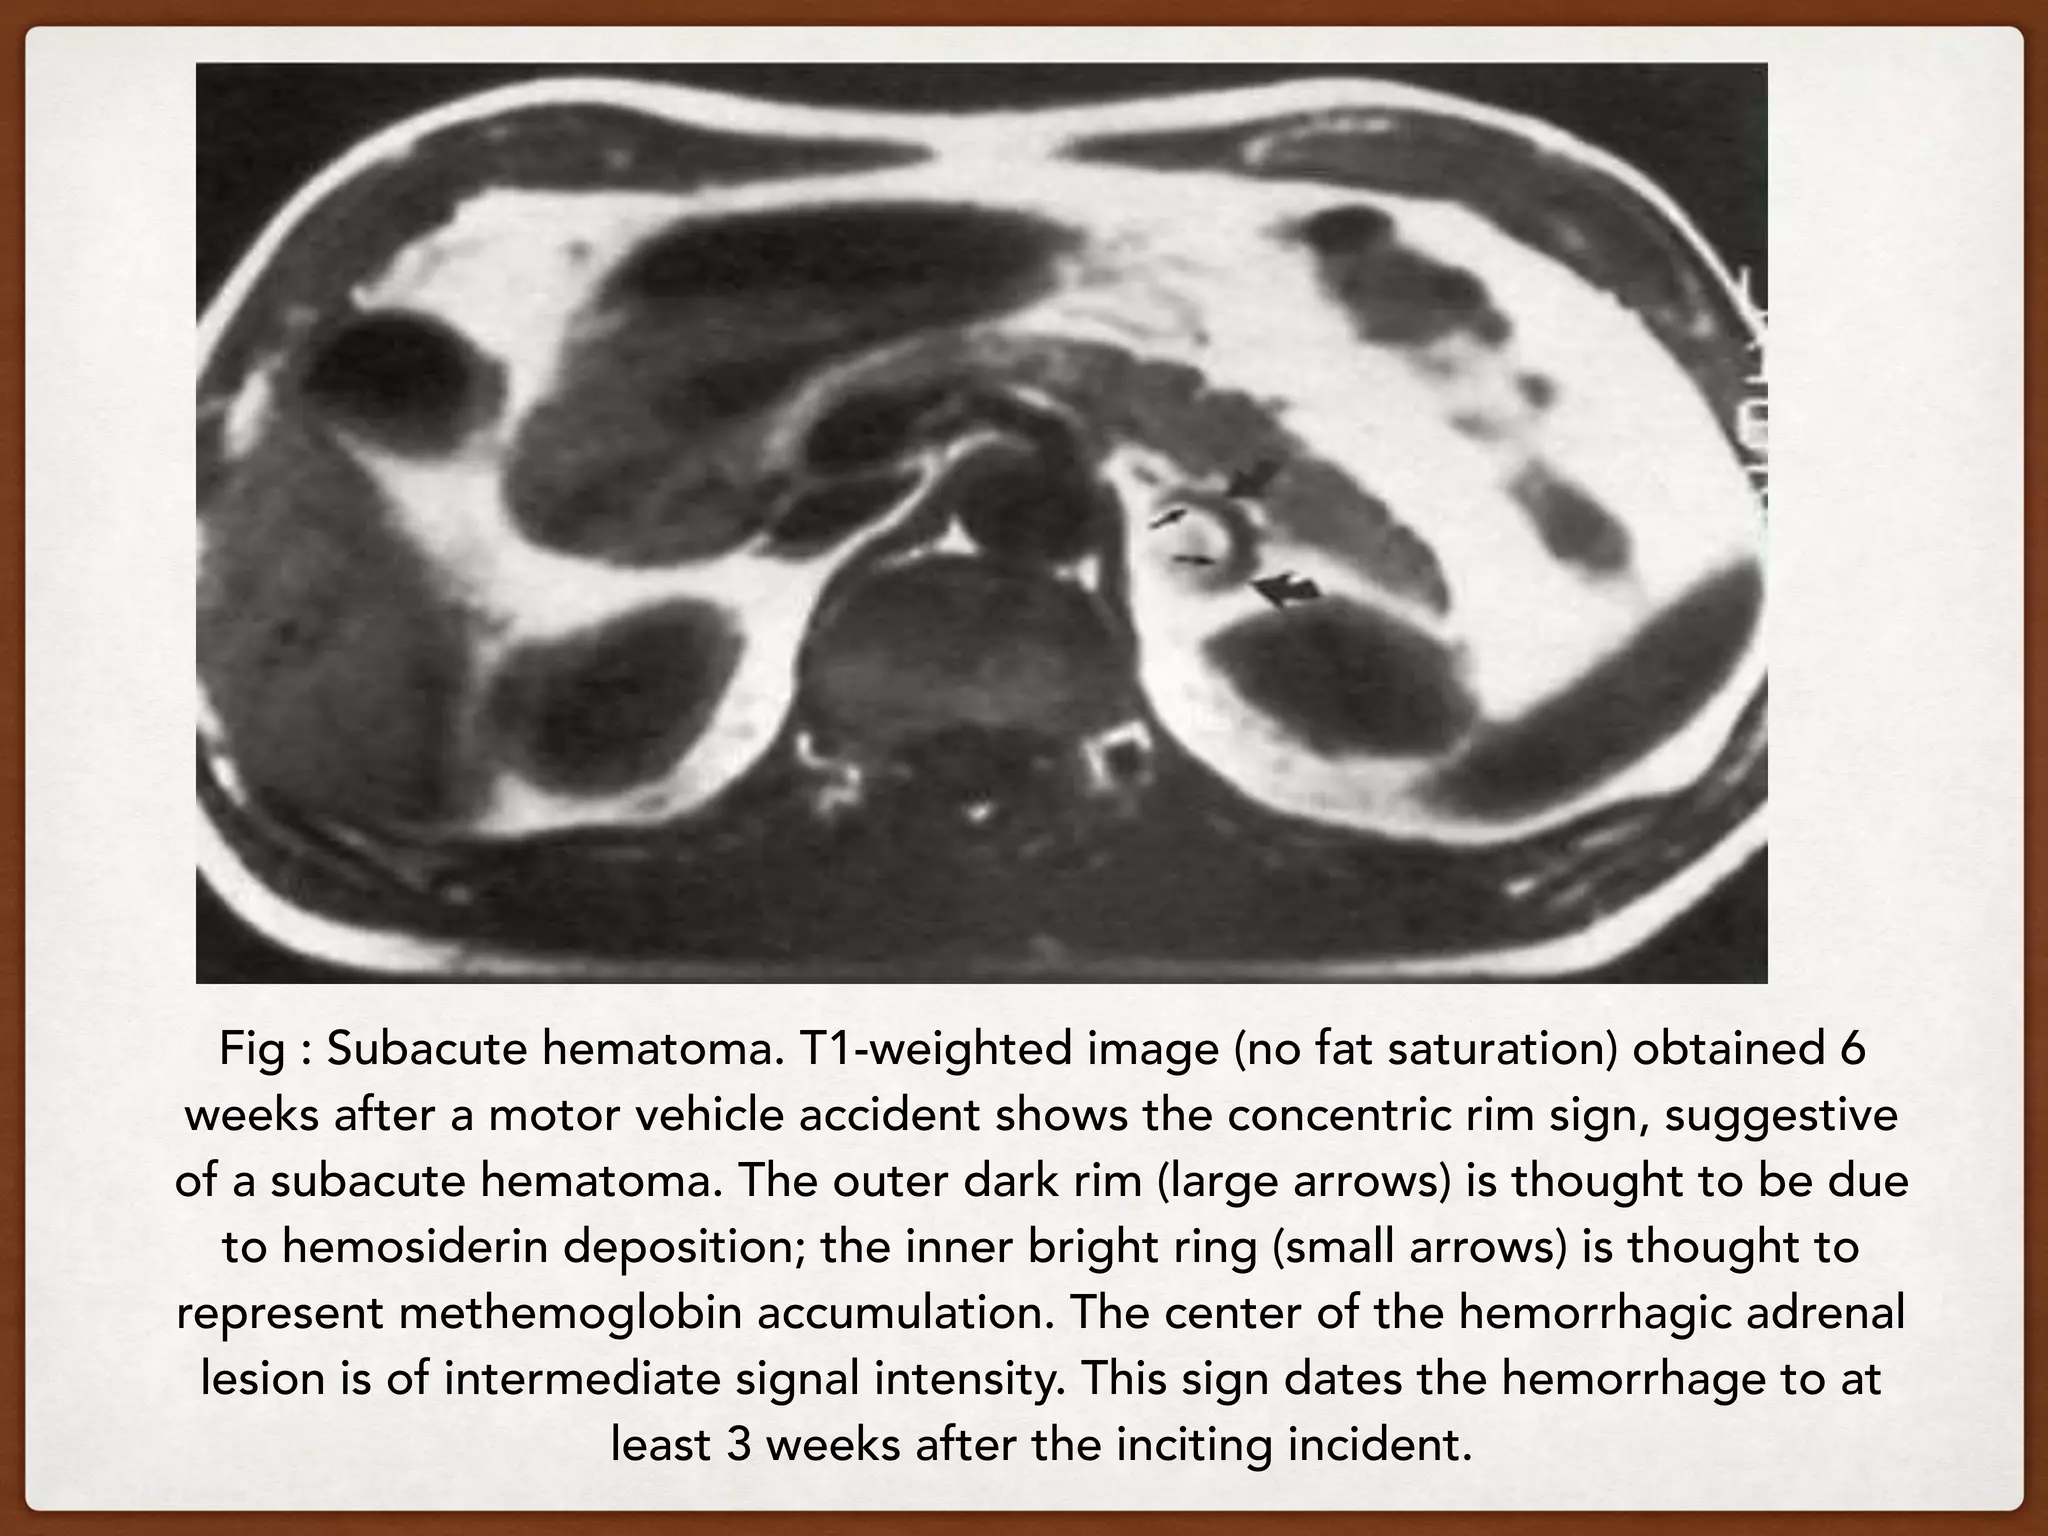
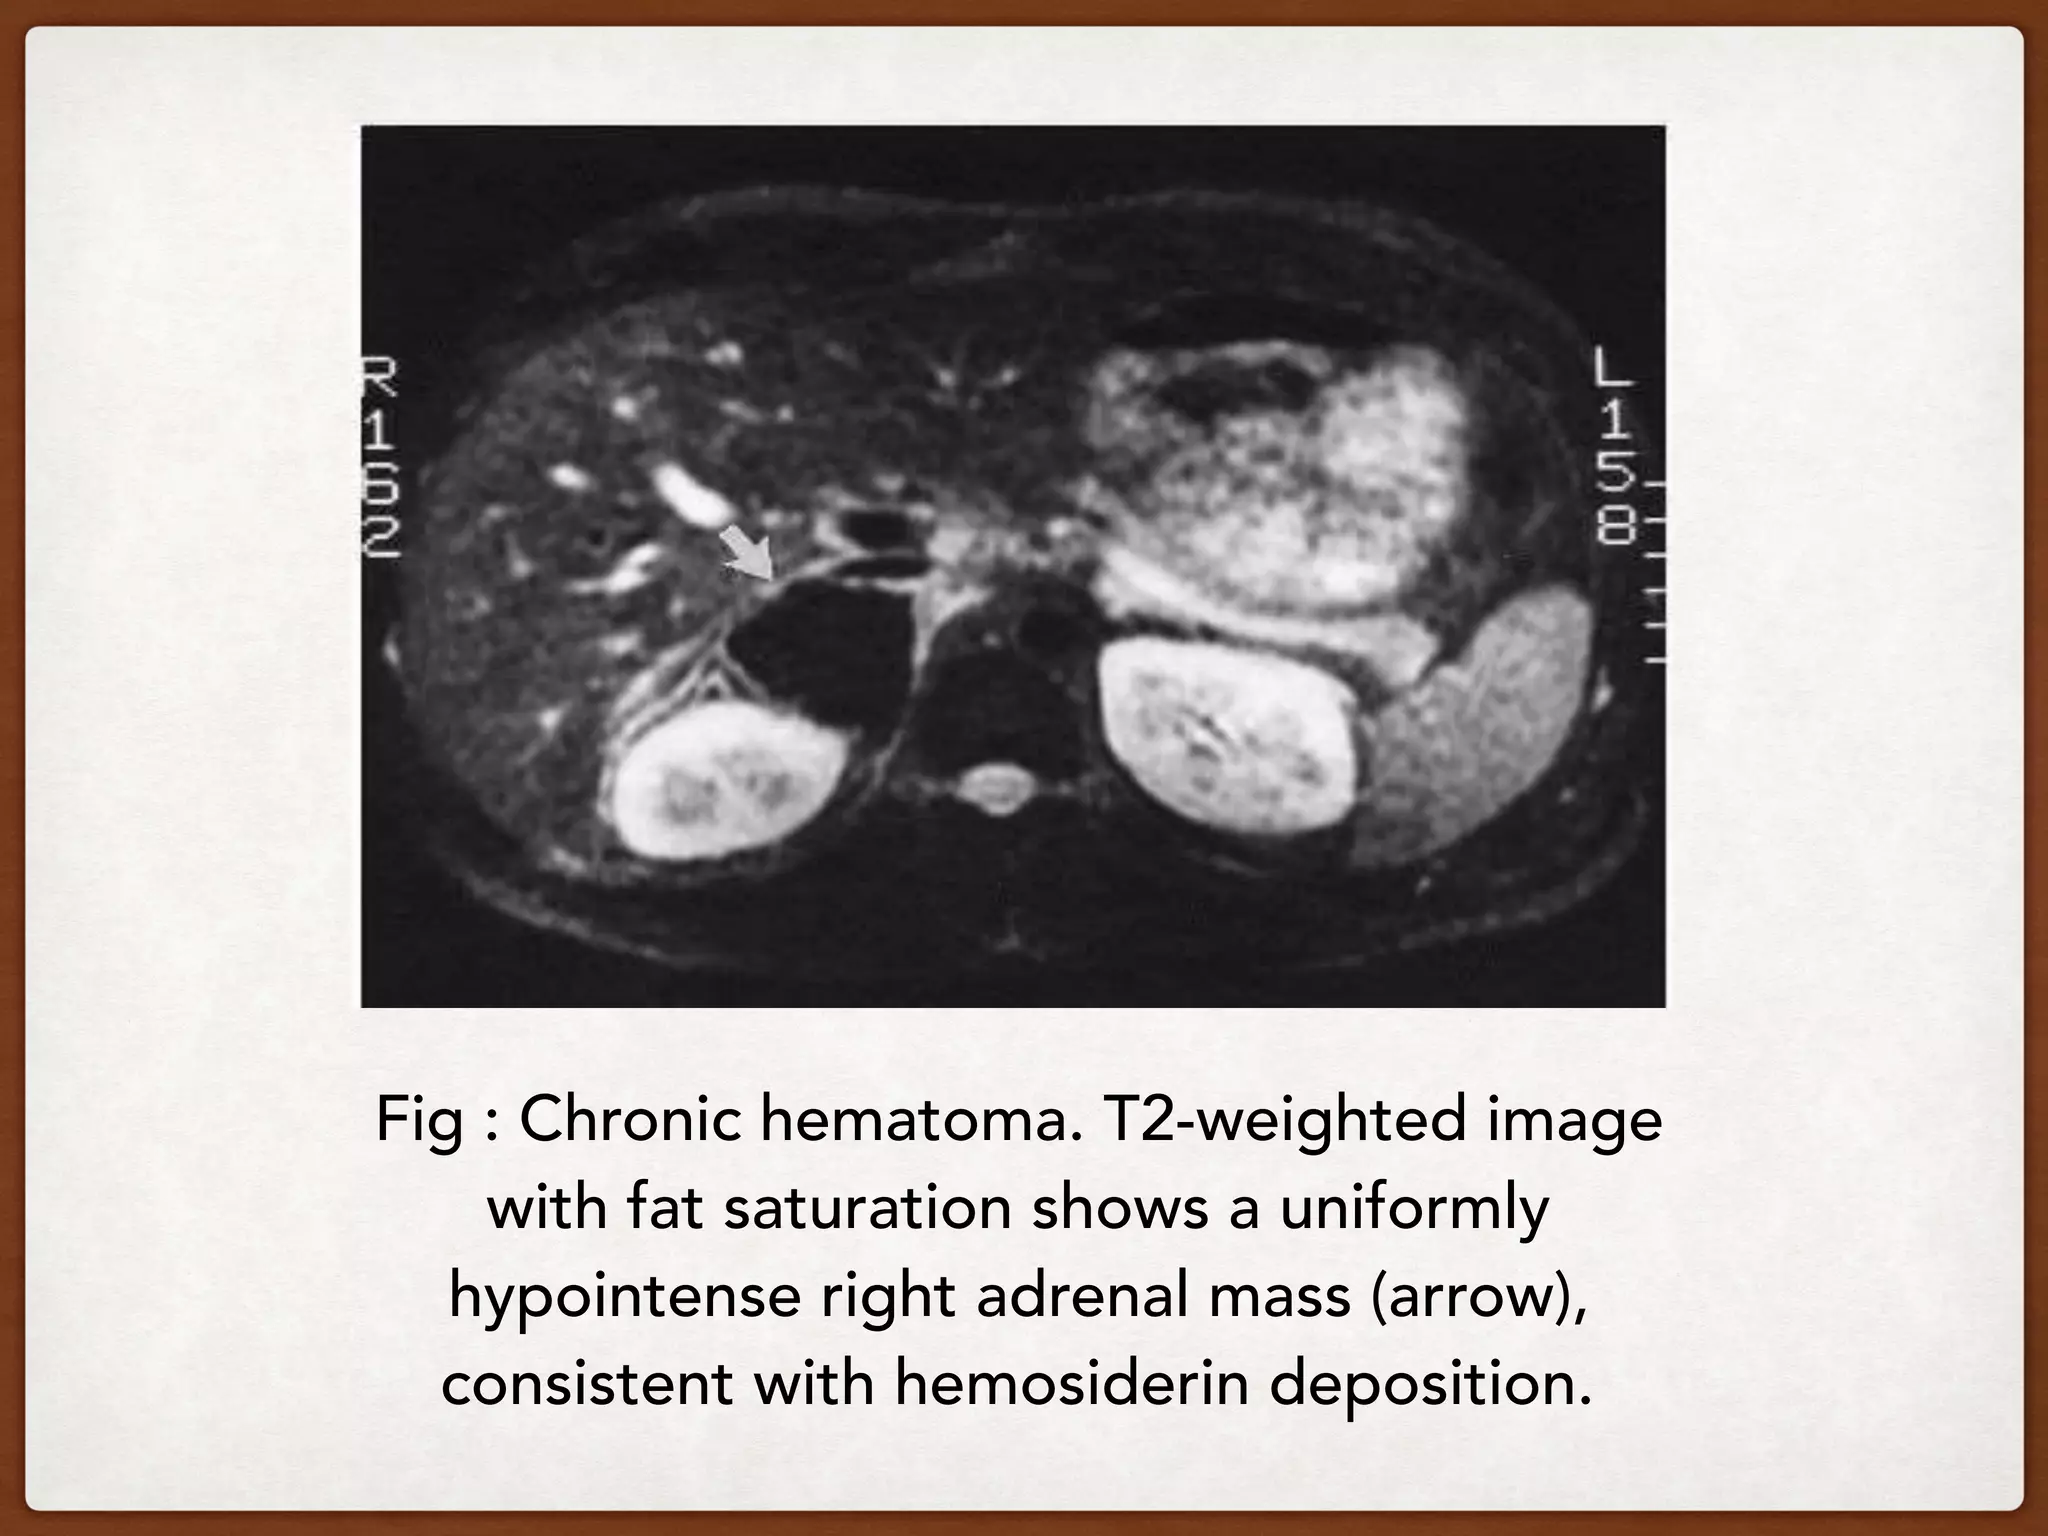
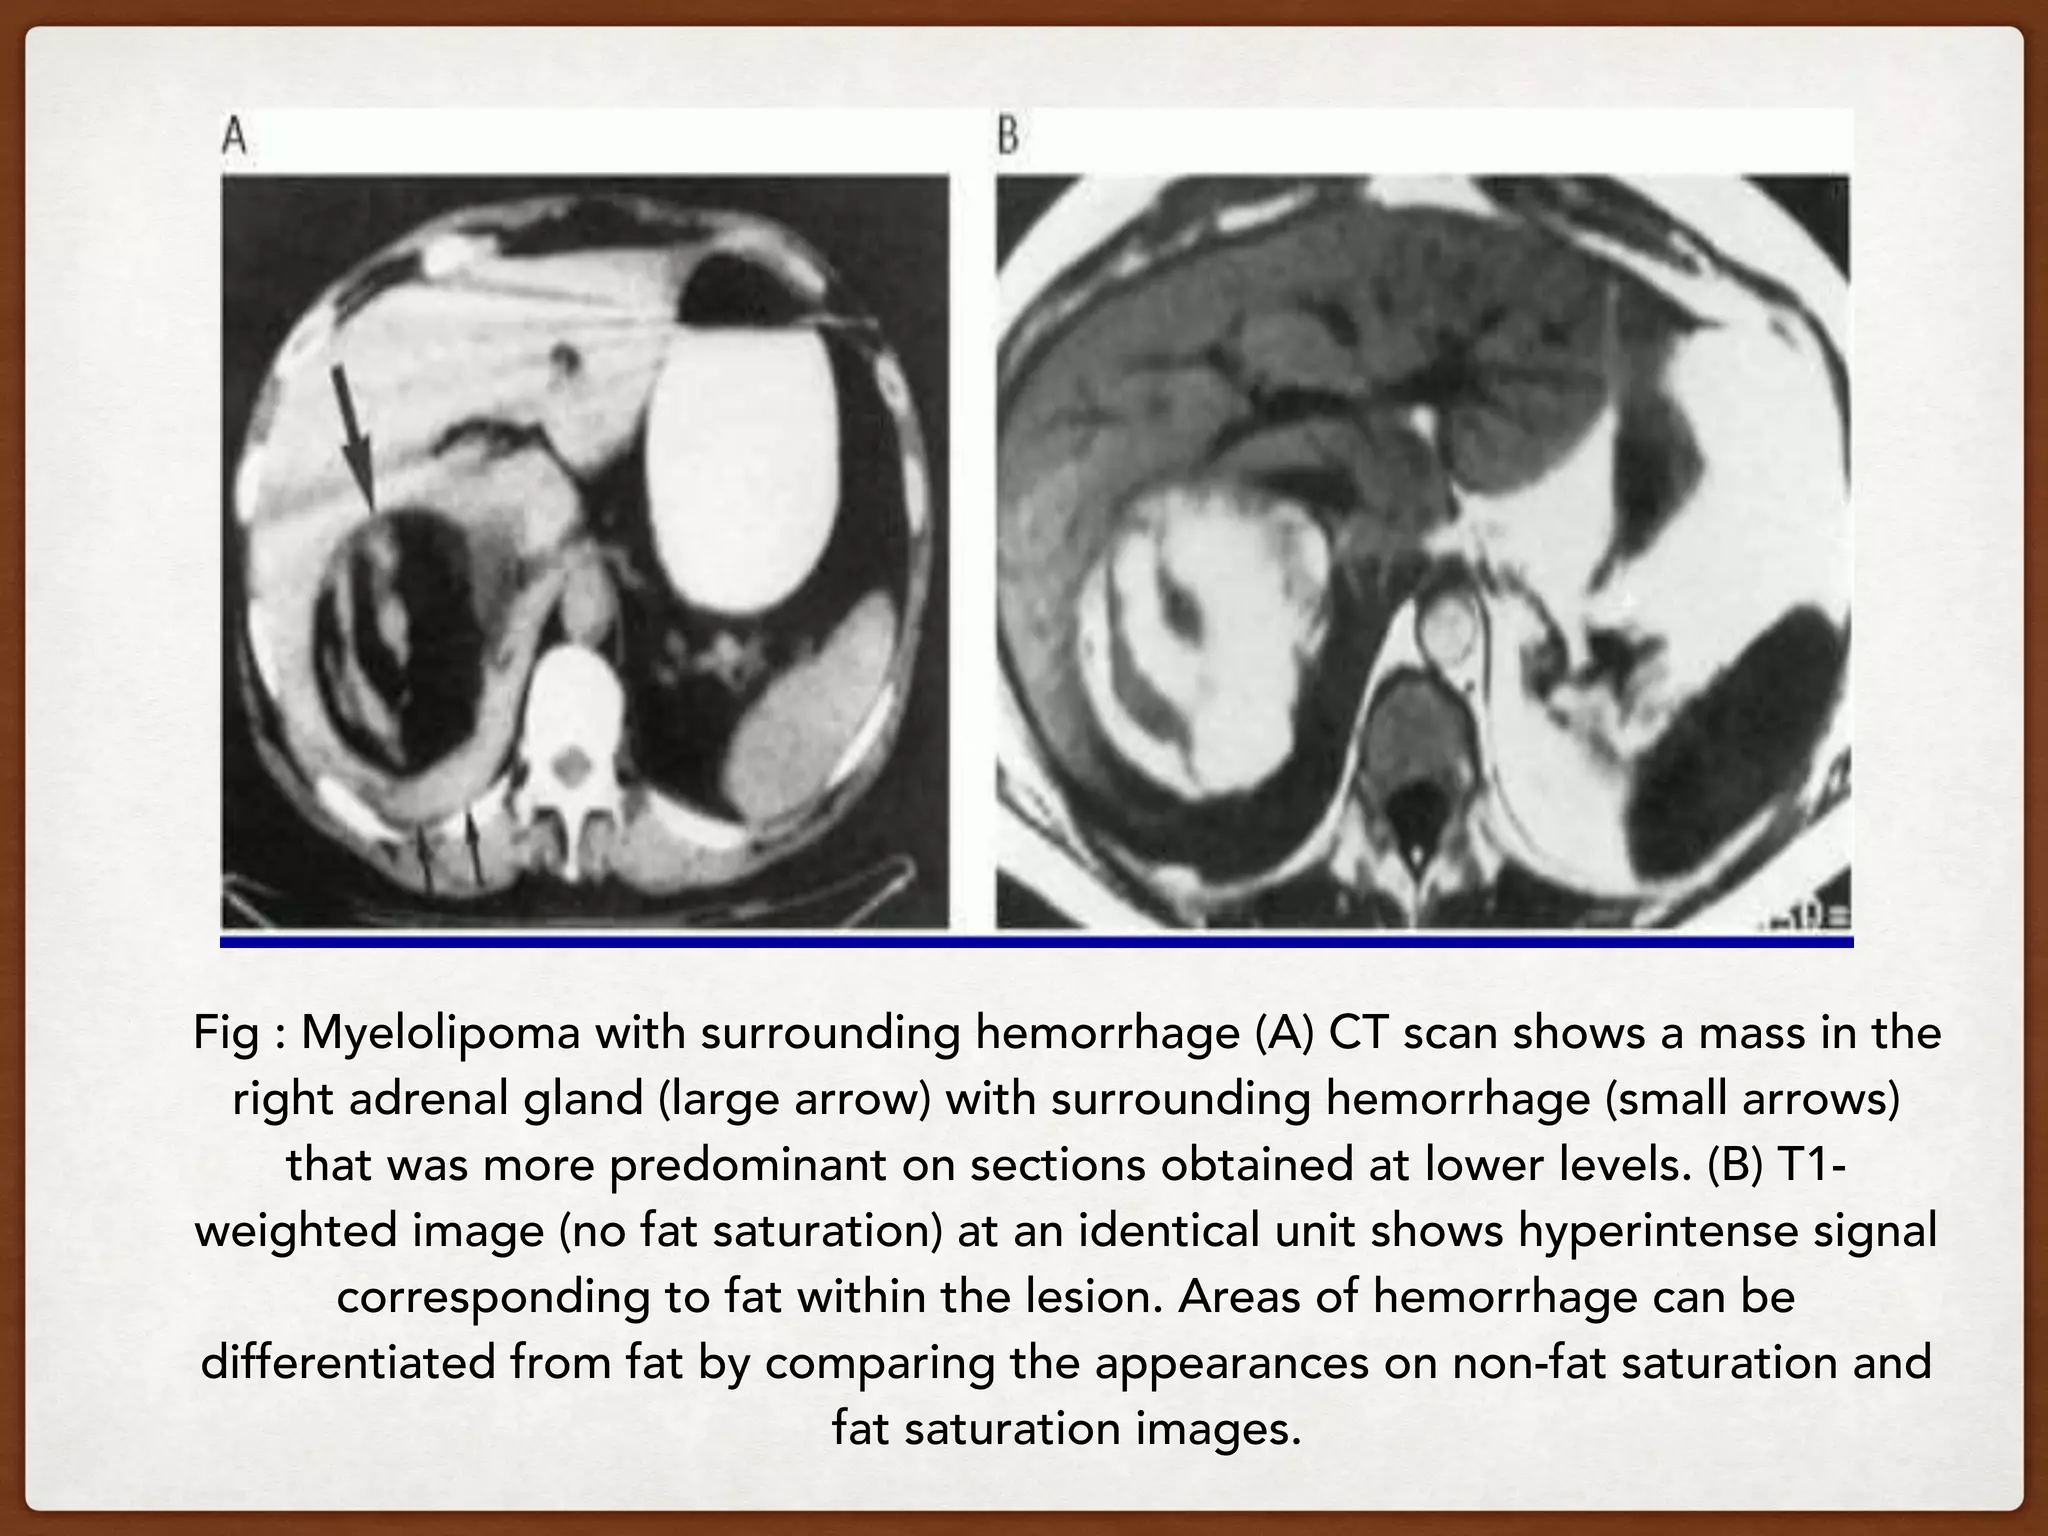
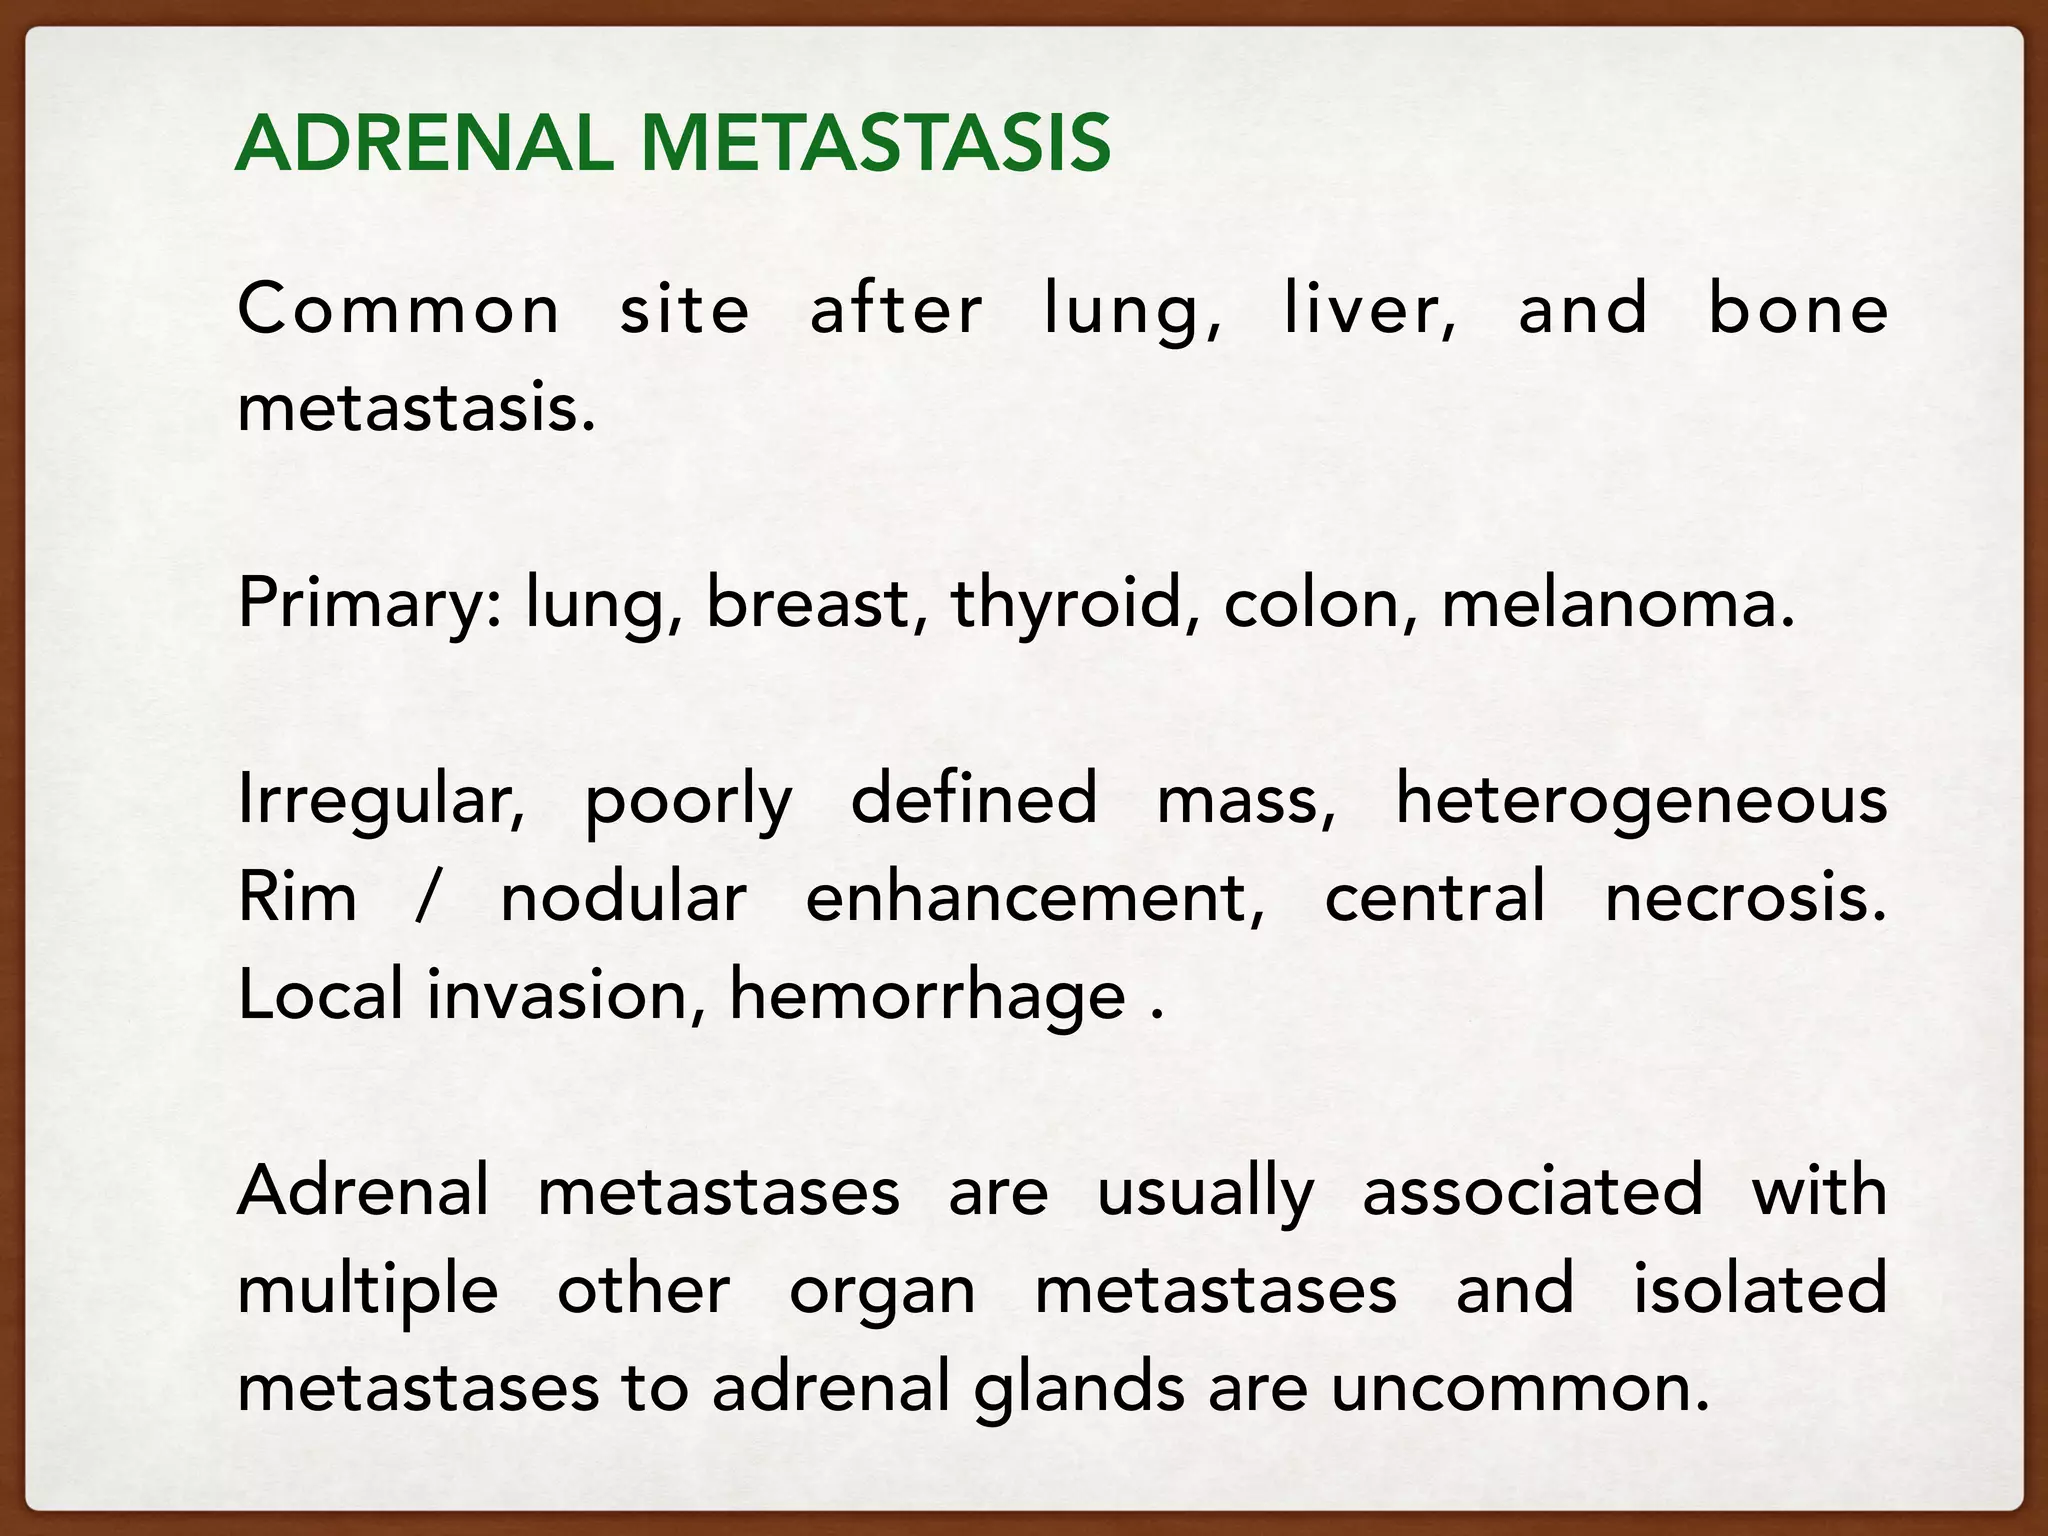
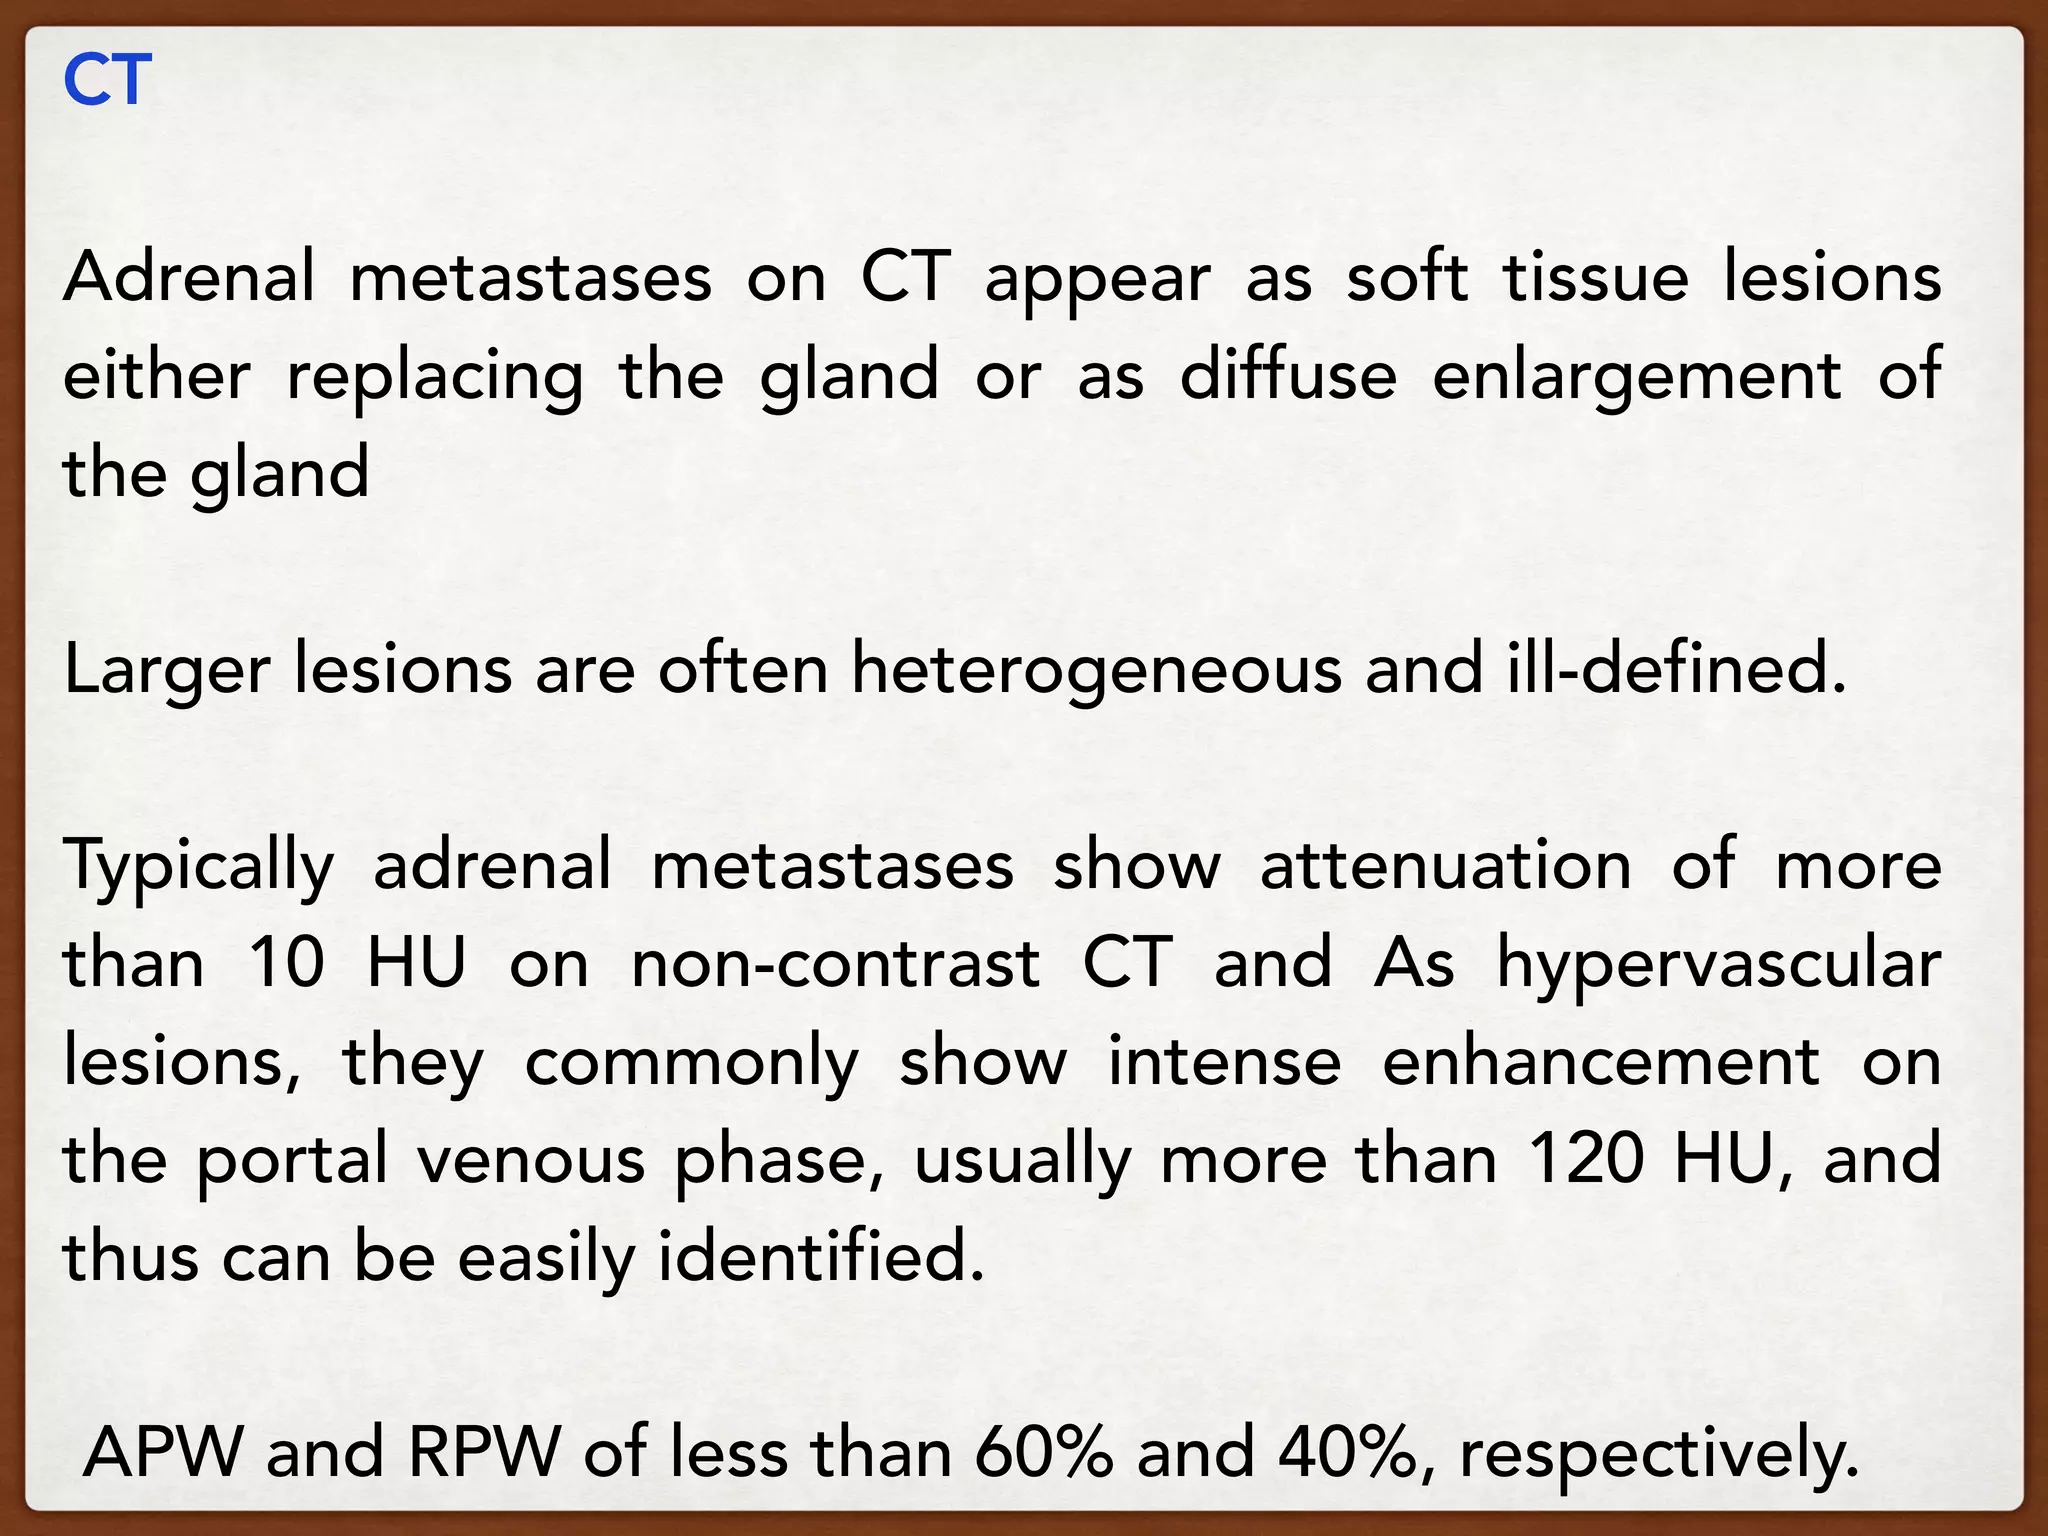
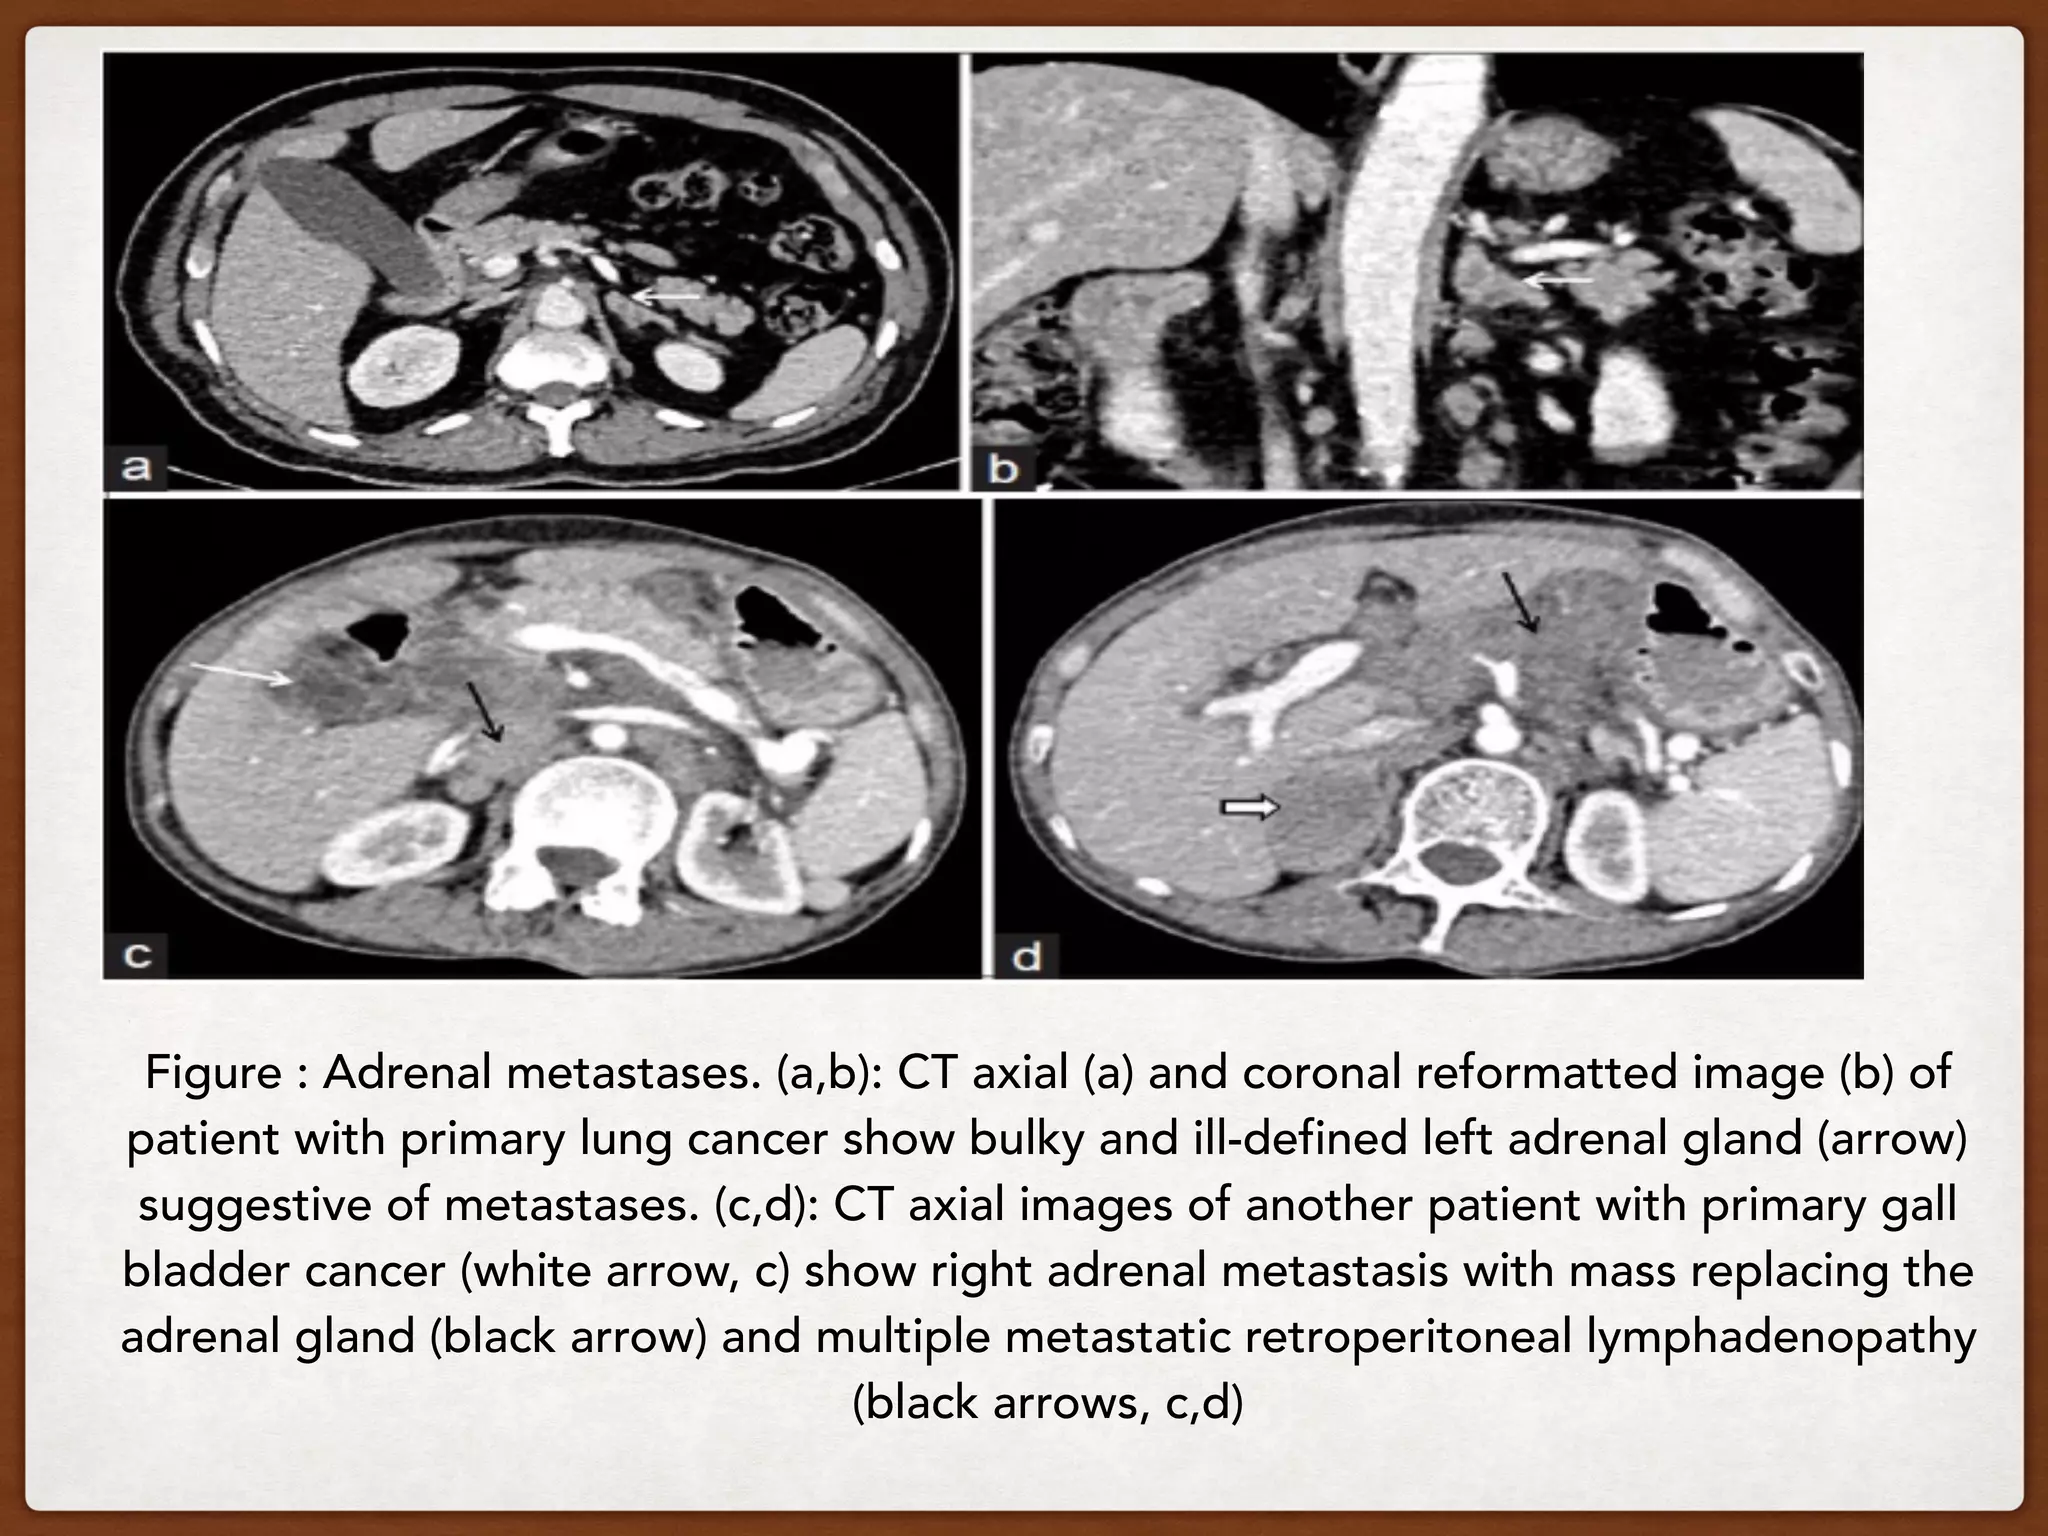
DR.YEASIR AHMED MASUM
FCPS (COURSE)
RADIOLOGY & IMAGING
Bangabandhu Sheikh Mujib Medical
University
Dhaka,Bangladesh.
yeasir48@gmail.com
IMAGING BASED CHARACTERIZATION OF
ADRENAL MASS
Adrenal Gland
The adrenal gland is named for its location adjacent to
the kidneys: ad-renal .
Also known as suprarenal glands .
The right adrenal gland is pyramidal in shape, whereas
the left is semilunar or crescent shaped and somewhat
larger than the right.
Situated on the posterior abdominal wall over the upper
pole of the kidneys behind the peritoneum.


Each gland is enclosed in the
p e r i r e n a l f a s c i a a n d l i e
retroperitonially at level of 11th-12th
thoracic vertevre.
Each have a body and two limbs –
medial and lateral.
Average size varies from 3-5 cm
long and 2-3 cm wide and average
thickness is about 5 mm.
Average weight is about 3-5 g .
Imaging modalities to study adrenal gland
MR and CT are now most widely used imaging modality to
evaluate adrenal mass .
However ultrasound is the simple primary investigation to
detect adrenal mass.
And plain x-ray of abdomen can be used to detect adrenal
calcification.
Isotope scanning and neddle biopsy are used less frequently
in necessary conditions.
Other modalities which are now obsolete or used in
special cirmstances
1. IVP and high dose IVP with tomography
2. Retroperitoneal air insufflation
3. Arteriography
4. Phlebography
5. Venacaval and adrenal vein blood sampling.
nnee
Fig : Normal adrenal gland in non-contrast axial CT
and T1 W MRI.
Fig: USG scan of enlarged Adrenal gland.
The right adrenal
gland is usually
evaluated by
transverse oblique
scans and coronal
scans, respec-tively,
through the anterior
and middle axillary
line, while the left
adrenal gland is
investi-gated by an
oblique coronal scan
mainly through the
posterior axillary line.
Fig: X-ray of adrenal mass
HISTOLOGY
ADRENAL CORTEX-Divided into three zones -
1.Zona glomerulosa-outer most – Secretes
mineralocorticoids (aldosterone).
2.Zona fasciculata - Secretes cortisol.
3.Zona reticulata - Secretes androgens.
ADRENAL Medulla- Secretes Adrenaline and
Noradrenaline.
DONEC QUIS NUNC
ADRENAL MASSES
Masses of the adrenal gland can categorize into following
categories:
1.Cortcal mass : Adenoma & Carcinoma
2.Medullarymass :Pheochromocytoma,Neuroblastoma,Ganglioneuroma.
3.Others : Metastases, Adrenal cysts, Myelolipoma & Lipoma,Adrenal
hemorrhage and hematoma,Lymphoma,Collision tumour,Adrenal TB,
Histoplasmosis, etc.
Benign tumours of the cortex are called adrenal cortical
adenomas.
Vast majority are(95%) nonfunctional 5% are functioning giving
rise to Cushing syndrome, Conns syndrome or virilizing
syndrome.
Age - almost all age groups.
Size - 0.8-1.0 cm in diameter.
ADRENAL CORTICAL MASS

Adenoma
Can be divided into those with typical and atypical
appearance.
Typical adenomas
Benign adenomas are usually
homogeneous lesions
Smooth, regular, encapsulated borders
Discrete masses.
Small in size < 3 cm.
Homogeneous and low density.
Atypical Adenoma
Hemorrhage
Calcification
Necrosis
Lipid poor and HU > 10.
Large . If >4cm, 70% Magignant
If >6cm , 80% Malignant.
CT-EXAMINATION

Adrenal adenomas have two properties that
differentiate them from non-adenomas.


1. 70% of adenomas contain high intracellular fat
(lipid-rich adenomas) and will be of low attenuation
on unenhanced CT.


2. Adenomas rapidly wash out contrast.
Imaging findings:
Unenhanced CT
A density equal to or below 10 HU is
considered diagnostic of adenoma.
Some studies report values up to 14
HU units.
But <10 units almost certainly
indicates an adenoma .
30% of adrenal adenomas do not contain enough
intracellular lipid to have a density of less than 10 HU and
cannot be differentiated from malignant masses on an
unenhanced CT.


These adenomas are called lipid-poor .
IN this case we need contrast enhanced Ct Enhanced
and Delayed scan
Initial enhanced CT (at 60 sec) most adenomas show mild
enhancement.
These adenomas however can be differentiated from
malignant masses on the basis of their fast wash-out of
contrast.
Enhanced CT
The wash-out can be calculated by
comparing the attenuation value at 60 sec
with the attenuation value on a delayed
scan at 15 minutes.
A 5 or 10 minitue protocol may be more
suitabl for busy CT lists.
However there is evidence that 15
minutes post contrast protocol has better
diagnostic accuracy.
The most commonly used formula is the
'enhancement wash out' formula
Fig. 7: Right adrenal
adenoma.
Spontaneous density :
41HU.
Enhanced density at 1
min : 90 HU
Delayed density at 10
min : 55 HU
Absolute Wash Out :
71.4% (>60%)
Relative washout:
80%(>40%)
MRI EXAMINATION
If the  absolute wash out is of less than
60%  or the  relative wash out is less than
40%, further investigations by MR imaging
(including in phase and out of phase
sequences) are needed.
Evaluating the MRI enenhancement features of
adrenal masses found neither absolute enhancement
nor gadolinium washout are useful in differentiating
adenoma from nonadenoma.
The most important component of the adrenal MR
imaging protocol is chemical shift imaging.
Chemical shift imaging is performed with in-phase
and out-of-phase spoiled gradient-recalled-echo
(GRE) sequences.
What is meant by in-phase
vs out-of-phase imaging?  
Fig : Adenoma. (A) T1-weighted image shows a right
adrenal mass (arrow) with a signal intensity similar to that
of the liver. (B) T2-weighted image shows that the signal
intensity of the mass (arrow) remains similar to that of
the liver. This pattern is typical for adrenal adenomas,
which tend to be equal to the liver in signal intensity on
all pulse sequences.
Fig : Chemical shift imaging in adenoma. (A) T1-
weighted in-phase image demonstrates a right adrenal
mass (arrow) that was previously detected in a woman
with breast cancer. (B) On the out-of-phase image,
there is a signal drop off in the adrenal gland (arrow),
which is diagnostic of an adenoma
Fat-containing adrenal masses can be
classified into two main types: those that
contain intracellular fat (eg, adenoma) and
those with macroscopic fat (eg, myelolipoma).
Adrenal lesions that contain macroscopic fat
demonstrate a loss of signal intensity on fat-
saturated images.
ADRENAL MYELOLIPOMA
Adrenal myelolipomas are rare benign, and
usually asymptomatic, tumours of the
adrenal gland characterised by the
predominance of mature adipocytes.
On imaging, they usually present as large
masses with a variable amount of fat-
containing components.
CT
The mass is usually relatively well circumscribed.
Larger leisions (typically >4cm).Nonenhancing.
The amount of fatty component is variable, ranging from
only a few small regions in an otherwise mostly soft
tissue density mass or masses made up of roughly equal
components of fat and soft tissue (50%) or almost
completely composed of fatty tissue.
Small punctate calcifications may be seen in 25-30% of
cases . 
If haemorrhage is present then regions of higher
attenuation may be seen. This is more frequently
seen in large lesions (>10 cm) .
MRI
T1: typically hyperintense due to fat contents
T1 (FS): typically shows fat suppression
T2:  generally intermediate to hyperintense but can
sometimes vary depending on contents (especially
blood products) 
T1 C+ (Gd):  shows striking enhancement( As it is
composed of variable mixture of mature fat and
hemapoetic elements that resemble bone marrow)
In and out of phase:  in masses with mixed
components, out of phase imaging may demonstrate
signal loss as the microscopic fat cells usually have
little intracellular water.
Figure : MRI appearance of Myelolipoma. T1 in-phase image (a) showing a large
hyperintense right adrenal mass (arrow) with central hypointense areas. Out-of
phase image (b) showing signal drop suggesting fat content in the mass. The
mass appears hyperintense on axial T2 weighted image (c) Fat saturated T1 axial
image (d) showing marked drop in signal. These features are suggestive of
myelolipoma.
ADRENOCORTICAL CARCINOMA
ACC is overall a rare tumor but represents the
most common malignant adrenal tumor in a
patient without an underlying malignancy.
It has a bimodal age of presentation, affecting
children in their first decade and adults in their
fourth and fifth decades.
In children, ACC are more likely to be smaller in
size and functioning thus presenting early with
endocrine dysfunction.
In adults, tumors are larger in size, non-functioning
and present late with abdominal pain and lump, local
invasion of (adrenal vein and IVC) and distant
metastasis to lung, liver, and bone .
Large palpable mass >6 cm at presentation with
abdominal / flank pain .
Calcification, central necrosis, hemorrhage are
common .
Hereditary ACCs have been described in
various familial syndromes like Li-Fraumeni
syndrome, Beckwith-Wiedemann syndrome,
Carney's complex, familial adenomatoses
polyposis coli and multiple endocrine neoplasia
(MEN)-type 1.
Imaging
 CT: 1.Large with irregular borders on CT .
2.Usually>12 cm in diameter.
3.Over 90% of adrenocortical carcinomas are >6
cm at presentation.
4.Heterogenous / nodular rim enhancement
relative contrast retention (Relative washout
<40%) on delayed contrast-enhanced CT .
5.Central necrosis is common. Calcification is
seen in 20-30% of cases.
6.Distant metastasis.
Figure : Adrenocortical carcinoma with lung metastases. Axial CT section (a) and
coronal reformatted (b) images showing a heterogeneously enhancing, necrotic
right suprarenal mass (white arrows) with intralesional calcifications (black arrow, a).
The mass is displacing the right kidney (K) inferiorly. Lung window axial CT image
(c) showing metastatic nodules in lower lobes of both lungs (arrows, c)
Figure : Adrenocortical carcinoma with liver metastases. CT axial image showing ill-
defined, infiltrative right adrenal mass (M), displacing the inferior vena cava
anteriorly (block arrow), invading right crus of diaphragm (black arrow) and
multiple liver metastases (white arrows). There is focal loss of fat planes without
any obvious infiltration of liver. The anterior displacement of inferior vena cava is
consistent with an adrenal mass.
MR: T2 hyperintense, hetergenous enhancement with
slow washout • 
Fig : Carcinoma. (A) Sagittal T1-weighted and (B) coronal T2-
weighted contrast images show a large mass involving the right
adrenal gland. The mass exhibits heterogeneous low signal
intensity on the T1-weighted image and high signal intensity with
a heterogeneous enhancement pattern and areas of necrosis
(arrow in B) on the T2-weighted image.
ADRENAL MEDULLARY TUMORS
The adrenal medulla is located anatomically at the center
of each adrenal gland, and is composed of
neuroendocrine (chromaffin) cells .
Neuroblastoma and Pheochromocytoma are the two
most important tumors which arise from the adrenal
medulla. Ganglioneroma & Ganglioneuroblastoma can
also arise from adrenal medulla.
Phaeochromocytomas:
 Are an uncommon tumour of the adrenal gland, with
characteristic clinical, and to a lesser degree imaging
features. The tumours are said to follow a 10% rule:
~10% are extra-adrenal
~10% are bilateral
~10% are malignant
~10% are found in children
~10% are familial
~10% are not associated with hypertension
~10% contain calcification
Imaging
CT
Usually large, heterogeneous masses with areas of
necrosis and cystic change they typically enhance avidly.
May wash out similar to an adrenal adenoma, but they
tend to have a greater enhancement in an arterial or
portal venous contrast phase tend to enhance more on
the portal venous phase than the arterial phase.
110 HU of enhancement on the arterial phase is
compatible with phaeochromocytoma.
Up to 7% demonstrate areas of calcification.
Figure 1: Washout in pheochromocytoma. NCCT (a), 1min post
contrast (b) delayed- 15 minutes post contrast (c) axial sections and
coronal reconstructed section (d) in a 19-years-male with right
pheochromocytoma show well defined iso to hypodense lesion in
right adrenal measuring 4.3 cms in size and 23 HU (not shown in
image) on unenhanced scan with avid contrast enhancement (251
HU, not shown) with rapid washout (31HU).
MRI
MRI is the most sensitive modality for identification of
phaeochromocytomas and is particularly useful in cases
of extra-adrenal location. The overall sensitivity is said to
be 98% 6.
T1
slightly hypointense to the remainder of the adrenal
if necrotic and/or haemorrhagic then signal will be more
heterogeneous
T2
markedly hyperintense (lightbulb sign): this is a helpful
feature areas of necrosis/haemorrhage/calcification will
alter the signal.
In-phase/out-of-phase:  no signal loss on out-of-
phase imaging (phaeochromocytomas do not
contain large amount of intracellular lipid)
T1 C+ (Gd)
Heterogeneous enhancement, enhancement is
prolonged, persisting for as long as 50 minutes .
Fig :Pheochromocytoma. (A) T1weighted GRE image shows a
large right adrenal mass that is hypointense relative to the
liver. (B) Fat saturation T2-weighted scan shows marked
hyperintensity of the adrenal lesion due to the long T2
relaxation time classically reported for pheochromocytomas.
Nuclear medicine
Some agents can be used to attempt to image phaeochromocytomas, and are
especially useful in trying to locate an extra-adrenal tumour (when CT of the abdomen
is negative) or metastatic deposits.
Octreotide (Somatostatin) scans,
Octreotide is usually labelled with either 111In-DTPA (Octreoscan) or (less commonly)
123I-Tyr3-DTPA. 70% of tumours express somatostatin receptors. Imaging is obtained 4
hours (+/- 24/48 hours) after an intravenous infusion. Unfortunately, the kidney also has
somatostatin receptors, as do areas of inflammation, mammary glands, liver, spleen,
bowel, gallbladder, thyroid gland and salivary glands. As such interpretation can be
difficult.
I-123 MIBG (metaiodobenzylguanidine)
I-123 MIBG uptake in an adrenal nodule is strong supporting evidence for a
phaeochromocytoma. Overall sensitivity is ~ 80% 6. However, as many neuroendocrine
tumours demonstrate uptake with MIBG, it is not as specific for phaeochromocytoma
outside of the adrenal.
Neuroblastoma/Ganglioneuroblastoma/ganglioneuroma
These are neurogenic tumors arising from adrenal medulla.
Neuroblastomas and ganglioneuroblastomas are seen in
children while ganglioneuromas are seen in teenagers and
adults.
Neuroblastomas are malignant tumors, ganglioneuroblastomas
are potentially malignant and ganglioneuromas are benign
lesions with peak at 10 years of life.
However, abdominal lump is the most common presentation of
these tumors.
On imaging, CT - They present as suprarenal masses
displacing kidney inferiorly. They also tend to encase
the major blood vessels, cross the midline and
extend into spinal canal. Calcification is seen in
80-90% of these tumors, being coarse or amorphous
type in neuroblastomas and stippled or punctate
type in ganglioneuroblastomas/ganglioneuromas .
Neuroblastomas frequently have areas of necrosis or
hemorrhage while ganglioneuroblastomas/
ganglioneuromas tend to be more homogeneous.
Fig GU 39-14 Neuroblastoma. (A) Coronal T1weighted image
shows a right adrenal tumor that is predominantly hypointense and
contains areas of high-signal-intensity hemorrhage (arrow). (B) On
the T2-weighted image, the tumor is hyperintense.
OTHERS
Adrenal cysts are incidentally detected lesions with
female predominance (3:1) which are usually
asymptomatic. USG depicts a well-defined lesion with
anechoic contents in uncomplicated cysts.
The cysts are homogeneous, well-defined, thin-walled
lesions having attenuation similar to water .
They may appear hyperdense in the case of
hemorrhage or infection within and show no
enhancement on post contrast scan.
ADRENAL CYST

Figure : Right adrenal cyst. Unenhanced CT axial image (a) shows well defined
homogeneously hypodense lesion in right adrenal with mean HU of 16 HU and
no enhancement on post contrast scan (b) The lesion is stable in size and
imaging characteristics for last 2 years.
Fig : Adrenal Cyst. (A) T1-weighted image shows a large left-right adrenal
mass (arrows) that is hypointense relative to the liver. (B) T2weighted image
shows that the lesion has a markedly long T2 characteristic of a cyst. The
diagnosis was subsequently confirmed by ultrasound.


Adrenal hemorrhage


Adrenal hemorrhage is usually encountered in
patients with blunt abdominal trauma where it affects
right adrenal more than the left. 


Non-traumatic adrenal hemorrhage occurs rarely and is
associated with stress, hemorrhagic diathesis,
coagulopathy or anticoagulation therapy and in the
case of underlying adrenal tumors.
On unenhanced CT, hemorrhage demonstrates
attenuation values of 50-90 HU in acute and
subacute stage with a gradual decrease in size
and attenuation on follow-up imaging.
Does not enhance, decreases in size and
attenuation with time. Fat stranding & extension
is common.
Figure : Adrenal hemorrhage. CECT axial (a) and coronal (b) images of a 34 year
old man with trauma abdomen show a well-defined oval lesion replacing the right
adrenal gland suggestive of adrenal hematoma (white arrow). There is also
periadrenal fat stranding with mild thickening of right crus of diaphragm (black
arrow, b). The left adrenal gland is normal in appearance (block arrows a,b)
MRI: Acute (<7 days) – T1 iso
to hypo, T2 markedly hypo .
Subacute (1-7 wks) – T1 fat sat
and T2 hyperintense .
Chronic (after 7 wks) – T1 and
T2 hypointense rim .
Fig : Subacute hematoma. T1-weighted image (no fat saturation) obtained 6
weeks after a motor vehicle accident shows the concentric rim sign, suggestive
of a subacute hematoma. The outer dark rim (large arrows) is thought to be due
to hemosiderin deposition; the inner bright ring (small arrows) is thought to
represent methemoglobin accumulation. The center of the hemorrhagic adrenal
lesion is of intermediate signal intensity. This sign dates the hemorrhage to at
least 3 weeks after the inciting incident.
Fig : Chronic hematoma. T2-weighted image
with fat saturation shows a uniformly
hypointense right adrenal mass (arrow),
consistent with hemosiderin deposition.
Fig : Myelolipoma with surrounding hemorrhage (A) CT scan shows a mass in the
right adrenal gland (large arrow) with surrounding hemorrhage (small arrows)
that was more predominant on sections obtained at lower levels. (B) T1-
weighted image (no fat saturation) at an identical unit shows hyperintense signal
corresponding to fat within the lesion. Areas of hemorrhage can be
differentiated from fat by comparing the appearances on non-fat saturation and
fat saturation images.
ADRENAL METASTASIS
Common site after lung, liver, and bone
metastasis.
Primary: lung, breast, thyroid, colon, melanoma.
Irregular, poorly defined mass, heterogeneous
Rim / nodular enhancement, central necrosis. 
Local invasion, hemorrhage .
Adrenal metastases are usually associated with
multiple other organ metastases and isolated
metastases to adrenal glands are uncommon.
 
CT
Adrenal metastases on CT appear as soft tissue lesions
either replacing the gland or as diffuse enlargement of
the gland
Larger lesions are often heterogeneous and ill-defined.
Typically adrenal metastases show attenuation of more
than 10 HU on non-contrast CT and As hypervascular
lesions, they commonly show intense enhancement on
the portal venous phase, usually more than 120 HU, and
thus can be easily identified. 
APW and RPW of less than 60% and 40%, respectively.
Figure : Adrenal metastases. (a,b): CT axial (a) and coronal reformatted image (b) of
patient with primary lung cancer show bulky and ill-defined left adrenal gland (arrow)
suggestive of metastases. (c,d): CT axial images of another patient with primary gall
bladder cancer (white arrow, c) show right adrenal metastasis with mass replacing the
adrenal gland (black arrow) and multiple metastatic retroperitoneal lymphadenopathy
(black arrows, c,d)
MRI
Exact signal characteristics can vary depending on
the type of tumour. In general, commonly described
signal characteristics include:
T1: usually exhibit low signal intensity
T2:  often show high signal intensity
T1 C+ (Gd):  usually has progressive enhancement
after administration of contrast material.
An important diagnostic feature is the lack of signal
loss on out-of-phase images (in contradistinction to
that seen with adrenal adenoma).
Fig : Metastasis (breast carcinoma). (A) T1-weighted image (no fat saturation)
shows a large right adrenal mass (arrows) that is nondescriptly hypointense
relative to the liver. (B) T2-weighted image shows that the lesion (arrowheads)
has become hyperintense relative to the liver, conforming with the typical
appearance of an adrenal metastasis.
LYMPHOMA
Diffuse or focal involvement.
Primary adrenal lymphoma is rare.
Usually NHL with other involvement.
Central necrosis and lymphadenopathy .
On imaging, various manifestations of adrenal
lymphoma have been described.
In early stage, the adrenal glands may appear normal
or mildly bulky on imaging that can be mistaken for
normal appearance.
Adrenal lymphoma can progressively appear as
nodular hyperplasia, diffuse infiltration of gland with
maintained adreniform shape or as infiltrative soft
tissue masses replacing the adrenal gland.
At times the glands can be engulfed by bulky
retroperitoneal lymphadenopathy and not seen
separately .
When presenting as soft tissue masses, the CT and
MR characteristics are non-specific with washout
values, MR signal intensities and enlargement similar
to that of adrenal metastases.
Figure : CT appearance of adrenal lymphoma CT axial images (a, b) in a patient
with Non-Hodgkin's lymphoma show bilateral bulky, hypodense masses
replacing the adrenal glands (arrows, a) and conglomerate retroperitoneal
lymphadenopathy (arrows, b) consistent with adrenal lymphomas.
Diffusion-weighted imaging (DWI) is sensitive
for adrenal lymphoma like lymphoma of
other regions although DWI is not a standard
imaging sequence for most of the adrenal
lesions.
Diagnosis can be suspected in view of the
clinical background of lymphoma and can be
conclusively proved by tissue sampling.
In contradistinction to metastases, adrenal
lymphomas show good response to
chemotherapy
Figure 12: MR appearance of adrenal lymphoma. Axial T1 weighted (a), T2
weighted fat suppressed (b) of patient with lymphoma show bilateral adrenal
masses with maintained adreniform shapes (white arrows). The masses are
hypointense on T1 (a), hyperintense on T2 (b).
diffusion weighted image (DWI) at b-value of 90 (c) and corresponding apparent
diffusion coefficient (ADC) map (d) of patient with lymphoma show bilateral adrenal
masses with maintained adreniform shapes (white arrows). show marked restriction
of diffusion (hyperintense on DWI and dark on ADC) consistent with adrenal
lymphomas. There is another focal lesion in left kidney (block arrow) which is
hypointense on both T1 and T2 weighted images with restricted diffusion
suggestive of renal lymphomatous deposit.
Collision tumor


Collision tumors refer to two histologically different
lesions co-existing in the same gland without any
significant tissue mixture.
While both lesions in collision tumors can be benign
(adenoma and myelolipoma, adenoma and lipoma).
Collisions of benign adenomas with malignant
metastases or with ACC can occur .
Adenoma-metastases collisions are more likely to be
encountered due to the high incidence of adenomas
and high propensity for adrenal metastases.
These collision tumors can pose a dilemma even with
all imaging techniques at the radiologist's arsenal as
lesions show features of both adenomas (signal drop
on CS-MRI and increased contrast washout) and
metastases (absence of drop on CS-MRI, decreased
contrast washout) on both CT and MRI.
Figure 10: Collison tumor: Schwanomma with lipoma. T1 in-phase image (a)
showing a large hypointense right adrenal mass (M) and hyperintense left adrenal
mass (arrow). Out-of phase image (b) showing no signal drop of adrenal mass.
Coronal (c) and sagittal (d) fat saturated T2 weighted image show large
hyperintense right adrenal mass (M) with hypointense area (arrow) within likely to
represent fat. Fat saturated axial image (e) showing large mass (M) in the right
adrenal with area of fat (arrow) and another completely fatty mass in left adrenal
(arrow). Note complete suppression of left adrenal lesion in image (c).
Contrast enhanced image (f) shows enhancement of the right adrenal mass (M)
with nonenhancing fatty area (arrow) and complete no enhancement of left
adrenal mass (arrow). These features are suggestive of myelolipoma of right
adrenal and lipoma of left adrenal. However, at surgery the right adrenal mass
came out to be a schwanomma with separate adrenal lipoma suggesting a
collision tumor.

Figure : Bilateral adrenal masses-Tuberculosis. Bulky and lobulated
contour of bilateral adrenals with maintained shape and outline showing
hypodense areas within in a patient with abdominal discomfort. Diagnosis of
tuberculosis was confirmed on histopathological examination
ADRENAL TUBERCULOSIS
HISTOPLASMOSIS
THANK
YOU

Imaging Based Characterization of Adrenal Mass

  • 1.
    DR.YEASIR AHMED MASUM FCPS(COURSE) RADIOLOGY & IMAGING Bangabandhu Sheikh Mujib Medical University Dhaka,Bangladesh. yeasir48@gmail.com IMAGING BASED CHARACTERIZATION OF ADRENAL MASS
  • 2.
    Adrenal Gland The adrenalgland is named for its location adjacent to the kidneys: ad-renal . Also known as suprarenal glands . The right adrenal gland is pyramidal in shape, whereas the left is semilunar or crescent shaped and somewhat larger than the right. Situated on the posterior abdominal wall over the upper pole of the kidneys behind the peritoneum. 

  • 3.
    Each gland isenclosed in the p e r i r e n a l f a s c i a a n d l i e retroperitonially at level of 11th-12th thoracic vertevre. Each have a body and two limbs – medial and lateral. Average size varies from 3-5 cm long and 2-3 cm wide and average thickness is about 5 mm. Average weight is about 3-5 g .
  • 4.
    Imaging modalities tostudy adrenal gland MR and CT are now most widely used imaging modality to evaluate adrenal mass . However ultrasound is the simple primary investigation to detect adrenal mass. And plain x-ray of abdomen can be used to detect adrenal calcification. Isotope scanning and neddle biopsy are used less frequently in necessary conditions.
  • 5.
    Other modalities whichare now obsolete or used in special cirmstances 1. IVP and high dose IVP with tomography 2. Retroperitoneal air insufflation 3. Arteriography 4. Phlebography 5. Venacaval and adrenal vein blood sampling.
  • 6.
    nnee Fig : Normaladrenal gland in non-contrast axial CT and T1 W MRI.
  • 7.
    Fig: USG scanof enlarged Adrenal gland. The right adrenal gland is usually evaluated by transverse oblique scans and coronal scans, respec-tively, through the anterior and middle axillary line, while the left adrenal gland is investi-gated by an oblique coronal scan mainly through the posterior axillary line.
  • 8.
    Fig: X-ray ofadrenal mass
  • 9.
    HISTOLOGY ADRENAL CORTEX-Divided intothree zones - 1.Zona glomerulosa-outer most – Secretes mineralocorticoids (aldosterone). 2.Zona fasciculata - Secretes cortisol. 3.Zona reticulata - Secretes androgens. ADRENAL Medulla- Secretes Adrenaline and Noradrenaline.
  • 10.
  • 12.
    ADRENAL MASSES Masses ofthe adrenal gland can categorize into following categories: 1.Cortcal mass : Adenoma & Carcinoma 2.Medullarymass :Pheochromocytoma,Neuroblastoma,Ganglioneuroma. 3.Others : Metastases, Adrenal cysts, Myelolipoma & Lipoma,Adrenal hemorrhage and hematoma,Lymphoma,Collision tumour,Adrenal TB, Histoplasmosis, etc.
  • 13.
    Benign tumours ofthe cortex are called adrenal cortical adenomas. Vast majority are(95%) nonfunctional 5% are functioning giving rise to Cushing syndrome, Conns syndrome or virilizing syndrome. Age - almost all age groups. Size - 0.8-1.0 cm in diameter. ADRENAL CORTICAL MASS
 Adenoma
  • 14.
    Can be dividedinto those with typical and atypical appearance. Typical adenomas Benign adenomas are usually homogeneous lesions Smooth, regular, encapsulated borders Discrete masses. Small in size < 3 cm. Homogeneous and low density.
  • 15.
    Atypical Adenoma Hemorrhage Calcification Necrosis Lipid poorand HU > 10. Large . If >4cm, 70% Magignant If >6cm , 80% Malignant.
  • 16.
    CT-EXAMINATION
 Adrenal adenomas havetwo properties that differentiate them from non-adenomas. 
 1. 70% of adenomas contain high intracellular fat (lipid-rich adenomas) and will be of low attenuation on unenhanced CT. 
 2. Adenomas rapidly wash out contrast. Imaging findings:
  • 17.
    Unenhanced CT A densityequal to or below 10 HU is considered diagnostic of adenoma. Some studies report values up to 14 HU units. But <10 units almost certainly indicates an adenoma .
  • 19.
    30% of adrenaladenomas do not contain enough intracellular lipid to have a density of less than 10 HU and cannot be differentiated from malignant masses on an unenhanced CT. 
 These adenomas are called lipid-poor . IN this case we need contrast enhanced Ct Enhanced and Delayed scan
  • 20.
    Initial enhanced CT(at 60 sec) most adenomas show mild enhancement. These adenomas however can be differentiated from malignant masses on the basis of their fast wash-out of contrast. Enhanced CT
  • 21.
    The wash-out canbe calculated by comparing the attenuation value at 60 sec with the attenuation value on a delayed scan at 15 minutes. A 5 or 10 minitue protocol may be more suitabl for busy CT lists. However there is evidence that 15 minutes post contrast protocol has better diagnostic accuracy. The most commonly used formula is the 'enhancement wash out' formula
  • 23.
    Fig. 7: Rightadrenal adenoma. Spontaneous density : 41HU. Enhanced density at 1 min : 90 HU Delayed density at 10 min : 55 HU Absolute Wash Out : 71.4% (>60%) Relative washout: 80%(>40%)
  • 24.
    MRI EXAMINATION If the absolute wash out is of less than 60%  or the  relative wash out is less than 40%, further investigations by MR imaging (including in phase and out of phase sequences) are needed.
  • 25.
    Evaluating the MRIenenhancement features of adrenal masses found neither absolute enhancement nor gadolinium washout are useful in differentiating adenoma from nonadenoma. The most important component of the adrenal MR imaging protocol is chemical shift imaging. Chemical shift imaging is performed with in-phase and out-of-phase spoiled gradient-recalled-echo (GRE) sequences.
  • 26.
    What is meantby in-phase vs out-of-phase imaging?  
  • 27.
    Fig : Adenoma.(A) T1-weighted image shows a right adrenal mass (arrow) with a signal intensity similar to that of the liver. (B) T2-weighted image shows that the signal intensity of the mass (arrow) remains similar to that of the liver. This pattern is typical for adrenal adenomas, which tend to be equal to the liver in signal intensity on all pulse sequences.
  • 28.
    Fig : Chemicalshift imaging in adenoma. (A) T1- weighted in-phase image demonstrates a right adrenal mass (arrow) that was previously detected in a woman with breast cancer. (B) On the out-of-phase image, there is a signal drop off in the adrenal gland (arrow), which is diagnostic of an adenoma
  • 29.
    Fat-containing adrenal massescan be classified into two main types: those that contain intracellular fat (eg, adenoma) and those with macroscopic fat (eg, myelolipoma). Adrenal lesions that contain macroscopic fat demonstrate a loss of signal intensity on fat- saturated images.
  • 30.
    ADRENAL MYELOLIPOMA Adrenal myelolipomas arerare benign, and usually asymptomatic, tumours of the adrenal gland characterised by the predominance of mature adipocytes. On imaging, they usually present as large masses with a variable amount of fat- containing components.
  • 31.
    CT The mass isusually relatively well circumscribed. Larger leisions (typically >4cm).Nonenhancing. The amount of fatty component is variable, ranging from only a few small regions in an otherwise mostly soft tissue density mass or masses made up of roughly equal components of fat and soft tissue (50%) or almost completely composed of fatty tissue. Small punctate calcifications may be seen in 25-30% of cases . 
  • 32.
    If haemorrhage ispresent then regions of higher attenuation may be seen. This is more frequently seen in large lesions (>10 cm) .
  • 36.
    MRI T1: typically hyperintense dueto fat contents T1 (FS): typically shows fat suppression T2:  generally intermediate to hyperintense but can sometimes vary depending on contents (especially blood products)  T1 C+ (Gd):  shows striking enhancement( As it is composed of variable mixture of mature fat and hemapoetic elements that resemble bone marrow) In and out of phase:  in masses with mixed components, out of phase imaging may demonstrate signal loss as the microscopic fat cells usually have little intracellular water.
  • 37.
    Figure : MRIappearance of Myelolipoma. T1 in-phase image (a) showing a large hyperintense right adrenal mass (arrow) with central hypointense areas. Out-of phase image (b) showing signal drop suggesting fat content in the mass. The mass appears hyperintense on axial T2 weighted image (c) Fat saturated T1 axial image (d) showing marked drop in signal. These features are suggestive of myelolipoma.
  • 38.
    ADRENOCORTICAL CARCINOMA ACC isoverall a rare tumor but represents the most common malignant adrenal tumor in a patient without an underlying malignancy. It has a bimodal age of presentation, affecting children in their first decade and adults in their fourth and fifth decades. In children, ACC are more likely to be smaller in size and functioning thus presenting early with endocrine dysfunction.
  • 39.
    In adults, tumorsare larger in size, non-functioning and present late with abdominal pain and lump, local invasion of (adrenal vein and IVC) and distant metastasis to lung, liver, and bone . Large palpable mass >6 cm at presentation with abdominal / flank pain . Calcification, central necrosis, hemorrhage are common .
  • 40.
    Hereditary ACCs havebeen described in various familial syndromes like Li-Fraumeni syndrome, Beckwith-Wiedemann syndrome, Carney's complex, familial adenomatoses polyposis coli and multiple endocrine neoplasia (MEN)-type 1.
  • 41.
    Imaging  CT: 1.Large withirregular borders on CT . 2.Usually>12 cm in diameter. 3.Over 90% of adrenocortical carcinomas are >6 cm at presentation. 4.Heterogenous / nodular rim enhancement relative contrast retention (Relative washout <40%) on delayed contrast-enhanced CT . 5.Central necrosis is common. Calcification is seen in 20-30% of cases. 6.Distant metastasis.
  • 42.
    Figure : Adrenocorticalcarcinoma with lung metastases. Axial CT section (a) and coronal reformatted (b) images showing a heterogeneously enhancing, necrotic right suprarenal mass (white arrows) with intralesional calcifications (black arrow, a). The mass is displacing the right kidney (K) inferiorly. Lung window axial CT image (c) showing metastatic nodules in lower lobes of both lungs (arrows, c)
  • 43.
    Figure : Adrenocorticalcarcinoma with liver metastases. CT axial image showing ill- defined, infiltrative right adrenal mass (M), displacing the inferior vena cava anteriorly (block arrow), invading right crus of diaphragm (black arrow) and multiple liver metastases (white arrows). There is focal loss of fat planes without any obvious infiltration of liver. The anterior displacement of inferior vena cava is consistent with an adrenal mass.
  • 44.
    MR: T2 hyperintense,hetergenous enhancement with slow washout • 
  • 45.
    Fig : Carcinoma.(A) Sagittal T1-weighted and (B) coronal T2- weighted contrast images show a large mass involving the right adrenal gland. The mass exhibits heterogeneous low signal intensity on the T1-weighted image and high signal intensity with a heterogeneous enhancement pattern and areas of necrosis (arrow in B) on the T2-weighted image.
  • 46.
    ADRENAL MEDULLARY TUMORS Theadrenal medulla is located anatomically at the center of each adrenal gland, and is composed of neuroendocrine (chromaffin) cells . Neuroblastoma and Pheochromocytoma are the two most important tumors which arise from the adrenal medulla. Ganglioneroma & Ganglioneuroblastoma can also arise from adrenal medulla.
  • 47.
    Phaeochromocytomas:  Are an uncommontumour of the adrenal gland, with characteristic clinical, and to a lesser degree imaging features. The tumours are said to follow a 10% rule: ~10% are extra-adrenal ~10% are bilateral ~10% are malignant ~10% are found in children ~10% are familial ~10% are not associated with hypertension ~10% contain calcification
  • 48.
    Imaging CT Usually large, heterogeneousmasses with areas of necrosis and cystic change they typically enhance avidly. May wash out similar to an adrenal adenoma, but they tend to have a greater enhancement in an arterial or portal venous contrast phase tend to enhance more on the portal venous phase than the arterial phase. 110 HU of enhancement on the arterial phase is compatible with phaeochromocytoma. Up to 7% demonstrate areas of calcification.
  • 49.
    Figure 1: Washoutin pheochromocytoma. NCCT (a), 1min post contrast (b) delayed- 15 minutes post contrast (c) axial sections and coronal reconstructed section (d) in a 19-years-male with right pheochromocytoma show well defined iso to hypodense lesion in right adrenal measuring 4.3 cms in size and 23 HU (not shown in image) on unenhanced scan with avid contrast enhancement (251 HU, not shown) with rapid washout (31HU).
  • 50.
    MRI MRI is themost sensitive modality for identification of phaeochromocytomas and is particularly useful in cases of extra-adrenal location. The overall sensitivity is said to be 98% 6. T1 slightly hypointense to the remainder of the adrenal if necrotic and/or haemorrhagic then signal will be more heterogeneous T2 markedly hyperintense (lightbulb sign): this is a helpful feature areas of necrosis/haemorrhage/calcification will alter the signal.
  • 51.
    In-phase/out-of-phase:  no signalloss on out-of- phase imaging (phaeochromocytomas do not contain large amount of intracellular lipid) T1 C+ (Gd) Heterogeneous enhancement, enhancement is prolonged, persisting for as long as 50 minutes .
  • 52.
    Fig :Pheochromocytoma. (A)T1weighted GRE image shows a large right adrenal mass that is hypointense relative to the liver. (B) Fat saturation T2-weighted scan shows marked hyperintensity of the adrenal lesion due to the long T2 relaxation time classically reported for pheochromocytomas.
  • 53.
    Nuclear medicine Some agentscan be used to attempt to image phaeochromocytomas, and are especially useful in trying to locate an extra-adrenal tumour (when CT of the abdomen is negative) or metastatic deposits. Octreotide (Somatostatin) scans, Octreotide is usually labelled with either 111In-DTPA (Octreoscan) or (less commonly) 123I-Tyr3-DTPA. 70% of tumours express somatostatin receptors. Imaging is obtained 4 hours (+/- 24/48 hours) after an intravenous infusion. Unfortunately, the kidney also has somatostatin receptors, as do areas of inflammation, mammary glands, liver, spleen, bowel, gallbladder, thyroid gland and salivary glands. As such interpretation can be difficult. I-123 MIBG (metaiodobenzylguanidine) I-123 MIBG uptake in an adrenal nodule is strong supporting evidence for a phaeochromocytoma. Overall sensitivity is ~ 80% 6. However, as many neuroendocrine tumours demonstrate uptake with MIBG, it is not as specific for phaeochromocytoma outside of the adrenal.
  • 54.
    Neuroblastoma/Ganglioneuroblastoma/ganglioneuroma These are neurogenictumors arising from adrenal medulla. Neuroblastomas and ganglioneuroblastomas are seen in children while ganglioneuromas are seen in teenagers and adults. Neuroblastomas are malignant tumors, ganglioneuroblastomas are potentially malignant and ganglioneuromas are benign lesions with peak at 10 years of life. However, abdominal lump is the most common presentation of these tumors.
  • 55.
    On imaging, CT- They present as suprarenal masses displacing kidney inferiorly. They also tend to encase the major blood vessels, cross the midline and extend into spinal canal. Calcification is seen in 80-90% of these tumors, being coarse or amorphous type in neuroblastomas and stippled or punctate type in ganglioneuroblastomas/ganglioneuromas . Neuroblastomas frequently have areas of necrosis or hemorrhage while ganglioneuroblastomas/ ganglioneuromas tend to be more homogeneous.
  • 56.
    Fig GU 39-14Neuroblastoma. (A) Coronal T1weighted image shows a right adrenal tumor that is predominantly hypointense and contains areas of high-signal-intensity hemorrhage (arrow). (B) On the T2-weighted image, the tumor is hyperintense.
  • 57.
  • 58.
    Adrenal cysts areincidentally detected lesions with female predominance (3:1) which are usually asymptomatic. USG depicts a well-defined lesion with anechoic contents in uncomplicated cysts. The cysts are homogeneous, well-defined, thin-walled lesions having attenuation similar to water . They may appear hyperdense in the case of hemorrhage or infection within and show no enhancement on post contrast scan. ADRENAL CYST

  • 59.
    Figure : Rightadrenal cyst. Unenhanced CT axial image (a) shows well defined homogeneously hypodense lesion in right adrenal with mean HU of 16 HU and no enhancement on post contrast scan (b) The lesion is stable in size and imaging characteristics for last 2 years.
  • 60.
    Fig : AdrenalCyst. (A) T1-weighted image shows a large left-right adrenal mass (arrows) that is hypointense relative to the liver. (B) T2weighted image shows that the lesion has a markedly long T2 characteristic of a cyst. The diagnosis was subsequently confirmed by ultrasound.
  • 61.
    
 Adrenal hemorrhage
 
 Adrenal hemorrhageis usually encountered in patients with blunt abdominal trauma where it affects right adrenal more than the left. 
 
 Non-traumatic adrenal hemorrhage occurs rarely and is associated with stress, hemorrhagic diathesis, coagulopathy or anticoagulation therapy and in the case of underlying adrenal tumors.
  • 62.
    On unenhanced CT,hemorrhage demonstrates attenuation values of 50-90 HU in acute and subacute stage with a gradual decrease in size and attenuation on follow-up imaging. Does not enhance, decreases in size and attenuation with time. Fat stranding & extension is common.
  • 63.
    Figure : Adrenalhemorrhage. CECT axial (a) and coronal (b) images of a 34 year old man with trauma abdomen show a well-defined oval lesion replacing the right adrenal gland suggestive of adrenal hematoma (white arrow). There is also periadrenal fat stranding with mild thickening of right crus of diaphragm (black arrow, b). The left adrenal gland is normal in appearance (block arrows a,b)
  • 64.
    MRI: Acute (<7days) – T1 iso to hypo, T2 markedly hypo . Subacute (1-7 wks) – T1 fat sat and T2 hyperintense . Chronic (after 7 wks) – T1 and T2 hypointense rim .
  • 65.
    Fig : Subacutehematoma. T1-weighted image (no fat saturation) obtained 6 weeks after a motor vehicle accident shows the concentric rim sign, suggestive of a subacute hematoma. The outer dark rim (large arrows) is thought to be due to hemosiderin deposition; the inner bright ring (small arrows) is thought to represent methemoglobin accumulation. The center of the hemorrhagic adrenal lesion is of intermediate signal intensity. This sign dates the hemorrhage to at least 3 weeks after the inciting incident.
  • 66.
    Fig : Chronichematoma. T2-weighted image with fat saturation shows a uniformly hypointense right adrenal mass (arrow), consistent with hemosiderin deposition.
  • 67.
    Fig : Myelolipomawith surrounding hemorrhage (A) CT scan shows a mass in the right adrenal gland (large arrow) with surrounding hemorrhage (small arrows) that was more predominant on sections obtained at lower levels. (B) T1- weighted image (no fat saturation) at an identical unit shows hyperintense signal corresponding to fat within the lesion. Areas of hemorrhage can be differentiated from fat by comparing the appearances on non-fat saturation and fat saturation images.
  • 68.
    ADRENAL METASTASIS Common siteafter lung, liver, and bone metastasis. Primary: lung, breast, thyroid, colon, melanoma. Irregular, poorly defined mass, heterogeneous Rim / nodular enhancement, central necrosis.  Local invasion, hemorrhage . Adrenal metastases are usually associated with multiple other organ metastases and isolated metastases to adrenal glands are uncommon.  
  • 69.
    CT Adrenal metastases onCT appear as soft tissue lesions either replacing the gland or as diffuse enlargement of the gland Larger lesions are often heterogeneous and ill-defined. Typically adrenal metastases show attenuation of more than 10 HU on non-contrast CT and As hypervascular lesions, they commonly show intense enhancement on the portal venous phase, usually more than 120 HU, and thus can be easily identified.  APW and RPW of less than 60% and 40%, respectively.
  • 70.
    Figure : Adrenalmetastases. (a,b): CT axial (a) and coronal reformatted image (b) of patient with primary lung cancer show bulky and ill-defined left adrenal gland (arrow) suggestive of metastases. (c,d): CT axial images of another patient with primary gall bladder cancer (white arrow, c) show right adrenal metastasis with mass replacing the adrenal gland (black arrow) and multiple metastatic retroperitoneal lymphadenopathy (black arrows, c,d)
  • 71.
    MRI Exact signal characteristicscan vary depending on the type of tumour. In general, commonly described signal characteristics include: T1: usually exhibit low signal intensity T2:  often show high signal intensity T1 C+ (Gd):  usually has progressive enhancement after administration of contrast material. An important diagnostic feature is the lack of signal loss on out-of-phase images (in contradistinction to that seen with adrenal adenoma).
  • 72.
    Fig : Metastasis(breast carcinoma). (A) T1-weighted image (no fat saturation) shows a large right adrenal mass (arrows) that is nondescriptly hypointense relative to the liver. (B) T2-weighted image shows that the lesion (arrowheads) has become hyperintense relative to the liver, conforming with the typical appearance of an adrenal metastasis.
  • 73.
    LYMPHOMA Diffuse or focalinvolvement. Primary adrenal lymphoma is rare. Usually NHL with other involvement. Central necrosis and lymphadenopathy .
  • 74.
    On imaging, variousmanifestations of adrenal lymphoma have been described. In early stage, the adrenal glands may appear normal or mildly bulky on imaging that can be mistaken for normal appearance. Adrenal lymphoma can progressively appear as nodular hyperplasia, diffuse infiltration of gland with maintained adreniform shape or as infiltrative soft tissue masses replacing the adrenal gland.
  • 75.
    At times theglands can be engulfed by bulky retroperitoneal lymphadenopathy and not seen separately . When presenting as soft tissue masses, the CT and MR characteristics are non-specific with washout values, MR signal intensities and enlargement similar to that of adrenal metastases.
  • 76.
    Figure : CTappearance of adrenal lymphoma CT axial images (a, b) in a patient with Non-Hodgkin's lymphoma show bilateral bulky, hypodense masses replacing the adrenal glands (arrows, a) and conglomerate retroperitoneal lymphadenopathy (arrows, b) consistent with adrenal lymphomas.
  • 77.
    Diffusion-weighted imaging (DWI)is sensitive for adrenal lymphoma like lymphoma of other regions although DWI is not a standard imaging sequence for most of the adrenal lesions. Diagnosis can be suspected in view of the clinical background of lymphoma and can be conclusively proved by tissue sampling. In contradistinction to metastases, adrenal lymphomas show good response to chemotherapy
  • 78.
    Figure 12: MRappearance of adrenal lymphoma. Axial T1 weighted (a), T2 weighted fat suppressed (b) of patient with lymphoma show bilateral adrenal masses with maintained adreniform shapes (white arrows). The masses are hypointense on T1 (a), hyperintense on T2 (b).
  • 79.
    diffusion weighted image(DWI) at b-value of 90 (c) and corresponding apparent diffusion coefficient (ADC) map (d) of patient with lymphoma show bilateral adrenal masses with maintained adreniform shapes (white arrows). show marked restriction of diffusion (hyperintense on DWI and dark on ADC) consistent with adrenal lymphomas. There is another focal lesion in left kidney (block arrow) which is hypointense on both T1 and T2 weighted images with restricted diffusion suggestive of renal lymphomatous deposit.
  • 80.
    Collision tumor
 
 Collision tumorsrefer to two histologically different lesions co-existing in the same gland without any significant tissue mixture. While both lesions in collision tumors can be benign (adenoma and myelolipoma, adenoma and lipoma). Collisions of benign adenomas with malignant metastases or with ACC can occur .
  • 81.
    Adenoma-metastases collisions aremore likely to be encountered due to the high incidence of adenomas and high propensity for adrenal metastases. These collision tumors can pose a dilemma even with all imaging techniques at the radiologist's arsenal as lesions show features of both adenomas (signal drop on CS-MRI and increased contrast washout) and metastases (absence of drop on CS-MRI, decreased contrast washout) on both CT and MRI.
  • 82.
    Figure 10: Collisontumor: Schwanomma with lipoma. T1 in-phase image (a) showing a large hypointense right adrenal mass (M) and hyperintense left adrenal mass (arrow). Out-of phase image (b) showing no signal drop of adrenal mass. Coronal (c) and sagittal (d) fat saturated T2 weighted image show large hyperintense right adrenal mass (M) with hypointense area (arrow) within likely to represent fat. Fat saturated axial image (e) showing large mass (M) in the right adrenal with area of fat (arrow) and another completely fatty mass in left adrenal (arrow). Note complete suppression of left adrenal lesion in image (c).
  • 83.
    Contrast enhanced image(f) shows enhancement of the right adrenal mass (M) with nonenhancing fatty area (arrow) and complete no enhancement of left adrenal mass (arrow). These features are suggestive of myelolipoma of right adrenal and lipoma of left adrenal. However, at surgery the right adrenal mass came out to be a schwanomma with separate adrenal lipoma suggesting a collision tumor.

  • 84.
    Figure : Bilateraladrenal masses-Tuberculosis. Bulky and lobulated contour of bilateral adrenals with maintained shape and outline showing hypodense areas within in a patient with abdominal discomfort. Diagnosis of tuberculosis was confirmed on histopathological examination ADRENAL TUBERCULOSIS
  • 85.
  • 87.