Download to read offline
![International Journal of Engineering and Techniques - Volume 1 Issue 3, May - June 2015
ISSN: 2395-1303 http://www.ijetjournal.org Page 94
TOA and DOA Joint Estimation Using Successive
MUSIC Algorithm in IR-UWB Positioning
Systems
A.Eswari1
,T. Ravi Kumar Naidu2
,T.V.S.Gowtham Prasad3
1
Dept. of ECE, SVEC, Tirupati, Andhra Pradesh, India
2
Dept. of ECE, SVEC, Tirupati, Andhra Pradesh, India
3
Dept. of ECE, SVEC, Tirupati, Andhra Pradesh, India
I. INTRODUCTION
Position information is one of the key
requirements for a Wireless Sensor Network (WSN) [1]
to function as intended. An Impulse Radio Ultra
Wideband (IR-UWB) positioning system provides an
excellent means for wireless positioning [2] due to its
high resolution capability in the time domain. UWB
systems refers to the systems with very large bandwidth
which offers several advantages including high data rate,
low complexity, low cost implementation, low power
consumption, resistance to interference, covert
transmission and high anti-multipath effects which has
made UWB widely used in radars, localization, tracking,
sensor networks, positioning and imaging [3],[4].Short
range high speed communication is the most popular
application of the UWB. Time of arrival (TOA) and
Direction of arrival (DOA) [5] are the key signal
parameters to estimate in the positioning systems.
TOA estimation techniques are classified into two
categories: cross-correlation based and super resolution
based. The cross correlation based estimation methods
cannot fulfil the required accuracy for many applications
because it provides very low resolution and limited
bandwidth. To achieve the desired accuracy super
resolution techniques have been proposed for the TOA
estimation [6],[7]. These techniques offers high
resolution spectral estimation with good accuracy and
are applied after the estimated channel impulse response
is transformed to frequency domain.
DOA estimation [8],[9] techniques are classified into
three methods: spectral based, parametric based and sub-
space based methods. In this paper sub-space based
DOA estimation methods are considered for UWB
signals. In the sub-space based DOA estimation methods
there are several algorithms which are MUSIC algorithm
[10],[11], Root-MUSIC algorithm, ESPRIT algorithm,
Matrix pencil algorithm, Propagator method.
RESEARCH ARTICLE OPEN ACCESS
Abstract:
A Wireless Sensor Network (WSN) is an autonomous and self-organizing network without any pre-established
infrastructure which offers many advantages in military applications and emergency areas. Source Localization is one of the
important monitoring tasks of the WSN. It provides the accurate position of the source using various positioning
technologies. In this paper an Impulse Radio Ultra wideband (IR-UWB) positioning system with a two-antenna receiver is
used to estimate the Time of arrival (TOA) and Direction of arrival (DOA) positioning parameters. A two dimensional (2D)
multiple signal classification (MUSIC) algorithm is used to estimate these parameters but it has much higher computational
complexity and also requires 2D spectral peak search. A Successive Multiple signal classification (MUSIC) algorithm is
proposed in this paper which estimates the parameters jointly and gets paired automatically. It avoids the two dimensional
peak searches and reduces the complexity compared to the existing methods 2D-MUSIC, Root-MUSIC, Matrix Pencil
algorithm, Propagator method and Estimation of Signal Parameters via Rotational Invariance Techniques (ESPRIT)
algorithm.
Keywords--Time of arrival (TOA), Direction of arrival (DOA), Impulse Radio Ultra Wideband (IR-UWB), Multiple
Signal Classification (MUSIC).](https://image.slidesharecdn.com/ijet-v1i3p16-150618185603-lva1-app6892/85/IJET-V1I3P16-Authors-A-Eswari-T-Ravi-Kumar-Naidu-T-V-S-Gowtham-Prasad-1-320.jpg)
![International Journal of Engineering and Techniques - Volume 1 Issue 3, May - June 2015
ISSN: 2395-1303 http://www.ijetjournal.org Page 94
TOA and DOA Joint Estimation Using Successive
MUSIC Algorithm in IR-UWB Positioning
Systems
A.Eswari1
,T. Ravi Kumar Naidu2
,T.V.S.Gowtham Prasad3
1
Dept. of ECE, SVEC, Tirupati, Andhra Pradesh, India
2
Dept. of ECE, SVEC, Tirupati, Andhra Pradesh, India
3
Dept. of ECE, SVEC, Tirupati, Andhra Pradesh, India
I. INTRODUCTION
Position information is one of the key
requirements for a Wireless Sensor Network (WSN) [1]
to function as intended. An Impulse Radio Ultra
Wideband (IR-UWB) positioning system provides an
excellent means for wireless positioning [2] due to its
high resolution capability in the time domain. UWB
systems refers to the systems with very large bandwidth
which offers several advantages including high data rate,
low complexity, low cost implementation, low power
consumption, resistance to interference, covert
transmission and high anti-multipath effects which has
made UWB widely used in radars, localization, tracking,
sensor networks, positioning and imaging [3],[4].Short
range high speed communication is the most popular
application of the UWB. Time of arrival (TOA) and
Direction of arrival (DOA) [5] are the key signal
parameters to estimate in the positioning systems.
TOA estimation techniques are classified into two
categories: cross-correlation based and super resolution
based. The cross correlation based estimation methods
cannot fulfil the required accuracy for many applications
because it provides very low resolution and limited
bandwidth. To achieve the desired accuracy super
resolution techniques have been proposed for the TOA
estimation [6],[7]. These techniques offers high
resolution spectral estimation with good accuracy and
are applied after the estimated channel impulse response
is transformed to frequency domain.
DOA estimation [8],[9] techniques are classified into
three methods: spectral based, parametric based and sub-
space based methods. In this paper sub-space based
DOA estimation methods are considered for UWB
signals. In the sub-space based DOA estimation methods
there are several algorithms which are MUSIC algorithm
[10],[11], Root-MUSIC algorithm, ESPRIT algorithm,
Matrix pencil algorithm, Propagator method.
RESEARCH ARTICLE OPEN ACCESS
Abstract:
A Wireless Sensor Network (WSN) is an autonomous and self-organizing network without any pre-established
infrastructure which offers many advantages in military applications and emergency areas. Source Localization is one of the
important monitoring tasks of the WSN. It provides the accurate position of the source using various positioning
technologies. In this paper an Impulse Radio Ultra wideband (IR-UWB) positioning system with a two-antenna receiver is
used to estimate the Time of arrival (TOA) and Direction of arrival (DOA) positioning parameters. A two dimensional (2D)
multiple signal classification (MUSIC) algorithm is used to estimate these parameters but it has much higher computational
complexity and also requires 2D spectral peak search. A Successive Multiple signal classification (MUSIC) algorithm is
proposed in this paper which estimates the parameters jointly and gets paired automatically. It avoids the two dimensional
peak searches and reduces the complexity compared to the existing methods 2D-MUSIC, Root-MUSIC, Matrix Pencil
algorithm, Propagator method and Estimation of Signal Parameters via Rotational Invariance Techniques (ESPRIT)
algorithm.
Keywords--Time of arrival (TOA), Direction of arrival (DOA), Impulse Radio Ultra Wideband (IR-UWB), Multiple
Signal Classification (MUSIC).](https://image.slidesharecdn.com/ijet-v1i3p16-150618185603-lva1-app6892/75/IJET-V1I3P16-Authors-A-Eswari-T-Ravi-Kumar-Naidu-T-V-S-Gowtham-Prasad-1-2048.jpg)
![International Journal of Engineering and Techniques - Volume 1 Issue 3, May - June 2015
ISSN: 2395-1303 http://www.ijetjournal.org Page 95
In this paper two dimensional (2D) multiple signal
classification (MUSIC) algorithm is employed first to
estimate the Time of Arrival (TOA). This 2D-MUSIC
algorithm is here extended to estimate jointly the Time
of Arrival (TOA) and the Direction of Arrival (DOA) in
Impulse Radio-Ultra Wideband (IR-UWB) systems
[12],[13]. It solves the pairing problem but renders much
higher computational complexity. To reduce the
computational complexity a Successive MUSIC
algorithm is proposed in this paper for joint TOA and
DOA estimation in IR-UWB system with a two-antenna
receiver. This proposed algorithm firstly gets the initial
estimates of TOA corresponding to the first antenna and
then simplifies the 2D global search into successive one-
dimensional (1D) searches through which the TOAs in
the two antennas are estimated. Then the DOA estimates
are obtained from the difference of the TOAs between
the two antennas.
The proposed Successive MUSIC algorithm has the
following advantages:
• Parameters are automatically paired.
• Lower computational complexity.
• Better Parameter estimation performance.
II. SYSTEM MODEL
The received UWB signal of an IR-UWB system can be
expressed as the convolution of transmitted signal s(t)
and impulse response ℎ which is shown as:
= ∗ ℎ + 1
Where ‘*’ denotes the convolution and
represents the additive Gaussian white noise in the kth
cluster.
The transmitted signal is given as
= − −
!
!
2
With w(t) denoting the received UWB pulse where
Tsand Tcrepresents the symbol and chip duration and Nc
the number of pulses representing one information
symbol. The direct sequence binary phase shift keying
(DS-BPSK) modulation is assumed, with representing
bj∈ {−1,+1} as the bi-phase modulated data sequence,
cm∈ {−1,+1} as the user-specific code sequence. The
UWB channel is expressed in a period composed of K
clusters and L multiple paths included in each cluster.
The UWB channel impulse response in the kth cluster
can be expressed by
ℎ = $% & − '%
(
%
3
Where δ(t)is the Dirac delta function, '% is the
propagation delay of the lth path relative to the kth
cluster and $% represent random complex fading
amplitude.
Transforming the received signal to the frequency
domain, we can obtain
* + = , + - + + . +
= $% , + / 012
(
%
+ . + 4
where * + , , + , - + , . + are Fourier
transform of , , ℎ , respectively.
Then the frequency domain signal model can be
obtained by sampling equation (4) at +5 = Δ+for m=
0, 1,. . . ,M− 1 and Δ+ = 27 8 8 > :⁄ , and
rearranging the frequency samples * + into
vector < = =* + , … . . * +@ A
B
∈ ℂ@×
as
< = ,E1$ < + < 5
Where S ∈CM×M
is a diagonal matrix whose components
are the frequency samples , +5 and E1 = GH , … … .,
H(I ∈ ℂ@×(
is a delay matrix with the column vectors
being H% = G1, / J1K, … , / @ J1KIBfor l = 1, 2, . . . ,
L. The channel fading coefficients of kth cluster are
arranged in the vector $ < = L$ , … . , $( M
B
∈
ℂ@×
, and the noise samples in vector < =
=. + , … . , . +@ A
B
∈ ℂ@×
. Here M refers
to the discrete Fourier transform (DFT) of the UWB
signal.
III. TOA AND DOAJOINT ESTIMATION
UWB sources are considered which are located in the far
field from the array consisting of two antennas, which is
shown in Fig. 1. We assume the TOAs associated to the
lth path in the antenna 1 and antenna 2 for l = 1,
2, . . . ,Las N%and O%.](https://image.slidesharecdn.com/ijet-v1i3p16-150618185603-lva1-app6892/85/IJET-V1I3P16-Authors-A-Eswari-T-Ravi-Kumar-Naidu-T-V-S-Gowtham-Prasad-2-320.jpg)
![International Journal of Engineering and Techniques - Volume 1 Issue 3, May - June 2015
ISSN: 2395-1303 http://www.ijetjournal.org Page 96
Fig 1. Antenna array structure for TOA and DOA joint
estimation
The received signals in the frequency domain at each
antenna are expressed as
P = ,EQR + . 6
PT = ,EUR + .T 7
WhereS = diag([S(ω0), . . . , S(ωM−1)])is a diagonal
matrix whose components are the frequency samples of
transmitted UWB signal s(t), F = Gα 1 , . . . , α X I ∈
ℂY×Z
represents the channel random complex fading
coefficients, . = G 1 , … . , X I ∈ ℂY×Z
and
.T = G T 1 , … . , T X I ∈ ℂY×Z
represents the noise
samples of antenna 1 and antenna 2 respectively.
EQandEUcan be denoted as follows:
EQ
= [
1
/ 0QK
⋮
/ @ 0QK
1
/ 0Q^
⋮
/ @ 0Q^
…
…
⋱
…
1
/ 0Q`
⋮
/ @ 0Q`
a 8
EU
= [
1
/ 0UK
⋮
/ @ 0UK
1
/ 0U^
⋮
/ @ 0U^
…
…
⋱
…
1
/ 0U`
⋮
/ @ 0U`
a 9
From Fig. 1we get
∆'%e =
f sin j%
10
And
j%
l = H sin m
Δ'%e
f
n , o = 1,2, . . . , : 11
withj%being the DOA of the lth path, d,the distance
between the two antennas, and c,the speed of light and
∆'%e = O%e − N%
l , which is the difference of the TOAs
associated to the lth path.
So in order to obtain the estimation of DOAs we need to
estimate the TOAs in the two antennas first. The
estimation of TOAs is discussed in the following section.
A. 2D-MUSIC Algorithm for TOA Estimation
A matrix Z ∈ℂTY×Z
is taken as shown below
p = q
P
PT
r = q
,EQ
,EU
r R + q
.
.T
r 12
Let A(β,γ) =q
,EQ
,EU
r∈ℂTY×s
and N = L
.
.
M∈ℂTY×t
.
Hence the matrix Z can be written as Z = A(β,γ) F + N.
The covariance matrix *u is taken as *u = ppv
/ X .
Eigenvalue decomposition is performed for the
covariance matrix *u to get the signal subspace
xl ∈ℂTY×s
and noise subspace xl ∈ℂTY× TY s
. Then
we can establish the 2D-MUSIC spatial spectrum
function in this form
yTz @{|}~ N, O =
1
H N, O vxl xl v
H N, O
13
WhereH N, O is the column vector of matrix A(β,γ).
Hence we take the L largest peaks of yTz @{|}~ N, O as
the estimates of the TOAs. Obviously, the multipath
delays in the two antennas can be accurately estimated
via 2D-MUSIC, in which the exhaustive 2D search,
however, is normally inefficient due to high
computational cost. In the following subsections, we
present another MUSIC algorithm, which qualifies the
TOA estimation just through the 1D search.
B. Successive MUSIC Algorithm for 2D-TOA
Estimation
In this paper Successive MUSIC algorithm for angle
estimation in multiple-input multiple-output radar is
extended to the UWBparameter estimation. Consider X1,
the received signal of antenna 1 in frequency domain,
and perform eigenvalue decomposition of the covariance
matrix *u = P P v
/ Xto get the signal subspace and
noise subspace as
*u = Eu|Λl|Eu|
v
+ Eu Λl Eu v
14
Where Λl| is aL×L diagonal matrix whose diagonal
elements contain the L largest eigenvalues andΛl stands
for a diagonal matrix whose diagonal entries contain the
M– L smallest eigenvalues.Eu|is the matrix composed of
the eigenvectors corresponding to the L largest
eigenvalues of *u while Eu represents the matrix
including the remaining eigenvectors.
Then we construct the 1D MUSIC spectral peak search
function as](https://image.slidesharecdn.com/ijet-v1i3p16-150618185603-lva1-app6892/85/IJET-V1I3P16-Authors-A-Eswari-T-Ravi-Kumar-Naidu-T-V-S-Gowtham-Prasad-3-320.jpg)
![International Journal of Engineering and Techniques - Volume 1 Issue 3, May - June 2015
ISSN: 2395-1303 http://www.ijetjournal.org Page 98
Fig 2. UWB Pulse waveform w(t)
Fig 3. Transmitted Signal S(t)
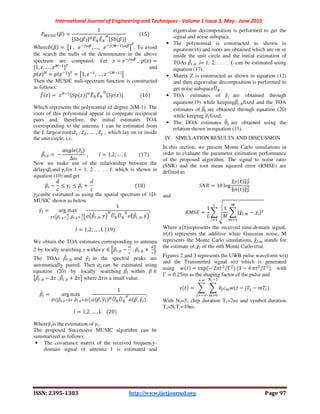
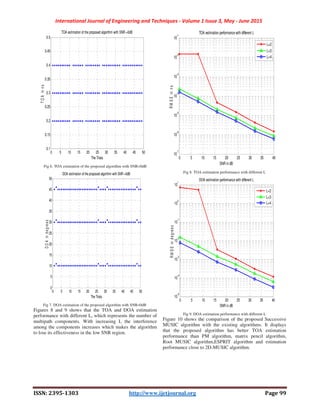
Figures 4 and 5 are the estimated plots of TOAs and DOAs at
[6ns, 15ns, 24ns, 35ns] and [-50°
, -10°, 10°, 30°] respectively.
Fig 4. TOA estimation plot at [6ns,15ns,24ns,35ns]
Fig 5. DOA estimation plot for angles [-50°,-10°,10°,30°]
Figures6 and 7 shows the plot of joint estimation of TOA and
DOA for the proposed algorithm with SNR=0 dB over 50
Monte Carlo simulations. This determines that TOA and DOA
can be estimated using the proposed algorithm and it works
well with low SNR.
-3 -2 -1 0 1 2 3
x 10
-3
-6
-4
-2
0
2
4
6
8
10
12
14
x 10
12
Time in sec
Amplitude(V)
UWB pulse waveform w(t)
0 0.1 0.2 0.3 0.4 0.5 0.6 0.7 0.8 0.9 1
x 10
-8
-3
-2
-1
0
1
2
3
4
5
x 10
-3
Time in Sec
Amplitude(V)
Transmitted signal s(t)
0 5 10 15 20 25 30 35 40
0
0.2
0.4
0.6
0.8
1
1.2
x 10
-3
TOA in nanoSeconds
PMUSICindB
TOA Estimation graph
-100 -80 -60 -40 -20 0 20 40 60 80 100
-5
0
5
10
15
20
25
DOA in Degrees
PMUSICindB
DOA Estimation graph](https://image.slidesharecdn.com/ijet-v1i3p16-150618185603-lva1-app6892/85/IJET-V1I3P16-Authors-A-Eswari-T-Ravi-Kumar-Naidu-T-V-S-Gowtham-Prasad-5-320.jpg)
![International Journal of Engineering and Techniques - Volume 1 Issue 3, May - June 2015
ISSN: 2395-1303 http://www.ijetjournal.org Page 101
Fig 14. Complexity comparison versus Number of multipaths (L)
V. CONCLUSION
A Successive MUSIC algorithm for joint estimation of
TOA and DOA in IR-UWB Positioning systems with a
two-antenna receiver is presented in this paper. The
proposed algorithm obtains the initial estimations of
TOAs in the first antenna and then employs successive
1D search to achieve the estimation of 2D-TOA, and
estimates the DOAs via the difference of TOAs between
the two antennas. This Proposed algorithm can estimate
the parameters jointly and can pair the parameters
automatically. This Successive MUSIC algorithm
provides a significant computational advantage over 2D-
MUSIC algorithm and has better parameter estimation
performance than PM algorithm, matrix pencil algorithm,
Root-MUSIC algorithm and ESPRIT algorithm.
Simulation results illustrate the accuracy and efficacy of
the proposed algorithm in a variety of parameter and
scenarios.
REFERENCES
[1] Georgios Tsivgoulis. Source localization in
wireless sensor networks with randomly
distributed elements under multipath propagation
conditions. March 2009
[2] Mohammad Reza Gholami Positioning
Algorithms for Wireless Sensor Networks.,
Communication Systems Group, Department of
Signals and Systems, Chalmers University of
Technology, Gothenburg,2011
[3] Yang, L. Q., & Giannakis, G. B. (2004). Ultra-
wide band communications: An idea whose time
has come.IEEE Signal Processing Magazine,
21(6), 26–54.
[4] Win, M. Z., & Scholtz, R. A. (2000). Ultra-wide
bandwidth time-hopping spread-spectrum
impulse radio for wireless multiple-access
communications. IEEE Transactions on
Communications, 48(4), 679–691.
[5] Seyed A. (Reza) Zekavat and R. Michael
Buehrer Edited “Handbook of Position
Location: Theory, Practice, and Advances”,
First Edition. © 2012 the Institute of Electrical
and Electronics Engineers, Inc. Published 2012
by John Wiley & Sons, Inc.
[6] Yunxing Ye. Sensitivity Analysis for
Measurements of Multipath Parameters
Pertinent to TOA based Indoor Geolocation.
November 2009
[7] I. Guvenc and Z. Sahinoglu. Threshold-Based
TOA Estimation for Impulse Radio UWB
Systems. TR2005-026 December 2005
[8] Xiaoguang WU, Tianwen GUO.Direction of
Arrival Parametric Estimation and Simulation
Based on MATLAB. X. Wu et al. /Journal of
Computational Information Systems 6:14 (2010)
4723-4731.
[9] Yeo-Sun Yoon, Lance M. Kaplan, and James H.
McClellan. ‘‘Direction-of-Arrival Estimation of
Wideband Signal Sources Using Arbitrary
Shaped Multidimensional Arrays,’’ IEEE Int.
Conf. Acoustics, Speech, and Signal Processing,
Montreal, Canada, May 2004.
[10] Kaveh, Mostafa; Barabell, A., "The
statistical performance of the MUSIC and the
minimum-norm algorithms in resolving plane
waves in noise," Acoustics, Speech and Signal
2 4 6 8 10 12 14
10
2
10
4
10
6
10
8
10
10
10
12
Number ofmultipaths (L)
Complexity
Complexity comparison with different L (m = 2000, n = 100)
Root Music
Successive MUSIC algorithm
PM
Matrix Pencil
ESPRIT
2D Music](https://image.slidesharecdn.com/ijet-v1i3p16-150618185603-lva1-app6892/85/IJET-V1I3P16-Authors-A-Eswari-T-Ravi-Kumar-Naidu-T-V-S-Gowtham-Prasad-8-320.jpg)
![International Journal of Engineering and Techniques - Volume 1 Issue 3, May - June 2015
ISSN: 2395-1303 http://www.ijetjournal.org Page 102
Processing, IEEE Transactions on , vol.34, no.2,
pp.331,341, Apr 1986.
[11] Stoica, Petre; Nehorai Arye, "MUSIC,
maximum likelihood, and Cramer-Rao
bound," Acoustics, Speech and Signal
Processing, IEEE Transactions on , vol.37, no.5,
pp.720,741, May 1989.
[12] Navarro, M.; Najar, M., "Frequency
Domain Joint TOA and DOA Estimation in IR-
UWB," Wireless Communications, IEEE
Transactions on, vol.10, no.10, pp.1,11, October
2011.
[13] Jin He; Swamy, M.N.S.; Ahmad, M.O.,
"Joint DOD and DOA Estimation for MIMO
Array With Velocity Receive Sensors," Signal
Processing Letters, IEEE , vol.18, no.7,
pp.399,402, July 2011.
BIOGRAPHY
Ms. A.Eswari, P.G Student, Dept of
ECE, SreeVidyanikethan
Engineering College, A.
Rangampet, Tirupati received
B.Tech in Electronics and
Communication Engineering from
YITS, Tirupati. Interesting Areas
Digital Signal Processing, Array
Signal Processing, Digital
Communications, Image Processing.
Mr. T .Ravi Kumar Naidu
Assistant Professor, Dept of ECE,
Sree Vidyanikethan Engineering
College, A. Rang ampet, Tirupati
received B.Tech in Electronics and
Communication Engineering from
SVPCET, Puttur and M.Tech
received from HIET affiliated to
JNTUH, Hyderabad. Interesting
Areas Digital Signal Processing, Array Signal
Processing, Image Processing, Video Surveillance,
Embedded Systems, Digital Communications.
Mr. T V S Gowtham Prasad
Assistant Professor, Dept of ECE,
Sree Vidyanikethan Engineering
College, A. Rangampet, Tirupati received B.Tech in
Electronics and Communication Engineering from
SVEC, A .Rangampet, Tirupati and M.Tech received
from S V University college of Engineering, Tirupati.
Pursuing Ph.D from JNTU, Anantapur in the field of
Image Processing as ECE faculty. Interesting Areas are
Digital Signal Processing, Array Signal Processing,
Image Processing, Video Surveillance, Embedded
Systems, Digital Communication.](https://image.slidesharecdn.com/ijet-v1i3p16-150618185603-lva1-app6892/85/IJET-V1I3P16-Authors-A-Eswari-T-Ravi-Kumar-Naidu-T-V-S-Gowtham-Prasad-9-320.jpg)
This paper presents a novel successive MUSIC algorithm for joint estimation of time of arrival (TOA) and direction of arrival (DOA) in impulse radio ultra-wideband (IR-UWB) positioning systems with a two-antenna receiver. The proposed algorithm reduces computational complexity compared to existing methods while providing accurate parameter estimation. Simulation results demonstrate its effectiveness in estimating TOA and DOA under low signal-to-noise ratio conditions.


![[IJET-V1I6P3] Authors:Bachwad M.R. , Maske Ashadeep M](https://cdn.slidesharecdn.com/ss_thumbnails/ijet-v1i6p3-151213071300-thumbnail.jpg?width=640&height=640&fit=bounds)
![[IJET-V1I6P10] Authors: Mr.B.V.Sathish Kumar, M.Tech Scholar G.Sumalatha](https://cdn.slidesharecdn.com/ss_thumbnails/ijet-v1i6p10-151213115708-thumbnail.jpg?width=640&height=640&fit=bounds)
![[IJET-V1I4P6] Authors :Galal Ali Hassaan](https://cdn.slidesharecdn.com/ss_thumbnails/ijet-v1i4p6-150802032218-lva1-app6892-thumbnail.jpg?width=640&height=640&fit=bounds)
![[IJET-V2I1P1] Authors:Anshika, Sujit Tak, Sandeep Ugale, Abhishek Pohekar](https://cdn.slidesharecdn.com/ss_thumbnails/ijet-v2i1p1-160427175722-thumbnail.jpg?width=640&height=640&fit=bounds)
![[IJET-V1I3P15] Authors :Deeksha S.](https://cdn.slidesharecdn.com/ss_thumbnails/ijet-v1i3p15-150618183813-lva1-app6892-thumbnail.jpg?width=640&height=640&fit=bounds)
![[IJET-V2I1P8] Authors:Mr. Mayur k Nemade , Porf. S.I.Kolhe](https://cdn.slidesharecdn.com/ss_thumbnails/ijet-v2i1p8-160427182554-thumbnail.jpg?width=640&height=640&fit=bounds)
![[IJET-V1I3P19] Authors :Nilesh B Karande , Nagaraju Bogiri.](https://cdn.slidesharecdn.com/ss_thumbnails/ijet-v1i3p19-150703054417-lva1-app6891-thumbnail.jpg?width=640&height=640&fit=bounds)
![[IJET-V1I2P10] Authors :L. O. Osuman, A. Dosunmu , B .S. Odagme](https://cdn.slidesharecdn.com/ss_thumbnails/ijet-v1i2p10-150506100610-conversion-gate02-thumbnail.jpg?width=640&height=640&fit=bounds)
![[IJET-V1I5P8] Author: Rashmi Jangale, Sujata Khedkar](https://cdn.slidesharecdn.com/ss_thumbnails/ijet-v1i5p8-151120173358-lva1-app6891-thumbnail.jpg?width=640&height=640&fit=bounds)
![[IJET-V1I2P6] Authors :Sarat K Kotamraju, K.Ch.Sri Kavya, A.Gnandeep Reddy, G...](https://cdn.slidesharecdn.com/ss_thumbnails/ijet-v1i2p6-150501052009-conversion-gate02-thumbnail.jpg?width=640&height=640&fit=bounds)
![[IJET-V1I4P1] Authors :T.S.Geetha , Dr.S.SelvakumarRaja](https://cdn.slidesharecdn.com/ss_thumbnails/ijet-v1i4p1-150718061832-lva1-app6891-thumbnail.jpg?width=640&height=640&fit=bounds)
![[IJET-V1I3P10] Authors : Kalaignanam.K, Aishwarya.M, Vasantharaj.K, Kumaresan...](https://cdn.slidesharecdn.com/ss_thumbnails/ijet-v1i3p10-150608055552-lva1-app6892-thumbnail.jpg?width=640&height=640&fit=bounds)
![[IJET-V1I3P9] Authors :Velu.S, Baskar.K, Kumaresan.A, Suruthi.K](https://cdn.slidesharecdn.com/ss_thumbnails/ijet-v1i3p9-150603165341-lva1-app6892-thumbnail.jpg?width=640&height=640&fit=bounds)
![[IJET-V1I2P2] Authors :Karishma Pandey, Madhura Naik, Junaid Qamar,Mahendra P...](https://cdn.slidesharecdn.com/ss_thumbnails/ijet-v1i2p2-150423020658-conversion-gate02-thumbnail.jpg?width=640&height=640&fit=bounds)
![[IJET-V1I3P17] Authors :Prof. U. R. More. S. R. Adhav](https://cdn.slidesharecdn.com/ss_thumbnails/ijet-v1i3p17-150629055352-lva1-app6891-thumbnail.jpg?width=640&height=640&fit=bounds)
![[IJET-V2I2P1] Authors:Aravindan B1, Dhivakar A2, Shreehari V.V.](https://cdn.slidesharecdn.com/ss_thumbnails/ijet-v2i2p1-160427183625-thumbnail.jpg?width=640&height=640&fit=bounds)
![[IJET-V1I5P1] Authors :Ahmed Mohamed Abushnafa, R. K. Pandeyb, Deepak Lalc](https://cdn.slidesharecdn.com/ss_thumbnails/ijet-v1i5p1-150918182007-lva1-app6891-thumbnail.jpg?width=640&height=640&fit=bounds)
![[IJET-V1I3P18] Authors :Galal Ali Hassaan.](https://cdn.slidesharecdn.com/ss_thumbnails/ijet-v1i3p18-150629060030-lva1-app6892-thumbnail.jpg?width=640&height=640&fit=bounds)