Intelligent video surveillance system has emerged as a very important research topic in the computer vision field in the
recent years. It is well suited for a broad range of applications such as to monitor activities at traffic intersections for detecting
congestions and predict the traffic flow. Object classification in the field of video surveillance is a key component of smart
surveillance software. Two robust methodology and algorithms adopted for people and object classification for automated surveillance
systems is proposed in this paper. First method uses background subtraction model for detecting the object motion. The background
subtraction and image segmentation based on morphological transformation for tracking and object classification on highways is
proposed. This algorithm uses erosion followed by dilation on various frames. Proposed algorithm in first method, segments the image
by preserving important edges which improves the adaptive background mixture model and makes the system learn faster and more
accurately. The system used in second method adopts the object detection method without background subtraction because of the static
object detection. Segmentation is done by the bounding box registration technique. Then the classification is done with the multiclass
SVM using the edge histogram as features. The edge histograms are calculated for various bin values in different environment. The
result obtained demonstrates the effectiveness of the proposed approach.
Enhancing Worker Digital Experience: A Hands-on Workshop for Partners
Real Time Object Identification Using Height-Width Classification and SVM
1. International Journal of Computer Applications Technology and Research
Volume 2– Issue 6, 699 - 707, 2013
Real Time Object Identification for Intelligent Video
Surveillance Applications
L.Menaka
R.V.S.College of Engineering
and Technology
Karaikal, India
M.Kalaiselvi Geetha
Annamalai University
Chidambaram, India
M.Chitra
R.V.S.College of Engineering
and Technology
Karaikal, India
Abstract Intelligent video surveillance system has emerged as a very important research topic in the computer vision field in the
recent years. It is well suited for a broad range of applications such as to monitor activities at traffic intersections for detecting
congestions and predict the traffic flow. Object classification in the field of video surveillance is a key component of smart
surveillance software. Two robust methodology and algorithms adopted for people and object classification for automated surveillance
systems is proposed in this paper. First method uses background subtraction model for detecting the object motion. The background
subtraction and image segmentation based on morphological transformation for tracking and object classification on highways is
proposed. This algorithm uses erosion followed by dilation on various frames. Proposed algorithm in first method, segments the image
by preserving important edges which improves the adaptive background mixture model and makes the system learn faster and more
accurately. The system used in second method adopts the object detection method without background subtraction because of the static
object detection. Segmentation is done by the bounding box registration technique. Then the classification is done with the multiclass
SVM using the edge histogram as features. The edge histograms are calculated for various bin values in different environment. The
result obtained demonstrates the effectiveness of the proposed approach.
Keywords: object classification, SVM, morphological operator, edge histogram
1. INTRODUCTION
In the present scenario, a large amount of security measures
are needed in public areas due to terrorist activities. Manual
surveillance is highly impractical. Hence automated video
surveillance becomes essential. In that rationale, object
identification is the preliminary step. The ability to reliably
detect pedestrians from video data has very important
applications in many fields like, intelligent transportation,
automated surveillance, security, robotics and assistive
technology for visually impaired, advanced human machine
interfaces, automated driver assistance systems in vehicles
etc.
Pedestrian are more vulnerable to accidents and collisions
involving pedestrians often produce severe injuries.
Accurately detecting pedestrians from a video is one of the
most challenging tasks for object detection which attracts
most of the researchers working in this field. This paper
proposes an approach for conditions both pedestrian, vehicle
and tree identification in real time with and without
background subtraction technique.
1.1 Difficulties in object identification
The main challenges of vision-based object identification for
automated video surveillance applications are listed below
1.1.1 The image background may be cluttered with
other stationary object:
This is especially obvious for the urban road scenes. This may
complicate the object identification in the video surveillance
system.
1.1.2 Images are captured from a moving platform:
The captured images may contain vehicles and other objects
at different distances, in a background that constantly
changing, when the test vehicle is moving. This makes the
background subtraction technique commonly used to detect
www.ijcat.com
objects in a video surveillance system unsuitable for this
usage.
1.1.3 Variable outdoor illumination conditions:
The illumination of the road environment may change during
different times of day and under different weather conditions.
This may affect the quality of the captured images.
1.1.4 Occlusion and different poses of objects in a
image:
In moving object identification, different poses of pedestrian
and vehicle need to be considered for the accurate
identification. Consideration of different poses of human and
vehicles are difficult in the implementation of video
surveillance system. The occlusion is also unavoidable in the
case of traffic congestion.
2. RELATED WORK
Vision based vehicle detection is an area of research in the
intelligent transportation systems community. In the literature,
many studies have been performed on the static images. A
support vector machine(SVM) approach was used in [1],built
multiple detectors using Haar wavelets, PCA, truncated
wavelet features using neural networks and SVM classifiers.
Template matching is one of the methods used for vehicle
detection and tracking. In this method, Scale Invariant Feature
Transform (SIFT) points were extracted which is invariant to
image scaling and rotation and partially invariant to change in
illumination and 3D rotation. A statistical approach has been
used in [3], performing vehicle detection using principle
component analysis (PCA) and independent component
analysis(ICA) to do classification on a statistical model and
increased its speed by modeling the PCA and ICA vectors
with the weighted Gaussian mixture model. A review of ecent
template matching methods for detection and tracking of
vehicle is presented in [4]. The binary classification scheme is
699
2. International Journal of Computer Applications Technology and Research
Volume 2– Issue 6, 699 - 707, 2013
an efficient tool which can be used for object detection and
matching which is described in [7].
There are many technologies that are currently being used for
pedestrian and vehicle detection such as ultrasonic sensors,
Doppler radar sensors piezo-metric sensors etc which is
presented in [8]. These sensors while being very effective
have various drawbacks ranging from cost effectiveness to
durability. The ―irregular blobs‖ can be detected and then
cluster the pieces according to the common motion constraint
of the extracted features. It reduces the computational costs by
limiting the feature analysis only to ―irregular blobs‖ is
presented in [9]. Using 2D and 3D models for detection has
also been explored by several authors. A 3D model-based
detection approach with background subtraction is presented
in [11]. The 2D templates has been created from the 3D
vehicle models which is used to generate multiple hypotheses
for a given foreground mask. This approach use only the
template contours, so like the feature based approaches, its
performance on noisy, low resolution and crowded scenes is
uncertain.
The partial occlusion problem is addressed by a feature based
tracking algorithm in [14]. The detection is done based on the
―corner‖ features and then grouped them according to a
―common motion constraint‖. However, both algorithms
depend purely on the accuracy of feature detection and
matching, which makes them error prone in noisy, low
resolution videos. Common motion constraint is not
applicable in very crowded scenes, where the vehicles are
forced to move at similar speeds. Video based detection
emerged as an important aspect of research, as proliferation
high performance cameras and faster inexpensive computing
systems became assessable.
This paper introduces two methods at detection stage. First
method for classifies the objects using height and width.
Second method classifies the object by Support Vector
Machine (SVM) classifier. The method combines edge
histogram and SVM. The training of the SVM classifier is
carried out offline.
The proposed classification procedure is useful not only
for increasing the speed and reliability of feature matching but
also for reducing the computational load associated with the
robust estimation of the registration parameters.
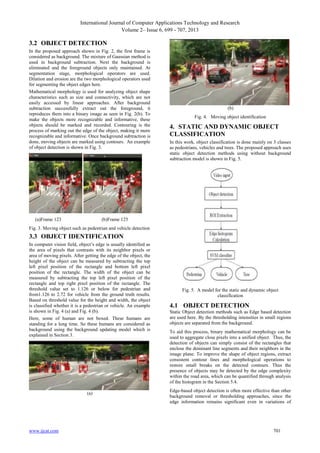
3. HEIGHT – WIDTH BASED
CLASSIFICATION
Fig. 1. A model for height-width based approach
Objects must be initially classified as pedestrians or vehicles.
(1)
Where, x random variable
Mixing coefficient of the
Mean of the
Gaussian
Gaussian
Covariance of the
Gaussian
Mixture of Gaussians robustly deal with lighting changes,
repetitive motions, clutter, introducing or removing objects
from the scene and slowly moving objects. It can be updated
without having to store large number of frames in buffer
hence reducing memory costs. The learning rate is passed into
MOG model. The learning rate is the rate at which the model
adapts to changes in the video image. Low values correspond
to a slowly adapting model. High values make the model
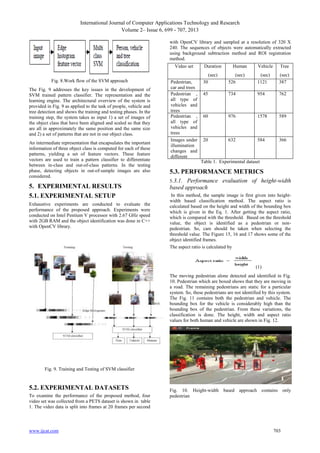
adapt quickly to scene changes. An example of Background
subtraction is shown in Fig. 2(a) and Fig. 2(b).
3.1. BACKGROUND SUBTRACTION
The main reason of using background subtraction is that it
works well if the background is static for long time. In traffic
surveillance system, camera often remains static. This
approach uses mixture of Gaussian for background
subtraction.
The proposed approach uses height-width based classification
method as seen in Fig. 1.
3.1.1. Mixture of Gaussians
Mixture of Gaussians method maintains a density
function for every pixel and is capable of handling multi
model backgrounds as in Eq. (1)
www.ijcat.com
Fig. 2 (a). Input frame
Fig. 2(b). Background
subtracted frame
700
3. International Journal of Computer Applications Technology and Research
Volume 2– Issue 6, 699 - 707, 2013
3.2 OBJECT DETECTION
In the proposed approach shown in Fig. 2, the first frame is
considered as background. The mixture of Gaussian method is
used in background subtraction. Next the background is
eliminated and the foreground objects only maintained. At
segmentation stage, morphological operators are used.
Dilation and erosion are the two morphological operators used
for segmenting the object edges here.
Mathematical morphology is used for analyzing object shape
characteristics such as size and connectivity, which are not
easily accessed by linear approaches. After background
subtraction successfully extract out the foreground, it
reproduces them into a binary image as seen in Fig. 2(b). To
make the objects more recognizable and informative, these
objects should be marked and recorded. Contouring is the
process of marking out the edge of the object, making it more
recognizable and informative. Once background subtraction is
done, moving objects are marked using contours. An example
of object detection is shown in Fig. 3.
(a)Frame 123
(b)
Fig. 4. Moving object identification
4. STATIC AND DYNAMIC OBJECT
CLASSIFICATION
In this work, object classification is done mainly on 3 classes
as pedestrians, vehicles and trees. The proposed approach uses
static object detection methods using without background
subtraction model is shown in Fig. 5.
(b)Frame 125
Fig. 3. Moving object such as pedestrian and vehicle detection
3.3 OBJECT IDENTIFICATION
In computer vision field, object’s edge is usually identified as
the area of pixels that contrasts with its neighbor pixels or
area of moving pixels. After getting the edge of the object, the
height of the object can be measured by subtracting the top
left pixel position of the rectangle and bottom left pixel
position of the rectangle. The width of the object can be
measured by subtracting the top left pixel position of the
rectangle and top right pixel position of the rectangle. The
threshold value set to 1.126 or below for pedestrian and
from1.126 to 2.72 for vehicle from the ground truth results.
Based on threshold value for the height and width, the object
is classified whether it is a pedestrian or vehicle. An example
is shown in Fig. 4 (a) and Fig. 4 (b).
Here, some of human are not boxed. These humans are
standing for a long time. So these humans are considered as
background using the background updating model which is
explained in Section 3.
(a)
www.ijcat.com
Fig. 5. A model for the static and dynamic object
classification
4.1 OBJECT DETECTION
Static Object detection methods such as Edge based detection
are used here. By the thresholding intensities in small regions
objects are separated from the background.
To aid this process, binary mathematical morphology can be
used to aggregate close pixels into a unified object. Thus, the
detection of objects can simply consist of the rectangles that
enclose the dominant line segments and their neighbors in the
image plane. To improve the shape of object regions, extract
consistent contour lines and morphological operations to
restore small breaks on the detected contours. Thus the
presence of objects may be detected by the edge complexity
within the road area, which can be quantified through analysis
of the histogram in the Section 5.4.
Edge-based object detection is often more effective than other
background removal or thresholding approaches, since the
edge information remains significant even in variations of
701
4. International Journal of Computer Applications Technology and Research
Volume 2– Issue 6, 699 - 707, 2013
ambient lighting. The various frames for object detection is
shown in Fig. 6.
based on the calculated height and width of the rectangle. The
bounding boxes smaller than a given threshold ( height < 42
and width < 22 in this experiment) is discarded which as too
small to contain any of the target objects.
The OpenCV library function cvFindContours is used for
connected-component analysis. For speeding up the tracking
process, the region of interest (ROI) is rectangular and
corresponds to the bounding box of the object. The example
shows that the extracted ROI of pedestrian, vehicle and trees
in Fig. 7. The frames 45 and 52 in Fig. 7 are taken from the
PETS data set.
4.3. EDGE HISTOGRAM
CALCULATION
Fig. 6. Static and dynamic object detection from PETS
dataset
4.2 ROI EXTRACTION
In this project, the next step is to develop a segmentation
strategy to extract the regions of interest (ROI) corresponding
to pedestrians, vehicles and trees in the images. This process
is called as ―bounding box registration‖, since the ROI is
often represented by a bounding box in each video frame. A
simple connected-components algorithm is used to label
regions in the surveillance video. Each such region
In this approach, an object view is represented by a discrete
set of points sampled regularly along the internal or external
contours. For every point, histogram is computed that
approximates the distribution of adjacent point locations
relative to the reference point. The feature vector can be
constructed from edge histogram values of the object. The
histograms vectors used are therefore able to capture
similarity within a class and at the same time discriminate
between different classes.
There is no "best" number of bins, and different bin sizes can
reveal different features of the data. Some theoreticians have
attempted to determine an optimal number of bins, but these
methods generally make strong assumptions about the shape
of the distribution. Depending on the actual data distribution
and the goals of the analysis, different bin widths may be
appropriate. Experimentation is usually needed to determine
appropriate bins. In this work, for the same contour edges,
various histogram bins such as 6, 16, 32 and 64 are used to
calculate the histogram values. The output for these 4
histogram bin values are analyzed and tabulated in Section 5.
4.4. SUPPORT VECTOR MACHINES
(SVM)
SVM is based on the principle of structural risk minimization.
For linearly separable data, SVM finds the separating hyper
plane which separates the data within the largest margin. For,
linearly inseparable data, it maps the data in the input space
into high dimension space
with kernel
function
, to find the separating hyper plane. SVM was
originally developed for two class classification problems.
The N class classification problem can be solved using N
SVMs. Each SVM separates a single class from all the
remaining classes (One-vs.-rest approach).
Given a set of frames corresponding to N classes for training,
N SVMs are trained. Each SVM is trained to distinguish a
class and other classes in the training set. During testing, the
class label y of a class x can be determined using:
y=
Fig. 7. ROI extraction of car, tree and human
Where, dn (x) =max{ di (x)}N i=1, and di (x) is the distance
from x to the SVM hyper plane corresponding to frame i,
the classification threshold is t, and the class label y=0 stands
for unknown. The model for SVM based classification is
given in Fig. 8.
potentially includes both moving and unmoving object. Since,
the classification operates on rectangular regions of pixels
www.ijcat.com
702
5. International Journal of Computer Applications Technology and Research
Volume 2– Issue 6, 699 - 707, 2013
with OpenCV library and sampled at a resolution of 320 X
240. The sequences of objects were automatically extracted
using background subtraction method and ROI registration
method.
Video set
Fig. 8.Work flow of the SVM approach
The Fig. 9 addresses the key issues in the development of
SVM trained pattern classifier. The representation and the
learning engine. The architectural overview of the system is
provided in Fig. 9 as applied to the task of people, vehicle and
tree detection and shows the training and testing phases. In the
training step, the system takes as input 1) a set of images of
the object class that have been aligned and scaled so that they
are all in approximately the same position and the same size
and 2) a set of patterns that are not in our object class.
An intermediate representation that encapsulates the important
information of three object class is computed for each of these
patterns, yielding a set of feature vectors. These feature
vectors are used to train a pattern classifier to differentiate
between in-class and out-of-class patterns. In the testing
phase, detecting objects in out-of-sample images are also
considered.
5. EXPERIMENTAL RESULTS
5.1. EXPERIMENTAL SETUP
Exhaustive experiments are conducted to evaluate the
performance of the proposed approach. Experiments were
conducted on Intel Pentium V processor with 2.67 GHz speed
with 2GB RAM and the object identification was done in C++
with OpenCV library.
Duration
Human
Vehicle
(sec)
(sec)
(sec)
Pedestrian,
30
526
1121
car and trees
Pedestrian , 45
734
954
all type of
vehicles and
trees
Pedestrian , 60
976
1578
all type of
vehicles and
trees
Images under 20
632
584
illumination
changes and
different
Table 1. Experimental dataset
poses
Tree
(sec)
387
762
589
366
5.3. PERFORMANCE METRICS
5.3.1.
Performance evaluation of height-width
based approach
In this method, the sample image is first given into heightwidth based classification method. The aspect ratio is
calculated based on the height and width of the bounding box
which is given in the Eq. 1. After getting the aspect ratio,
which is compared with the threshold. Based on the threshold
value, the object is identified as a pedestrian or nonpedestrian. So, care should be taken when selecting the
threshold value. The Figure 15, 16 and 17 shows some of the
object identified frames.
The aspect ratio is calculated by
(1)
The moving pedestrian alone detected and identified in Fig.
10. Pedestrian which are boxed shows that they are moving in
a road. The remaining pedestrians are static for a particular
system. So, these pedestrians are not identified by this system.
The Fig. 11 contains both the pedestrian and vehicle. The
bounding box for the vehicle is considerably high than the
bounding box of the pedestrian. From these variations, the
classification is done. The height, width and aspect ratio
values for both human and vehicle are shown in Fig. 12.
Fig. 9. Training and Testing of SVM classifier
5.2. EXPERIMENTAL DATASETS
To examine the performance of the proposed method, four
video set was collected from a PETS dataset is shown in table
1. The video data is split into frames at 20 frames per second
www.ijcat.com
Fig. 10. Height-width based approach contains only
pedestrian
703
6. International Journal of Computer Applications Technology and Research
Volume 2– Issue 6, 699 - 707, 2013
TPR is defined by
(2)
Fig. 11. Height-width based approach contains both
pedestrian and vehicle which is nearer to camera
The false positive rate FPR is the proportion of detection that
were not true objects. The FPR is assessed by dividing the
number of false positives by the total number of detections.
This is the percentage of erroneous detection. FPR is a
measure of precision and localization. It is defined by
(3)
Table 2.Performance of height-width based approach
Height-width
based
classification method
Fig. 12. Height-width based approach contains both
pedestrian and vehicle which is far away from camera
This table shows the height, width and aspect ratio (calculated
based on the Eq. 1). The threshold value set to below and
equal to 1.126 for pedestrian and from 1.126 to 2.72 for
vehicle by trial and error after conducting several
experiments. The highlighted box shows the threshold values
such as 1.8, 1.7419, 1.64255, 1.81667 and 1.5617 which
values fall between 1.126 and 2.72. So these boxes are
considered as vehicles. Remaining values are below the 1.126
which are categorized as pedestrian.
In this work, from the ground truth results, the performance
can be evaluated by true positive rate and false positive rate.
This quantity measures recall, precision and localization.
Based on the equation (2) and (3) the area of the ROC curve is
measured
TPR
FPR
(%)
(%)
Pedestrian only
91.1
6.8
Both pedestrian and car
90.9
7.8
Both pedestrian and all
other types of vehicles
91.3
11.2
The table 2 shows the Average true positive ratio and false
positive ratio for 25 frames that containing only pedestrian, 50
frames that containing both pedestrian and only car and 75
frames contain both pedestrian and all types of vehicle.
5.3.2. PERFORMANCE EVALUATION OF STATICDYNAMIC OBJECT CLASSIFICATION METHOD
The training and testing is done with the four video set
represented with its duration in Table2. Three dataset is
generated dynamically at the execution of each video set.
Each dataset contains thousands of images. These videos are
sampled at a resolution of 320X 240 at 20 frames per second.
These video set contains 2034, 2450, 3143 and 1582 images
respectively. The number of human, vehicle and trees are
tabulated for each video set in Table 1.
5.3.2.1. Training set
The training set consists of 10000 positive images and the
class 1, 2 and 3 consists of 3500, 4000 and 2500 respectively.
The images were originated from 3000 properly cropped
object’s front, rear and side view images. Since the vehicles’
rear views are approximately symmetrical, the images were
horizontally flipped to generate the 10000 positive training
samples. The non-symmetric objects were also included in
the training set to make the classifier more robust to remove
any false positives picked up by the processing stage. The
classifier’s model created from the training is then tested on
the evaluation set.
5.3.2.2. Evaluation Set
Fig. 13. Object Classification done under height-width
approach
The true positive rate TPR is the percentage of non occluded
objects in the camera’s view that are detected. TPR is
assessed by dividing the number of truly detected objects by
the total number of objects.
www.ijcat.com
This is an independent set of 3 classes of images not used in
the classifier training. They are reserved for evaluating the
performance of the generated classifier and the estimation of
operating points for the precision-recall plot. Video 1 contains
pedestrian and vehicle of all types. This set contains 2034
positive images. Video 2 and 3 contains pedestrian, vehicle of
all types and trees. This set contains 5593 positive images.
Video 4 contains 1582 images under illumination changes and
different poses.
704
7. International Journal of Computer Applications Technology and Research
Volume 2– Issue 6, 699 - 707, 2013
5.3.3. PERFORMANCE OF FEATURE VECTOR
USING DIFFERENT NUMBER OF HISTOGRAM
BINS
The number of histogram bins determines the fineness of the
details captured by the features. Having too many bins may
capture a lot of irrelevant features originated from the image’s
noise or the background clutter.
Fig. 17. 64 bin histogram
It will also slow down the classification process. On the other
hand, using too few histogram bins may miss out some
important object’s features and thus degrade the classification
performance. In this experiment, the performance of the edge
features with 8, 16, 32 and 64 histogram bins were evaluated
which is shown in Fig. 14, Fig. 15, Fig. 16 and Fig. 17.
Fig. 14. 8 bin histogram
Fig. 15. 16bin histogram
To evaluate the method, True positive (TP), False positive
(FP) and False negative (FN) are used. In a classification task,
the precision for a class is the number of true positives (i.e.
the number of items correctly labeled as belonging to the
positive class) divided by the total number of elements labeled
as belonging to the positive class (i.e. the sum of true
positives and false positives, which are items incorrectly
labeled as belonging to the class). Recall in this context is
defined as the number of true positives divided by the total
number of elements that actually belong to the positive class
(i.e. the sum of true positives and false negatives, which are
items which were not labeled as belonging to the positive
class but should have been).
The terms positive and negative refer to the classifier's
prediction (sometimes known as the expectation), and the
terms true and false refer to whether that prediction
corresponds to the external judgment (sometimes known as
the observation). Statistical metrics such as Precision, Recall,
Accuracy and F-measure (F) gives an overall performance for
this method which is explained in Equation (4), (5), (6) and
(7).
Precision (P) is the proportion of the predicted positive cases
that were correct. High precision means that an algorithm
returned substantially more relevant results than irrelevant.
(4)
Recall (R) is the proportion of positive cases that were
correctly identified. High recall means that an algorithm
returned most of the relevant results.
(5)
A measure that combines precision and recall is the harmonic
mean of precision and recall, the traditional F-measure or
balanced F-score:
Fig. 16. 32 bin histogram
(6)
Accuracy (AC) is the proportion of the total number of
predictions that were correct. The accuracy is the proportion
of true results (both true positives and true negatives) in the
population.
www.ijcat.com
705
8. International Journal of Computer Applications Technology and Research
Volume 2– Issue 6, 699 - 707, 2013
(7)
The above performance metrics can be applied for the
evaluation test video using different histogram bins and the
performance is tabulated. Table 3 shows that the precision,
recall, F-measure value and accuracy for video 1 at different
histogram bin. Table 4 shows that the precision, recall, Fmeasure value and accuracy for video 2 at different histogram
bin. Table 5 shows that the precision, recall, F-measure value
and accuracy for video 3 at different histogram bin. Table 6
shows that the precision, recall, F-measure value and accuracy
for video 3 at different histogram bin. From the values of
these four tables, it can be seen that features with higher
numbers of bins perform better.
Number of
Histogram
bins
8
16
32
64
Precision
( %)
Recall
(%)
F-measure
(%)
Accuracy
(%)
89
90.12
91.12
91.66
87.23
89.12
90.22
90.76
88.11
89.62
90.67
91.20
90.25
91
91.83
92.93
Table 4. Performance of pedestrian, all types of vehicles and
trees as seen in the dataset given in Section 6.2 for various
histograms
Class
Pedestrian
Vehicle
Tree
(%)
(%)
(%)
Pedestrian
91.67
6.67
1.66
Vehicle
3.181
95.45
1.36
5
3.33
91.67
Table 8. Confusion matrix for pedestrian, all types of vehicles
and trees as seen in the dataset given in Section 6.2 with the
64 histogram bins
Class
Vehicle
Tree
(%)
(%)
(%)
Recall
F-measure
Accuracy
Pedestrian
95
1
4
(%)
(%)
(%)
(%)
Vehicle
3.34
95.34
1.32
Tree
0.66
4.66
94.68
89.78
93.16
93.78
95.3
87.43
91.25
92.72
94.1
88.589
92.198
93.24
94.49
91.5
93.12
94
95
Table 9. Confusion matrix for pedestrian, all types of vehicles
and trees as seen in the dataset given in Section 6.2 with the
64 histogram bins
Class
Number of
Histogram
bins
Precision
(%)
8
16
32
64
90
94
96.7
98
Recall
(%)
89
92
92.8
93.1
F-measure
(%)
89.49
92.98
94.71
94.97
Accuracy
(%)
92.5
94
94.83
96
Table 6. Performance of pedestrian, all types of vehicles and
trees under illumination changes and different poses as seen in
the dataset given in Section 6.2 for various histograms
Pedestrian
Vehicle
Tree
(%)
(%)
(%)
Pedestrian
95.625
2.5
1.875
Vehicle
2.245
96.11
1.645
Tree
Table 5. Performance of pedestrian, all types of vehicles and
trees as seen in the dataset given in Section 6.2 for various
histograms
Number
of
Histogram
bins
8
16
32
64
Pedestrian
Precision
Histogram
bins
8
16
32
64
Table 7. Confusion matrix for pedestrian, car and trees as
seen in the dataset given in Section 6.2 with the 64 histogram
bins
Tree
Table 3. Performance of pedestrian, car and trees as seen in
the dataset given in Section 6.2 for various histograms
Number
of
The confusion matrix shows how the predictions are made by
the model. The rows correspond to the known class of the
data, i.e. the labels in the data. The columns correspond to the
predictions made by the model. The value of each of element
in the matrix is the number of predictions made with the class
corresponding to the column for examples with the correct
value as represented by the row. Thus, the diagonal elements
show the number of correct classifications made for each
class, and the off-diagonal elements show the errors made.
2.13
1.39
96.48
Table 10. Confusion matrix for pedestrian, all types of
vehicles and trees under illumination changes and different
poses as seen in the dataset given in Section 6.2 with the 64
histogram bins
Recall
(%)
F-measure
(%)
Accuracy
(%)
69.78
72.34
75.58
84.43
68.54
70.23
72.65
82.12
69.15
71.29
74.08
83.25
67.54
72.25
75.25
84.22
www.ijcat.com
Pedestrian
Vehicle
Tree
(%)
(%)
(%)
Pedestrian
84.12
8.46
7.42
Vehicle
8
83.98
8.02
Tree
Precision
(%)
Class
7.88
7.56
84.56
This table 7, table 8, table 9 and table 10 shows that the
confusion matrix for the three classes of the evaluation video
sets given in the table 1 with 64 histogram bins. The average
accuracy for these videos are 92.93, 95.1, 96.07 and 84.22
respectively. The overall performance of the system is 92.08.
706
9. International Journal of Computer Applications Technology and Research
Volume 2– Issue 6, 699 - 707, 2013
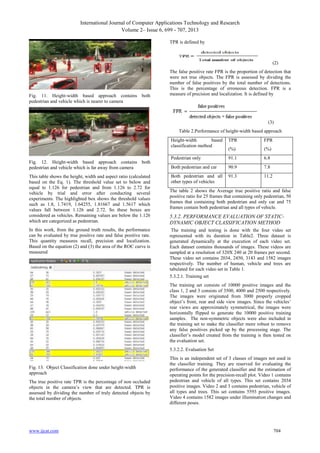
The Fig. 21 shows the graph which is drawn between the Fmeasure and time at seconds. For each video set mentioned in
the table 1, the curve is drawn. In this graph, F-measure value
is saturated between 2 and 3 seconds. From the result, the
video set above 2 seconds gives better performance of the
object identification.
Intelligent Transportation Systems, vol. 9,Issue no. 1, pp. 83–
96, Mar. 2008.
[5] A.Elgammal R.Duraisamy,D.Harwood and Larry S.Devis
,‖ Background & Foreground modeling using non parametric
Kernal density estimation for visual surveillance‖,on
proceeding of the IEEE, vol.90,no 7, pages 1151 - 1163 july
2002.
2. Text Book
[6] The OpenCV Reference Manual Release 2.4.2 published
on july 2012.
3. Conference Proceedings
Fig. 21. Performance of the F-measure value for the 4 video
sets
6. CONCLUSION
In height-width based classification method, background
registration technique, segmentation using morphological
operator and identification using height and width of objects
are presented. The system effectively combines simple
domain knowledge about object classes with time domain
statistical measures to identify target objects in the presence
of partial occlusions. The computational complexity of this
algorithm is linear in the size of a video frame and the number
of objects detected.
In static-dynamic object classification method, object
detection is done without background elimination,
segmentation using bounding box registration technique and
the classification is done with the multiclass svm. A system
has been developed to detect and identify for both dynamic
and static objects on highways efficiently. This paper is
mainly used to control the increasing traffic-flow on highways
and to meet safety and security standards. For Accident
avoidance, static object classification is needed with the
dynamic object classification. As we have considered traffic
on highways there is no question of shadow of any cast such
as trees but sometimes due to occlusions two objects are
merged together and treated as a single entity.
[7]F.Dornaika,san Sebastian, Bilbao, P.Chakik,‖Efficient
object detection and Matching using Feature classification on
Pattern Recognition‖,20th International Conference on Pattern
Recognition(ICPR), 2010 pages 3073 – 3076.
[8] S.Schraml, A.N.Belbachir, N.Brandle,―A Real-Time
Pedestrian Classification Method
for Event-Based
Dynamic Stereo Vision‖ in IEEE 2010.
[9] G. Jun, J. K. Aggarwal, and M. Gokmen, ―Tracking and
segmentation of highway vehicles in cluttered and crowded
scenes‖, in IEEE Workshops on Applications of Computer
Vision, pages 1-6,2008.
[10] Zhenjun Han, Qixiang Ye, and Jianbin Jiao,‖ Online
feature evaluation for object tracking using Kalman Filter‖ in
19th International Conference on Pattern Recognition, 2008.
(ICPR2008), pages 1 –4, 2008.
[11] X. Song and R. Nevatia,‖ A model-based vehicle
segmentation method for tracking‖ IEEE Proceedings of the
10th International Conference. on Computer Vision, pages
1124 - 1131 Vol. 2 2005.
[12] N Dalal, B Triggs,‖Histograms of Oriented Gradients for
Human Detection‖ in Proceedings of the IEEE Computer
Society Conference on Computer Vision and Pattern
Recognition 2005.
REFERENCES
1. Journal Papers
[1] Sayanan sivaraman, mohan manubhai trivedi,
― A
General Active Learning Framework for on-road vehicle
Recognition and tracking‖ in Transactions on Intelligent
Transportation systems, vol no 11, issue 2, pages 267272,June 2010 IEEE.
[2] P. M. Daigavane and P. R. Bajaj, ‖ Real Time Vehicle
Detection and Counting Method for Unsupervised Traffic
Video on Highways‖, International Journal of Computer
Science and Network Security, VOL.10 No.8, pages112117August 2010.
[3]Rajiv Kumar Nath, swapan kumar Deb,
― On Road
Vehicle /Object Detection and Tracking using Template‖, on
Indian Journal of Computer Science and Engineering vol. No
.2 pages 98-107,2009.
[4] C. Wang, J. Lien, ―Automatic vehicle detection using local
features—A statistical approach,‖ IEEE Transactions on
www.ijcat.com
707