Downloaded 18 times


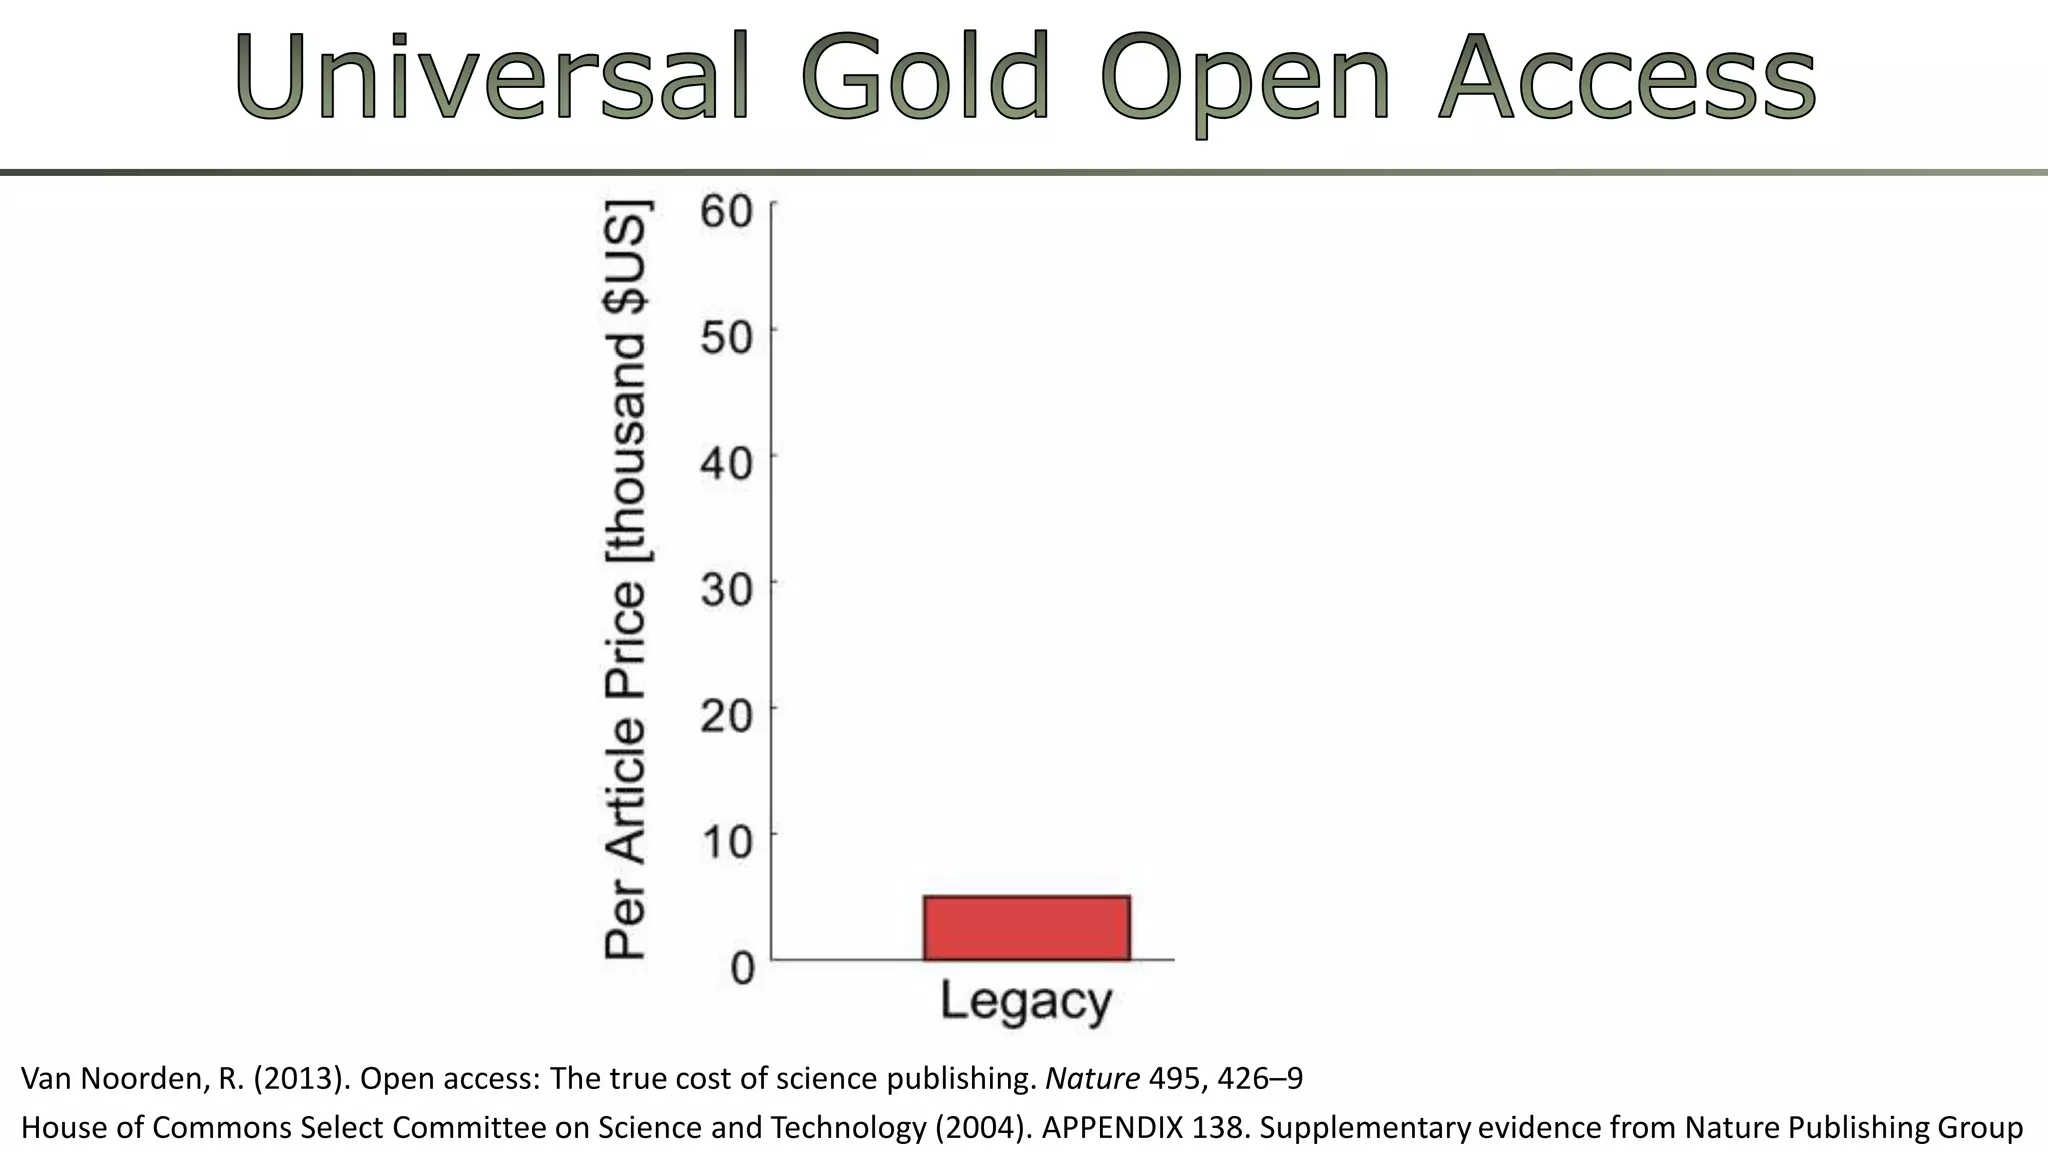


![Costs [thousand US$/article]
Legacy SciELO
(Sources: Van Noorden, R. (2013). Open access: The true cost of science publishing. Nature 495, 426–9; Packer, A. L. (2010). The SciELO Open
Access: A Gold Way from the South. Can. J. High. Educ. 39, 111–126)](https://image.slidesharecdn.com/ambassadorsmuc-141203031407-conversion-gate02/75/If-only-access-were-our-only-infrastructure-problem-27-2048.jpg)

![Potential for innovation: 9.8b p.a.
Costs [thousand US$/article]
Legacy SciELO
(Sources: Van Noorden, R. (2013). Open access: The true cost of science publishing. Nature 495, 426–9; Packer, A. L. (2010). The SciELO Open
Access: A Gold Way from the South. Can. J. High. Educ. 39, 111–126)](https://image.slidesharecdn.com/ambassadorsmuc-141203031407-conversion-gate02/75/If-only-access-were-our-only-infrastructure-problem-38-2048.jpg)

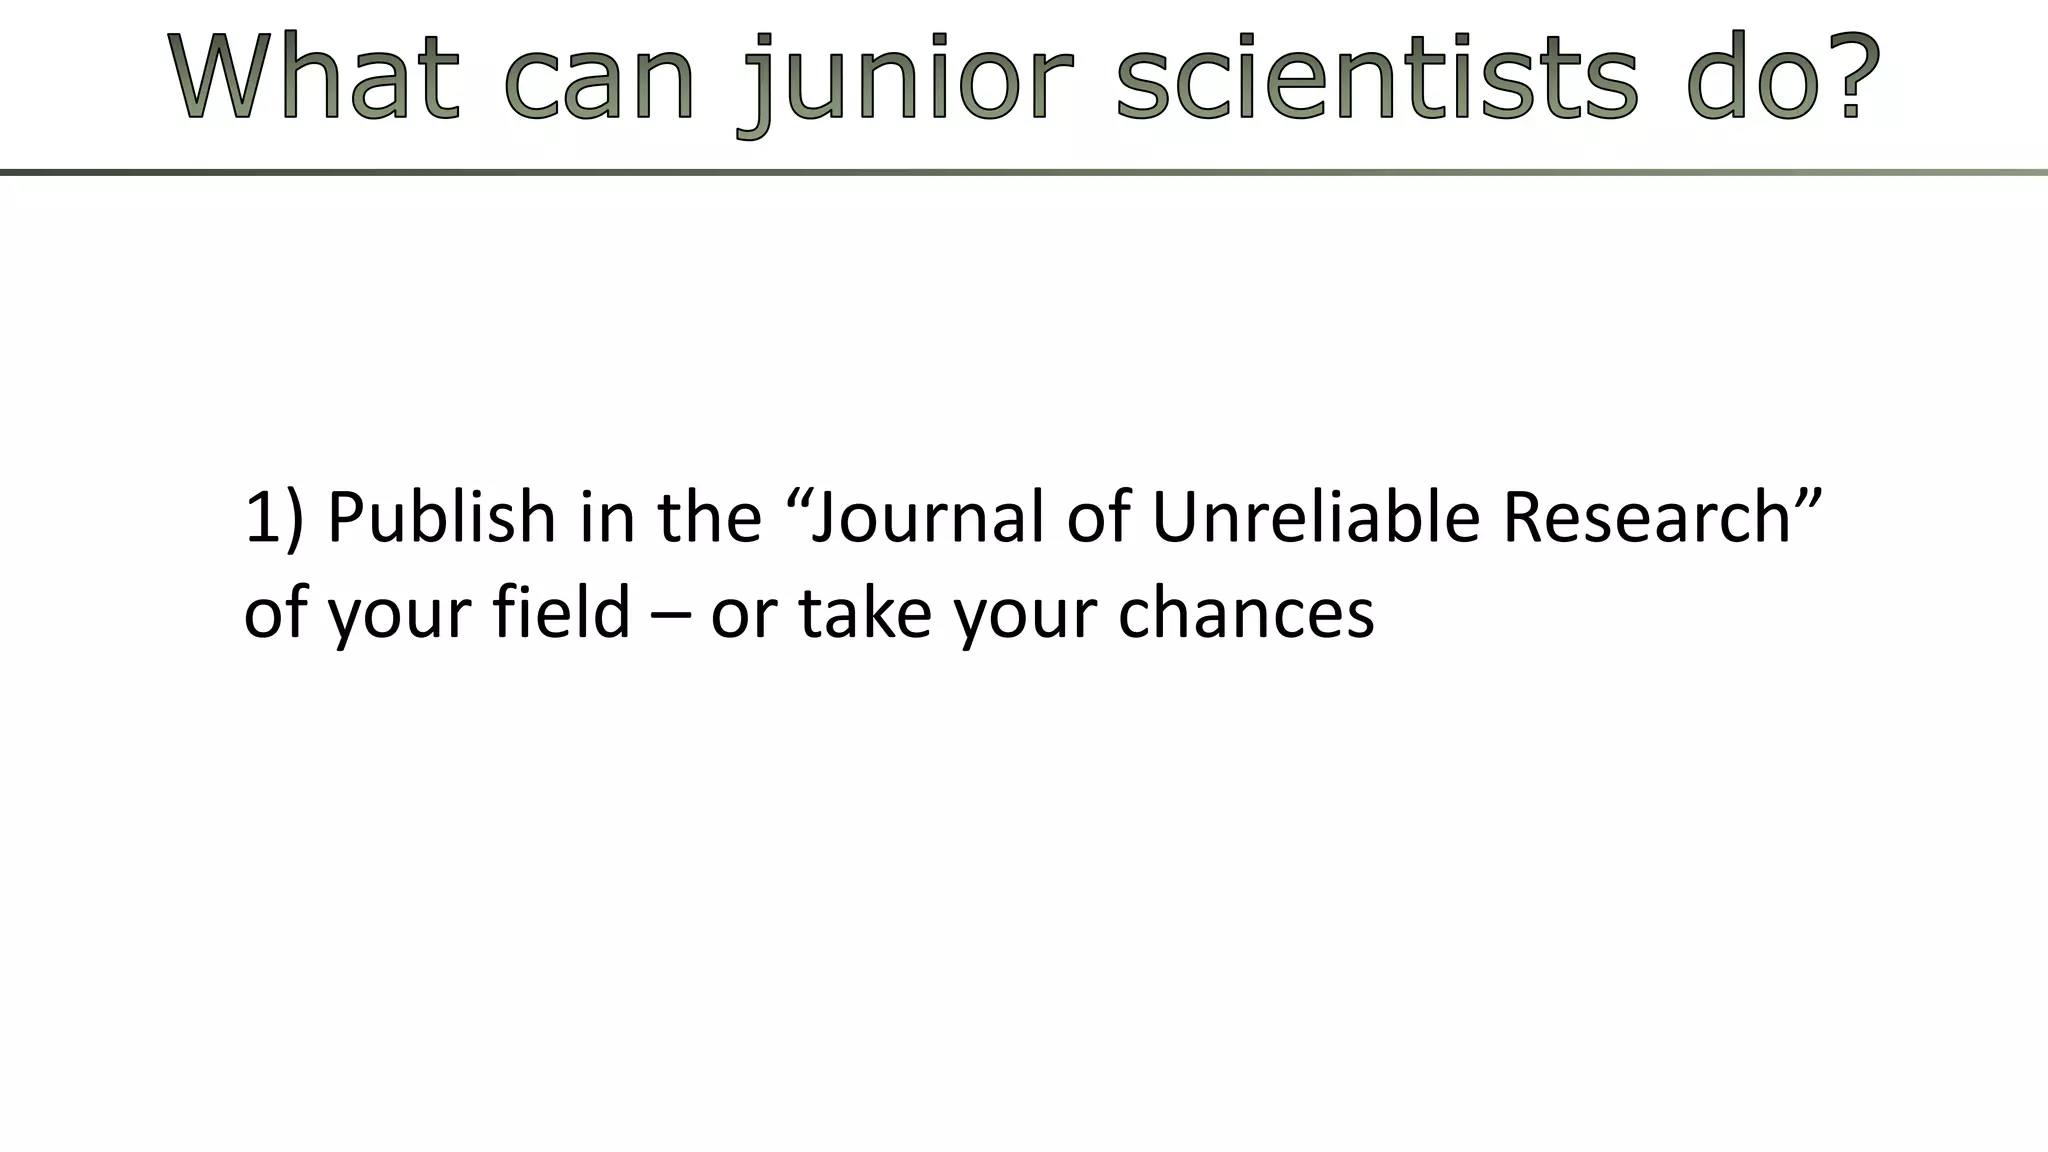
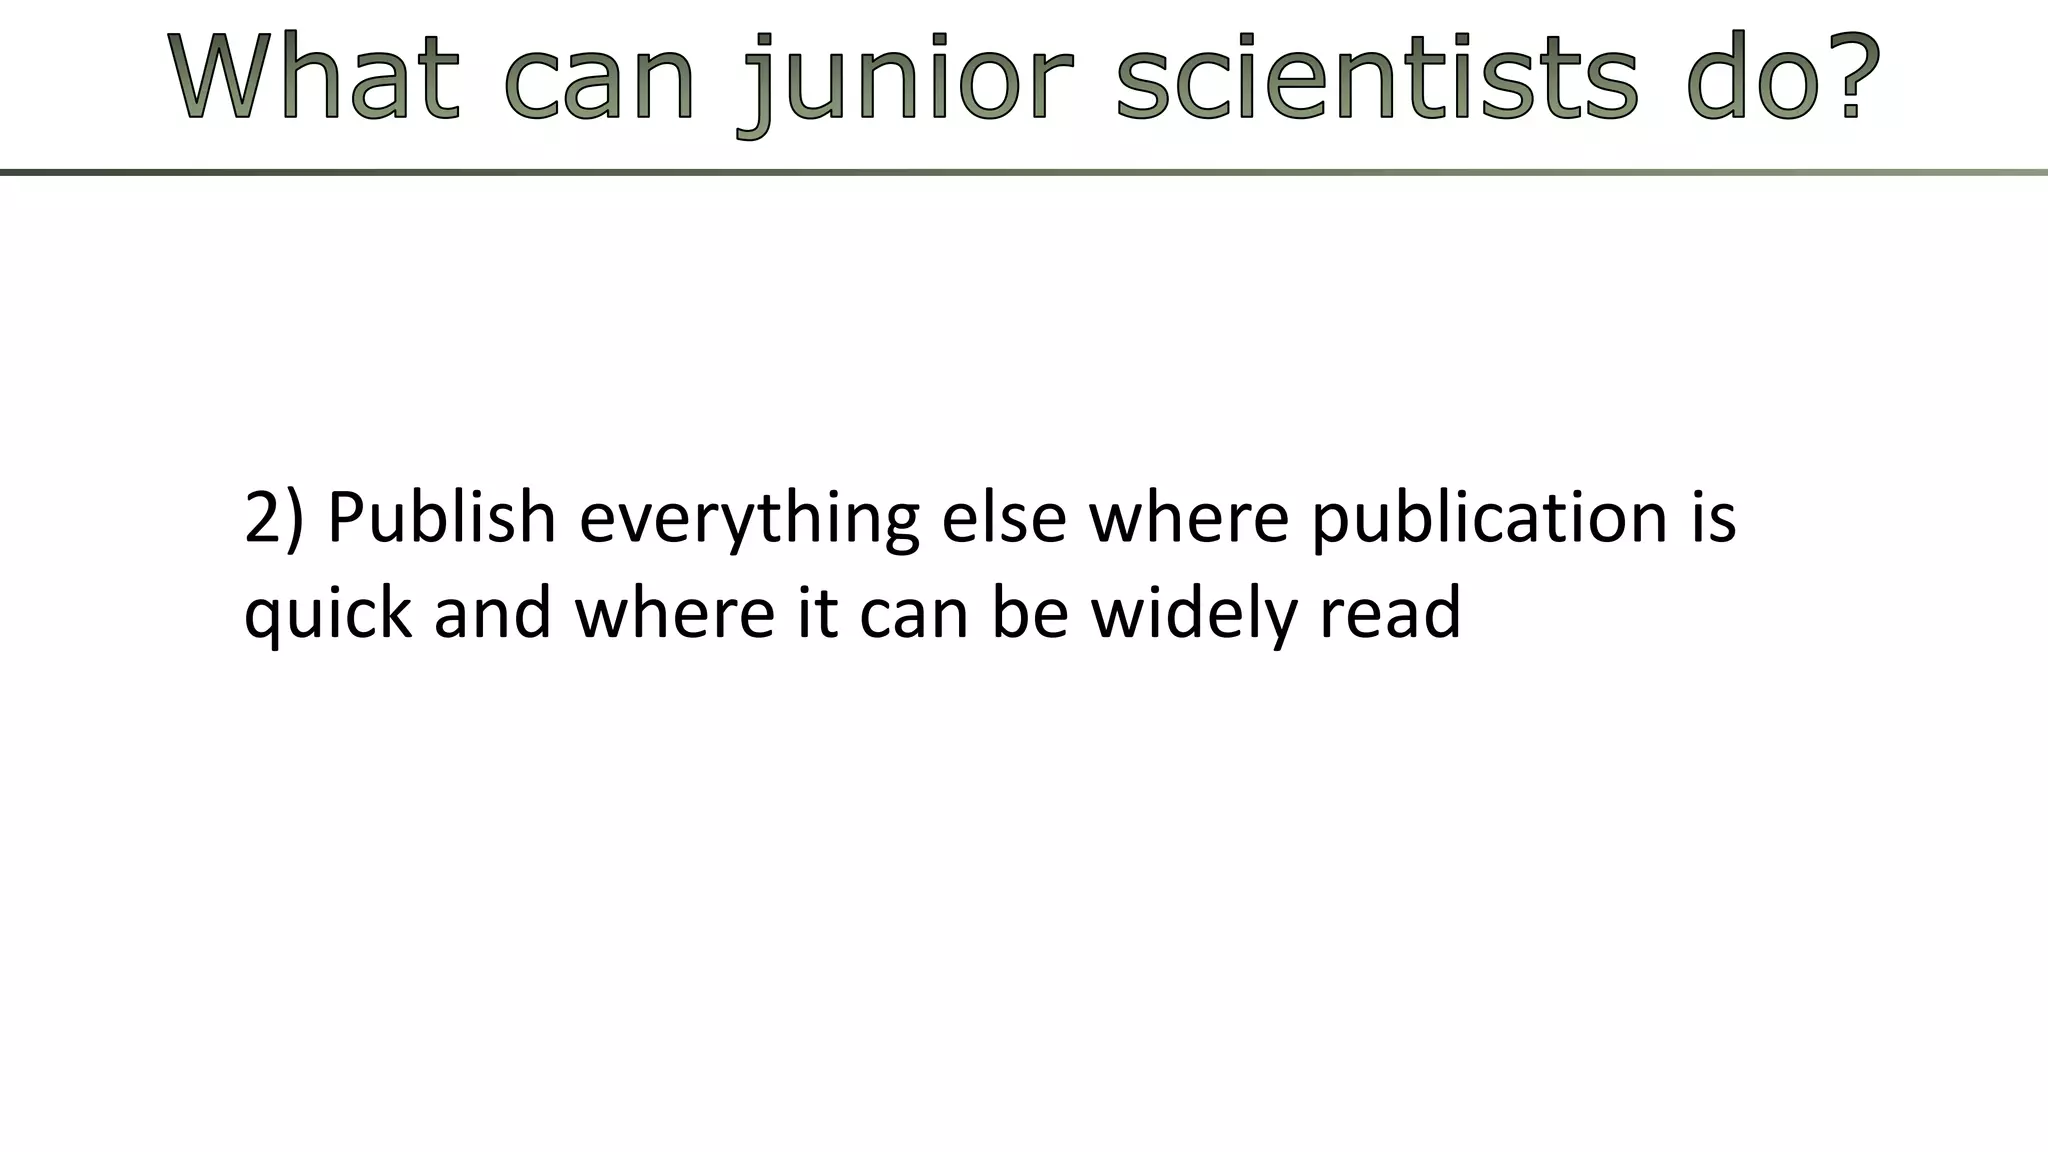
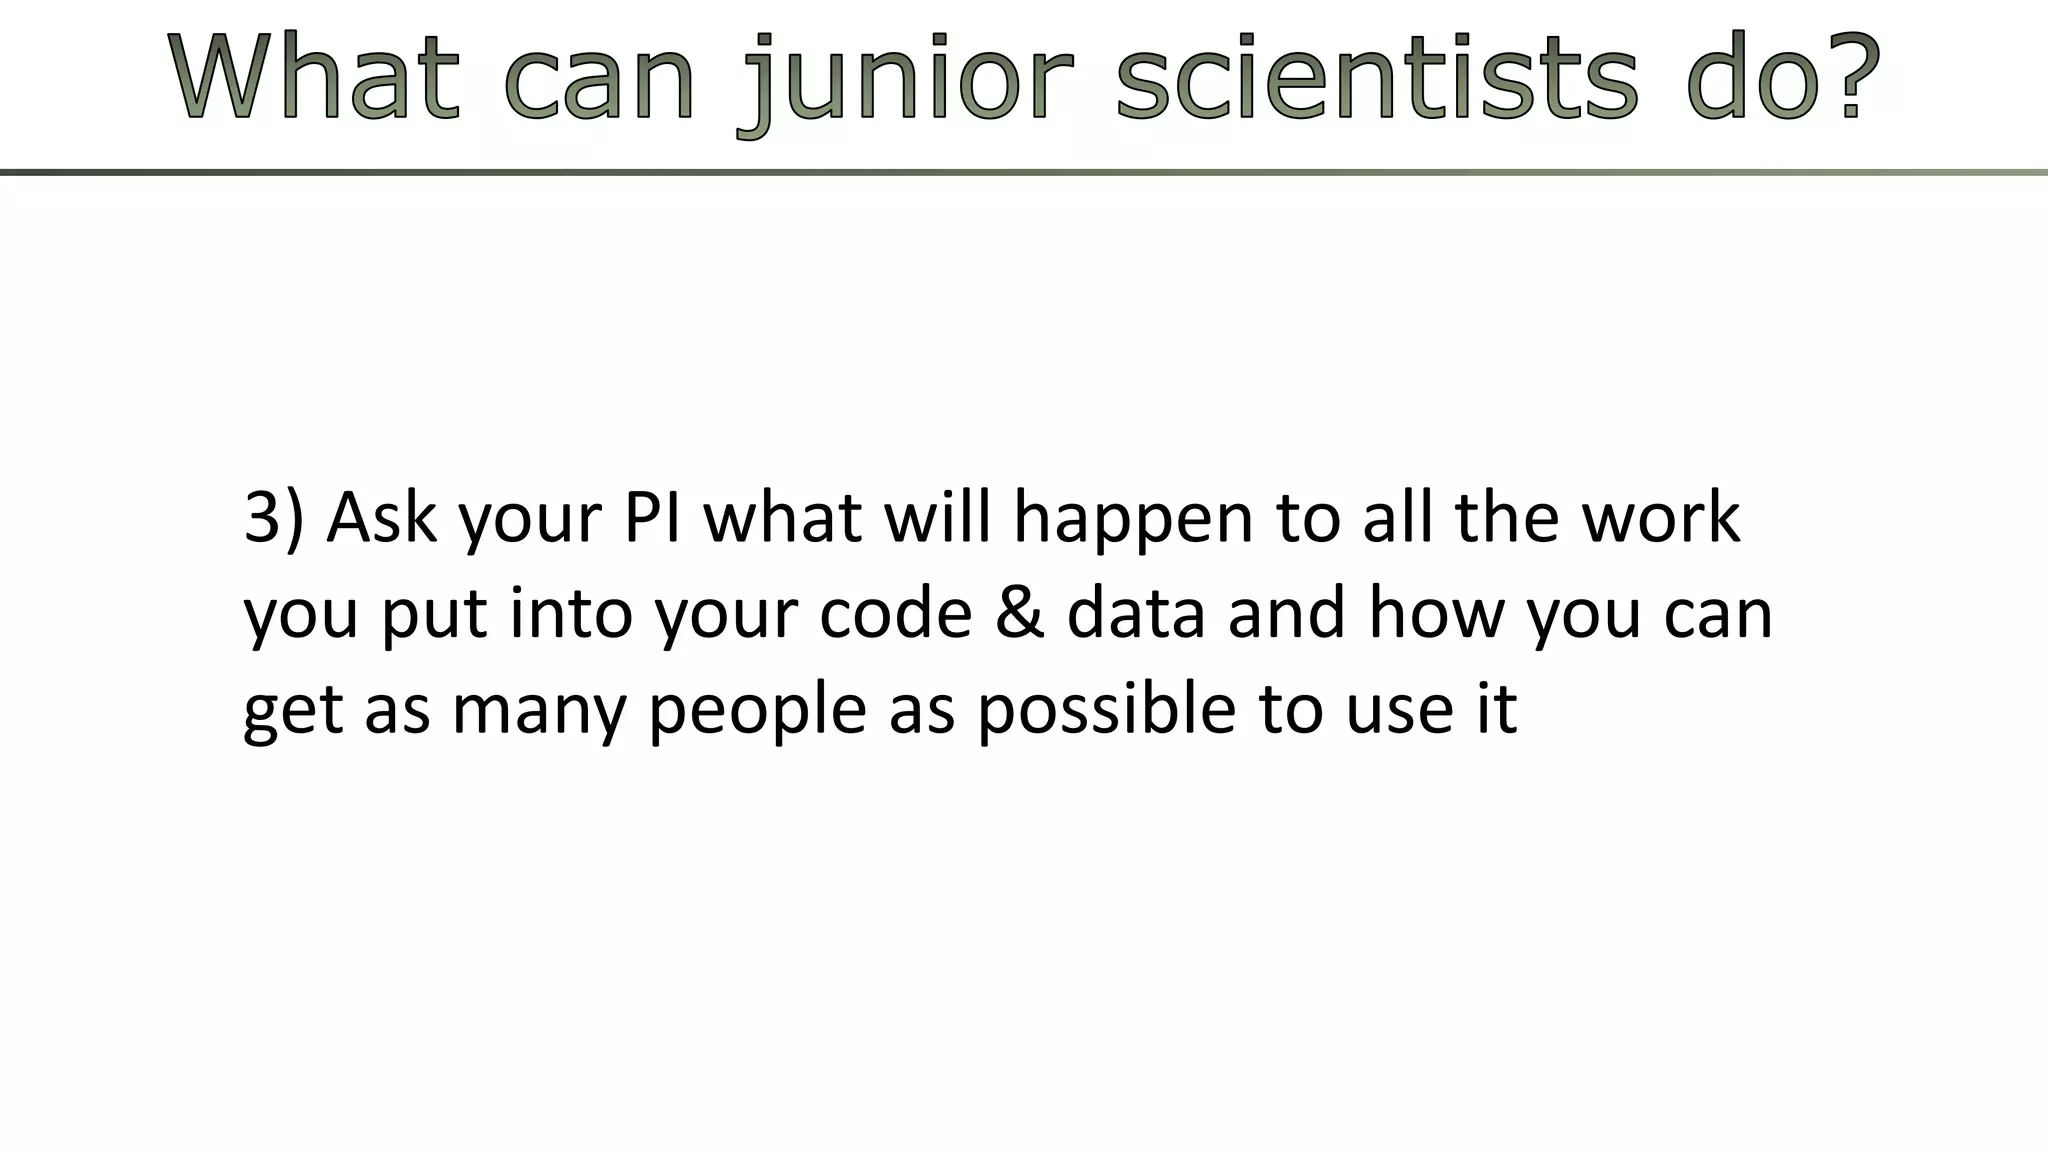
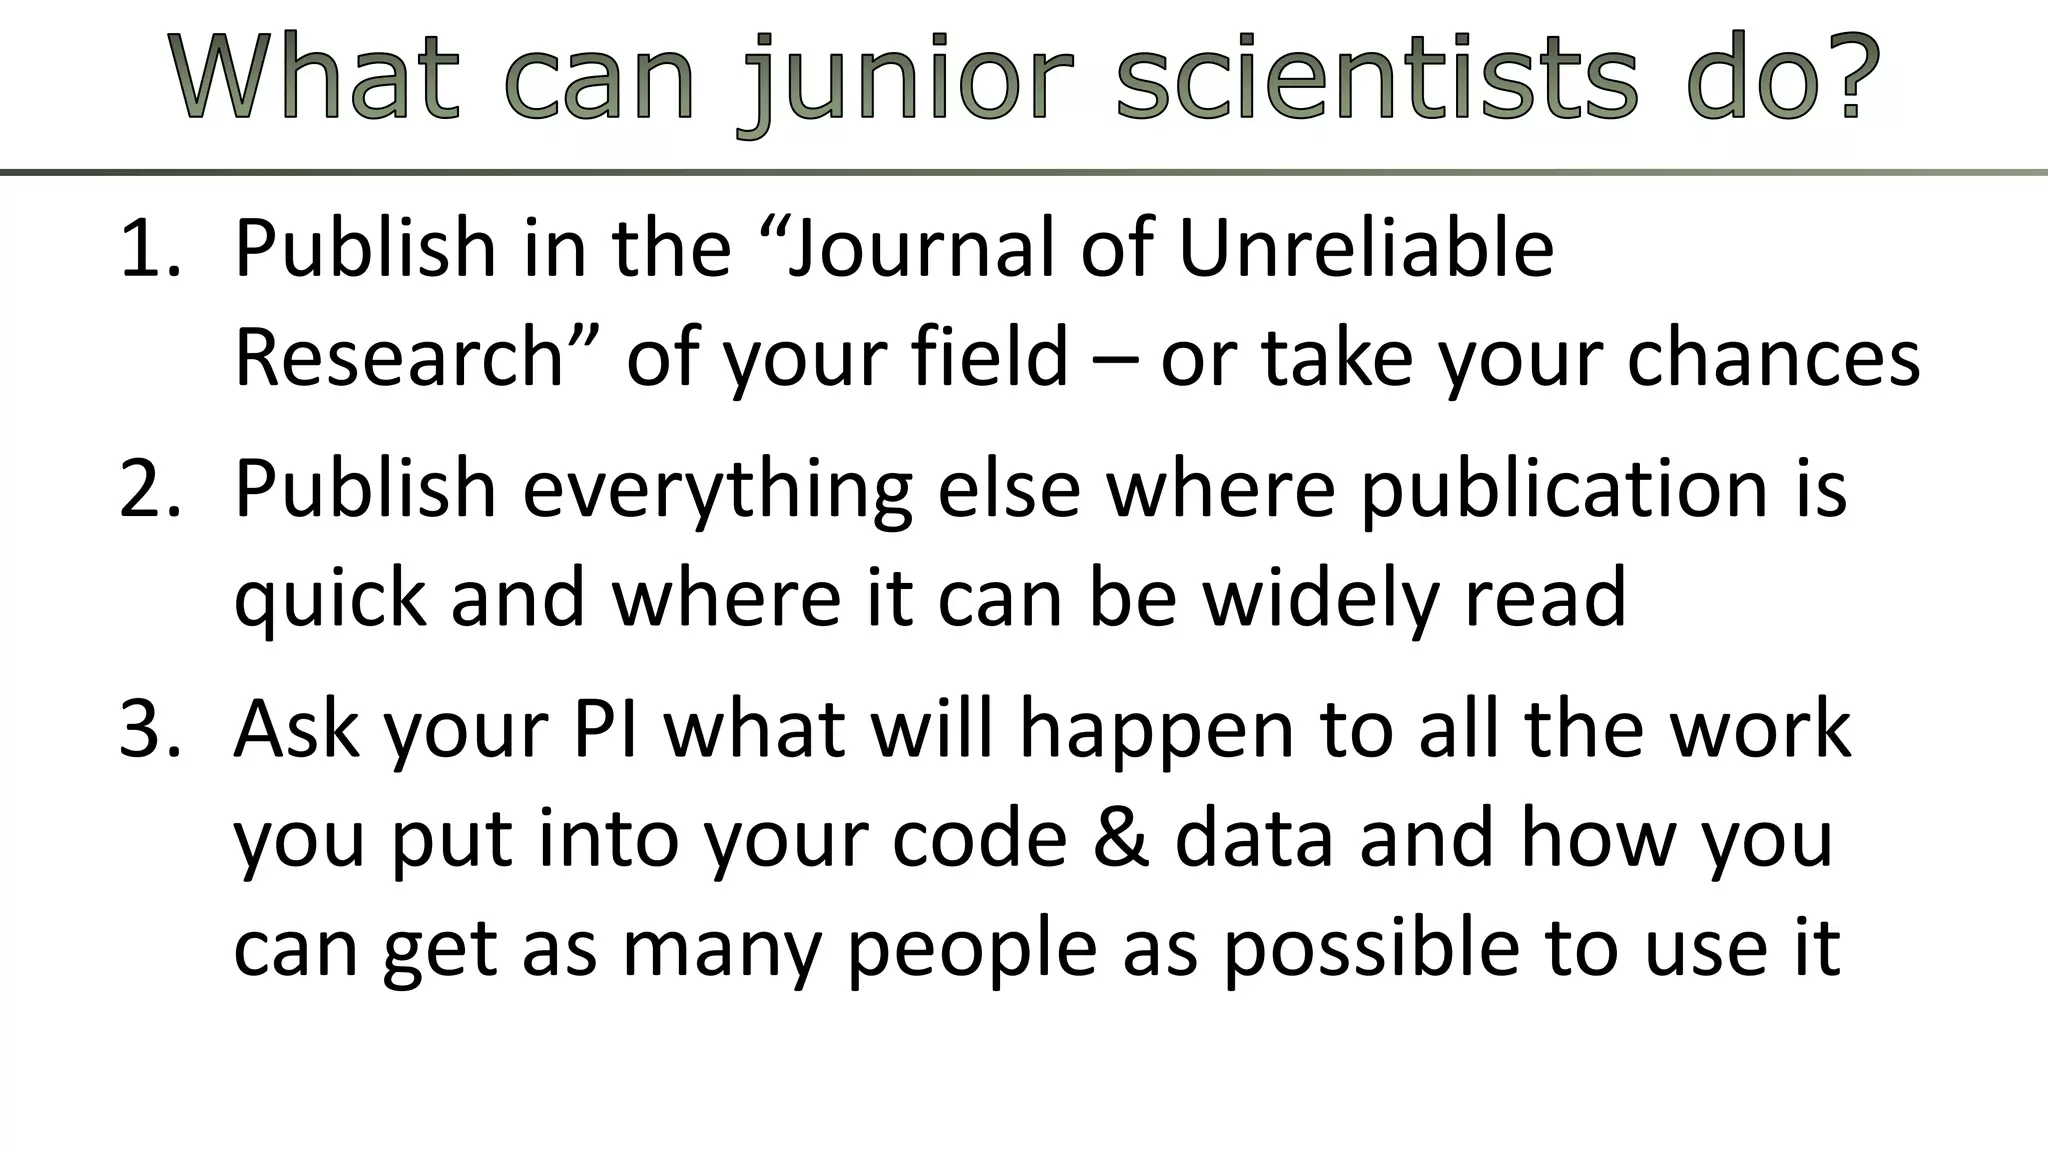

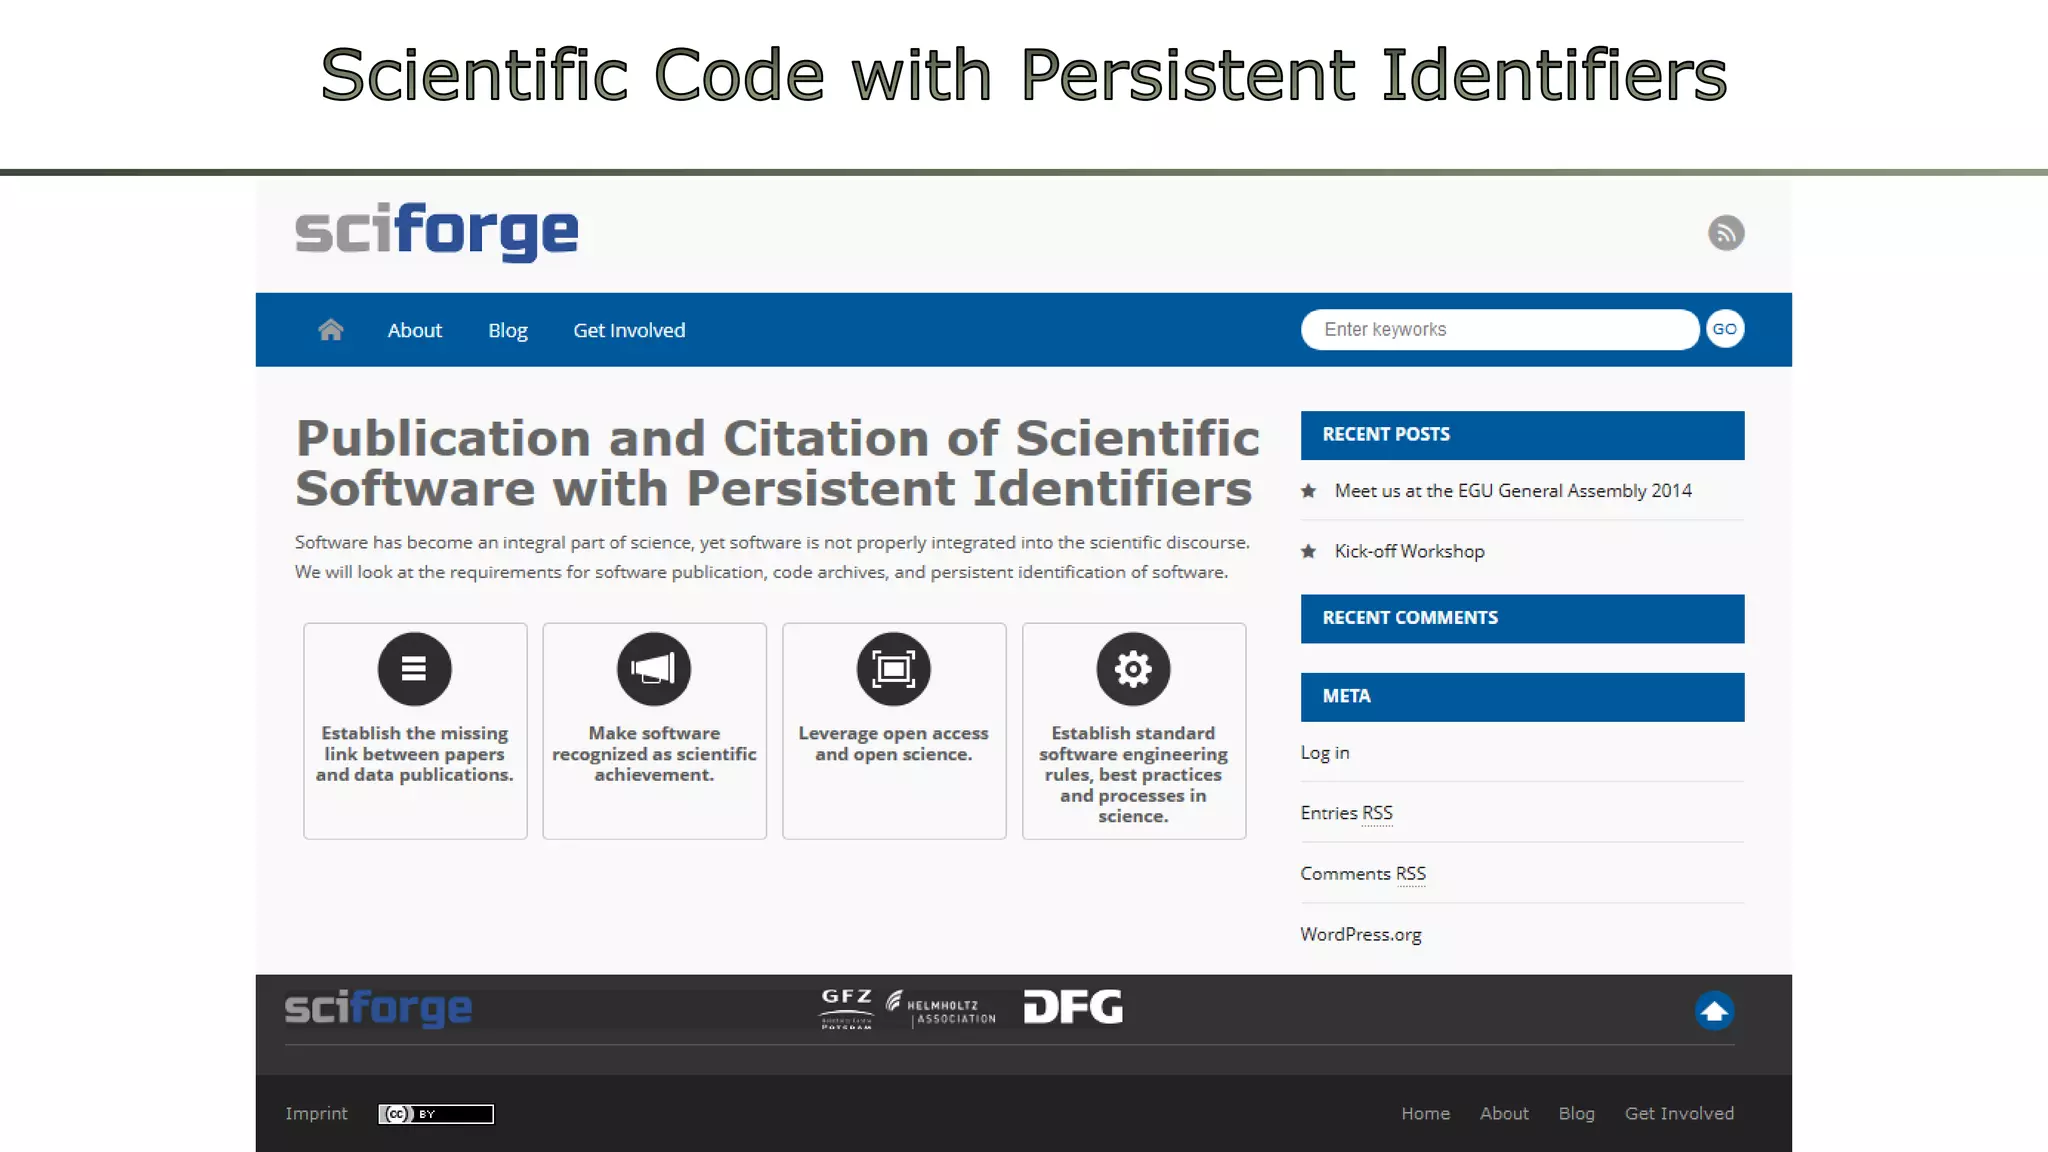
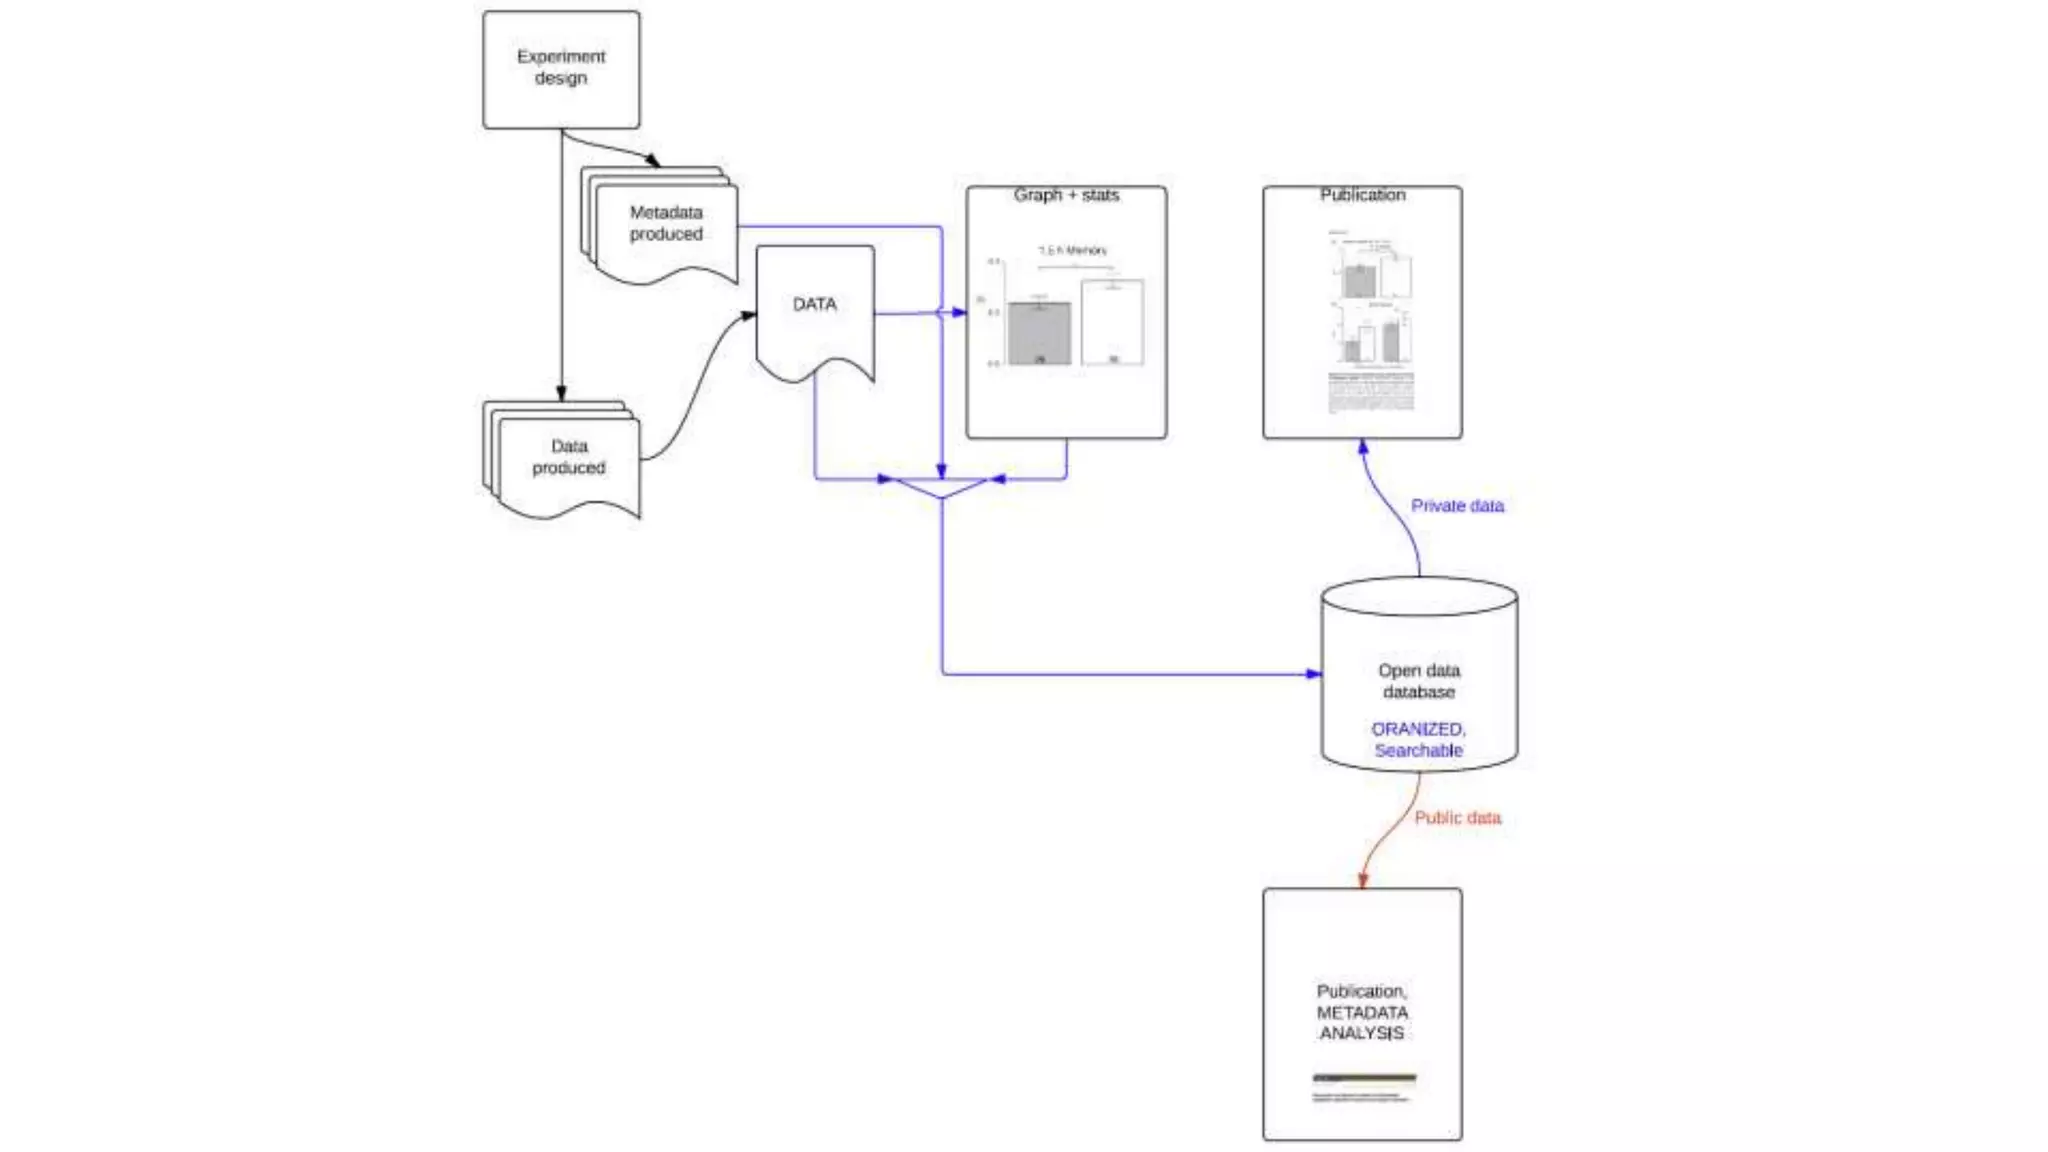
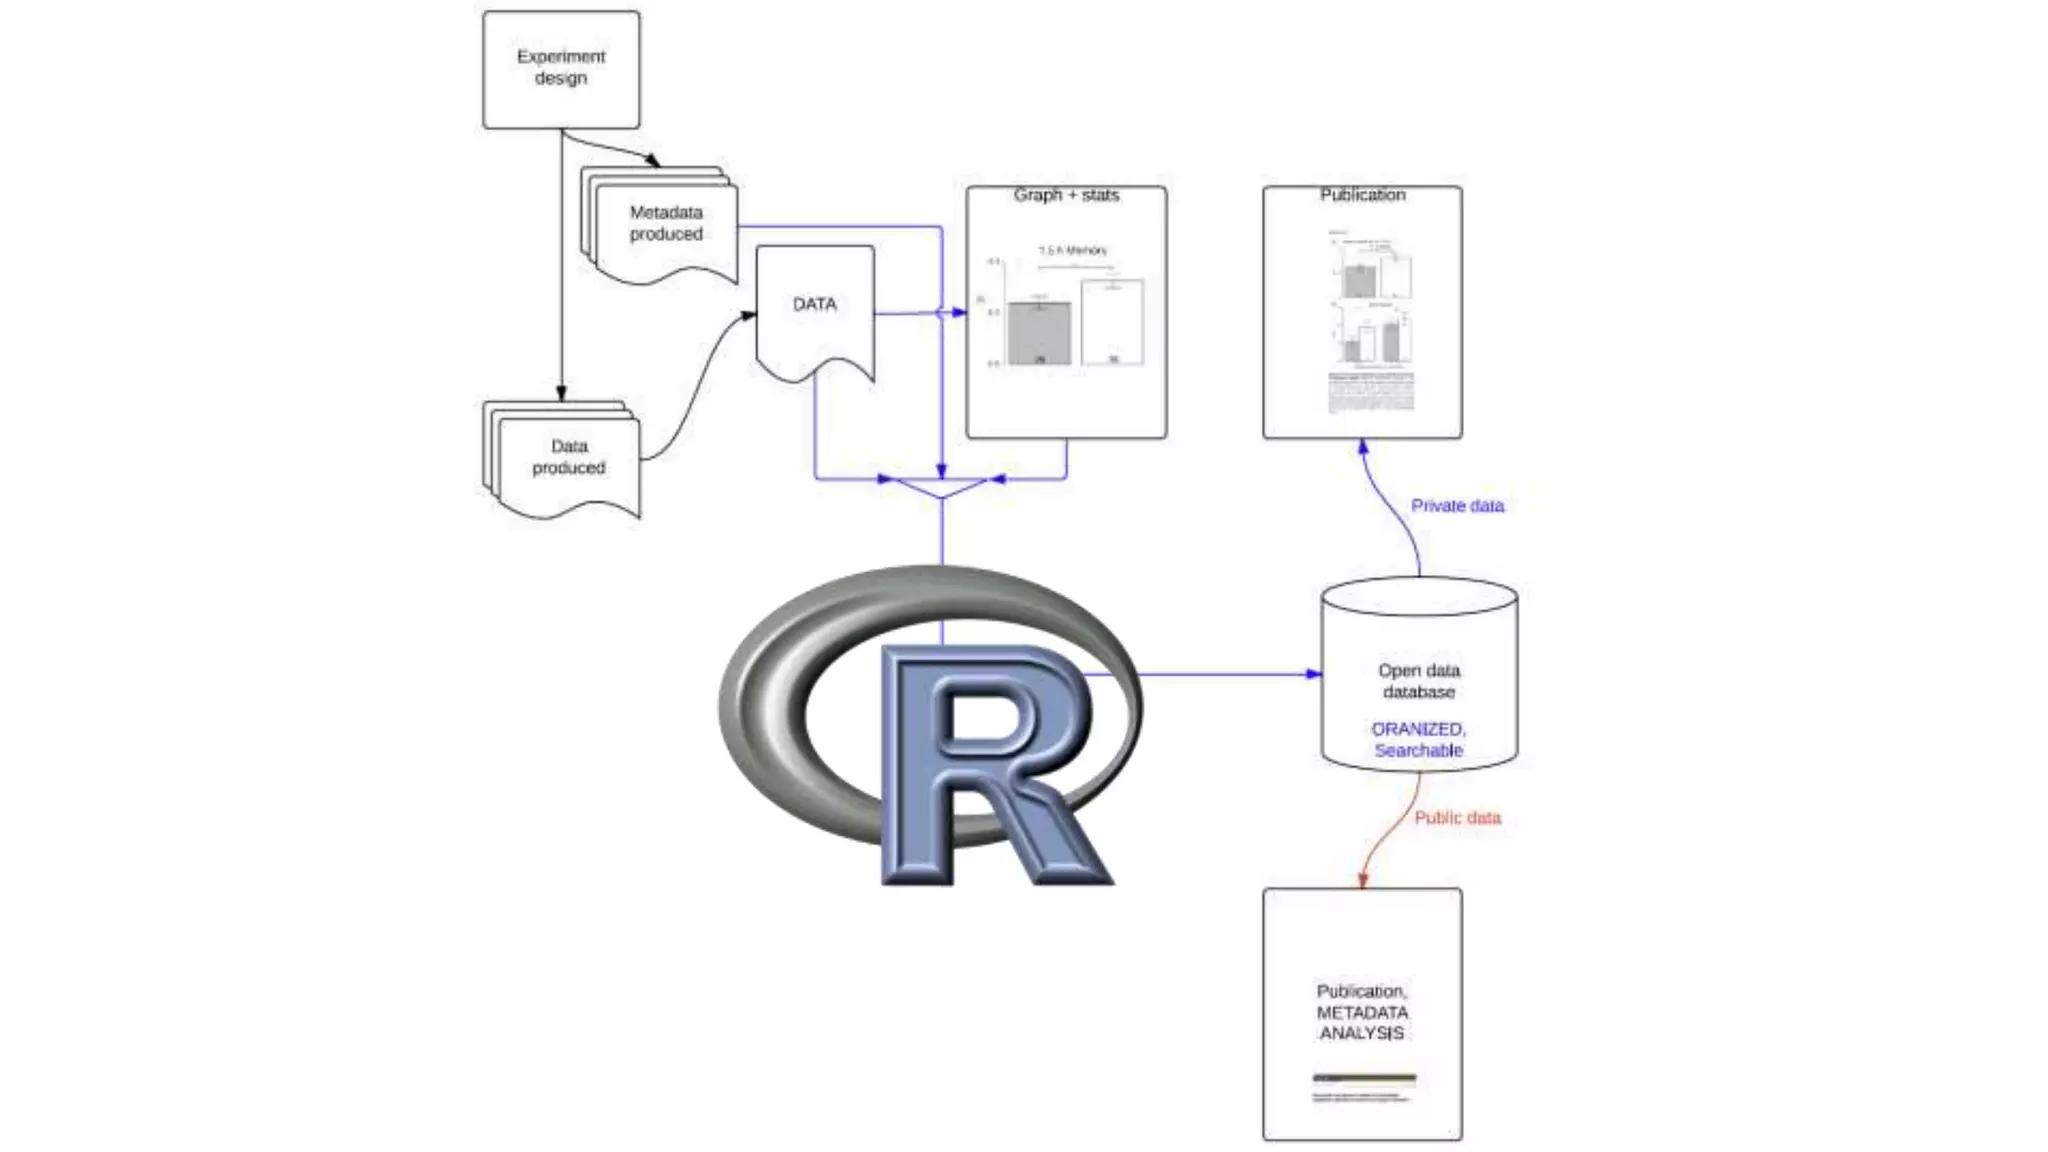
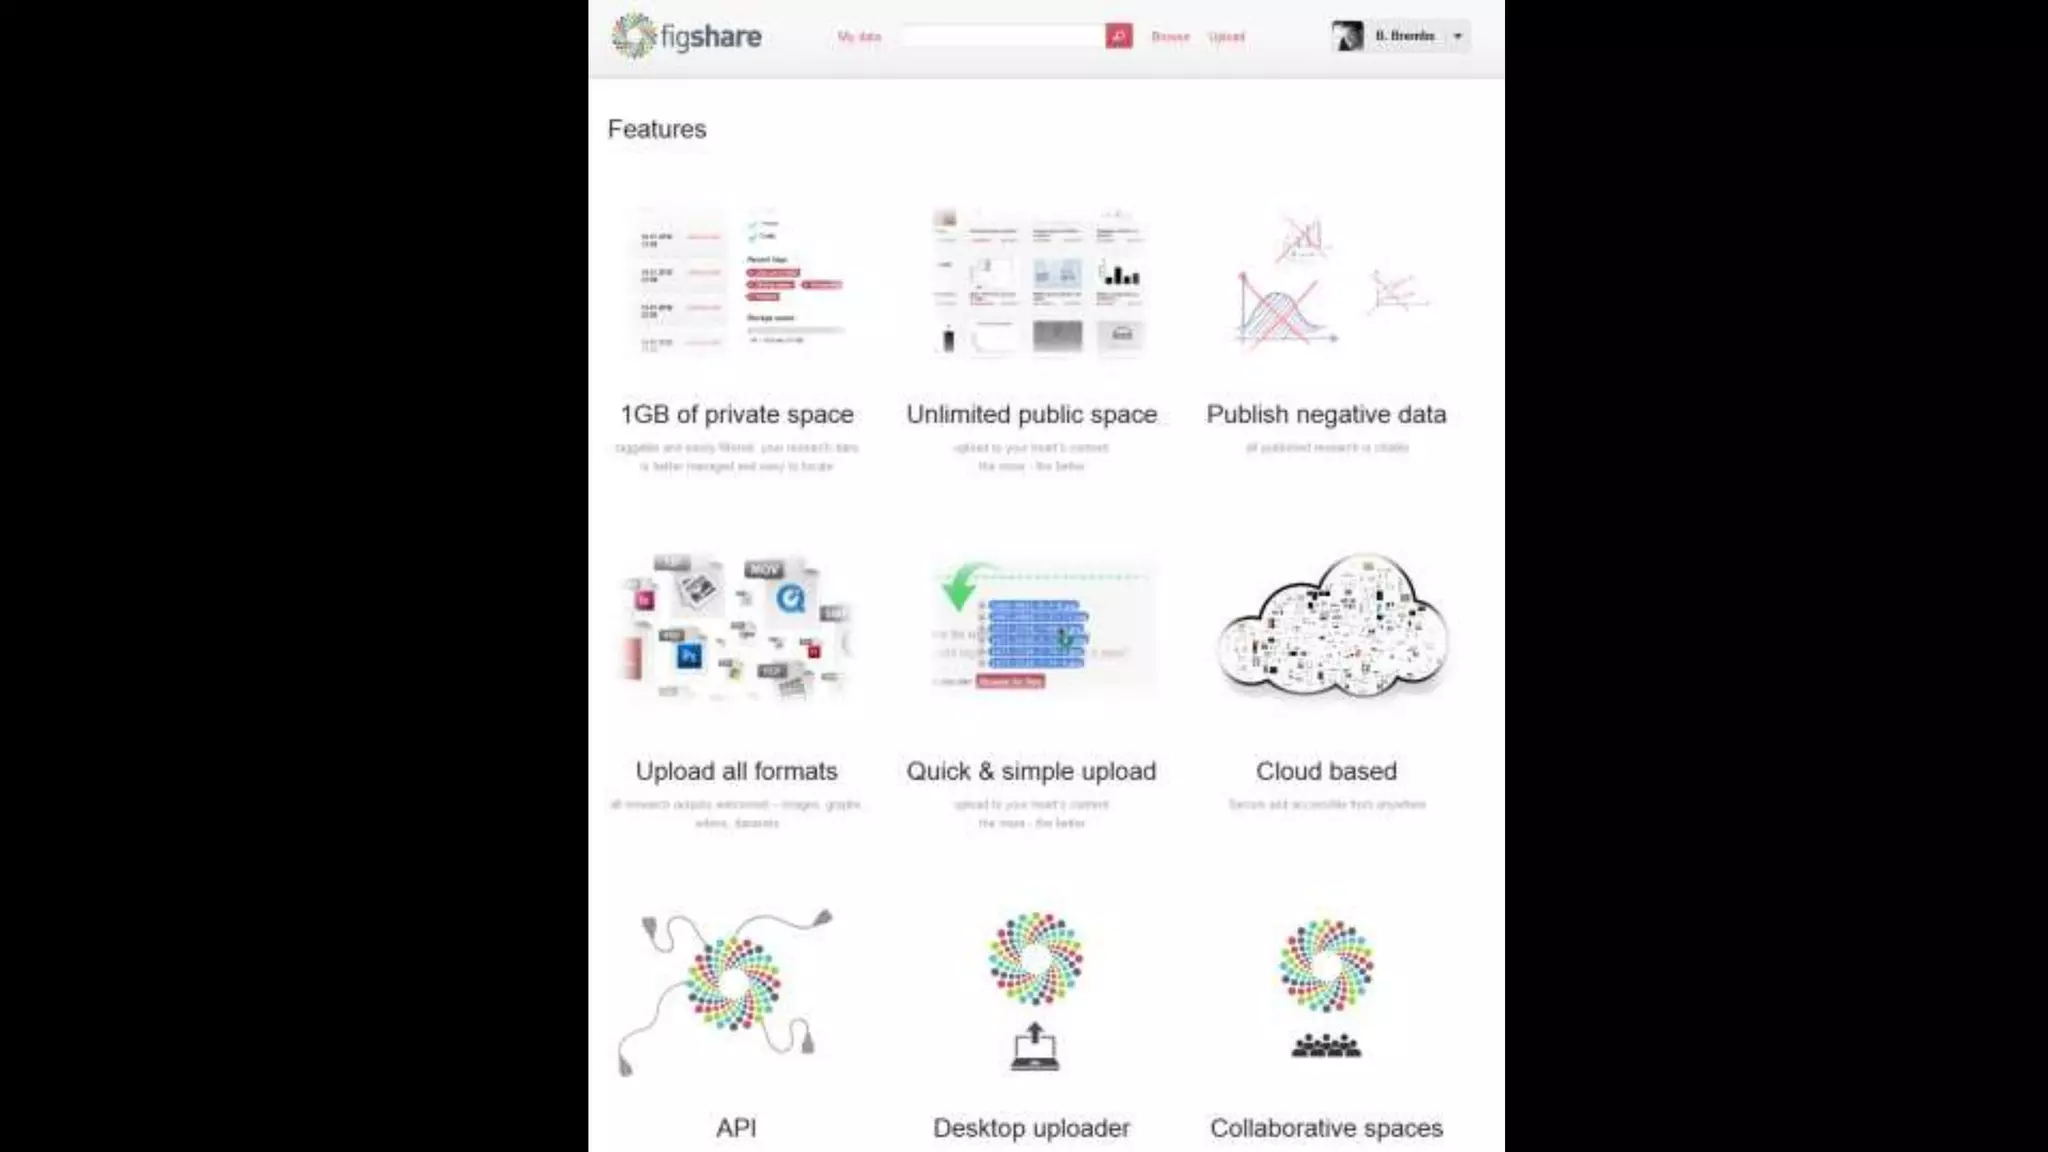
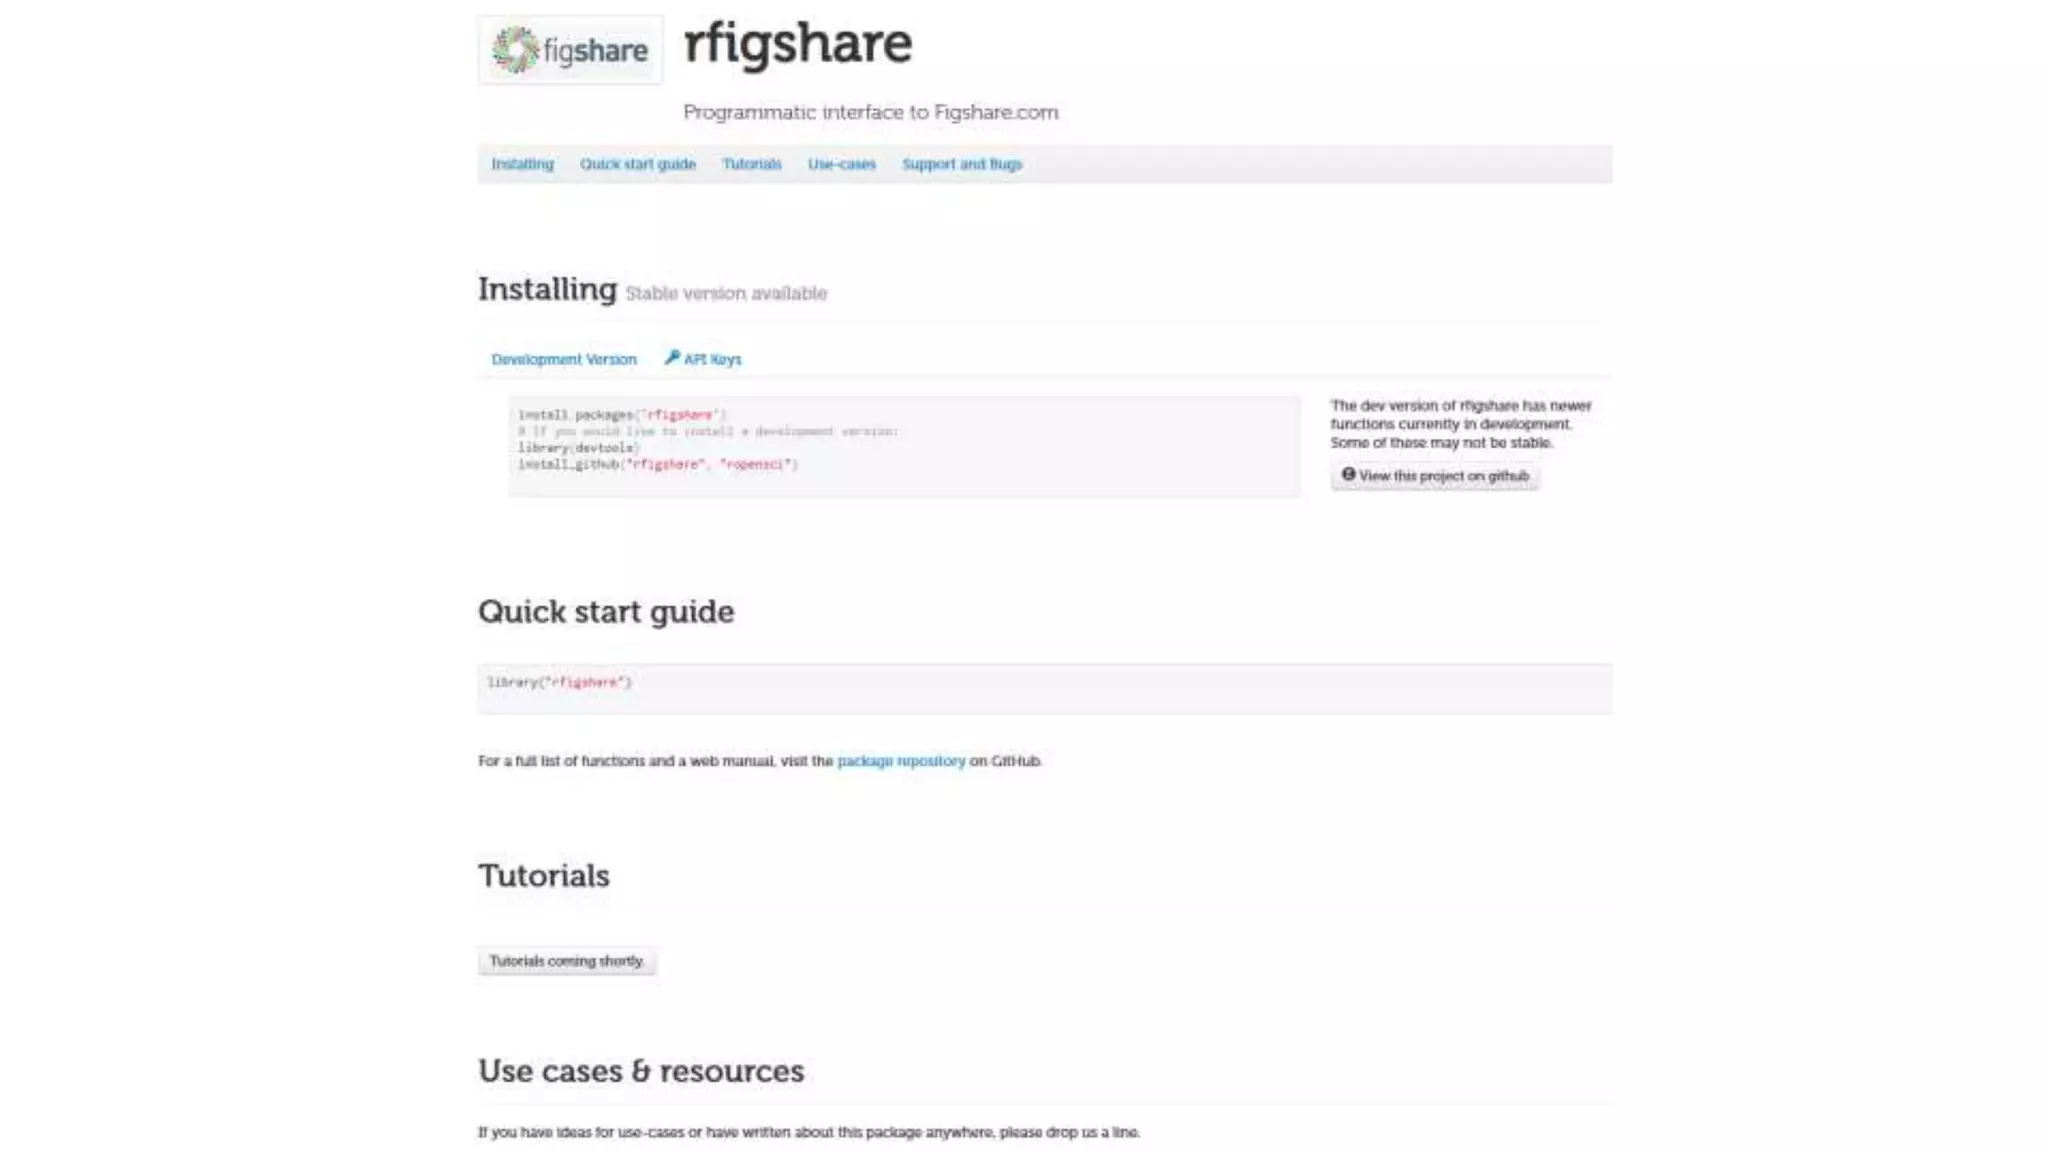
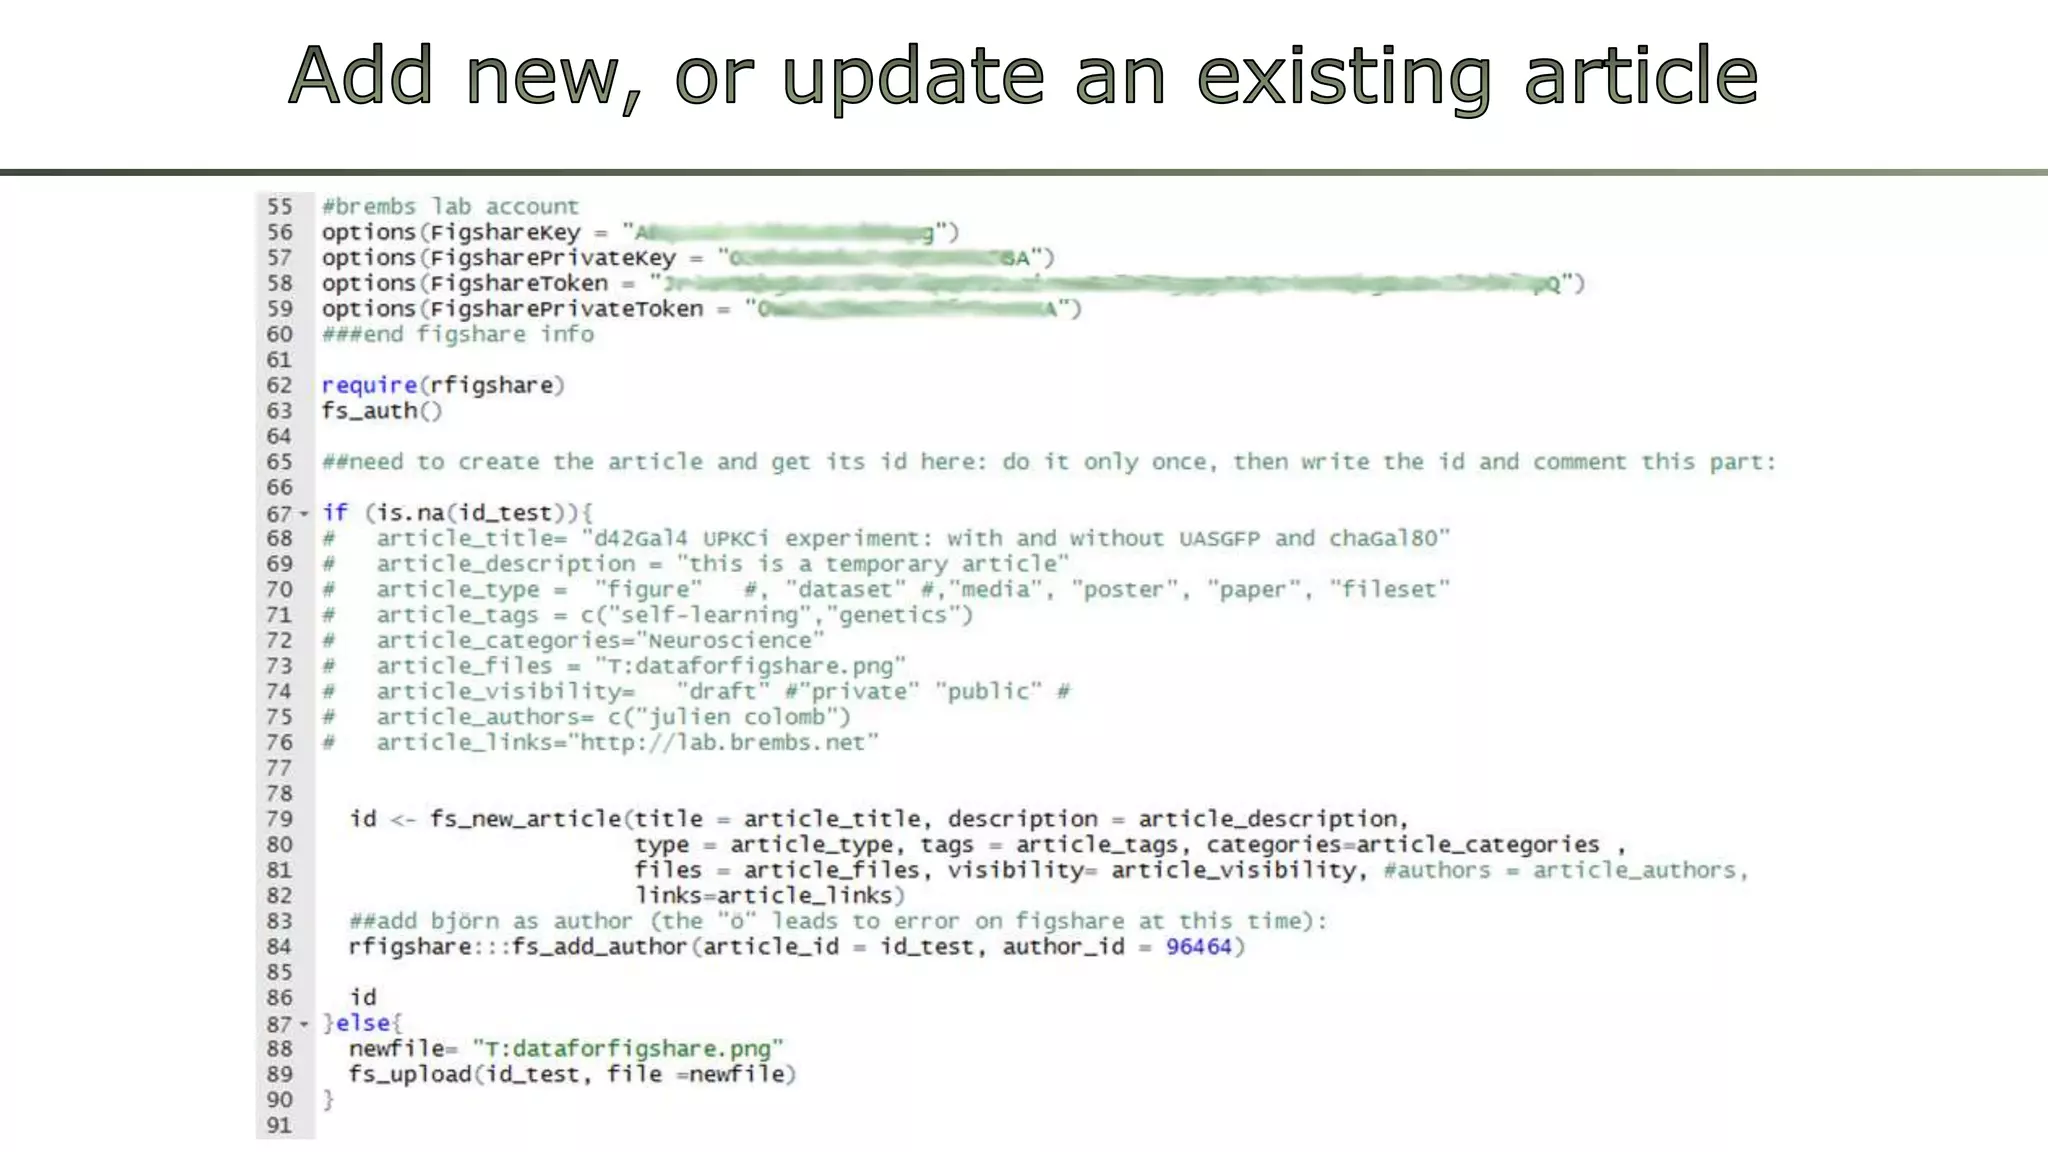

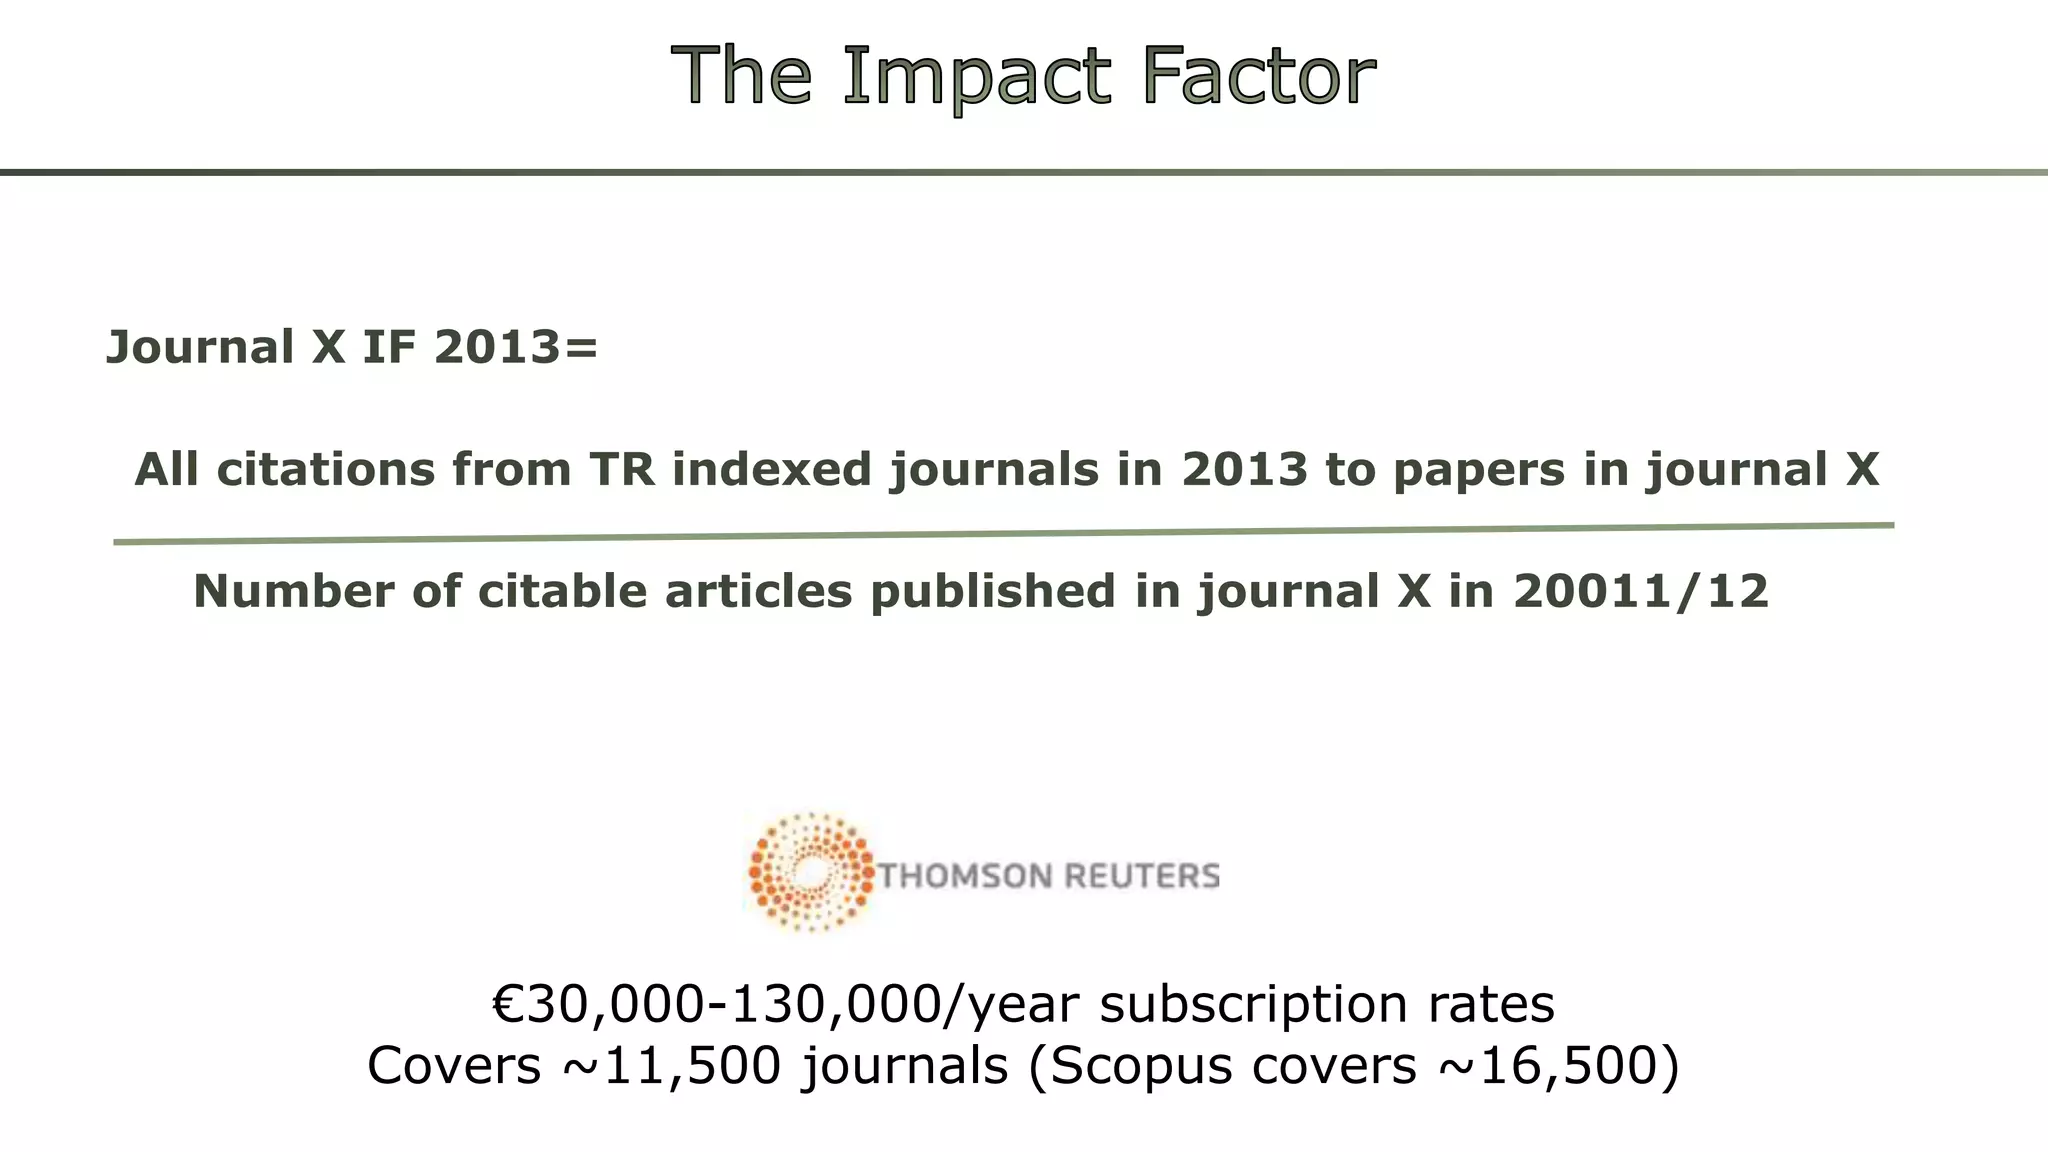
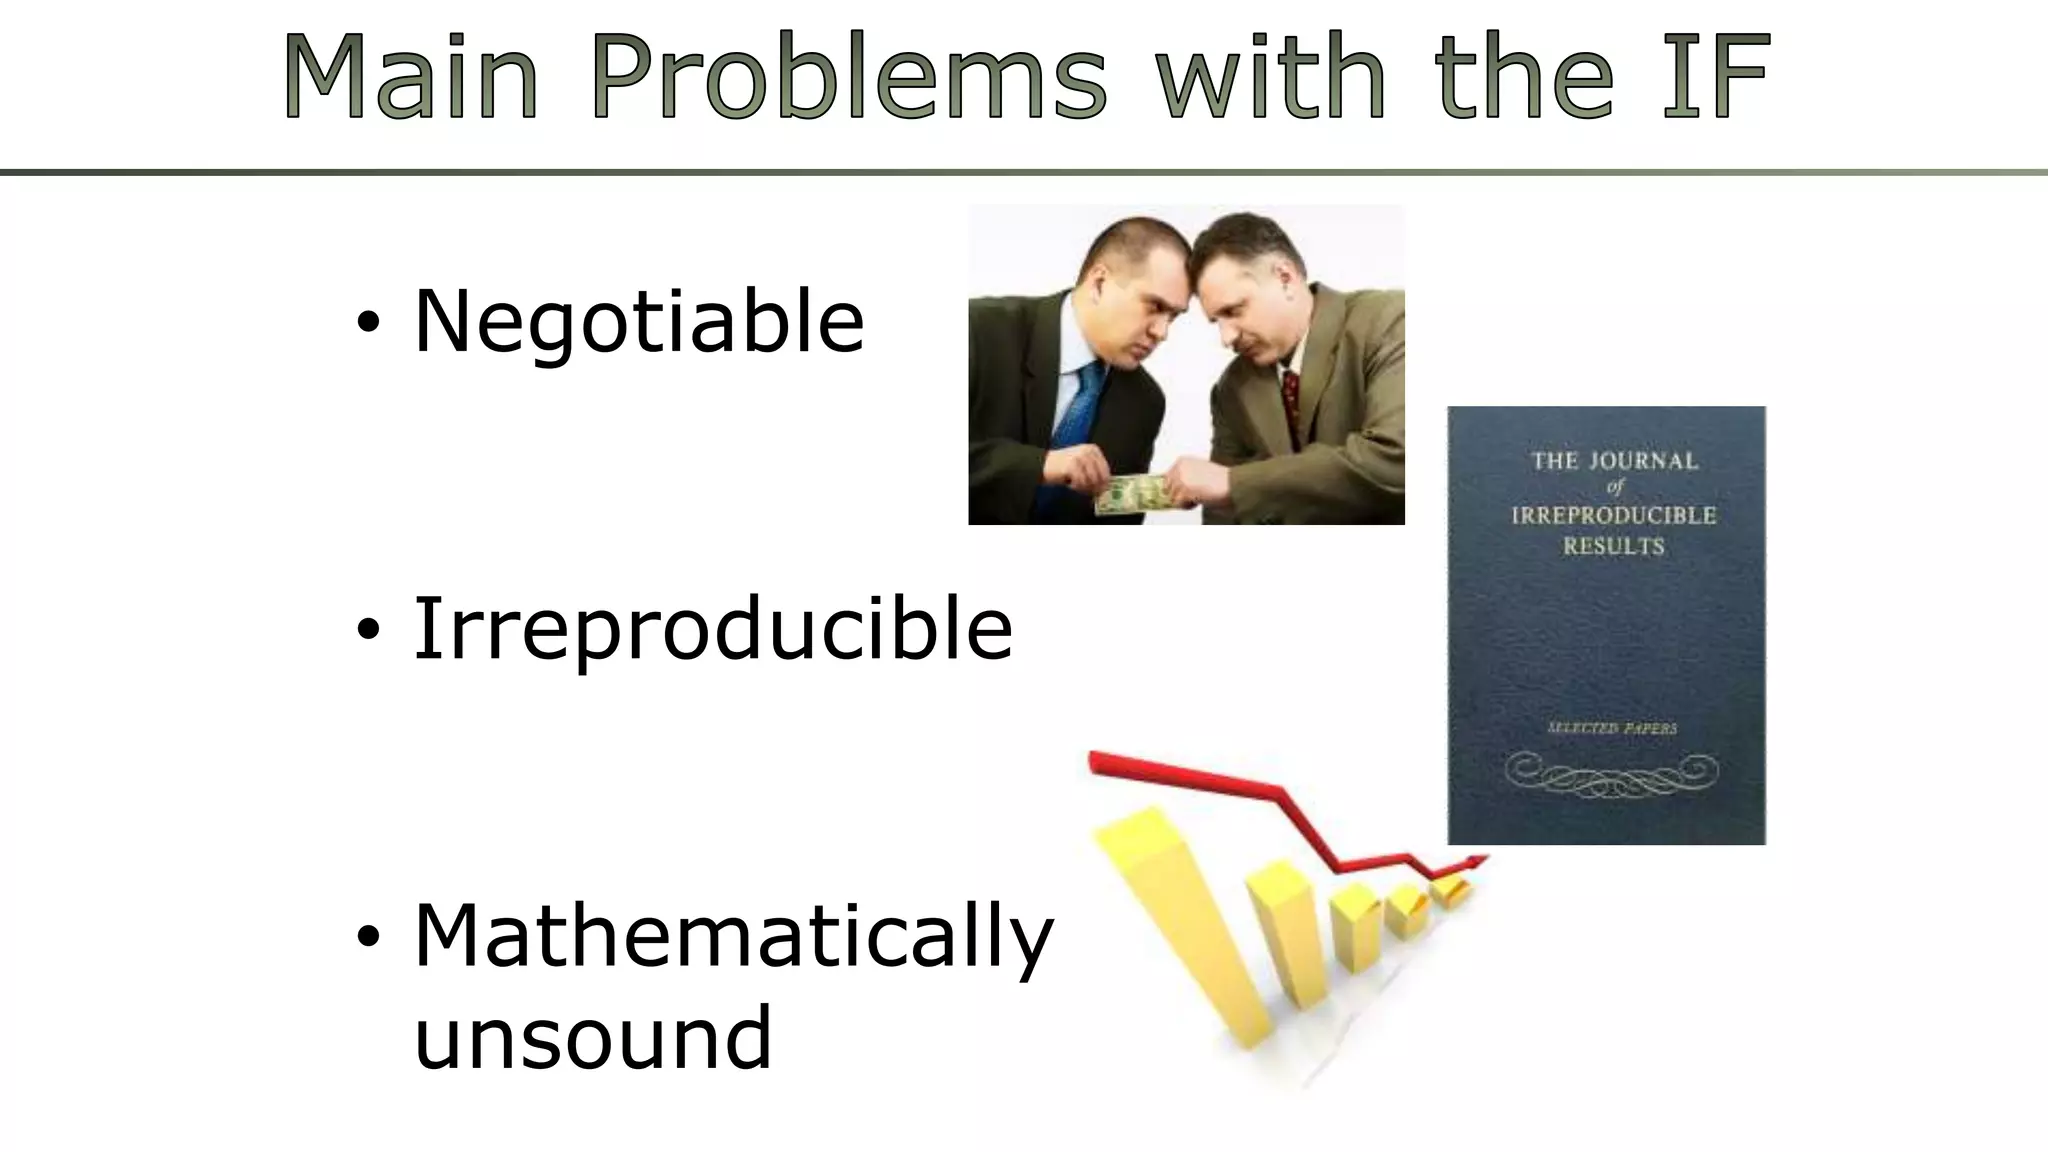
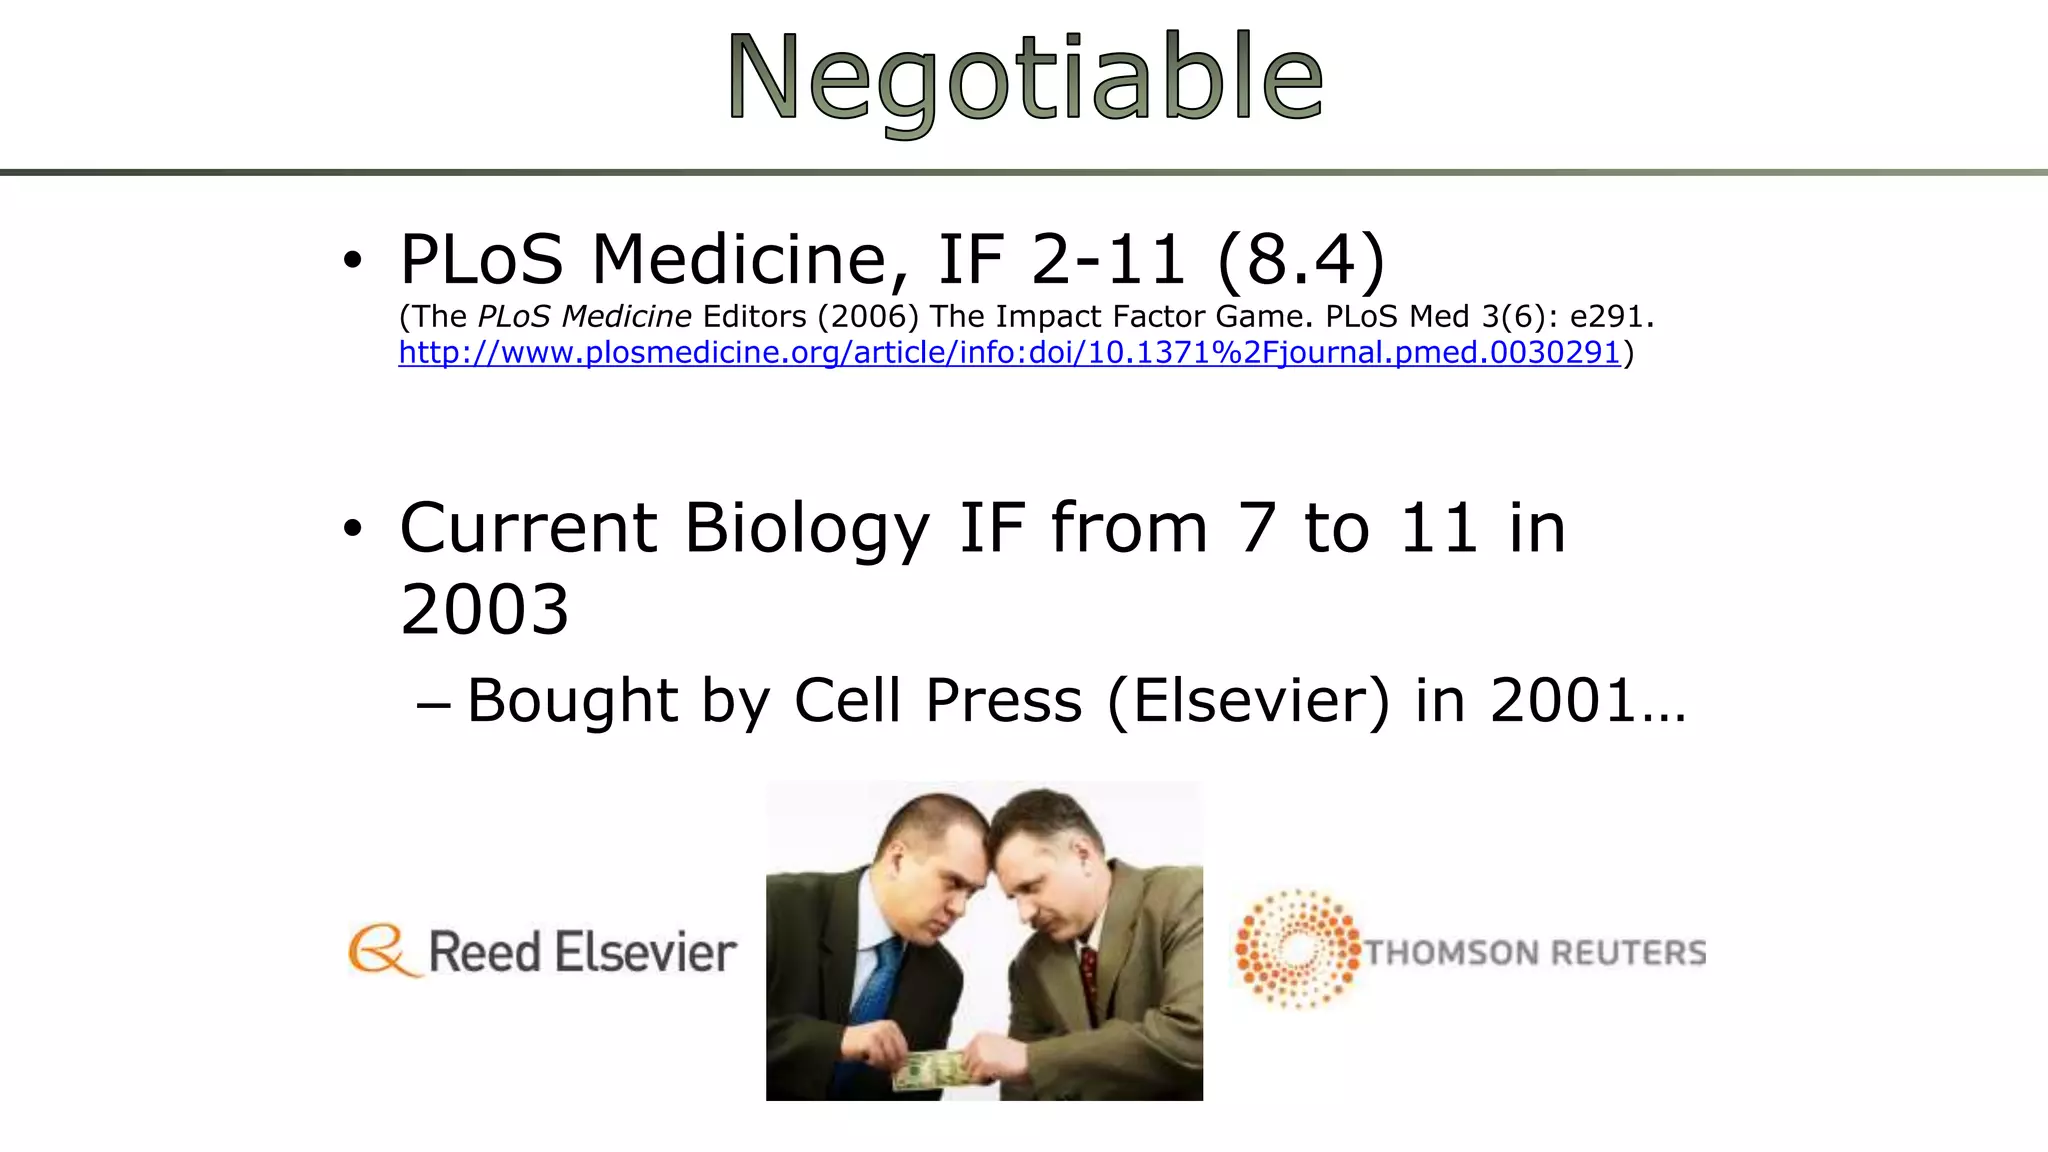
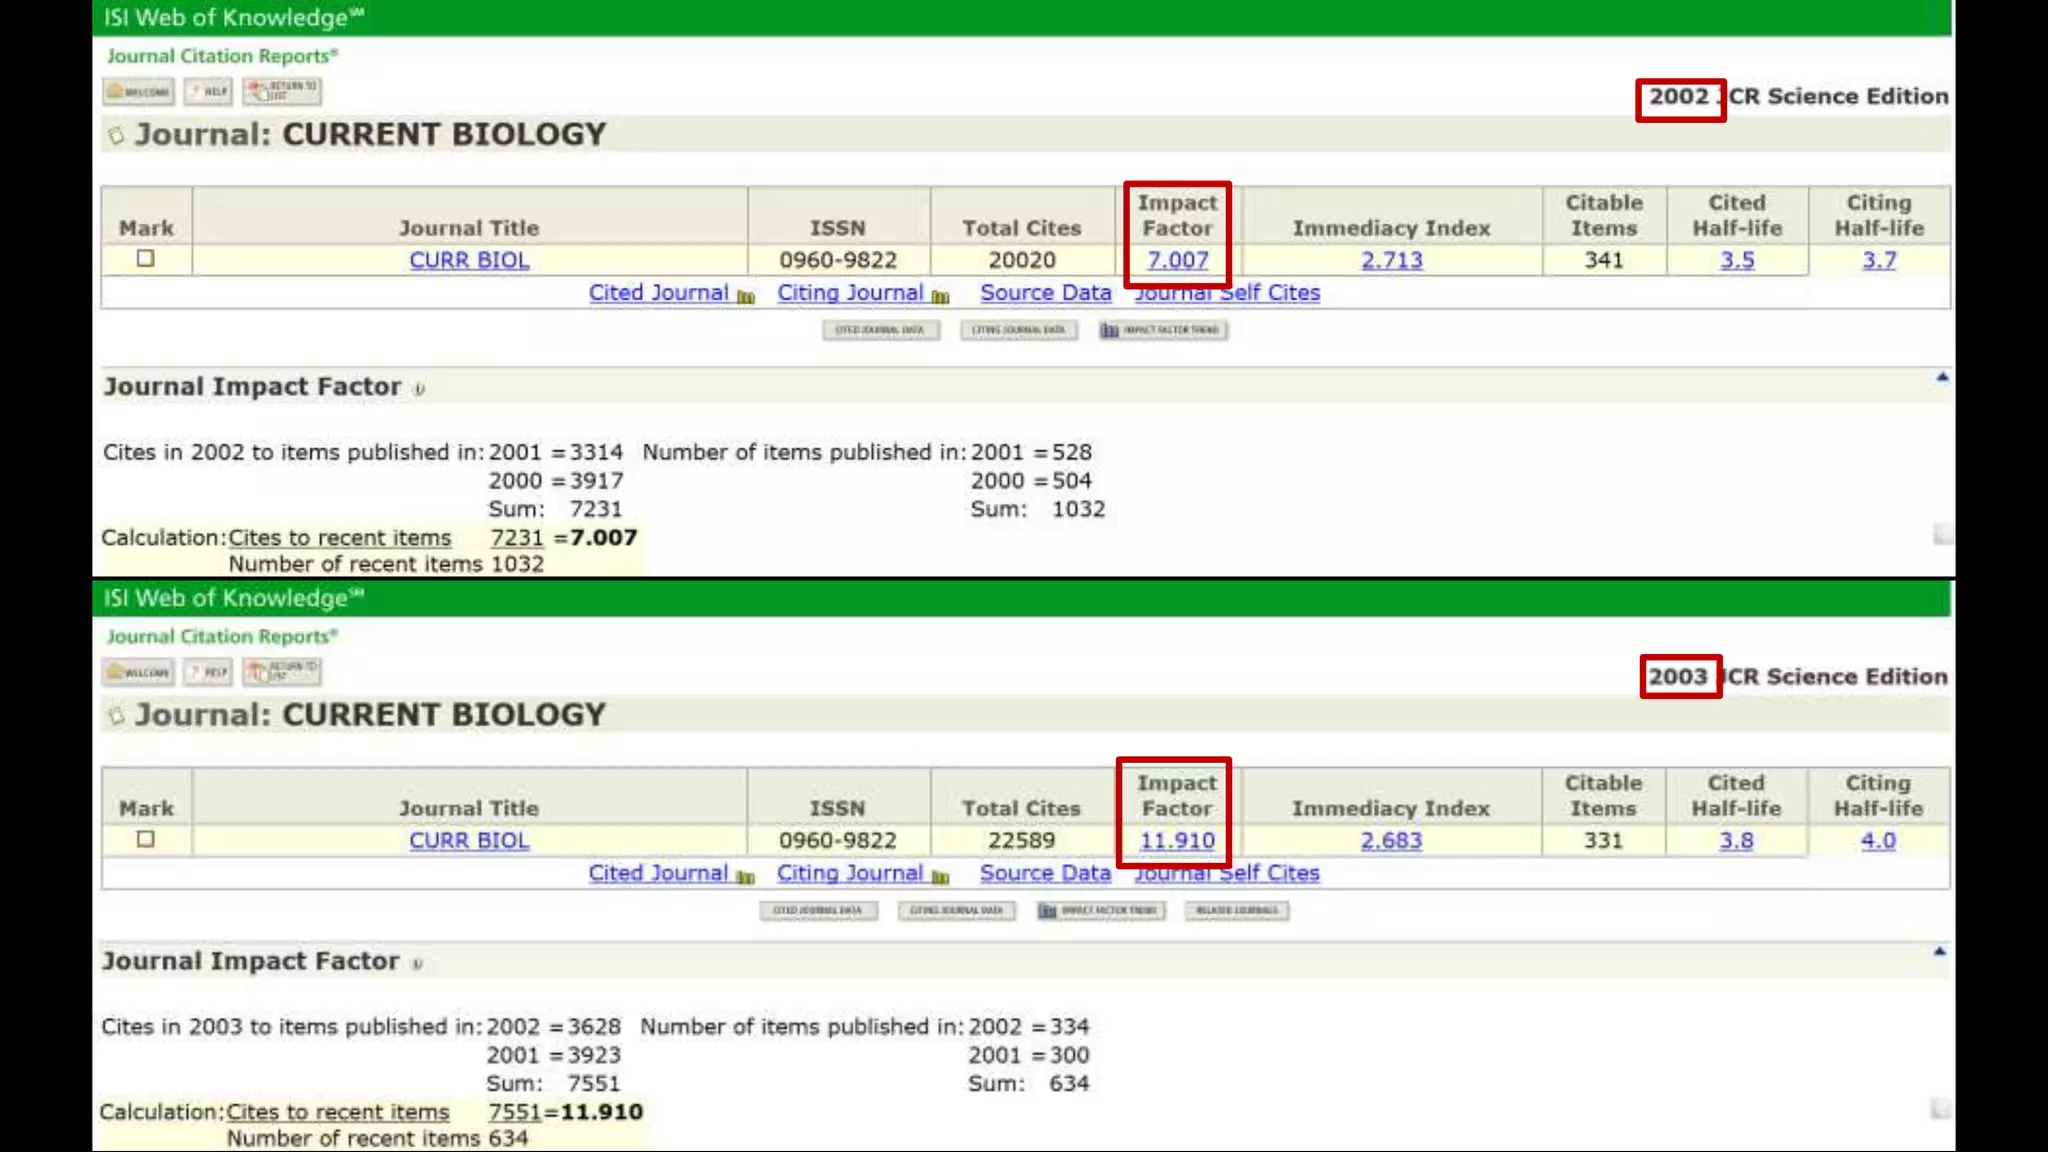
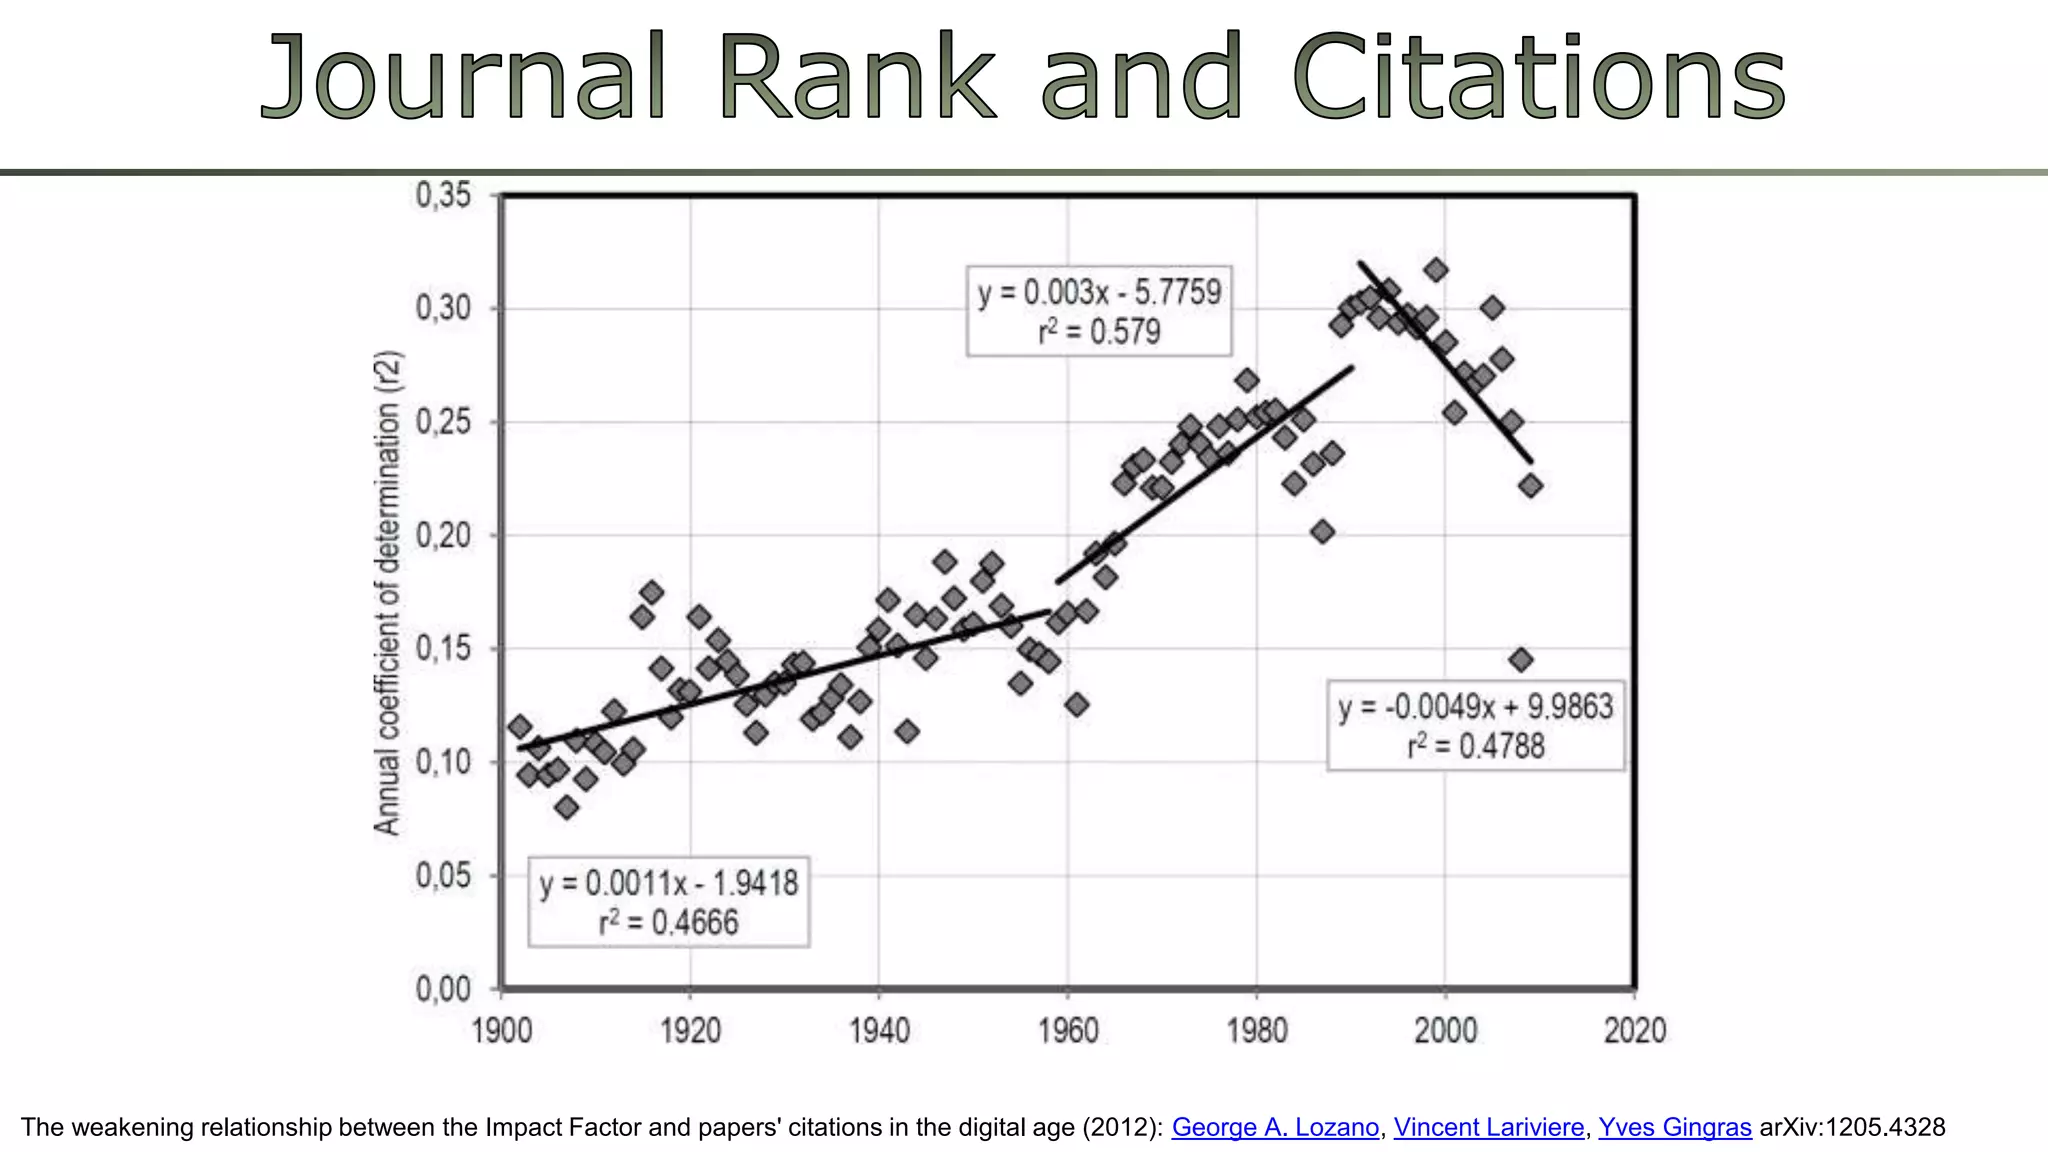
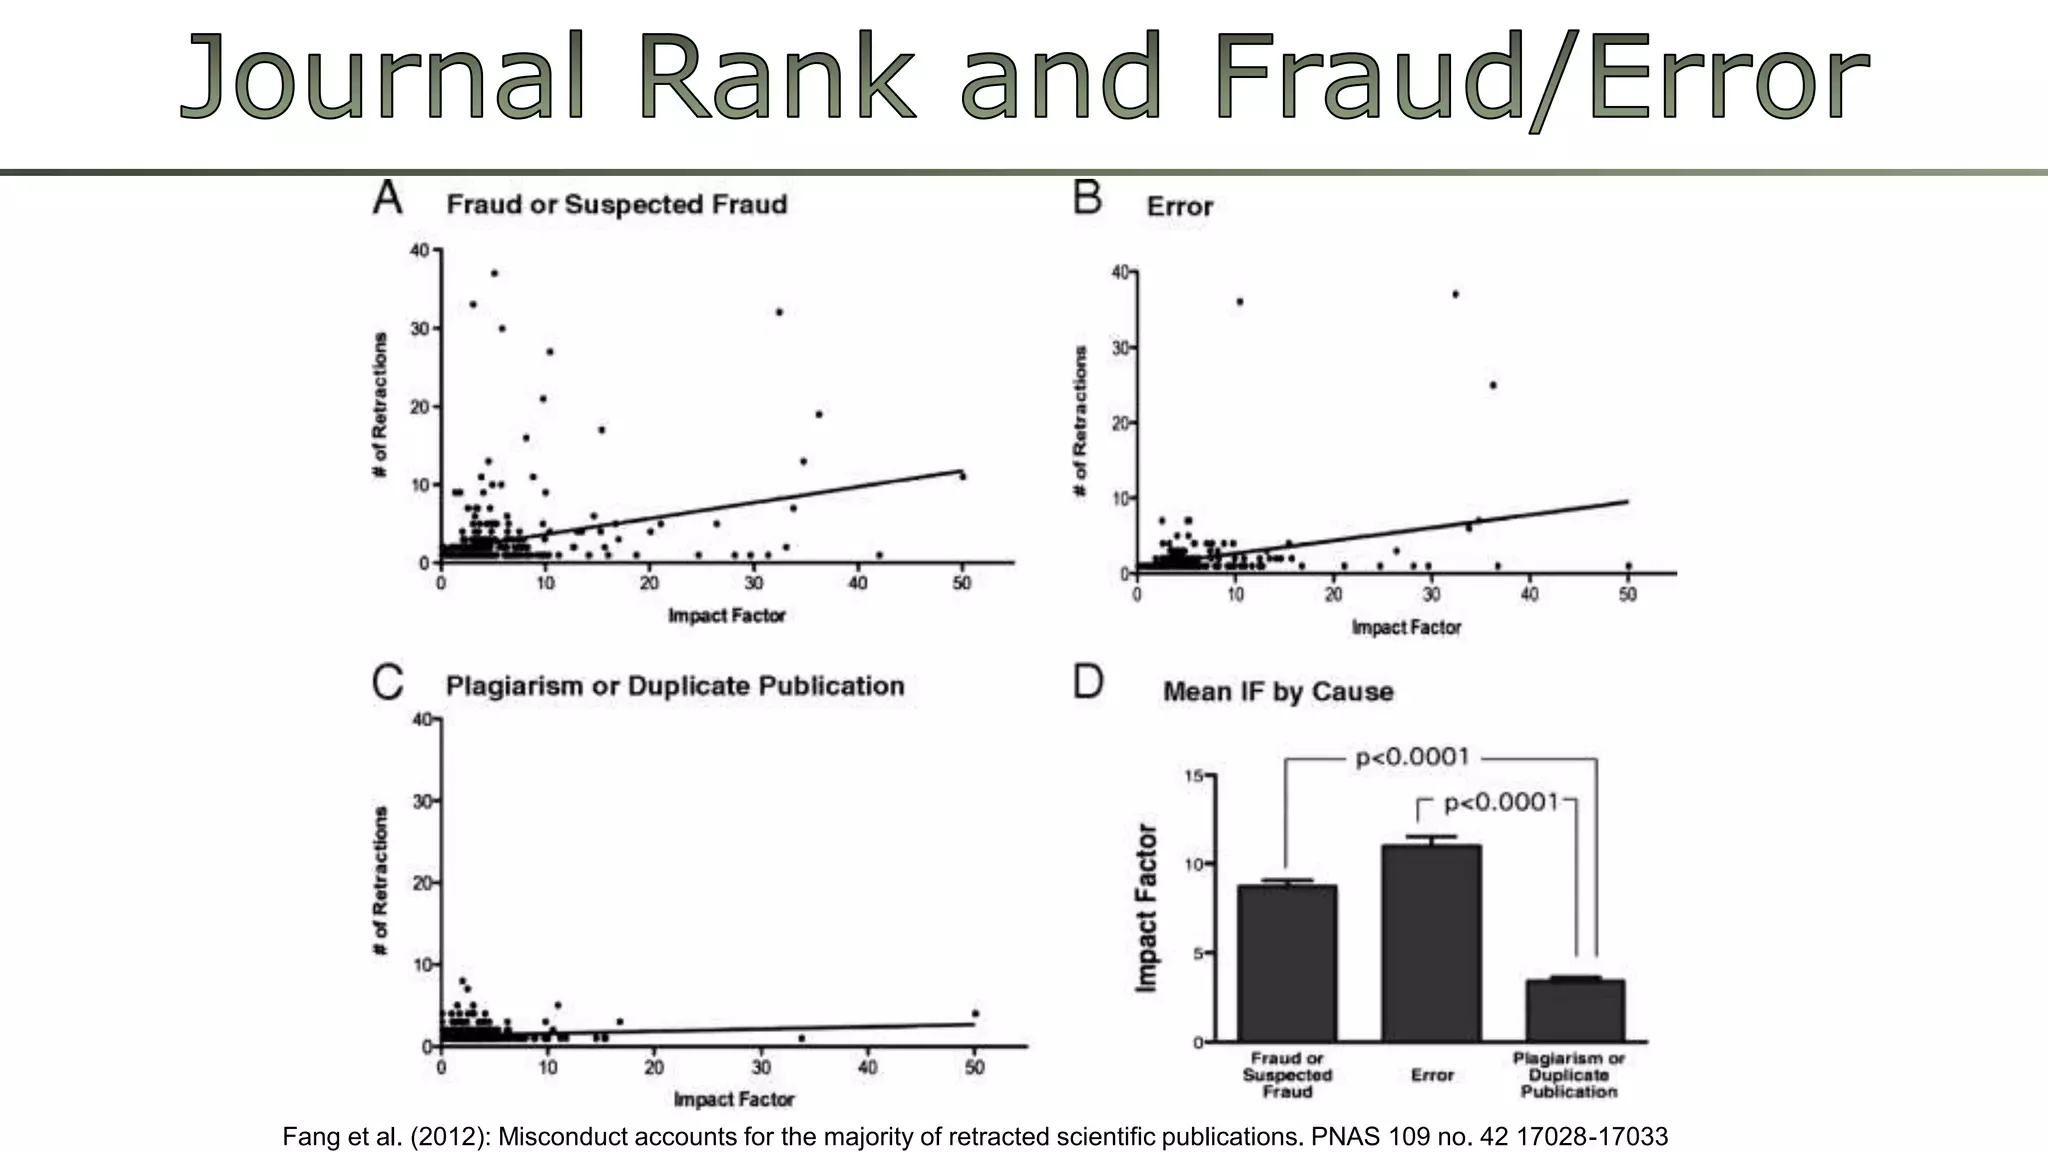
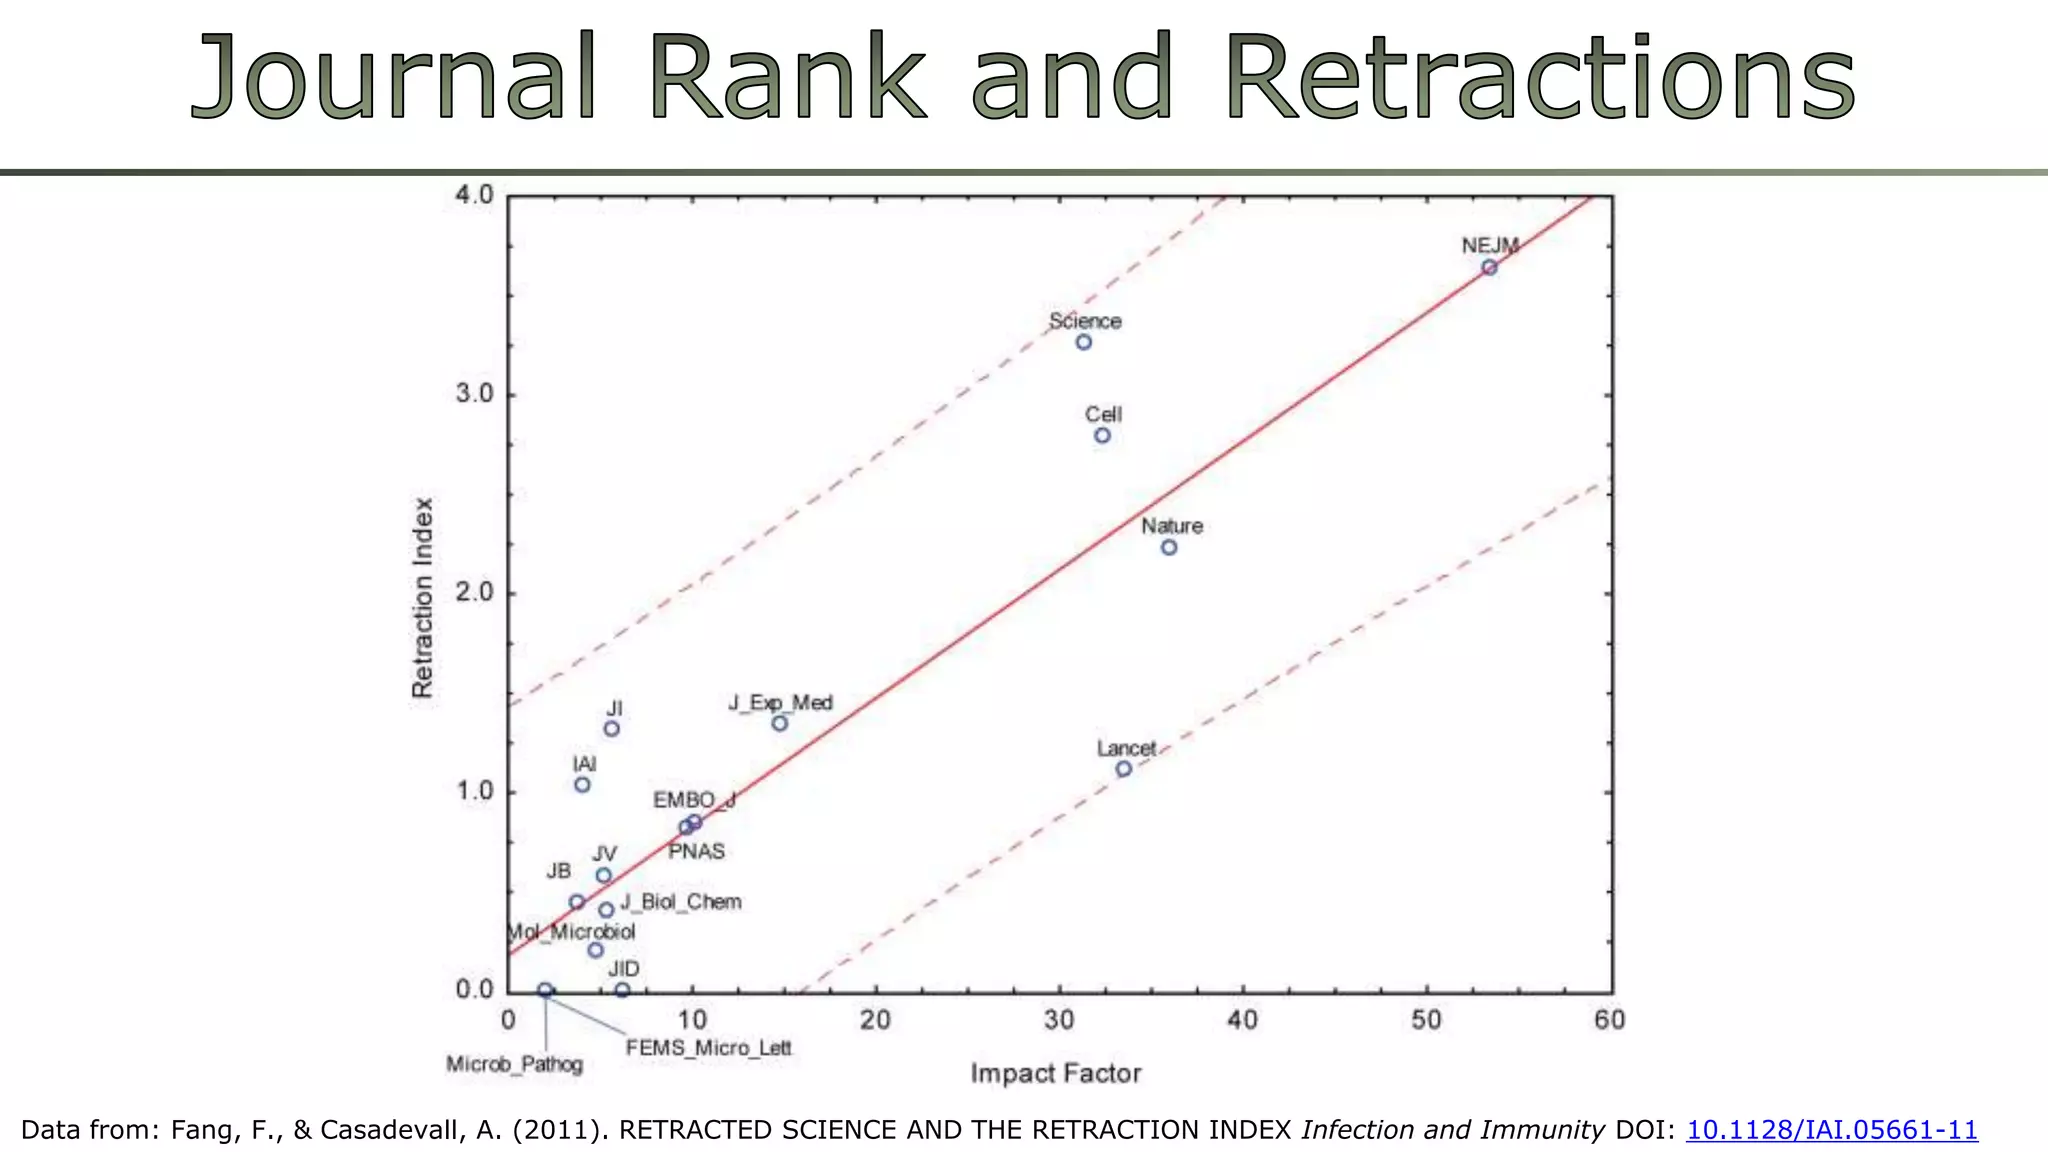
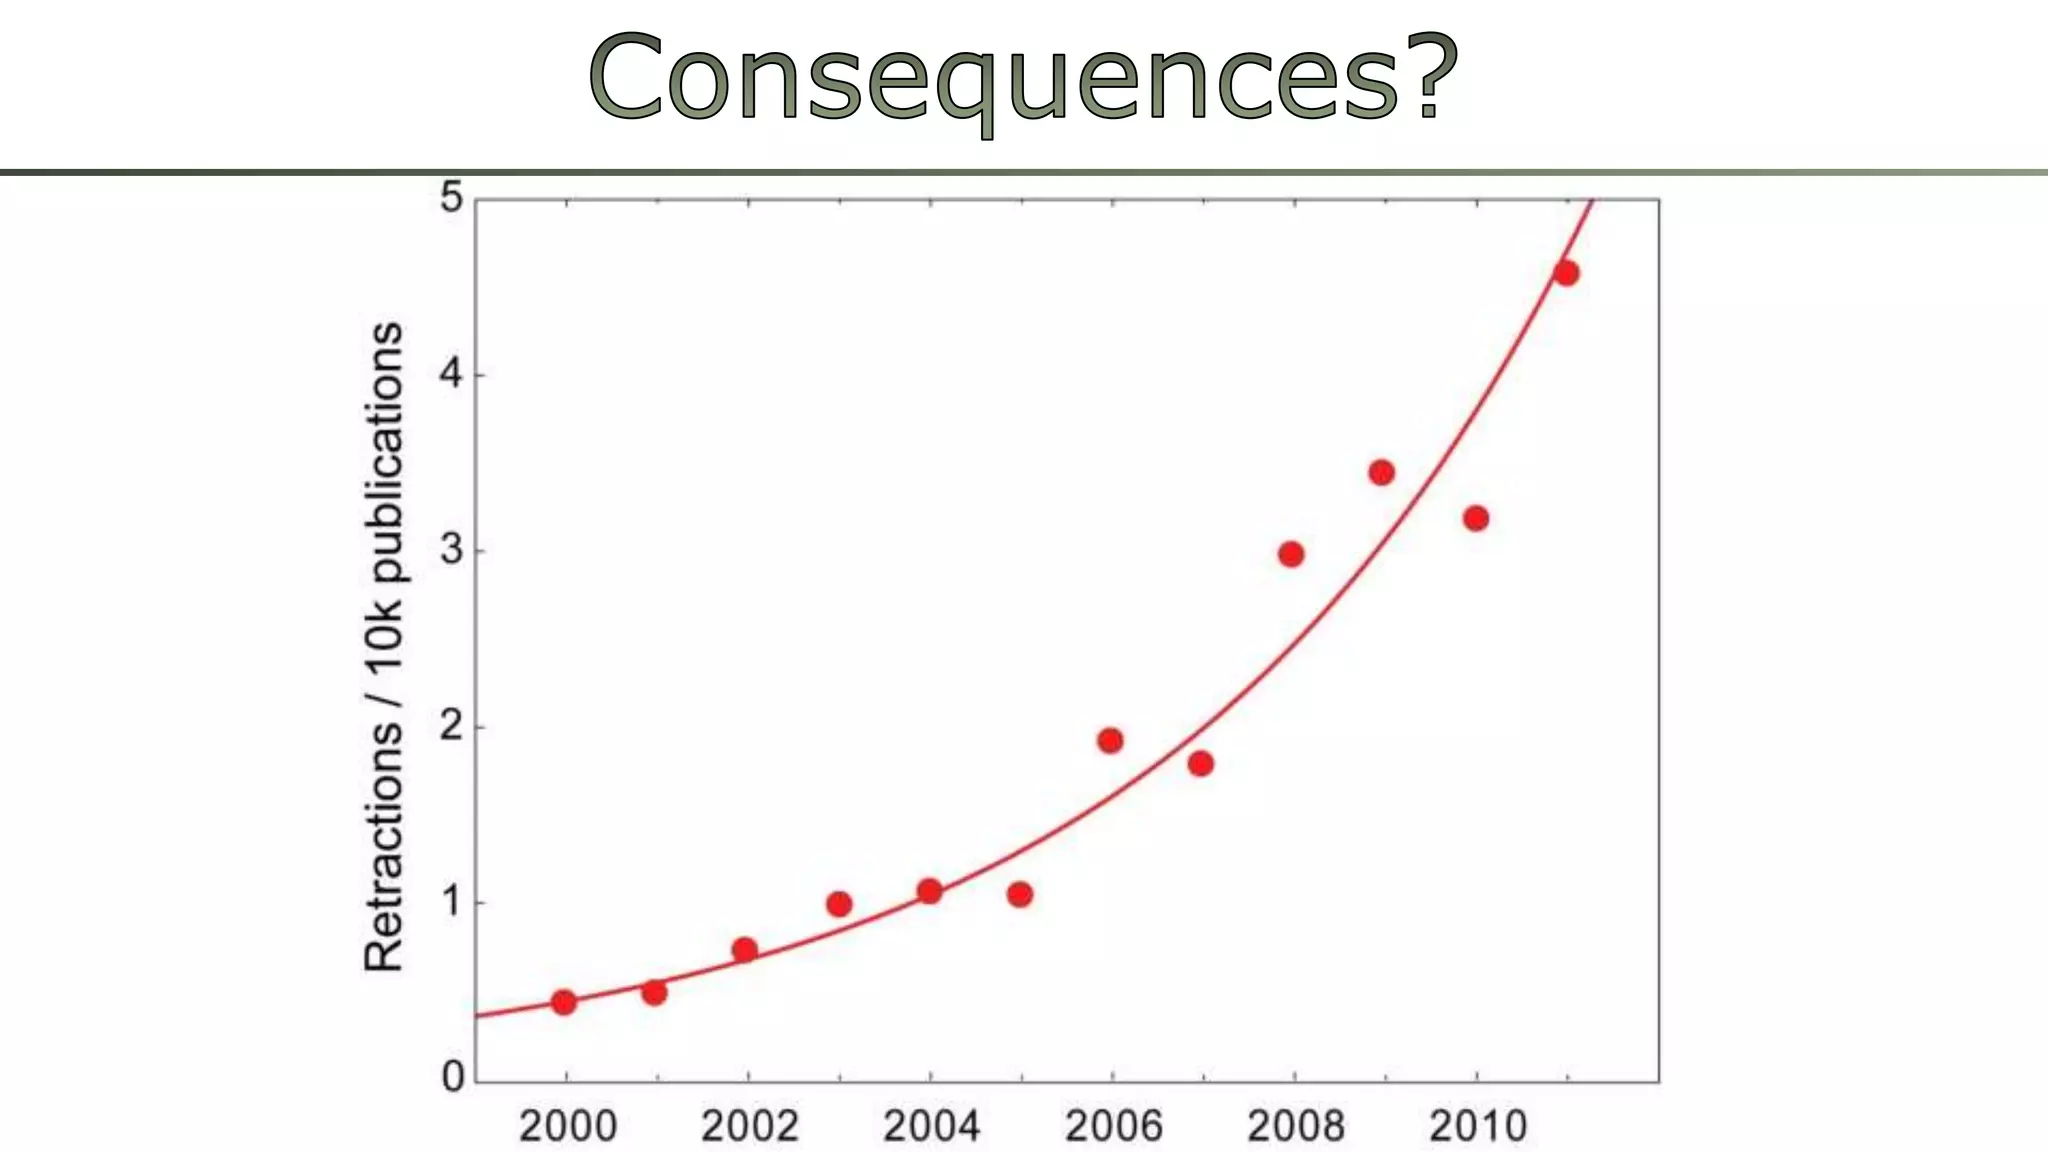
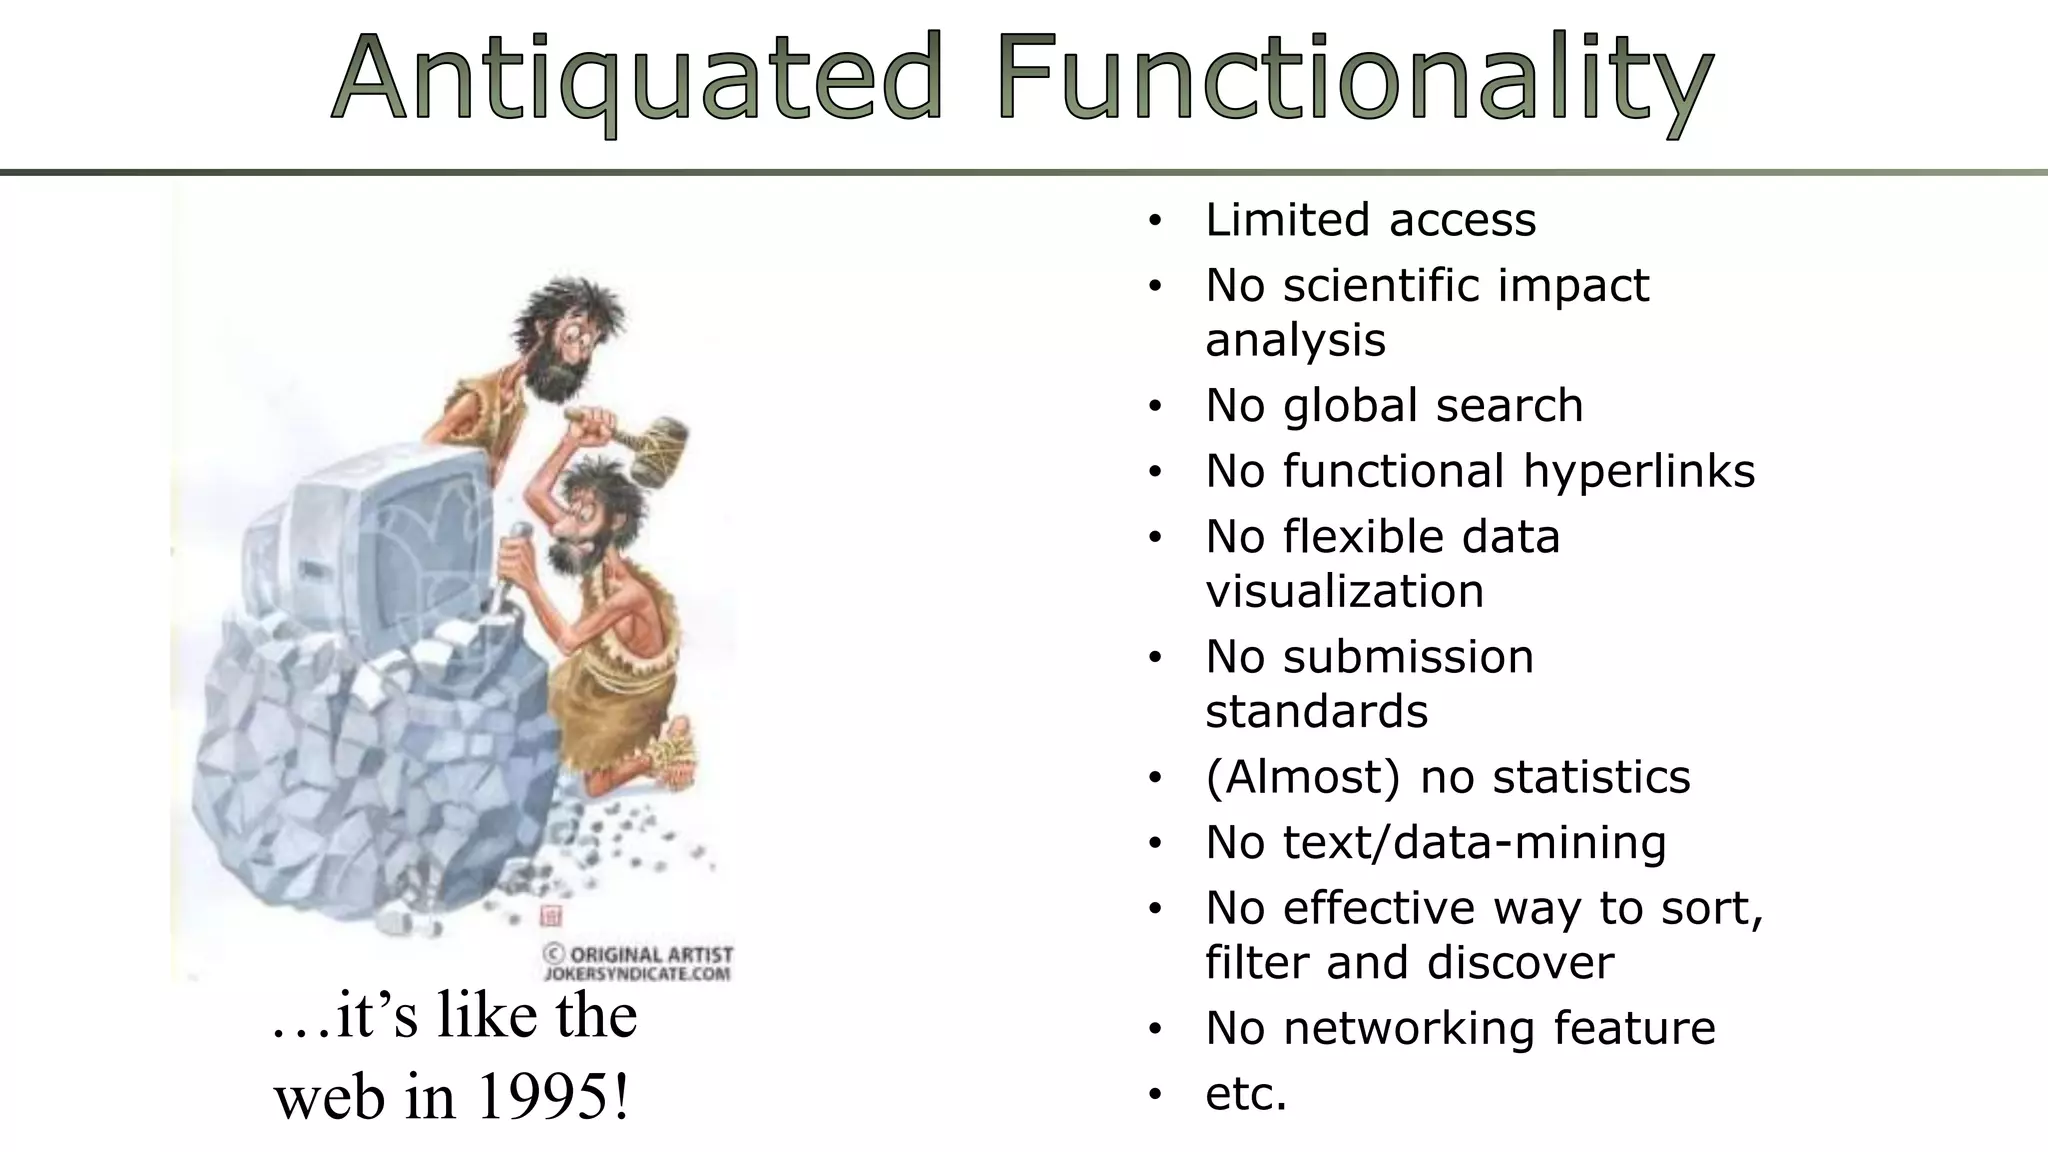
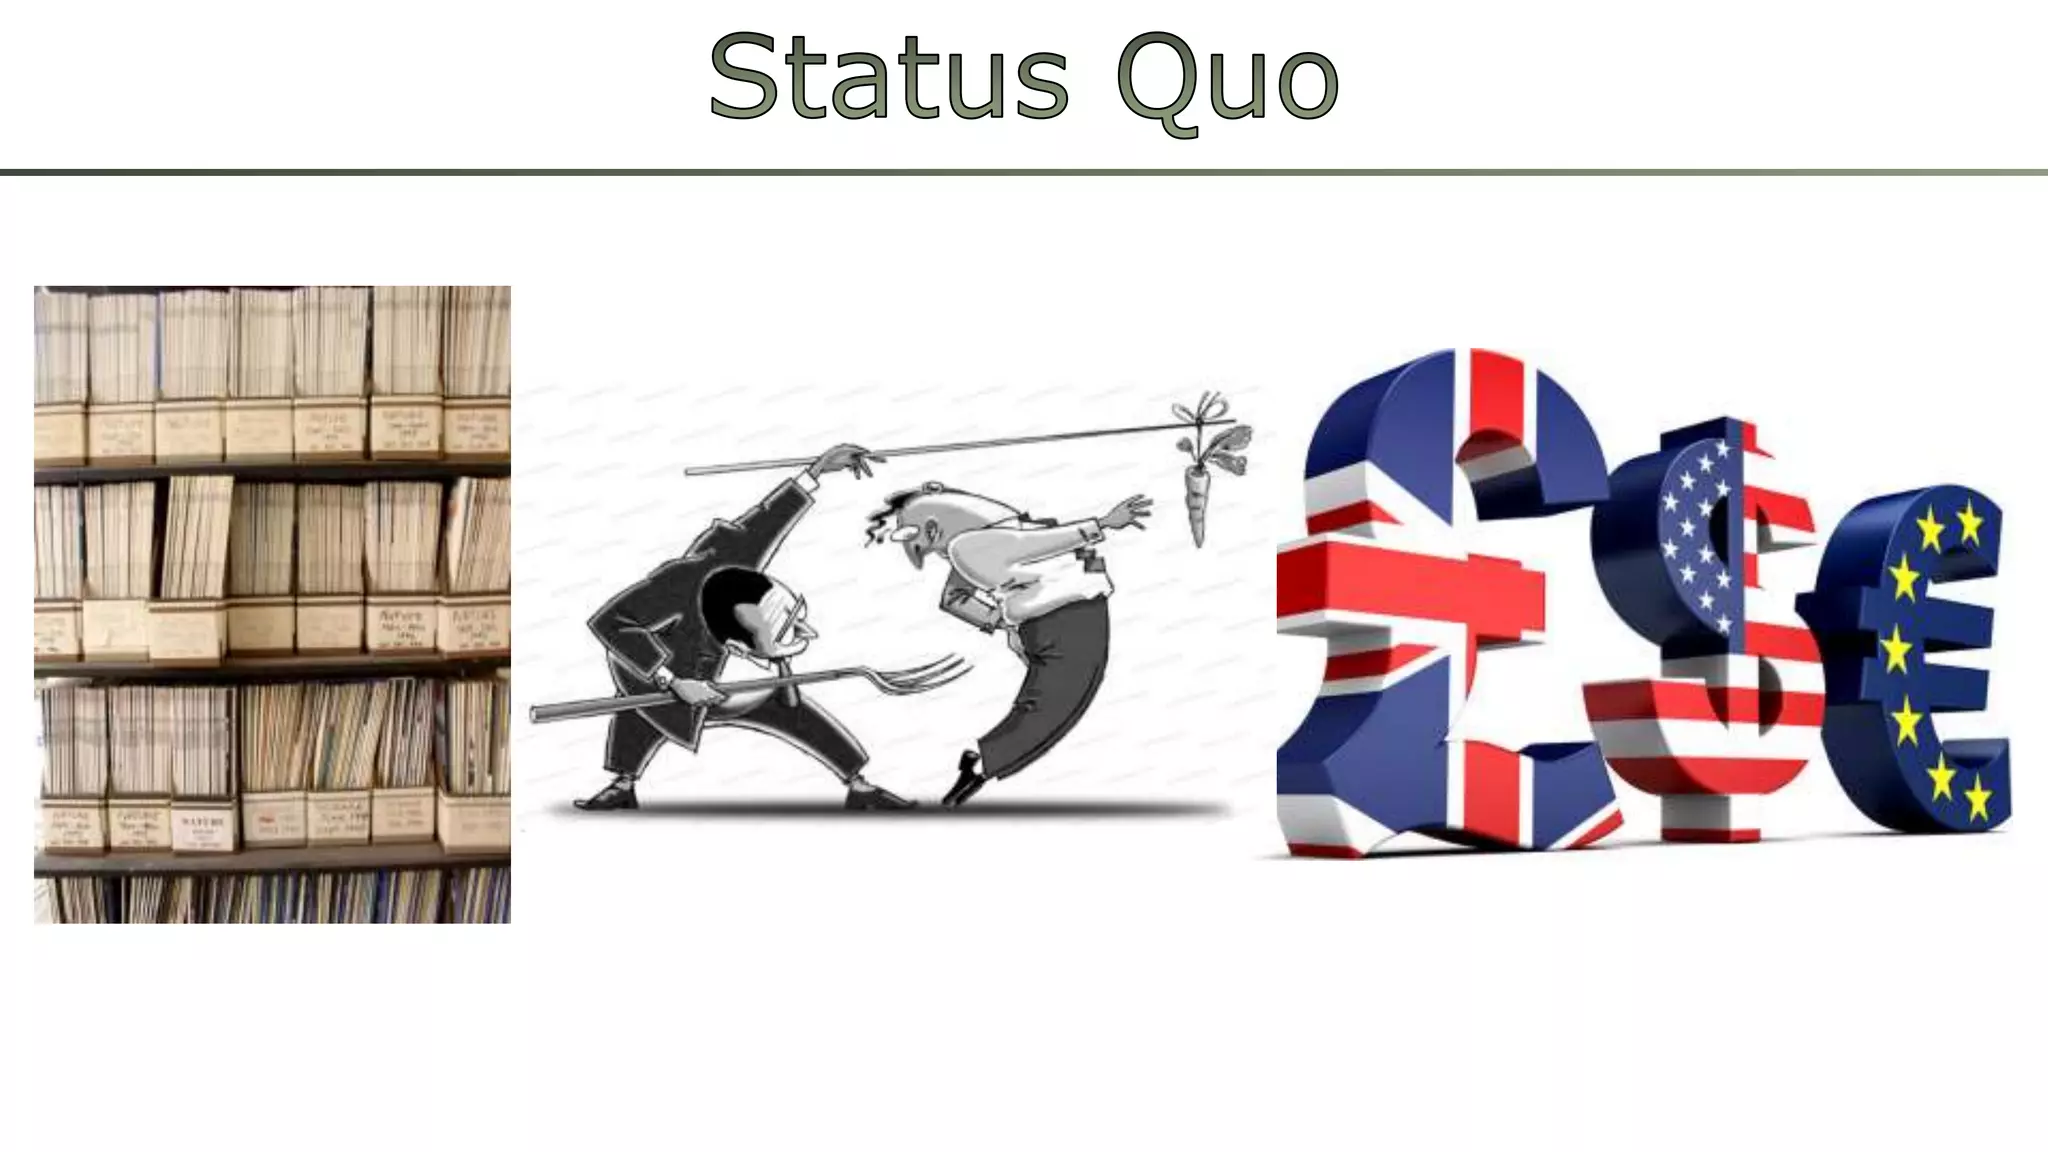
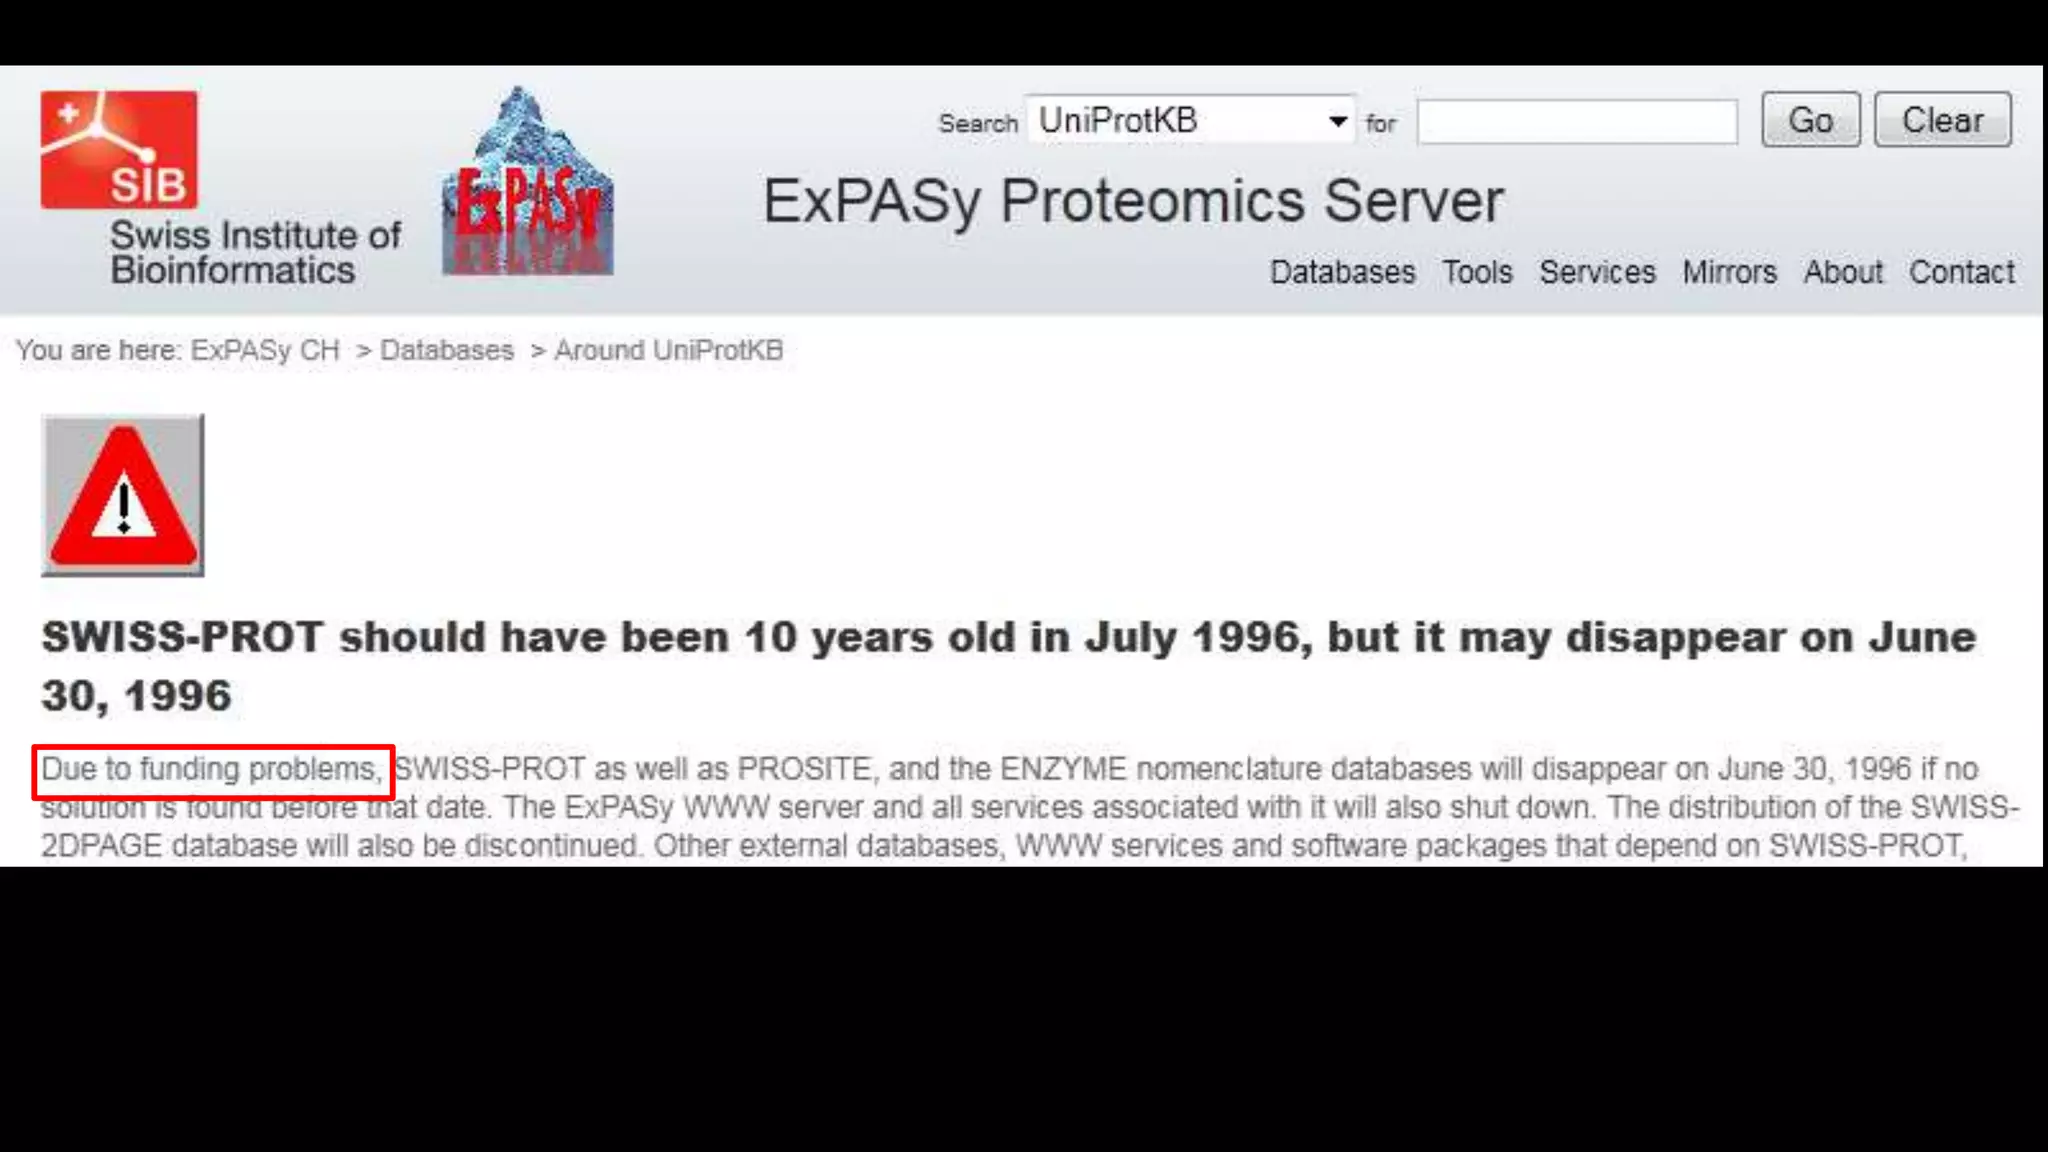
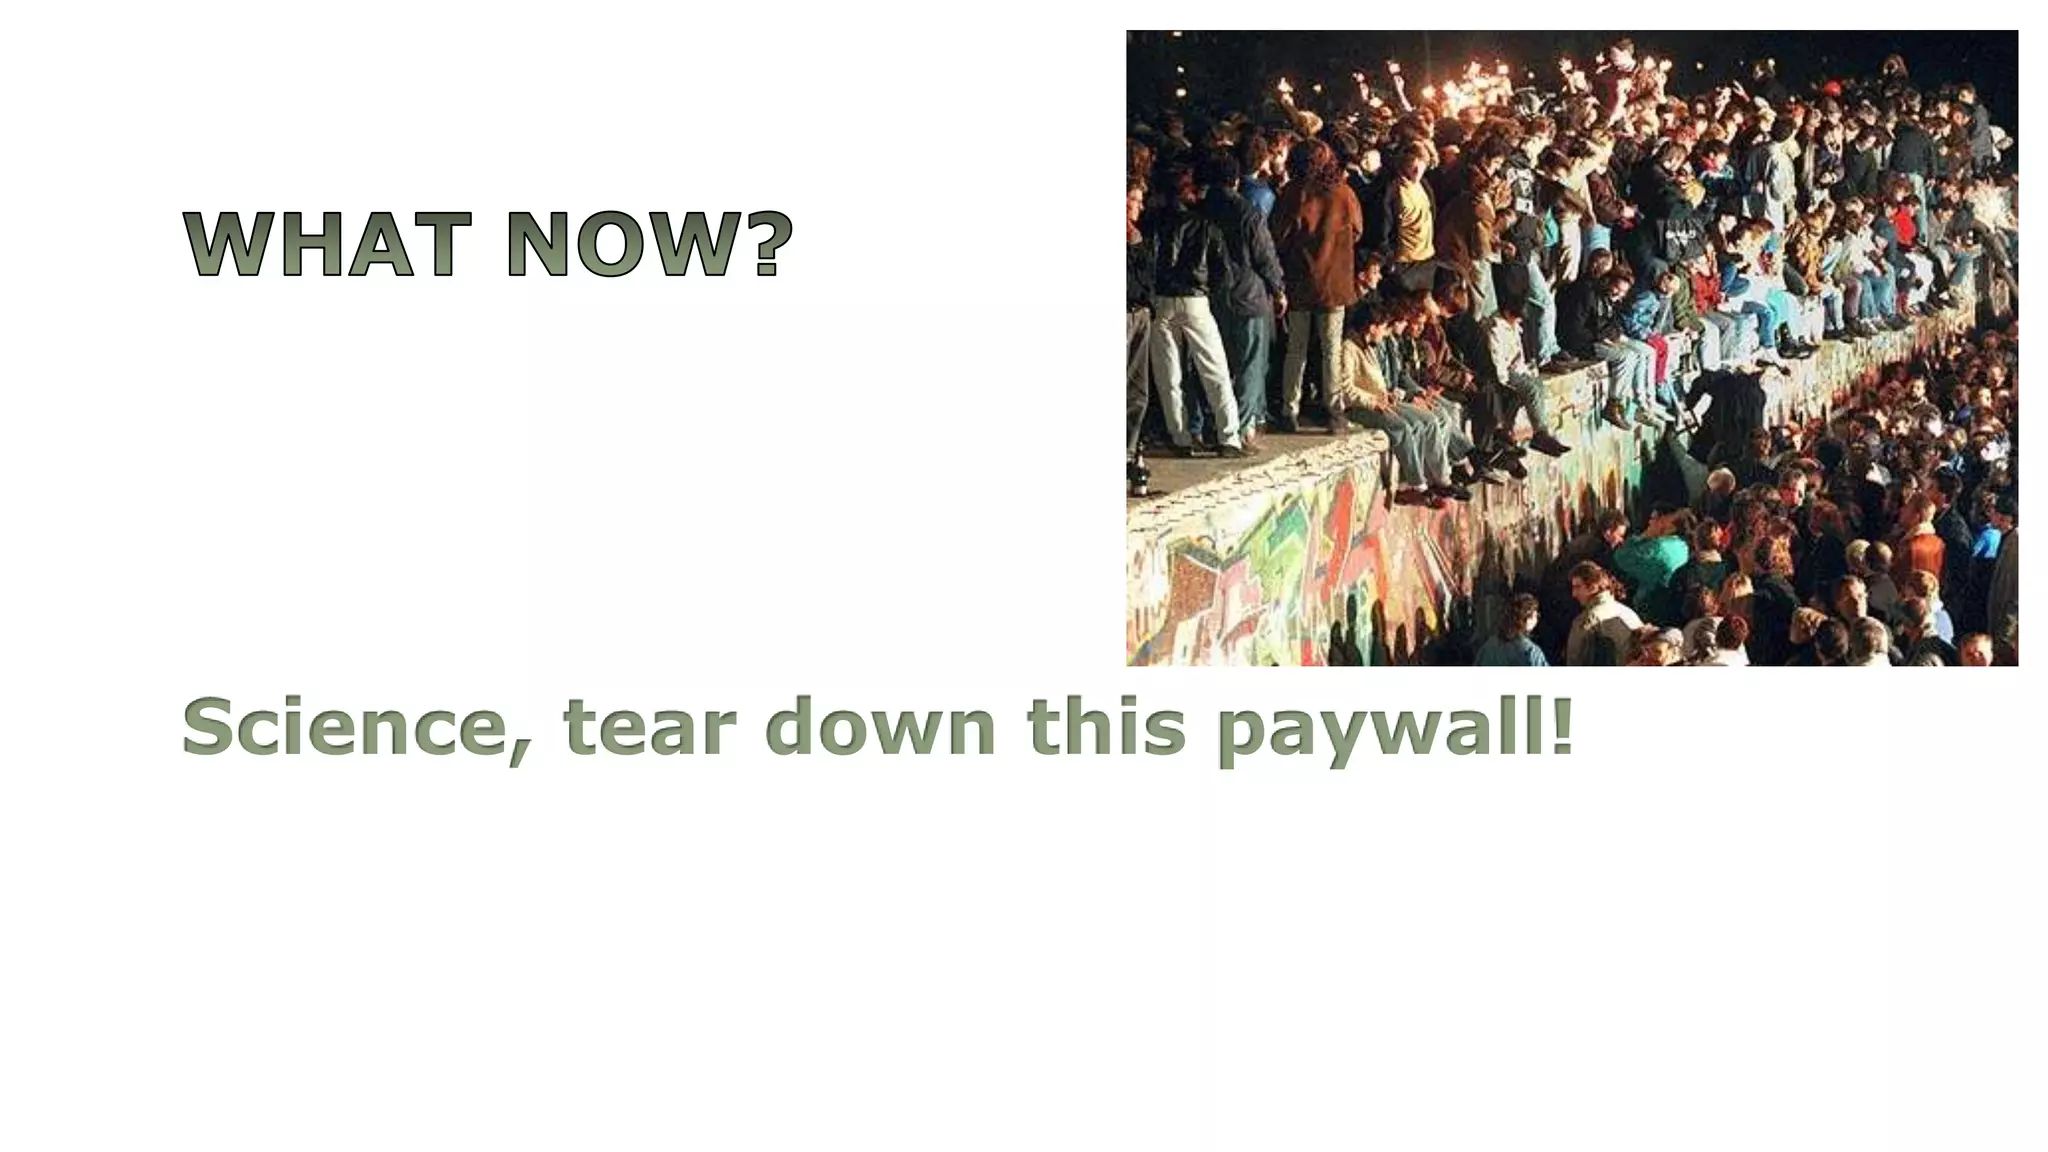
This document discusses issues with the current scholarly publishing system, including the impact factor metric and paywalls limiting access to research. It advocates for reforming the system by publishing in venues that are open access and evaluate works based on usage and sharing of data/code rather than journal prestige. Open and reproducible research could better serve scientists and maximize the impact of their findings.


![971119 [網頁]團體車輛租借辦法](https://cdn.slidesharecdn.com/ss_thumbnails/971119-1228721551179271-8-thumbnail.jpg?width=640&height=640&fit=bounds)


![971002 [新聞]全球瘋單車 各城市配套不同](https://cdn.slidesharecdn.com/ss_thumbnails/971002-1228720936722497-8-thumbnail.jpg?width=640&height=640&fit=bounds)


![971119 [新聞]北市原地租借費率](https://cdn.slidesharecdn.com/ss_thumbnails/971119-1228721544722993-8-thumbnail.jpg?width=640&height=640&fit=bounds)
![971023 [討論]會議記錄](https://cdn.slidesharecdn.com/ss_thumbnails/971023-1228721196410096-8-thumbnail.jpg?width=640&height=640&fit=bounds)
![971016 [網頁]道路使用照明](https://cdn.slidesharecdn.com/ss_thumbnails/971016-1228720999181912-8-thumbnail.jpg?width=640&height=640&fit=bounds)