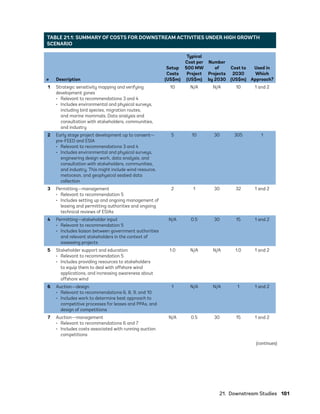
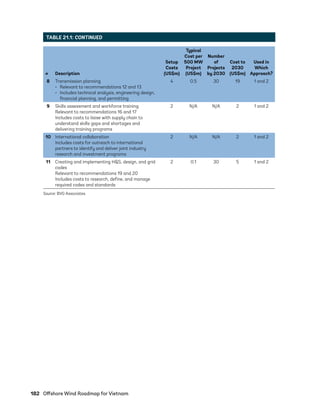
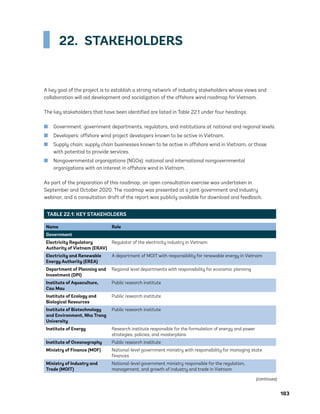
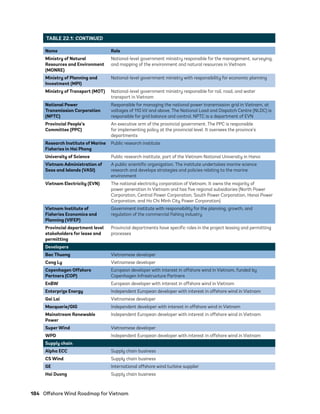
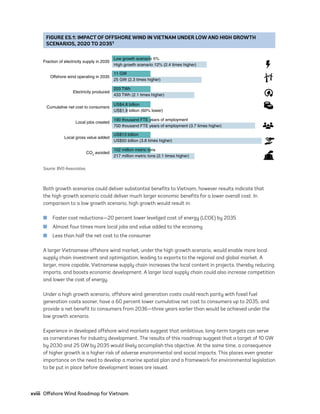
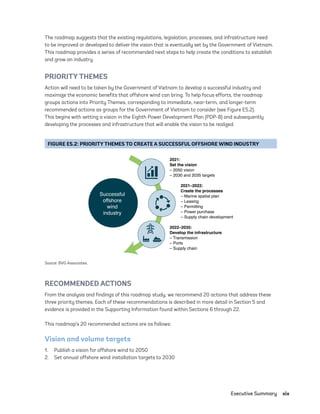
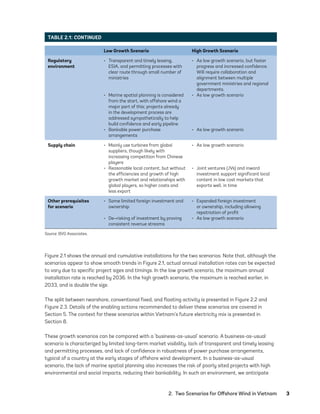
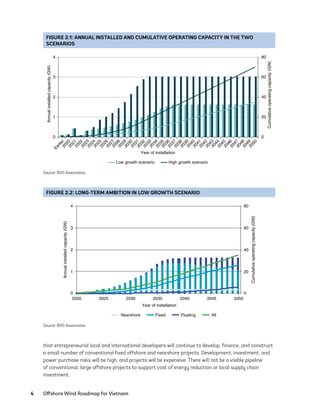
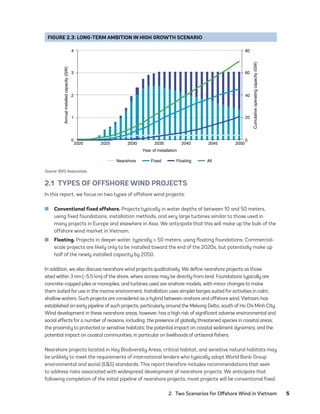
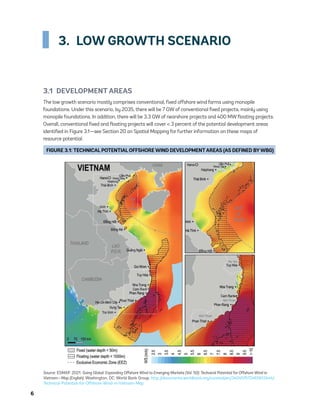
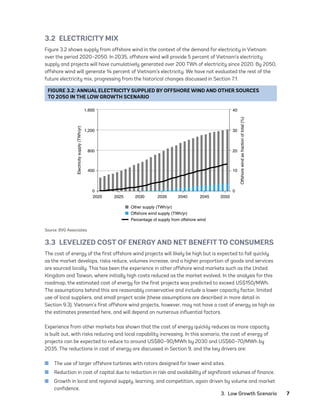
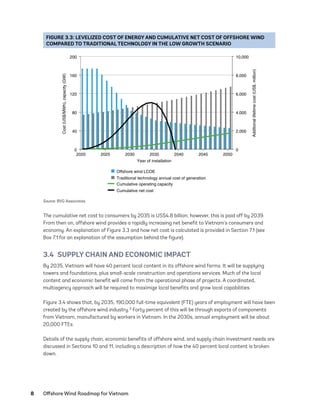
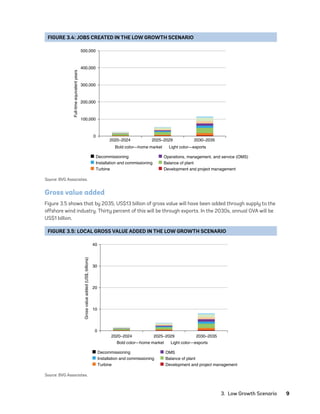
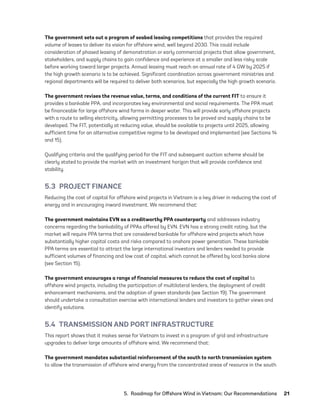
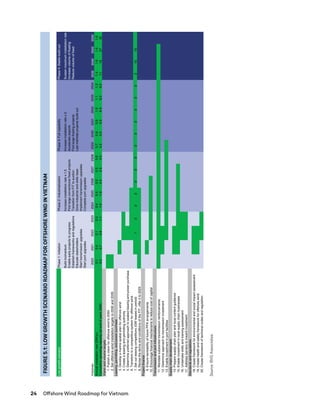
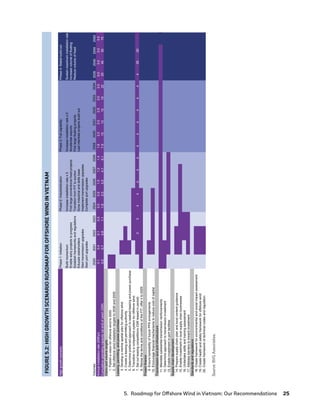
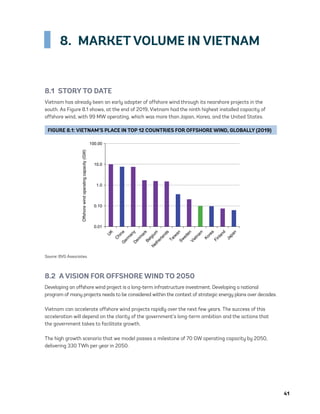
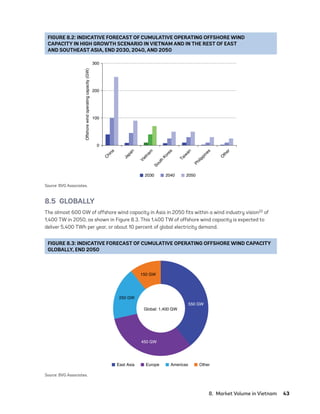
This document provides an offshore wind roadmap for Vietnam outlining two scenarios: low growth and high growth. Under the low growth scenario, Vietnam would have 500 MW of offshore wind capacity by 2030 focused on a few small pilot projects. The high growth scenario envisions 5,000 MW of offshore wind capacity by 2030 through larger commercial-scale projects. Both scenarios assess the impacts on Vietnam's electricity mix, costs, supply chain development, infrastructure needs, and environmental and social impacts. Key recommended actions focus on developing supportive policies, attracting investment, building local skills, and planning necessary transmission infrastructure.


![58 Offshore Wind Roadmap for Vietnam
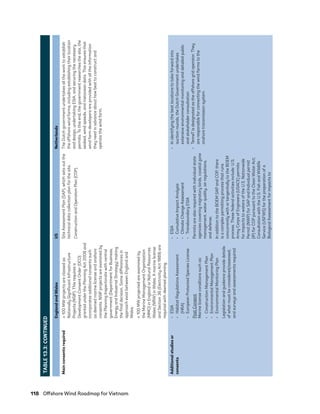
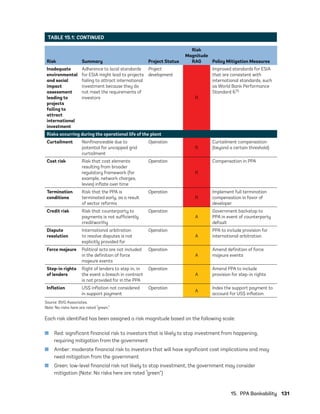
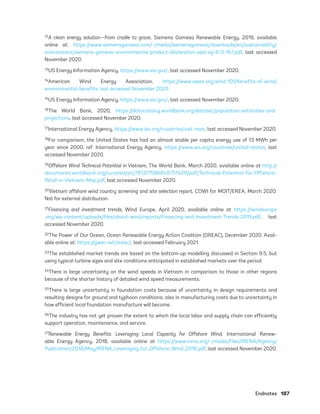
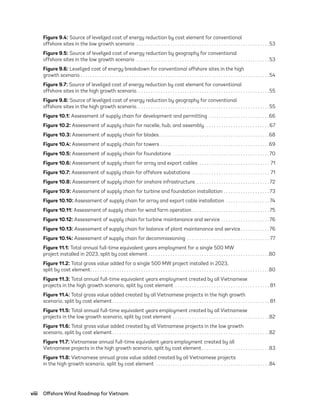
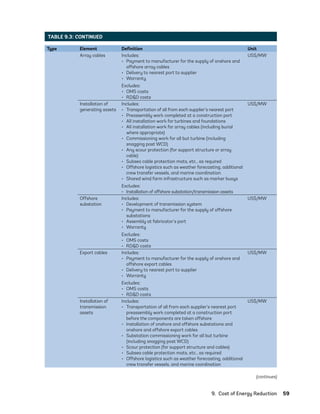
Cost element definitions
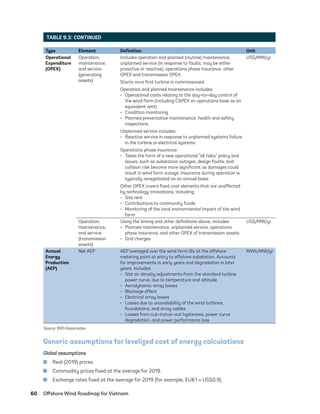
TABLE 9.3: COST ELEMENT DEFINITIONS
Type Element Definition Unit
Development
Expenditure
(DEVEX)
Development
and project
management
Development, permitting, and project management work
paid for by the developer up to works completion date
(WCD).
Includes:
• Internal and external activities such as environmental
and wildlife surveys; metocean surveys; met mast
(including installation); geophysical, geotechnical, and
hydrological services; and engineering (pre front end
engineering and design [FEED]) and planning studies
• Permitting services
• Further site investigations and surveys after final
investment decision (FID)
• FEED studies
• Environmental monitoring during construction
• Project management (work undertaken or contracted by
the developer up to WCD)
• Other administrative and professional services such as
accountancy and legal advice
• Any reservation payments to suppliers
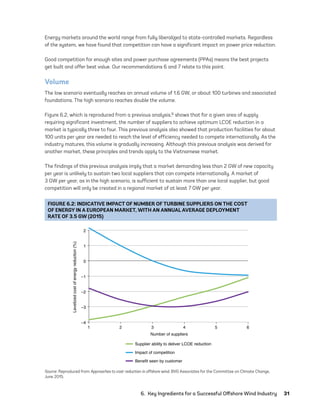
Excludes:
• Development costs of transmission system
• Construction phase insurance
• Suppliers own project management
US$/MW
Capital
Expenditure
(CAPEX)
Turbine (including
tower)
Includes:
• Payment to wind turbine manufacturer for the supply of:
• Rotor, including blades, hub, and pitch system
• Nacelle, including bearing, gearbox, generator, yaw
system, the electrical system to the array cables,
control systems, etc.
• Tower
• Assembly thereof
• Delivery to nearest port to supplier
• Warranty
• The wind turbine supplier aspects of commissioning costs
Excludes:
• Turbine OPEX
• Research, design, and development (RD&D) costs
US$/MW
Foundation Includes:
• Payment to suppliers for the supply of the support
structure comprising the foundation (including any
piles, transition piece, and secondary steel work such as
J-tubes and personnel access ladders and platforms)
• Delivery to nearest port to supplier
• Warranty
Excludes:
• Turbine tower
• Foundation OPEX
• RD&D costs
US$/MW
75983_ESMAP_Tech Report VM Wind-NEW.indd 58
75983_ESMAP_Tech Report VM Wind-NEW.indd 58 3/19/21 12:25 PM
3/19/21 12:25 PM](https://image.slidesharecdn.com/offshore-wind-development-program-offshore-wind-roadmap-for-vietnam-210621084705/85/Offshore-wind-development-program-offshore-wind-roadmap-for-vietnam-80-320.jpg)


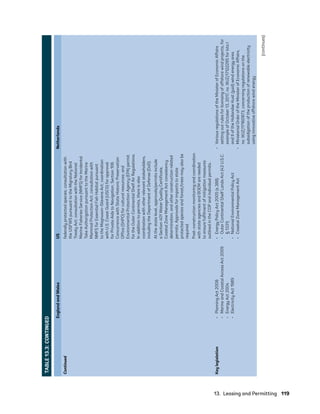
![104 Offshore Wind Roadmap for Vietnam
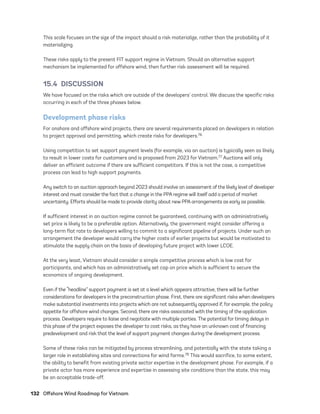
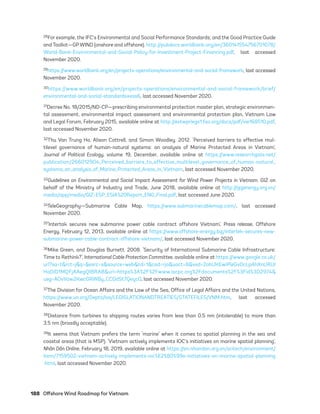
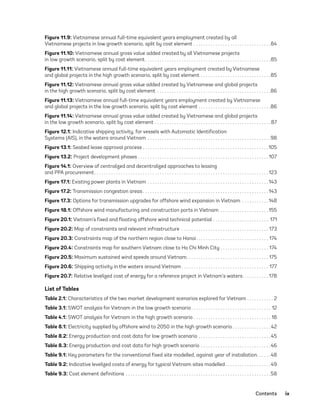
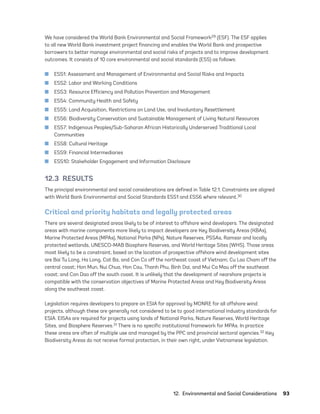
13.3 RESULTS
Key legislation
The main laws that govern offshore wind energy in Vietnam are:
■ Investment law,
■ Land law, and
■ Electricity law and the law on environmental protection.54
Specific pieces of Vietnamese legislation on renewable energy are outlined in Section 13.5.
Resources
The Government Office is a ministry-level agency that assists the government and the Prime Minister
(PM).55 In the Government Office, the Department of Industry and Trade (DOIT) currently deals with
offshore wind lease and permit applications and consults with various ministries including:
■ MOIT—(via the Electricity and Renewable Energy Authority [EREA]) or the provincial departments
of industry and trade, depending on the capacity of the projects. MOIT is the main regulator for
renewable energy,
■ The Electricity Regulatory Authority of Vietnam (ERAV) manages the development of all power
projects; however, EREA has the authority and responsibility for regulating FITs for renewable
energy,
■ Ministry of Natural Resources and Environment (MONRE) and the provincial departments of
natural resources and environment, who approve environmental impact assessments,
■ Ministry of Industries and Production (MOIP), and
■ Ministry of Construction.
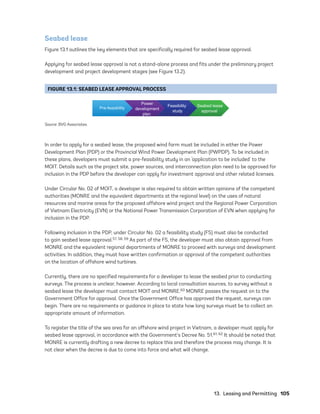
Site identification and exclusivity
The first stages of offshore wind development involve the developer undertaking of preliminary
studies to find a suitable site for development, including site availability and obtaining a subsequent
acceptance letter for site exclusivity.56
After receiving an exclusivity letter from MOIT/Provincial Peoples Committee (PPC), or the Prime
Minister’s office the developer is entitled to perform wind measurement activities on site to feed into
pre-
feasibility studies. This is effectively a pre-lease and allows the developer to start the seabed lease
approval process.
All applicants consult with the provincial governments as a starting point, such that any duplication
of a site would be flagged very early in the process. No formal clearing process for competing interest
currently exists.
75983_ESMAP_Tech Report VM Wind-NEW.indd 104
75983_ESMAP_Tech Report VM Wind-NEW.indd 104 3/19/21 12:25 PM
3/19/21 12:25 PM](https://image.slidesharecdn.com/offshore-wind-development-program-offshore-wind-roadmap-for-vietnam-210621084705/85/Offshore-wind-development-program-offshore-wind-roadmap-for-vietnam-126-320.jpg)