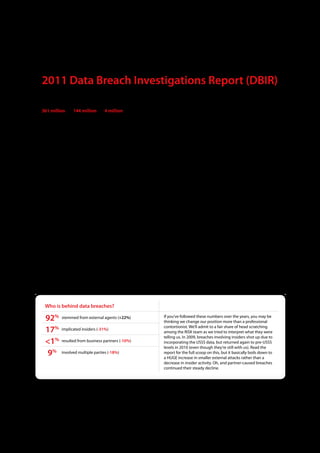
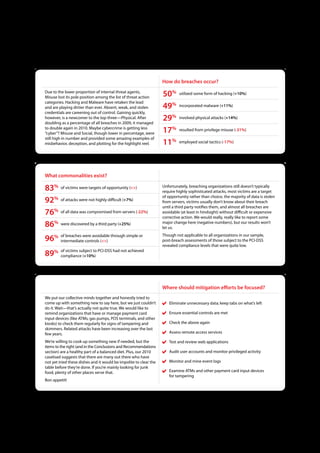
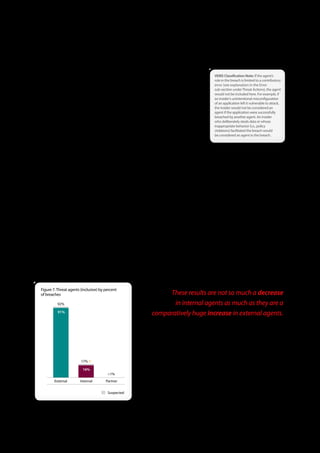
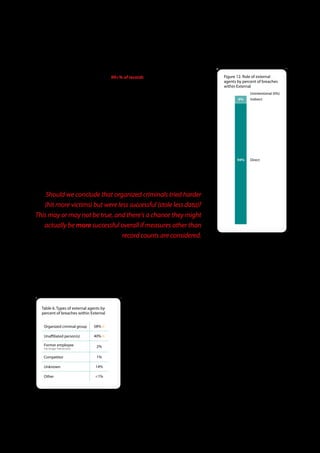
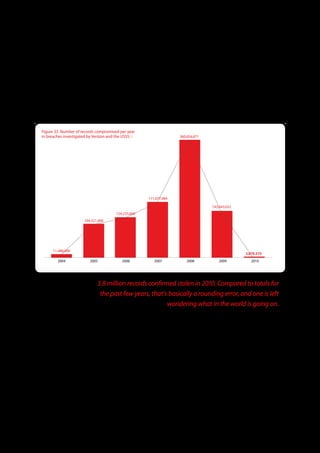
2011
Data Breach
         Investigations Report
A study conducted by the Verizon RISK Team with cooperation from
    the U.S. Secret Service and the Dutch High Tech Crime Unit.
2011 Data Breach Investigations Report
LEAD ANALYSTS/                TABLE OF CONTENTS
AUTHORS:
                              Executive Summary  .  .  .  .  .  .  .  .  .  .  .  .  .  .  .  .  .  .  .  .  .  .  .  .  .  .  .  .  .  .  .  .  .  .  .  .  .  .  .  .  .  .  .  .  .  .  .  .  .  .  .  .  .  .  .  .  .  .  .  .  .  .  . 2
Wade Baker
Alexander Hutton              Year in Review, 2010  .  .  .  .  .  .  .  .  .  .  .  .  .  .  .  .  .  .  .  .  .  .  .  .  .  .  .  .  .  .  .  .  .  .  .  .  .  .  .  .  .  .  .  .  .  .  .  .  .  .  .  .  .  .  .  .  .  .  .  .  .  .  . 4
C. David Hylender                    2010: The U .S . Secret Service Perspective .  .  .  .  .  .  .  .  .  .  .  .  .  .  .  .  .  .  .  .  .  .  .  .  .  .  .  .  .  .  .  .  .  .  .  .  .  .  .  . 6
Joseph Pamula, Ph.D.          2011 DBIR: Methodology  .  .  .  .  .  .  .  .  .  .  .  .  .  .  .  .  .  .  .  .  .  .  .  .  .  .  .  .  .  .  .  .  .  .  .  .  .  .  .  .  .  .  .  .  .  .  .  .  .  .  .  .  .  .  .  .  .  . 7
Christopher Porter                   Verizon Data Collection Methodology  .  .  .  .  .  .  .  .  .  .  .  .  .  .  .  .  .  .  .  .  .  .  .  .  .  .  .  .  .  .  .  .  .  .  .  .  .  .  .  .  .  .  . 7
Marc Spitler
                                     USSS Data Collection Methodology  .  .  .  .  .  .  .  .  .  .  .  .  .  .  .  .  .  .  .  .  .  .  .  .  .  .  .  .  .  .  .  .  .  .  .  .  .  .  .  .  .  .  .  .  . 8
                                     NHTCU Data Collection Methodology  .  .  .  .  .  .  .  .  .  .  .  .  .  .  .  .  .  .  .  .  .  .  .  .  .  .  .  .  .  .  .  .  .  .  .  .  .  .  .  .  .  .  . 8
AUTHORS
                                     Classifying Incidents Using VERIS .  .  .  .  .  .  .  .  .  .  .  .  .  .  .  .  .  .  .  .  .  .  .  .  .  .  .  .  .  .  .  .  .  .  .  .  .  .  .  .  .  .  .  .  .  .  .  . 9
Andy Bonillo
                                     Turning the Incident Narrative into Metrics  .  .  .  .  .  .  .  .  .  .  .  .  .  .  .  .  .  .  .  .  .  .  .  .  .  .  .  .  .  .  .  .  .  .  .  .  . 10
Ben van Erck
Mark Goudie                          A Word on Sample Bias  .  .  .  .  .  .  .  .  .  .  .  .  .  .  .  .  .  .  .  .  .  .  .  .  .  .  .  .  .  .  .  .  .  .  .  .  .  .  .  .  .  .  .  .  .  .  .  .  .  .  .  .  .  .  .  . 11
Jelle Niemantsverdriet        Results and Analysis  .  .  .  .  .  .  .  .  .  .  .  .  .  .  .  .  .  .  .  .  .  .  .  .  .  .  .  .  .  .  .  .  .  .  .  .  .  .  .  .  .  .  .  .  .  .  .  .  .  .  .  .  .  .  .  .  .  .  .  .  .  . 11
Christopher Novak                    Demographics  .  .  .  .  .  .  .  .  .  .  .  .  .  .  .  .  .  .  .  .  .  .  .  .  .  .  .  .  .  .  .  .  .  .  .  .  .  .  .  .  .  .  .  .  .  .  .  .  .  .  .  .  .  .  .  .  .  .  .  .  .  .  .  . 12
Rafael Perelstein                    2010 Threat Event Overview  .  .  .  .  .  .  .  .  .  .  .  .  .  .  .  .  .  .  .  .  .  .  .  .  .  .  .  .  .  .  .  .  .  .  .  .  .  .  .  .  .  .  .  .  .  .  .  .  .  .  . 15
Mike Rosen
                                     Threat Agents  .  .  .  .  .  .  .  .  .  .  .  .  .  .  .  .  .  .  .  .  .  .  .  .  .  .  .  .  .  .  .  .  .  .  .  .  .  .  .  .  .  .  .  .  .  .  .  .  .  .  .  .  .  .  .  .  .  .  .  .  .  .  .  .  . 17
Bryan Sartin
Peter Tippett, M.D., Ph.D.                       Breach Size by Threat Agents  .  .  .  .  .  .  .  .  .  .  .  .  .  .  .  .  .  .  .  .  .  .  .  .  .  .  .  .  .  .  .  .  .  .  .  .  .  .  .  .  .  .  .  .  .  . 19
J. Andrew Valentine                              External Agents .  .  .  .  .  .  .  .  .  .  .  .  .  .  .  .  .  .  .  .  .  .  .  .  .  .  .  .  .  .  .  .  .  .  .  .  .  .  .  .  .  .  .  .  .  .  .  .  .  .  .  .  .  .  .  .  .  .  . 20
Men and women of the                             Internal Agents  .  .  .  .  .  .  .  .  .  .  .  .  .  .  .  .  .  .  .  .  .  .  .  .  .  .  .  .  .  .  .  .  .  .  .  .  .  .  .  .  .  .  .  .  .  .  .  .  .  .  .  .  .  .  .  .  .  .  . 22
U.S. Secret Service
                                                 Partner Agents  .  .  .  .  .  .  .  .  .  .  .  .  .  .  .  .  .  .  .  .  .  .  .  .  .  .  .  .  .  .  .  .  .  .  .  .  .  .  .  .  .  .  .  .  .  .  .  .  .  .  .  .  .  .  .  .  .  .  . 23
Men and women of the
Dutch High Tech Crime Unit           Threat Actions .  .  .  .  .  .  .  .  .  .  .  .  .  .  .  .  .  .  .  .  .  .  .  .  .  .  .  .  .  .  .  .  .  .  .  .  .  .  .  .  .  .  .  .  .  .  .  .  .  .  .  .  .  .  .  .  .  .  .  .  .  .  .  .  . 24
                                                 Malware  .  .  .  .  .  .  .  .  .  .  .  .  .  .  .  .  .  .  .  .  .  .  .  .  .  .  .  .  .  .  .  .  .  .  .  .  .  .  .  .  .  .  .  .  .  .  .  .  .  .  .  .  .  .  .  .  .  .  .  .  .  .  .  .  .  . 27
CONTRIBUTORS:                                    Hacking  .  .  .  .  .  .  .  .  .  .  .  .  .  .  .  .  .  .  .  .  .  .  .  .  .  .  .  .  .  .  .  .  .  .  .  .  .  .  .  .  .  .  .  .  .  .  .  .  .  .  .  .  .  .  .  .  .  .  .  .  .  .  .  .  .  . 31

Steve Adams                                      Social  .  .  .  .  .  .  .  .  .  .  .  .  .  .  .  .  .  .  .  .  .  .  .  .  .  .  .  .  .  .  .  .  .  .  .  .  .  .  .  .  .  .  .  .  .  .  .  .  .  .  .  .  .  .  .  .  .  .  .  .  .  .  .  .  .  .  .  . 36
Thijs Bosschert                                  Misuse  .  .  .  .  .  .  .  .  .  .  .  .  .  .  .  .  .  .  .  .  .  .  .  .  .  .  .  .  .  .  .  .  .  .  .  .  .  .  .  .  .  .  .  .  .  .  .  .  .  .  .  .  .  .  .  .  .  .  .  .  .  .  .  .  .  .  . 38
Eric Brohm                                       Physical  .  .  .  .  .  .  .  .  .  .  .  .  .  .  .  .  .  .  .  .  .  .  .  .  .  .  .  .  .  .  .  .  .  .  .  .  .  .  .  .  .  .  .  .  .  .  .  .  .  .  .  .  .  .  .  .  .  .  .  .  .  .  .  .  .  . 40
Calvin Chang
                                                 Error  .  .  .  .  .  .  .  .  .  .  .  .  .  .  .  .  .  .  .  .  .  .  .  .  .  .  .  .  .  .  .  .  .  .  .  .  .  .  .  .  .  .  .  .  .  .  .  .  .  .  .  .  .  .  .  .  .  .  .  .  .  .  .  .  .  .  .  .  . 42
Ron Dormido
                                                 Environmental .  .  .  .  .  .  .  .  .  .  .  .  .  .  .  .  .  .  .  .  .  .  .  .  .  .  .  .  .  .  .  .  .  .  .  .  .  .  .  .  .  .  .  .  .  .  .  .  .  .  .  .  .  .  .  .  .  .  .  . 42
Kylee Evans
Jason Fisher                         Assets and Attributes  .  .  .  .  .  .  .  .  .  .  .  .  .  .  .  .  .  .  .  .  .  .  .  .  .  .  .  .  .  .  .  .  .  .  .  .  .  .  .  .  .  .  .  .  .  .  .  .  .  .  .  .  .  .  .  .  .  . 43
Eric Gentry                          Compromised Data  .  .  .  .  .  .  .  .  .  .  .  .  .  .  .  .  .  .  .  .  .  .  .  .  .  .  .  .  .  .  .  .  .  .  .  .  .  .  .  .  .  .  .  .  .  .  .  .  .  .  .  .  .  .  .  .  .  .  . 47
John Grim                            Attack Difficulty  .  .  .  .  .  .  .  .  .  .  .  .  .  .  .  .  .  .  .  .  .  .  .  .  .  .  .  .  .  .  .  .  .  .  .  .  .  .  .  .  .  .  .  .  .  .  .  .  .  .  .  .  .  .  .  .  .  .  .  .  .  .  . 51
Clarence Hill
                                     Attack Targeting  .  .  .  .  .  .  .  .  .  .  .  .  .  .  .  .  .  .  .  .  .  .  .  .  .  .  .  .  .  .  .  .  .  .  .  .  .  .  .  .  .  .  .  .  .  .  .  .  .  .  .  .  .  .  .  .  .  .  .  .  .  .  . 52
Kenny Lee
                                     Unknown Unknowns  .  .  .  .  .  .  .  .  .  .  .  .  .  .  .  .  .  .  .  .  .  .  .  .  .  .  .  .  .  .  .  .  .  .  .  .  .  .  .  .  .  .  .  .  .  .  .  .  .  .  .  .  .  .  .  .  .  . 53
Wayne Lee
Kevin Long                           Timespan of Attack  .  .  .  .  .  .  .  .  .  .  .  .  .  .  .  .  .  .  .  .  .  .  .  .  .  .  .  .  .  .  .  .  .  .  .  .  .  .  .  .  .  .  .  .  .  .  .  .  .  .  .  .  .  .  .  .  .  .  .  . 54
David Ostertag                       Breach Discovery Methods .  .  .  .  .  .  .  .  .  .  .  .  .  .  .  .  .  .  .  .  .  .  .  .  .  .  .  .  .  .  .  .  .  .  .  .  .  .  .  .  .  .  .  .  .  .  .  .  .  .  .  .  . 58
Matthew Speicher                     Anti-Forensics  .  .  .  .  .  .  .  .  .  .  .  .  .  .  .  .  .  .  .  .  .  .  .  .  .  .  .  .  .  .  .  .  .  .  .  .  .  .  .  .  .  .  .  .  .  .  .  .  .  .  .  .  .  .  .  .  .  .  .  .  .  .  .  .  . 60
Enrico Telemaque
                                     PCI DSS Compliance  .  .  .  .  .  .  .  .  .  .  .  .  .  .  .  .  .  .  .  .  .  .  .  .  .  .  .  .  .  .  .  .  .  .  .  .  .  .  .  .  .  .  .  .  .  .  .  .  .  .  .  .  .  .  .  .  .  .  . 62
Yuichi Uzawa
                              Conclusions and Recommendations  .  .  .  .  .  .  .  .  .  .  .  .  .  .  .  .  .  .  .  .  .  .  .  .  .  .  .  .  .  .  .  .  .  .  .  .  .  .  .  .  .  .  .  .  .  . 65
Nicolas Villatte
Paul Wright                   Appendix A: Case Statistics from the Dutch High Tech Crime Unit  .  .  .  .  .  .  .  .  .  .  .  .  .  .  .  .  .  . 68
                              Appendix B: Project Taurus and the Bredolab Takedown  .  .  .  .  .  .  .  .  .  .  .  .  .  .  .  .  .  .  .  .  .  .  .  .  .  .  . 71
SPECIAL THANKS TO:            About Verizon Investigative Response .  .  .  .  .  .  .  .  .  .  .  .  .  .  .  .  .  .  .  .  .  .  .  .  .  .  .  .  .  .  .  .  .  .  .  .  .  .  .  .  .  .  .  .  . 71
Christopher Abod              About the United States Secret Service  .  .  .  .  .  .  .  .  .  .  .  .  .  .  .  .  .  .  .  .  .  .  .  .  .  .  .  .  .  .  .  .  .  .  .  .  .  .  .  .  .  .  .  . 72
Brianna Boyle                 About the Dutch National High Tech Crime Unit  .  .  .  .  .  .  .  .  .  .  .  .  .  .  .  .  .  .  .  .  .  .  .  .  .  .  .  .  .  .  .  .  .  .  . 72
Mike Brubaker
Anita Fortunato               For additional updates and commentary, please visit
And our continued gratitude   http://securityblog .verizonbusiness .com .
to all those we’ve named      For inquiries directed to the United States Secret Service, contact
before and haven’t yet        databreachstudy@usss .dhs .gov .
2011 Data Breach Investigations Report (DBIR)
Executive Summary
361 million >> 144 million >> 4 million. Thus goes the tally of total records compromised across the combined caseload
of Verizon and the United States Secret Service (USSS) over the last three years. After four years of increasing losses culminating
in 2008’s record-setting 361 million, we speculated whether 2009’s drop to 144 million was a fluke or a sign of things to come.
2010’s total of less than four million compromised records seems to suggest it was a sign. But of what? And is it a permanent
change in direction or a temporary detour?

To help us answer that, we are very glad to have the United States Secret Service (USSS) back with us for the 2011 DBIR.
Additionally, we have the pleasure of welcoming the Dutch National High Tech Crime Unit (NHTCU) to the team. Through this
cooperative effort, we had the privilege—and challenge—of examining about 800 new data compromise incidents since
our last report (with 761 of those for 2010). To put that in perspective, the entire Verizon-USSS dataset from 2004 to 2009
numbered just over 900 breaches. We very nearly doubled the size of our dataset in 2010 alone!

It is fascinating from a research standpoint that the all-time lowest amount of data loss occurred in the same year as the all-
time highest amount of incidents investigated. In addition to being the largest caseload ever, it was also extremely diverse in
the threat agents, threat actions, affected assets, and security attributes involved. We witnessed highly automated and prolific
external attacks, low and slow attacks, intricate internal fraud rings, country-wide device tampering schemes, cunning social
engineering plots, and much more. Some of the raw statistics may seem to contradict this claim of diversity (e.g., the percent
of breaches attributed to external agents is more lopsided than ever), but one must consider the change in scale. Whereas
“10%” used to mean approximately 10-15 breaches across an annual caseload averaging 100-150, it now means 75 breaches
in the context of the 2010 caseload. Consider that fact as you digest and ponder results from this year’s report.

With the addition of Verizon’s 2010 caseload and data contributed from the USSS and NHTCU, the DBIR series now spans
7 years, 1700+ breaches, and over 900 million compromised records. We continue to learn a great deal from this ongoing
study and we’re glad to have the opportunity once again to share these findings with you. As always, our goal is that the data
and analysis presented in this report prove helpful to the planning and security efforts of our readers. As usual, we begin with
a few highlights below.


 Who is behind data breaches?

 92% stemmed from external agents (+22%)                            If you’ve followed these numbers over the years, you may be
                                                                    thinking we change our position more than a professional

 17% implicated insiders (-31%)                                     contortionist . We’ll admit to a fair share of head scratching
                                                                    among the RISK team as we tried to interpret what they were
                                                                    telling us . In 2009, breaches involving insiders shot up due to
 <1% resulted from business partners (-10%)                         incorporating the USSS data, but returned again to pre-USSS
                                                                    levels in 2010 (even though they’re still with us) . Read the
  9% involved multiple parties (-18%)                               report for the full scoop on this, but it basically boils down to
                                                                    a HUGE increase in smaller external attacks rather than a
                                                                    decrease in insider activity . Oh, and partner-caused breaches
                                                                    continued their steady decline .


                                                                2
How do breaches occur?
Due to the lower proportion of internal threat agents,
Misuse lost its pole position among the list of threat action          50%      utilized some form of hacking (+10%)

categories . Hacking and Malware have retaken the lead
and are playing dirtier than ever . Absent, weak, and stolen           49%      incorporated malware (+11%)
credentials are careening out of control . Gaining quickly,
however, is a newcomer to the top three—Physical . After
doubling as a percentage of all breaches in 2009, it managed
                                                                       29%      involved physical attacks (+14%)

to double again in 2010 . Maybe cybercrime is getting less
“cyber”? Misuse and Social, though lower in percentage, were           17%      resulted from privilege misuse (-31%)
still high in number and provided some amazing examples of
misbehavior, deception, and plotting for the highlight reel .          11%      employed social tactics (-17%)


What commonalities exist?

83% of victims were targets of opportunity (<>)                        Unfortunately, breaching organizations still doesn’t typically
                                                                       require highly sophisticated attacks, most victims are a target
                                                                       of opportunity rather than choice, the majority of data is stolen
92% of attacks were not highly difficult (+7%)                         from servers, victims usually don’t know about their breach
                                                                       until a third party notifies them, and almost all breaches are
76% of all data was compromised from servers (-22%)                    avoidable (at least in hindsight) without difficult or expensive
                                                                       corrective action . We would really, really like to report some
86% were discovered by a third party (+25%)                            major change here (negative numbers), but our results won’t
                                                                       let us .
                                                                       Though not applicable to all organizations in our sample,
96% of breaches were avoidable through simple or
    intermediate controls (<>)                                         post-breach assessments of those subject to the PCI-DSS
                                                                       revealed compliance levels that were quite low .

89% of victims subject to PCI-DSS had not achieved
    compliance (+10%)


                                                                       Where should mitigation efforts be focused?
We put our collective minds together and honestly tried to
come up with something new to say here, but we just couldn’t              Eliminate unnecessary data; keep tabs on what’s left
do it . Wait—that’s actually not quite true . We would like to
remind organizations that have or manage payment card                     Ensure essential controls are met
input devices (like ATMs, gas pumps, POS terminals, and other
kiosks) to check them regularly for signs of tampering and                Check the above again
skimmers . Related attacks have been increasing over the last
few years .                                                               Assess remote access services

We’re willing to cook up something new if needed, but the                 Test and review web applications
items to the right (and in the Conclusions and Recommendations
section) are a healthy part of a balanced diet . Plus, our 2010           Audit user accounts and monitor privileged activity
caseload suggests that there are many out there who have
not yet tried these dishes and it would be impolite to clear the          Monitor and mine event logs
table before they’re done . If you’re mainly looking for junk
food, plenty of other places serve that .                                 Examine ATMs and other payment card input devices
                                                                          for tampering
Bon appetit!


                                                                   3
Year in Review, 2010
  Cloud, Aurora, Mobility, Zeus, APT, Wikileaks, Stuxnet, Anonymous. If a word cloud were created using infosec headlines from
  2010, these would certainly be rendered big and bold. It’s an interesting juxtaposition of themes. While the Cloud and mobile
  devices increasingly allow us to do anything from anywhere with anyone at any time, Aurora, Zeus, Advanced Persistent
  Threats (APTs), Wikileaks, and Stuxnet remind us of the difficulty of protecting our information assets in a usability-driven
  world. Because our caseload (and that of the USSS and NHTCU) is a window into that world, one would expect to glimpse
  aspects of it in this annual report on breach trends. And this year’s DBIR meets that expectation.

                                                                 Apart from the word “Security,” “Cloud” was the next most-
We are often asked whether “the Cloud”                           common word among presentation titles at the 2011 RSA
factors into many of the breaches we                             Conference. It’s definitely in our collective hearts and minds.
                                                                 As such, we are often asked whether “the Cloud” factors into
investigate. The easy answer is “No—not
                                                                 many of the breaches we investigate. The question is both
really.” It’s more about giving up control of                    easy and difficult to answer. The easy answer is “No—not really.”
our assets and data (and not controlling                         We have yet to see a breach involving a successful exploit of a
                                                                 hypervisor allowing an attacker to jump across virtual
the associated risk) than any technology
                                                                 machines (VMs), for instance. On the other hand, we constantly
specific to the Cloud.                                           see    breaches     involving   hosted   systems,    outsourced
                                                                 management, rogue vendors, and even VMs (though the
  attack vectors have nothing to do with it being a VM or not). In other words, it’s more about giving up control of our assets
  and data (and not controlling the associated risk) than any technology specific to the Cloud.

  While we’re on the topic of giving up control of our assets and data, we might as well touch on mobile devices. This is another
  oft-asked topic during our breach-related presentations and discussions. The fact of the matter is that mobile computing
  devices (tablets, smartphones, mobile phones, etc.) are rarely the source of data loss across our caseload. That has a lot to do
  with the kind of cases we investigate (which tend to involve deliberate breach and compromise situations rather than
  accidental loss of devices). Plus, this report includes only confirmed incidents of data compromise. The threats to mobile
  devices are real and we fully expect them to increase and diversify along with the use, uses, and users of such devices. Just
  consider the effect of the iPad since its debut one year ago; many CxOs who were once technology-indifferent now demand
  to use their iPads at work. The convenience and functionality of these and other similar devices will drive widespread
  corporate adoption and security will once again find itself rushing to catch up.

  Zeus sprouted up within our 2009 caseload, but came to full bloom in 2010. Between the USSS and ourselves, Zeus and its
  evil business partners, account takeover and transfer fraud, were rampant among consumers and businesses alike. All of
  these receive further treatment in this report, so we will simply mention it here and move on.


                                                                 4
If Zeus shows us that criminals have their minds on our money, Aurora, APTs, Stuxnet, and Anonymous remind us that some
threat agents have more than money on their minds. These gave information risk a more sinister, targeted, and personal feel
for us all in 2010 (some might add hopeless). Whether these feelings are justified by a significant increase in risk is difficult to
discern. Perhaps these feelings are, in fact, justified. Perhaps they are justified only for a subset of us. Maybe risk did not
change at all, but our awareness of it changed dramatically. Maybe it’s a nugget of truth surrounded by multiple layers of fear,
uncertainty, and doubt. What we do know with certainty is that our 2010 caseload revealed certain characteristics that one
might associate with these events. For instance, numbers of public sector victims hit an all-time high. We studied more
incidents involving theft of classified information, intellectual property, and other sensitive organizational data than ever
before. Simply an artifact of a much larger and more diverse sample caseload rather than a real change? Maybe...or maybe not.

APTs deserve some special treatment here. Some will remember that we voiced concern in the 2010 DBIR and subsequent
blog posts over the APT hysteria sweeping the security community. We still believe that a “scope creep” exists in the definition
of APT. The term’s originators use it primarily in reference to state-sponsored attacks from the People’s Republic of China.
Others use it to describe any threat possessing above average skill and determination. The logical outcome of the former is
to seriously assess and seriously address security posture within government agencies and the defense industrial base
(which is right and good). The logical outcome of the latter is to conclude that “everyone is a target” of APT (which is an
oxymoron and leads to irrational fears about the boogeyman while common thieves clean you out of house and home). It is
simply not possible for everyone to be a target. It is undoubtedly true (based on investigative experience) that some are the
target of state-sponsored attacks (originating from China and/or elsewhere). It is also undoubtedly true (also based on
experience) that some who think they are victims of APTs are really the victims of organized criminals, hacktivists, glorified
script kiddies, and their own mistakes. Because “APTs” (any definition) are real, it’s time we get real about defining and
defending against them.

Outside the spotlight of these headlines, however, a very different story played out in 2010. The amount of compromised
data hit an all-time low across the combined Verizon and USSS caseload. DataLossDB, the Identity Theft Resource Center, and
other sources also show a marked decline in total records lost and exposed. What’s going on? The headlines seem more
hopeless than ever yet the numbers (some of them at least) seem almost hopeful. Why the contrast? What’s the “real” 2010?
We believe threads of truth exist in both stories. As discussed above, there is some truth behind the headlines. Similarly, data
loss figures point to a possible and real change in the motives and tactics used by criminals to steal information. We’ve done
our best to relay these stories and statistics within these pages and unpack their core messages and meaning. We hope this
effort will play some small part in leading us all to a happier ending in 2011 and beyond.


                            If Zeus shows us that criminals have their minds on our money, Aurora,
                           APTs, Stuxnet, and Anonymous remind us that some threat agents have
                              more than money on their minds. These gave information risk a more
                                               sinister, targeted, and personal feel for us all in 2010.


                                                                 5
2010: The U.S. Secret Service Perspective
The U.S. Secret Service is one of the nation’s oldest federal law enforcement agencies. Established in 1865, the Secret Service
was founded to combat the widespread counterfeiting of U.S. currency. Today, the agency’s primary investigative mission
continues to be safeguarding the payment and financial systems of the United States. However, the mission has evolved to
include combating worldwide financial and computer cybercrimes.

                                           Using advanced technologies and task force partnerships, the Secret Service
 In 2010, the Secret Service               computer experts, forensic specialists, investigative experts and intelligence
  arrested more than 1,200                 analysts provide rapid response and criminal information in support of financial
                                           analysis, infrastructure protection and criminal investigations.
    suspects for cybercrime
                                           The agency has 118 domestic field offices and 23 foreign offices. The Secret
          violations. These
                                           Service’s 31 Electronic Crimes Task Forces (ECTFs) bring together federal, state and
    investigations involved                local law enforcement agencies, private industry and academic institutions in a
over $500 million in actual                collaborative effort to respond, confront and suppress cybercrimes. In addition to
                                           the ECTFs, the agency continues to build strong partnerships with foreign law
  fraud loss and prevented
                                           enforcement agencies worldwide.
approximately $7 billion in
                                           Over the past several years the Secret Service has successfully investigated several
          additional losses.               of the largest cybercriminal cases in the U.S. In 2010, the Secret Service arrested
                                           more than 1,200 suspects for cybercrime violations. These investigations involved
over $500 million in actual fraud loss and prevented approximately $7 billion in additional losses.

For example in 2010, Albert Gonzalez received a 20 year prison sentence for his role in the TJX and Heartland Payment System
breaches. Maksym Yastremskiy was given a 30 year prison sentence in Turkey as the seller of payment card data for Gonzalez
and other cybercriminals.

Additionally, Vladislov Horohorin, aka BadB, was arrested in Nice, France on a Secret Service warrant and is currently being
extradited to the U.S. BadB was an original founder of the CarderPlanet criminal forum and he had been the largest and well-
known trafficker of stolen payment card data for nearly a decade. In a joint investigation with the Netherlands High Tech
Crime Unit, the Secret Service provided investigative assistance that led to the take down of the Bredolab Botnet and the
arrest of the Botherder nicknamed “Atata” by Armenian authorities.

The Secret Service has focused attention on numerous “bullet proof hosters,” who provide web hosting services that allow
their customer’s considerable leniency in the types of materials their customers may upload and distribute. Seizures in excess
of 200TB of data, belonging to bullet proof hosters, have made the proliferation of malware more challenging for
cybercriminals and provided a substantial number of investigative leads.

With all these factors taken into account, it is not surprising that the number of compromised records significantly decreased
during 2010. After any major investigation and arrest, the cybercriminal underground evaluates what happened and evolves
from the lessons learned during the prosecution of their peers.

It appears that cybercriminals are currently satisfied with compromising Point of Sale (POS) systems and performing account
takeovers and Automated Clearing House (ACH) transaction fraud. There has been an increase in these areas in 2010. In
relation to prior years, it appeared that there were more data breaches in 2010, but the compromised data decreased due to
the size of the compromised company’s databases. This shows willingness in the cybercriminal underground to go after the
smaller, easier targets that provide them with a smaller yet steady stream of compromised data.


                                                              6
There has also been noticeable increase in account takeovers. This can be directly related to the continued rise of the Zeus
Trojan and other malware variants created to capture login credentials to financial websites. These account takeovers result
in fraudulent transfers from the victim’s account to an account under the control of the perpetrator. The Secret Service and
the financial services community are working together to combat this growing trend.

The Financial Services Information Sharing and Analysis Center (FS-ISAC) has teamed up with the Secret Service, U.S. Treasury,
Department of Justice and many other agencies to create the Account Takeover Task Force (ATOTF). The ATOTF focuses on
prevention, detection and response to account takeovers.

As cybercriminals continue to adapt and evolve, so will the Secret Service. As seen in the arrests of Yastremskiy, Horohorin,
Atata, and others, there is no safe haven for these criminals.


2011 DBIR: Methodology
Here we are again—our fourth installment of the DBIR series (sixth if you count the ’08 and ’09 mid-year supplementals). To
our readers, it may seem like the 2010 DBIR published ages ago. To us, it feels more like yesterday. The expanding scope and
increasing depth of the report makes it almost one continuous effort throughout the year. It is, however, a labor of love and
we’re very glad to be sharing our research into the world of data breaches
with you once again.                                                                We are also very glad to have
We are also very glad to have the USSS back with us for the 2011 DBIR.              the USSS back with us for the
Additionally, we have the pleasure of welcoming the NHTCU to the                 2011 DBIR. Additionally, we have
team. Through this cooperative effort, we had the privilege—and
challenge—of examining about 800 new data compromise incidents
                                                                                   the pleasure of welcoming the
since our last report. To put that in perspective, the entire Verizon-USSS       NHTCU to the team. Through this
dataset from 2004 to 2009 numbered just over 900 breaches. We very
                                                                                   cooperative effort, we had the
nearly doubled the size of our dataset in 2010 alone!
                                                                                   privilege—and challenge—of
But anyone can put together a large dataset, right? What matters is what
that dataset is comprised of, how it was put together, and what                   examining about 800 new data
conclusions we can draw from it. That is precisely what the rest of this          compromise incidents since our
section attempts to do.
                                                                                                       last report.
Verizon Data Collection Methodology
The underlying methodology used by Verizon remains unchanged from that of previous years. All results are based on
firsthand evidence collected during paid external forensic investigations conducted by Verizon from 2004 to 2010. The 2010
caseload is the primary analytical focus of the report, but the entire range of data is referenced extensively throughout.
Though the Investigative Response (IR) team works a variety of engagements, only those involving a confirmed data
compromise are represented in this report. To help ensure reliable and consistent input, all investigators use the Verizon
Enterprise Risk and Incident Sharing (VERIS) framework to record case data and other relevant details (fuller explanation of
this to follow). The information collected using VERIS is then submitted to members of the RISK Intelligence team for further
validation and analysis. During the aggregation process, information regarding the identity of breach victims is removed
from the repository of case data.


                                                                 7
USSS Data Collection Methodology
In terms of data collection, the USSS methodology differs little from that of Verizon. Agents of the USSS use an internal
application based on the VERIS framework to record pertinent case details for inclusion in the DBIR.. To accomplish this, they
utilized investigative notes, reports provided by the victim or other forensic firms, and their own experience gained in
handling the case.

From the numerous cases worked by the USSS during 2010, the scope was narrowed to only those involving confirmed
organizational data breaches1 in alignment with the focus of the DBIR. The scope was further narrowed to include only cases
for which Verizon did not conduct the forensic investigation2. For the 2010 DBIR, a sample of qualifying USSS cases was
included since the scope of data collection spanned multiple years. This year information was collected on a much larger
proportion of relevant 2010 cases (those not included mainly consist of ongoing cases and some currently in trial). Thus, this
2011 DBIR covers most of the organizational data breaches investigated by the USSS in 2010. This yielded 667 confirmed data
breaches for which information was collected within the timeframe set for this report. As you will see, this larger sample
greatly increased the variety of breaches we were able to study, and this, in turn, affects the stats we discuss in this report. The
resulting dataset was purged of any information that might identify organizations or individuals involved in the case and
then provided to Verizon’s RISK Intelligence team for analysis.


NHTCU Data Collection Methodology
Like Verizon and the USSS, the NHTCU leveraged VERIS to collect data presented in Appendix A of this report. Verizon RISK
team members spent time onsite with the NHTCU to identify cases meeting the criteria for inclusion in the DBIR and to
classify those incidents using VERIS. The caseload of the NHTCU is dynamic and varies substantially year by year depending
upon various factors. Much of their efforts in 2010 were dedicated to busting up a large child pornography underground and
criminal botnet research, investigations, and takedowns. Thus, the number of qualifying corporate breach cases worked in
2010 was not sufficient to use as a standalone dataset3. Therefore, a sample of over 30 qualifying breaches was taken from
cases worked over the last several years to enable comparative analysis. For these reasons, NHTCU caseload statistics are not
included alongside those of Verizon and USSS in the main body of this report. Appendix A presents these findings and are
definitely worth a look.


A BRIEF PRIMER ON VERIS
VERIS is a framework designed to provide a common language for describing security incidents in a structured and
repeatable manner . It takes the narrative of “who did what to what or whom with what result” and translates it into the kind
of data you see presented in this report . Because many readers asked about the methodology behind the DBIR and because
we hope to facilitate more information sharing on security incidents, we released VERIS earlier this year for free public use . A
                                                   4
brief overview of VERIS is available on our website and the complete framework can be obtained from the VERIS community
    5
wiki  . Both are good companion references to this report for understanding terminology and context .


1 The USSS works many cases related to theft and fraud that are not included in this report. For instance, crimes committed against consumers that do not involve an organization or
  its assets are not included. Criminal activities that occur after data are stolen (i.e., “white plastic fraud” and identity theft) are also not within the scope of this study.
2 The USSS is often involved in one manner or another with cases worked by Verizon (especially the larger ones). To eliminate redundancy, these cases were removed from the
  USSS sample. Where both Verizon and the USSS worked a case, Verizon-contributed data were used.
3 Though it should be noted that the NHTCU has hard drives from over one hundred organizations affected by these botnets that almost certainly contain evidence of data
  compromise. Time did not permit us to examine those drives for this report.
4 http://www .verizonbusiness .com/resources/whitepapers/wp_verizon-incident-sharing-metrics-framework_en_xg .pdf
5 https://verisframework .wiki .zoho .com/


                                                                                         8
Classifying Incidents Using VERIS
The Incident Classification section of the VERIS Framework translates the incident narrative of “who did what to what (or
whom) with what result” into a form more suitable for trending and analysis. To accomplish this, VERIS employs the A4 Threat
Model developed by Verizon’s RISK team. In the A4 model, a security INCIDENT is viewed as a series of EVENTS that adversely
affects the information assets of an organization. Every event is comprised of the following ELEMENTS (the 4 A’s):

y Agent: Whose actions affected the asset
y Action: What actions affected the asset
y Asset: Which assets were affected
y Attribute: How the asset was affected

It is our position that the 4 A’s represent the minimum information necessary to adequately describe any incident or threat
scenario. Furthermore, this structure provides an optimal framework within which to measure frequency, associate controls,
link impact, and many other concepts required for risk management.

If we calculate all the combinations of the A4 model’s highest-level elements, (3 Agents, 7 Actions, 5 Assets, and 6
Attributes), 630 distinct Threat Events emerge. The grid below graphically represents these and designates a Threat Event
Number (hereafter referenced by TE#) to each. TE1, for instance, coincides with External Malware that affects the
Confidentiality of a Server.


Figure 1 . A4 Grid depicting the 630 high-level VERIS Threat Events

                       Malware           Hacking               Social                   Misuse               Error           Physical         Environmental
                     Ext   Int   Prt   Ext   Int   Prt   Ext    Int     Prt       Ext    Int     Prt   Ext    Int    Prt   Ext   Int    Prt   Ext   Int   Prt
             Conf     1     2     3     4     5     6     7      8       9         10    11       12   13    14       15   16    17     18    19    20     21
             Poss     22   23     24    25   26     27    28    29       30        31    32       33   34    35       36   37    38     39    40    41     42
            Integ     43   44     45    46   47     48    49    50       51        52    53       54   55    56       57   58    59     60    61    62     63
Servers
             Auth     64   65     66    67   68     69    70    71       72        73    74       75   76    77       78   79    80     81    82    83     84
             Avail    85   86     87    88   89     90    91    92       93        94    95       96   97    98       99   100   101   102    103   104   105
              Util   106   107   108   109   110   111   112    113     114       115    116     117   118   119     120   121   122   123    124   125   126
             Conf    127   128   129   130   131   132   133    134     135       136    137     138   139   140     141   142   143   144    145   146   147
             Poss    148   149   150   151   152   153   154    155     156       157    158     159   160   161     162   163   164   165    166   167   168
            Integ    169   170   171   172   173   174   175    176     177       178    179     180   181   182     183   184   185   186    187   188   189
Networks
             Auth    190   191   192   193   194   195   196    197     198       199    200     201   202   203     204   205   206   207    208   209   210
             Avail   211   212   213   214   215   216   217    218     219       220    221     222   223   224     225   226   227   228    229   230   231
              Util   232   233   234   235   236   237   238    239     240       241    242     243   244   245     246   247   248   249    250   251   252
             Conf    253   254   255   256   257   258   259    260     261       262    263     264   265   266     267   268   269   270    271   272   273
             Poss    274   275   276   277   278   279   280    281     282       283    284     285   286   287     288   289   290   291    292   293   294
User        Integ    295   296   297   298   299   300   301    302     303       304    305     306   307   308     309   310   311   312    313   314   315
Devices      Auth    316   317   318   319   320   321   322    323     324       325    326     327   328   329     330   331   332   333    334   335   336
             Avail   337   338   339   340   341   342   343    344     345       346    347     348   349   350     351   352   353   354    355   356   357
              Util   358   359   360   361   362   363   364    365     366       367    368     369   370   371     372   373   374   375    376   377   378
             Conf    379   380   381   382   383   384   385    386     387       388    389     390   391   392     393   394   395   396    397   398   399
             Poss    400   401   402   403   404   405   406    407     408       409    410     411   412   413     414   415   416   417    418   419   420
Offline     Integ    421   422   423   424   425   426   427    428     429       430    431     432   433   434     435   436   437   438    439   440   441
Data         Auth    442   443   444   445   446   447   448    449     450       451    452     453   454   455     456   457   458   459    460   461   462
             Avail   463   464   465   466   467   468   469    470     471       472    473     474   475   476     477   478   479   480    481   482   483
              Util   484   485   486   487   488   489   490    491     492       493    494     495   496   497     498   499   500   501    502   503   504
             Conf    505   506   507   508   509   510   511    512     513       514    515     516   517   518     519   520   521   522    523   524   525
             Poss    526   527   528   529   530   531   532    533     534       535    536     537   538   539     540   541   542   543    544   545   546
            Integ    547   548   549   550   551   552   553    554     555       556    557     558   559   560     561   562   563   564    565   566   567
People
             Auth    568   569   570   571   572   573   574    575     576       577    578     579   580   581     582   583   584   585    586   587   588
             Avail   589   590   591   592   593   594   595    596     597       598    599     600   601   602     603   604   605   606    607   608   609
              Util   610   611   612   613   614   615   616    617     618       619    620     621   622   623     624   625   626   627    628   629   630


                                                                              9
Turning the Incident Narrative into Metrics
As stated above, incidents often involve multiple threat events. Identifying which ones are in play and using them to
reconstruct the chain of events is how we model an incident to generate the statistics in this report. By way of example, we
describe below a simplified hypothetical incident where a targeted phishing attack is used to exfiltrate sensitive data and
intellectual property (IP) from an organization.


Figure 2 . Example VERIS incident scenario


             E1                                  E2                                 E3               CE1                            E4

   External agent sends
                                                                  External agent accesses System administrator failed External agent accesses a
   a phishing e-mail that           Malware infects the exec’s
                                                                 the exec’s laptop via the      to enable proper           mapped file server from
    successfully lures an          laptop, creating a backdoor
                                                                 backdoor, viewing e-mail     authentication when        the exec’s laptop and steals
     executive to open              and installing a keylogger .
                                                                 and other sensitive data . building a new file server .    intellectual property .
      the attachment .

            TE#553                             TE#295                             TE#256                TE# 56                     TE#4
           External                           External                            External             Internal                  External
             Social                           Malware                             Hacking                Error                   Hacking
            People                          User Devices                        User Devices           Servers                    Servers
           Integrity                          Integrity                        Confidentiality        Integrity                Confidentiality


The flowchart-like figure representing the incident includes four primary threat events and one conditional event (the
diamond)6. A brief description of each event is given along with the corresponding TE#s and A4 categories from the matrix
exhibited earlier. Once the construction of the main event chain is complete, additional classification can add more specificity
around the elements comprising each event (i.e., the particular type of External agent or exact Social tactics used, etc). The
incident is now “VERIS-ized” and useful metrics are available for reporting and further analysis.

One final note before we conclude this sub-section. The process described above has value beyond just describing the incident
itself; it also helps identify what might have been done (or not done) to prevent it. The goal is straightforward: break the chain of
events and you stop the incident from proceeding. For instance, security awareness training and e-mail filtering could help keep E1
from occurring. If not, anti-virus and a least privilege implementation on the laptop might prevent E2. Stopping progression
between E2 and E3 may be accomplished through egress filtering or netflow analysis to detect and prevent backdoor access.
Training and change control procedures could help avoid the administrator’s misconfiguration described in the conditional event
and preclude the compromise of intellectual property in E4. These are just a few examples of potential controls for each event, but
the ability to visualize a layered approach to deterring, preventing, and detecting the incident should be apparent.

                              The process described above has value beyond just describing the incident
                                 itself; it also helps identify what might have been done (or not done) to
                           prevent it. The goal is straightforward: break the chain of events and you stop
                                                                             the incident from proceeding.


6 See the Error section under Threat Actions for an explanation of conditional events.


                                                                                         10
A Word on Sample Bias
We would like to reiterate that we make no claim that the findings of this report are representative of all data breaches in all
organizations at all times. Even though the merged Verizon-USSS and NHTCU datasets (presumably) more closely reflects
reality than either in isolation, it is still a sample. Although we believe many of the findings presented in this report to be
appropriate for generalization (and our confidence in this grows as we gather more data and compare it to that of others),
bias undoubtedly exists. Unfortunately, we cannot measure exactly how much bias exists (i.e., in order to give a precise
margin of error). We have no way of knowing what proportion of all data breaches are represented because we have no way
of knowing the total number of data breaches across all organizations in 2010. Many breaches go unreported (though our
sample does contain many of those). Many more are as yet unknown by the victim (and thereby unknown to us). What we
do know is that our knowledge grows along with what we are able to study and that grew more than ever in 2010. At the
end of the day, all we as researchers can do is pass our findings on to you to evaluate and use as you see fit.


Results and Analysis                                                                  Values shown in dark gray pertain to
The 2010 combined dataset represents the largest we have ever reported in             breaches while values in red pertain to
any single year. Verizon investigated 94 incidents in which data compromise           data records . The “breach” is the incident
                                                                                      under investigation in a case and “records”
was confirmed. The USSS worked and submitted a whopping 667. Thus, the
                                                                                      refer to the amount of data units (files,
results and analysis in this section examine a grand total of 761 breaches.
                                                                                      card numbers, etc .) compromised in the
The total number of known compromised data records across those                       breach . If one of these values represents a
incidents was 3.8 million.                                                            substantial change from prior years, this is
                                                                                      marked with a “(!)” symbol .
In several places throughout the text, we show and discuss the entire range of
data for both organizations (2004-2010 for Verizon, 2007-2010 for the USSS,
and 2006-2009 for the NHTCU presented in Appendix A). As with last year, the
                                                                                      Table 1 . Key for translating percents and
chosen approach is to present the combined dataset intact and highlight
                                                                                      numbers for 2009 and 2010 datasets
interesting differences (or similarities) within the text where appropriate. There
are, however, certain data points that were collected by Verizon but not the                         2009               2010
                                                                                                 141 breaches       761 breaches
USSS; these are identified in the text/figures.
                                                                                        3%             4                 23
The figures in this report utilize a consistent format. Values shown in dark
gray pertain to breaches while values in red pertain to data records. The              10%            14                 76

“breach” is the incident under investigation in a case and “records” refer to          25%            35                 190
the amount of data units (files, card numbers, etc.) compromised in the                33%            47                 251
breach. If one of these values represents a substantial change from prior
                                                                                       50%            71                 381
years, this is marked with a “(!)” symbol. Many figures and tables in this report
add up to over 100%; this is not an error. Because the number of breaches in           75%            106                571

this report is so high, the use of percentages is a bit deceiving in some              100%           141                761
places. Where appropriate, we show the raw numbers of breaches instead of
or in addition to the percentages. A handy percent to number conversion
table is shown in Table 1. Not all figures and tables contain all possible options but only those having a value greater than 0.
If you are interested in seeing all options for any particular figure, these can be found in the VERIS framework.

Let’s dig in, shall we?


                                                                 11
Demographics
Demographics, as we have pointed out in the past, typically proves to be one of the more difficult sections of this report to
compose. The challenge lies in the process of attempting to attribute broader meaning to the statistics generated each year.
Clearly, all results are dependent upon our annual investigative casework, but one always wonders if the demographic data
has greater secrets to tell us if we could only decipher them. For instance, it may or may not be relevant or indicative of a
growing trend if one industry vertical shows a higher rate of attack than another, or if organizations in a certain geographical
area appear to be targeted more frequently. Ultimately, we may not be able to discern micro-trend from macro-trend, but
demographic data undoubtedly helps set the stage for interpreting breach statistics from 2010 (and we suspect, as you will
see throughout this report, perhaps even beyond).


                          Criminals may be making a classic risk vs. reward decision and opting to
                           “play it safe” in light of recent arrests and prosecutions following large-
                         scale intrusions into Financial Services firms. Numerous smaller strikes on
                            hotels, restaurants, and retailers represent a lower-risk alternative, and
                                   cybercriminals may be taking greater advantage of that option.

We live in a world absolutely saturated with information, so it is hardly surprising that breaches continue to happen in a
widely diverse group of organizations scattered over a geographically disparate area. However, this year, as we have seen in
the past, some types of organizations appear to be singled out more so than others. As you can see in Figure 3, the top three
victim verticals remain the same year in and year out. They just switch places occasionally, as they did this year with Hospitality
(mostly hotels and restaurants) regaining the number one spot, followed by Retail, which was itself followed very closely by
Financial Services. Our readers might think they are looking at the 2008 DBIR since the results closely resemble those found
in that report (it’s okay, folks; this is the 2011 DBIR—though at least one of us did wear a circa 2008 Three Wolf Moon shirt
during the drafting of this report).

This rise of breaches in the Hospitality and Retail sectors is one of those areas where we do suspect the numbers reflect
trends broader than this immediate caseload. Typically, such organizations represent smaller, softer, and less reactive targets
than, for instance, financial institutions. Criminals may be making a classic risk vs. reward decision and opting to “play it safe”
in light of recent arrests and prosecutions following large-scale intrusions into Financial Services firms. Numerous smaller
strikes on hotels, restaurants, and retailers represent a lower-risk alternative, and cybercriminals may be taking greater
advantage of that option. Supporting evidence for this theory will be presented throughout this report.


                                                                12
Figure 3 . Industry groups represented by percent of breaches


              Hospitality                                                                                                  40% (!)

                   Retail                                                              25% (!)

       Financial Services                                                       22%

            Government              4%

          Manufacturing        2%

           Tech Services       2%

        Business Services   1%

              Healthcare    1%

                  Media     <1%

          Transportation    <1%

                   Other       2%


As is usually the case, there was quite a chasm between the top three industries and the rest of the pack. Leading that second tier
was Government, credited with 4% of breaches. This is on par with past reports from a percentage standpoint, but it is important
to note the scaling factor that comes in to play here. In 2009, that was 4% of 141 total or 6 breaches. 2010’s equal-sounding 4%
(3.5%, actually) corresponds to a much-higher 27 breaches since the total caseload expanded to 761. So, while percentage points
suggest “no change,” we actually investigated four-fold more government breaches than before. Keep this in mind, because that
same math applies to all “smaller” percentages in the report.

Certainly, an interesting change this go around is that unlike previous years in which 90% or           Figure 4 . Compromised
more of records lost were derived from financial services targets, 2010 exhibited a much more           records by industry group (!)
even distribution. The main factor in this shift is the lack of “mega-breaches” in our combined
                                                                                                               9%     All Others
caseload. Many incidents involving the compromise of multi-millions of records (or more) in
the last few years occurred in financial institutions. Without one or two of these skewing the
results, things naturally balance out a bit more. Another factor to consider is that criminals                        Financial
                                                                                                               35%
                                                                                                                      Services
seemed to gain interest in stealing data other than payment cards. Account takeovers, theft of
IP and other sensitive data, stolen authentication credentials, botnet activity, etc. (which are
typically less mega-breach-able) affected firms at increased rates in 2010.

With regard to organizational size, this caseload shows a substantially higher
concentration of smaller organizations and franchises. However, we once again remind
readers to consider differences of scale. Though the percentages obscure this fact, we
                                                                                                                      Retail &
investigated almost twice as many breaches affecting organizations in the 1,000-10,000                         56%
                                                                                                                      Hospitality
employee range than in 2009 (26% in ’09 and 8% in ’10…you can do the math).


                                                                 13
Table 2 . Organizational size by number        Therefore, one should not conclude that larger organizations were breached less often in
of breaches (number of employees)
                                               2010, but rather we saw a virtual explosion of breaches involving smaller organizations
 1 to 10                    46                 (which were often small independent franchise locations of large organizations). Plus, our
                                               greatly expanded window into the world of data breaches (courtesy of the USSS) allowed
 11 to 100                436 (!)
                                               us to see a bigger sample of organizations that would not normally contract a third party
 101 to 1,000               74
                                               forensic firm. Law enforcement, thank goodness, is no respecter of size and works all
 1,001 to 10,000            49                 reported breaches. One final observation before we conclude this paragraph is that Table 2

 10,001 to 100,000          59
                                               is actually closer than our previous reports to a realistic size distribution for organizations
                                               (not just breach victims). Small to medium businesses typically comprise the vast majority
 Over 100,000               55
                                               of firms in most economies. With our continuing inclusion of data from organizations such
 Unknown                    40                 as the USSS and the NHTCU we will probably continue to see more representative
                                               numbers with regard to organizational size.

     Obviously, data breaches are not a country or region-specific phenomenon; they can occur anywhere that information traverses
     or resides. That’s not to say that no regional differences and trends exist, because they most certainly do (though they are often
     not as amplified as we tend to think). As Figure 5 shows, Verizon and the USSS investigated breaches occurring in many places
     around the world in 2010. For those keeping track, the map shows more countries highlighted than ever before.

     Roughly one-third of Verizon’s cases were worked across the greater European and Asia-Pacific regions (split fairly evenly, but with
     a slight tilt toward APAC). Appendix A, which isolates breaches worked by the NHTCU, is a must-see for those interested in European
     breach statistics. In North and South America, most breaches occurred in the United States, but other countries in those regions are
     represented in Figure 5 as well. The USSS’ casework was, of course, primarily focused within the continental United States though
     investigating and prosecuting the criminals behind them takes them all over the world. While these case statistics are certainly
     dependent upon the firm working them, they also have much to do with the differences in international laws governing disclosure.
     Higher numbers of known breaches in one area of the world does not mean it is any more a hotbed of crime than other parts of
     the globe. In many cases, it is simply the result of mandatory breach notification and subsequent investigation.


Figure 5 . Countries Represented in 2010 Caseload


     Countries in which a breach
     was confirmed
     Australia          Mexico
     Belgium            Netherlands
     Canada             New Zealand
     China              Phillipines
     Czech Republic     Poland
     Dominican          Russia
     Republic           Spain
     Ecuador            Sweden
     France             Taiwan
     Germany            United Kingdom
     Greece             United States
     Japan

     Countries in which a breach was
     investigated but not confirmed
     Ghana              Luxembourg
     Ireland            Switzerland
     Italy              United Arab Emirates


                                                                         14
2010 Threat Event Overview
We typically present statistics for Agents, Actions, Assets, and Attributes (though we focus on Confidentiality because this report
is about data breaches) in separate sections of the DBIR. That structure remains in this report, but we wanted to show a different
representation to tie it all together and give readers a view of the big picture. Plus, it is good to remember that agents are not
disassociated from their actions or the assets and attributes they affect. Figure 6 is a modified version of Figure 1 presented in an
earlier section, but rather than TE#s, it tallies the total number of breaches in which each Threat Event was part of the incident
scenario. If the 761 breaches contained in the 2010 Verizon-USSS caseload can be boiled down to one single image, this is our
best concept of it. Many observations could be made from this, but we’ll start by highlighting a few of them.

From a threat management standpoint, it is interesting that only 55 of the 630 possible threat events have a value greater than
0. This means over 90% of the threat-space was not in play at all. Furthermore, even among the 9% that were observed, frequency
counts gravitate toward a smaller subset of dominant threat events. Tables 3 through 5 expand on this and list the top 10 events
in the combined, Verizon, and USSS datasets.


Figure 6 . A4 Grid depicting the frequency of VERIS Threat Events across 2010 caseload

                         Malware            Hacking               Social                Misuse               Error              Physical          Environmental
                    Ext    Int   Prt   Ext    Int   Prt     Ext    Int     Prt    Ext    Int     Prt   Ext    Int    Prt   Ext    Int      Prt    Ext   Int   Prt
            Conf    319     1          369                                        10      50     1                   1
            Poss
           Integ    323     1          353     2                                  3       43
Servers
            Auth     2                  16     2                                  3       16
            Avail    3                  4                                         2       1
             Util
            Conf     1                  1                                                                                  11
            Poss
           Integ     1                  1                                                                                  11
Networks
            Auth
            Avail
             Util
            Conf    214     1          174                                        2       4                                201
            Poss
User       Integ    214     2          173                                                3                                201     4
Devices     Auth     2                  2                                                                                   2      1
            Avail                       2                                                                                   1
             Util
            Conf     1                                                                    87                         1      1
            Poss
Offline    Integ     1
Data        Auth
            Avail
             Util
            Conf                                            8       1
            Poss
           Integ                                            72     24
People
            Auth
            Avail
             Util


                                                          None                     Least frequent                                                Most Frequent


              From a threat management standpoint, it is interesting that only 55 of the 630
              possible threat events have a value greater than 0. This means over 90% of the
                                                           threat-space was not in play at all.


                                                                             15
It is fascinating that the top four threat events in      Table 3: Top 10 VERIS Threat Events, combined caseload
   both caseloads are the same and involve external
                                                                  Threat Event                                     Threat Event Counts
   agents    hacking    and    installing   malware    to
                                                              1 External .Hacking .Servers .Confidentiality            TE #4     369
   compromise the confidentiality and integrity of
                                                              2 External .Hacking .Servers .Integrity                 TE #46     353
   servers. Think about it—out of 630 possibilities,
                                                              3 External .Malware .Servers .Integrity                 TE #43     323
   what is the likelihood that two completely different
                                                              4 External .Malware .Servers .Confidentiality            TE #1     319
   datasets “just happen” to share the four most
                                                              5 External .Malware .UserDevices .Confidentiality       TE #253    214
   common events? These results may surprise some
                                                              6 External .Malware .UserDevices .Integrity             TE #295    214
   since internal agents and misuse were so prominent
   in the 2009 report, but we’ll get into that later. Some    7 External .Physical .UserDevices .Confidentiality      TE #268    201

   may also wonder about the presence of integrity,           8 External .Physical .UserDevices .Integrity            TE #310    201

   but should consider that the installation of malware       9 External .Hacking .UserDevices .Confidentiality       TE #256    174

   and many other actions taken by attackers                  10 External .Hacking .UserDevices .Integrity            TE #298    173

   (configuration changes, adding users, altering logs,
   etc.) introduce unauthorized modifications to the
   systems involved.                                         Table 4 . Top 10 VERIS Threat Events, Verizon caseload


      It is fascinating that the top four                         Threat Event                                     Threat Event Counts
                                                              1 External .Hacking .Servers .Confidentiality            TE #4     63
   threat events in both caseloads are
                                                              2 External .Hacking .Servers .Integrity                 TE #46     56
the same and involve external agents                          3 External .Malware .Servers .Integrity                 TE #43     42

    hacking and installing malware to                         4 External .Malware .Servers .Confidentiality            TE #1     37
                                                              5 External .Malware .UserDevices .Integrity             TE #295    22
  compromise the confidentiality and
                                                              6 External .Malware .UserDevices .Confidentiality       TE #253    21
  integrity of servers. Think about it—                       7 External .Hacking .UserDevices .Confidentiality       TE #256    13

    out of 630 possibilities, what is the                     8 External .Hacking .UserDevices .Integrity             TE #298    12
                                                              9 Internal .Misuse .Servers .Confidentiality            TE #389     7
        likelihood that two completely
                                                              10 External .Social .People .Integrity                  TE#553      5
    different datasets “just happen” to
 share the four most common events?
                                                             Table 5 . Top 10 VERIS Threat Events, USSS caseload
   After the top four, the Verizon and USSS caseloads
   diverge a bit. The USSS investigated a large number            Threat Event                                     Threat Event Counts

   of cases involving tampering with and extracting           1 External .Hacking .Servers .Confidentiality            TE #4     306

   data from ATMs, gas pumps, and POS terminals.              2 External .Hacking .Servers .Integrity                 TE #46     297

   This accounts for the prevalence of External.              3 External .Malware .Servers .Confidentiality            TE #1     282

   Physical.UserDevices.X events, which will be               4 External .Malware .Servers .Integrity                 TE #43     281
   discussed later in this report. Toward the bottom of       5 External .Physical .UserDevices .Confidentiality      TE #268    200
   the list, the two caseloads come back into                 6 External .Physical .UserDevices .Integrity            TE #310    200
   agreement around external agents hacking user              7 External .Malware .UserDevices .Confidentiality       TE #253    193
   devices (which is often done to gain an initial            8 External .Malware .UserDevices .Integrity             TE #295    192
   foothold as part of the larger attack). We hope you        9 External .Hacking .UserDevices .Confidentiality       TE #256    161
   enjoyed this short digression and we now return            10 External .Hacking .UserDevices .Integrity            TE #298    161
   to our regularly scheduled programming.


                                                                 16
VERIS Classification Note: If the agent’s
Threat Agents                                                                                       role in the breach is limited to a contributory
                                                                                                    error (see explanation in the Error
Threat agents refer to entities that cause or contribute to an incident. There can be               sub-section under Threat Actions), the agent
more than one agent involved in any incident and their involvement can be malicious                 would not be included here . For example, if
                                                                                                    an insider’s unintentional misconfiguration
or non-malicious, intentional or accidental, direct or indirect. Critical to any forensic           of an application left it vulnerable to attack,
                                                                                                    the insider would not be considered an
investigation is to identify the source of the breach, not only for purposes of response            agent if the application were successfully
and containment, but also for implementing current and future defensive strategies.                 breached by another agent . An insider
                                                                                                    who deliberately steals data or whose
Verizon recognizes three primary categories of threat agents—External, Internal,                    inappropriate behavior (i .e ., policy
                                                                                                    violations) facilitated the breach would
and Partner.                                                                                        be considered an agent in the breach .

External: External threats originate from sources outside the organization and its
network of partners. Examples include lone hackers, organized crime groups, and government entities, as well as environmental
events such as weather and earthquakes. Typically, no trust or privilege is implied for external entities.

Internal: Internal threats are those originating from within the organization. This encompasses company executives, employees,
independent contractors (i.e., 1099 staff ), interns, etc., as well as internal infrastructure. Insiders are trusted and privileged (some
more than others).

Partners: Partners include any third party sharing a business relationship with the organization. This includes suppliers, vendors,
hosting providers, outsourced IT support, etc. Some level of trust and privilege is usually implied between business partners.

Figure 7 displays the distribution of threat agents among breach cases worked by Verizon and the USSS in 2010. Veteran DBIR
readers will almost certainly recognize the much lower percentage of internal breaches compared to what was presented in our
last report. Except for partner, these results more closely resemble those from two years ago (and prior) than 2009. Why the roller
coaster time machine?

First of all, readers should remember to be careful when drawing conclusions from statistics without exploring the root issues
and trends behind them. Many interpreted the more than doubling of internal breaches reported in last year’s DBIR as proof
that insider threat was rocketing upward. This was probably stoked somewhat by rumors and reports at the time of a poor
economy driving employees to desperate acts of crime. In point of fact, the apparent “increase” was due to incorporating the
USSS dataset, which had a higher proportion—but actually a decreasing trend—of insider breaches. The Verizon trend line
                                                        for internal incidents was flat.
Figure 7 . Threat agents (inclusive) by percent
of breaches                                                         These results are not so much a decrease
          92%                                                         in internal agents as much as they are a
          91%
                                                               comparatively huge increase in external agents.

                                                        Figure 7 has similar potential for interpretive pitfalls. At 17% of all breaches,
                                                        illicit insider activity is near an all-time low. Does this mean that insiders are
                                                        a concern of yesteryear? Not likely. These results are not so much a decrease
                                                        in internal agents as much as they are a comparatively huge increase in
                                                        external agents. Or, perhaps, it is simply that our window into the world of
                        17% (!)
                                                        external threats is simply much larger than it was a year before. Either way,
                         16%
                                         <1%            the raw number of breaches attributed to outsiders exploded within the
        External        Internal        Partner         USSS’ 2010 caseload, and skewed slightly more in that direction in Verizon’s
                                                        as well.
                                         Suspected


                                                                   17
External agents have
We hypothesize this rise in the past year reflects an ongoing industrialization process
of sorts in attack methods used by certain groups of external agents, most notably            created economies of scale
financially motivated organized criminals. They have created economies of scale by              by refining standardized,
refining standardized, automated, and highly repeatable attacks directed at smaller,
                                                                                                  automated, and highly
vulnerable, and largely homogenous targets. That’s not to say all external attacks fall
into this category, but this was where much of the growth occurred between our               repeatable attacks directed
2009 and 2010 caseloads. Several cases worked by the USSS spanned numerous                    at smaller, vulnerable, and
organizations victimized by the same attacker or group. For instance, at least 140
breaches from 2010 were tied to a single individual using the exact same methods.
                                                                                           largely homogenous targets.
Even more astounding is that several hundred more have been discovered and linked to him already in 2011 (not included in
this report).


Figure 8 . Threat agents over time by percent of breaches

 100%

  90%

  80%

  70%

  60%
                                                                                                                    VZ External
  50%
                                                                                                                    VZ Internal
  40%
                                                                                                                    VZ Partner
  30%
                                                                                                                    USSS External
  20%

  10%                                                                                                               USSS Internal

   0%                                                                                                               USSS Partner

           2005              2006             2007            2008             2009             2010


Insider attacks, fortunately, are not so scalable. They can target their employer and perhaps some of its partners or customers,
but not typically in the manner or to the extent described above. Thus, in a 2010 caseload expanded by these mass external
operations, breaches involving internal agents declined as a percentage of total cases. One should keep in mind, however, that
the actual number of insider incidents was almost twice as large. This information would suggest that the insider threat is still
present and not declining; it just didn’t increase as much as external threats. We hope these results will be viewed with the above
in mind. With that horse sufficiently flogged, let’s move on to partners.

Although the previous discussion can also explain the drop in percentage of breaches attributed to business partners, 2010
seems to continue a legitimate downward trend that began in 2008. We hypothesized in previous years that this may be due to
increased regulation, heightened awareness, more assessments, better technology, or combinations of these (maybe even
something else entirely). What has not declined are the number of incidents in which partners were “in the picture” for
circumstances surrounding the breach. By this we mean that the partner was not an active (or causal) threat agent, but they
were responsible for hosting, managing, securing, etc. the systems involved. More discussion on these scenarios can be found
in the Partner and Error sections of this report.


                                                                18
Reviewing Figure 9, which contrasts single and multi-agent              Figure 9 . Threat agents (exclusive) by percent of breaches
breaches, we can make a few observations about these
                                                                             83%              7%              <1%             9%
results. The 9% of cases involving more than one agent is
well below that of 2008 and 2009. In prior years, the multi-
agent breaches worked by Verizon exhibited an External-
Partner combination. Verizon’s 2010 data mirrors that most
                                                                          External only   Internal only   Partner only   Multiple agents
often shown in the USSS data, which is an External-Internal
pairing. This often involves an outsider colluding with an
insider to embezzle or skim data and/or funds, but also
includes scenarios such as an insider breaking web use policy, picking up malware, and then having their machine used as a
base camp by external attackers.

Breach Size by Threat Agents
The amount of data compromised certainly does not capture the full impact of a breach, but it is, at least, an indicator of it. It
is also something that can (ordinarily) be measured by investigators during the normal scope of an engagement. We would
love to collect more information on the financial impact of breaches we investigate, but such is not our primary objective
(though it is one of the most requested additions to this report). Additionally, by the time the full consequences are known
                                                                        to the client (if they ever are), we’re long gone.

Figure 10 . Compromised records by threat agent, 2010                   Figure 10 records the distribution of the 3.8 million records
                                                                        compromised across the merged 2010 dataset among
    3,838,549        15,971            4             23,846
                                                                        threat agents. The effect reveals even larger disparity than
                                                                        we typically see; the data loss inflicted by External agents
                                                                        continues to far outweigh that done by insiders and
                                                                        partners. It’s interesting to note that while a few mega-
  External only   Internal only   Partner only   Multiple agents
                                                                        breaches always helped tip the scales toward outsiders in
                                                                        years past, 2010 is different. Instead, the same result was
                                                                        achieved in a caseload lacking huge breaches but rife with
Figure 11 . Compromised records by threat agent, 2004-2010              many smaller external breaches. Still, the total number of
                                                                        records depicted in Figure 10 pales in comparison to
   804,559,200     28,869,798      43,744,577      46,475,750
                                                                        those in previous years, which is why Figure 11 (showing
                                                                        the overall tally since we began collecting data in 2004)
                                                                        hasn’t changed much since our last report.

  External only   Internal only   Partner only   Multiple agents        Another important facet of this metric to consider is the
                                                                        various types of data compromised. Some, like payment
                                                                        card numbers and personal information are often stolen in
bulk, whereas criminals may only target a few documents comprising intellectual property and classified data. Data types
quantify differently as well as have varying levels of value to the breached organization. IP for instance may be low in the
number of records, but have a much higher financial impact. Based on data from this past year, insiders were at least three
times more likely to steal IP than outsiders. Is that enough to make insiders the most impactful category of agent in 2010? We
honestly cannot answer that, but it is possible.


                                                                   19
External Agents (92% of breaches, 99+% of records)                                                  Figure 12 . Role of external
                                                                                                      agents by percent of breaches
  As discussed in the previous section, external threat agents are the dominant force in both         within External
  percentage of breaches and percentage of compromised records. Almost all of them acted                             Unintentional (0%)
                                                                                                              6%     Indirect
  against the victim organizations deliberately and maliciously. While external agents can
  unintentionally cause harm, the subject of this report is such that those we observe usually
  have sinister motives.

  Zooming in to review the various types of external threat agents observed in 2010, we see
  in Table 6 that the primary offenders remain unchanged from the previous year. Organized
  criminal groups (58%) led the list, followed by unaffiliated person(s) (40%), with all others
  trailing a good distance behind. Both of the former increased rather dramatically, from 24%
  and 21% respectively in 2009. This effect has much to do with the aforementioned
                                                                                                              94%    Direct
  “industrialization” and scaling tactics observed among external breaches. The USSS dataset
  in particular shows quite a few remarkable examples of attacks replicated by the same
  group or individual across dozens of victims.


    Should we conclude that organized criminals tried harder
   (hit more victims) but were less successful (stole less data)?
This may or may not be true, and there’s a chance they might
   actually be more successful overall if measures other than
                                 record counts are considered.
  When examining compromised records for organized criminals, we see a different picture than the one we have come to know
  (and dis-love). Prior reports pinned upwards of 80-90+% of all stolen data on the activity of these groups; here they declined to
  a little over 50%. Should we conclude that organized criminals tried harder (hit more victims) but were less successful (stole less
  data)? This may or may not be true, and there’s a chance they might actually be more successful overall if measures other than
  record counts are considered. For instance, many of the perpetrators of the largest known breaches are living behind bars now
  (not considered by most to be a high quality of life). An approach using a standardized methodology to take a little data from a
                                                  lot of organizations may help achieve a decent (or indecent, rather) living while
                                                  avoiding incarceration (at least for a time).
  Table 6 . Types of external agents by
  percent of breaches within External             The “unaffiliated person(s)” label is used when the perpetrator is identified, but
                                                  there are no known associations between that individual and larger organized
   Organized criminal group     58% (!)           criminal groups, governments, activist groups, etc. They are, apparently at least,
   Unaffiliated person(s)       40% (!)           acting alone. Growth in activity from this type of external agent may signal a
                                                  growing entrepreneurial spirit and/or lessening co-dependency amongst
   Former employee                2%
   (no longer had access)
                                                  criminals. It could be that the canned tools used to attack POS systems, for
   Competitor                     1%              instance, may be maturing to the point that even “script-kiddies” can use them.
   Unknown                       14%              Another take is that they are not, in fact, acting alone, but are rather “guns for
                                                  hire” for some other entity lurking behind the shadows. If true, this has its own
   Other                         <1%
                                                  set of implications. We will surely be watching to see if this trend continues over
                                                  the next few years.


                                                                  20
The number of external agents categorized as “unknowns” dropped this year compared to last year, which can mainly be
attributed to the USSS, as they were able to successfully identify (and in many cases arrest and prosecute) the criminals. A greater
percentage of the unknown agents were found in the Verizon incidents. There are two main reasons for this. First, a considerable
number of clients kept insufficient log information to successfully identify the attacker; it simply can’t be determined by forensics
alone. This is in part due to the demographics of the 2010 caseload; smaller organizations are less likely to have the resources or
the expertise to manage their IT infrastructure. The second reason is that many victim organizations do not wish to expand the
investigation to include this line of inquiry when the attack has already been successfully mitigated. Similar to “unaffiliated
person(s),” one wonders about their true agenda and alliegances.

Lastly, we wanted to mention another group of external agents that are sometimes lumped in with insiders—that is, former
employees. There is some grey area around exactly when an employee (internal agent) becomes a former employee (external
agent) and the classification depends on the individual’s employment status with the organization when the breach occurred
as opposed to when it was discovered or investigated. In our recent casework, we observed several examples involving
former employees stealing data from their ex-employer. One of them sold their shared administrative credentials on the
black market, which resulted in authorized access soon after. Since these credentials were still shared among active
employees, they weren’t disabled as this individual left. Another stole data while employed, nabbed more after leaving, and
then extorted their former organization. Yet another sold their knowledge about the inner workings of a system to a
competitor. Several others were nice enough to continue visiting the internal network occasionally to catch up on the latest
developments and gossip. Deprovisioning of user accounts, anyone?

Origin of external agents

Ascertaining the geographic origin of external agents generally suffers from problems with making this determination based
upon IP addresses. Even when the country of the source IP(s) can be accurately pinpointed, it is often not the country where
the actual attacker resides, but rather a host in a botnet or just another “hop” used by the real culprit. In some cases, however,
various types of additional information help
refine or corroborate IP-based geolocation. All
                                                         Figure 13 . Origin of external agents by percent of breaches
these issues aside, knowing the origin of                within External
attacks (whether immediate or ultimate) is still
very useful for many reasons.                                            Europe-East
                                                                     (incl. Russia, Turkey)                                    65% (!)
For 2010, Figure 13 shows a similar order of
                                                                   Americas-North                              19%
regions as in years past, except there is a striking
                                                            Asia-South/Southeast                    6%
jump in the percentage of incidents originating
from Eastern Europe. North America is the                                         Africa           4%

runner-up, but it was by a much wider margin                                 Asia-East         3% (!)
than before. The disparity was largely due to the                       Europe-West
                                                               (incl. Northern, Southern)      2%
widespread and prolific attacks from organized
criminal groups typically hailing from Eastern                   Americas-Central             <1%

Europe. Conversely, many of the unaffiliated and                         Middle East          <1%
unidentified agents originate from Asia, which is                             Oceania
                                                            (Australia, New Zealand, etc.)    <1%
in the three spot. In the individual Verizon
dataset, North America is the main source                          Americas-South             <1%

followed by East Asia and Eastern Europe. This                           Asia-Central         0%
leaves little doubt as to the origin of the majority
                                                                            Unknown                      12%
of breaches worked by the USSS.


                                                                   21
Figure 14 . Role of internal                        Internal Agents (17% of breaches, 1% of records)
agents by percent of breaches
within Internal                                     Mentioned already in the overview to the Threat Agents section, the reduction of insider
<1%                Unintentional                    breaches from 48% to 17% is more of a function of the greater number of outsiders
          6%       Inappropriate                    represented in this year’s cases. Last year we discussed that many hypothesized we
                                                    would begin to see an uptick in the number of insider attacks due to the financial strain
                                                    created by the global economic conditions. In reviewing the trends in both the Verizon
                                                    and USSS caseloads, if it is happening, we are not seeing the consequences of it quite
                                                    yet. A counter argument can be made that because of the global economic conditions
                                                    and the competitive job market, insiders have placed more value on their trusted
                                                    employment and benefits. Fear of losing your job changes the risk versus reward model
                                                    for committing or conspiring to commit a crime in the workplace.
         93%       Deliberate
                                                    Insiders can cause or contribute to breaches in all sorts of ways. For classification
                                                    purposes, we group these into three major buckets. They either acted deliberately and
                                                    maliciously, inappropriately but not maliciously, or unintentionally without malice.
                                                    Much like last year, investigators determined that nearly all internal breaches (93%) were
                                                    the result of deliberate malicious activity. This may seem odd, but one should remember
                                                    that we’re specifically discussing data loss cases investigated by either a third party
                                                    forensics group (Verizon) or a law enforcement agency (USSS). Also keep in mind that if
                                                    the insider’s only involvement was related to a conditional event7, they are not
                                                    considered a primary threat agent and thus not depicted in the statistics above.

                                                    For the second year in a row, it is regular employees and end-users—not highly trusted
ones—who are behind the majority of data compromises. That ratio was roughly even in our first two reports, but since the
addition of the USSS cases, lesser-privileged insiders are increasingly dominant. Examples of regular employees represented by
the 88% shown in Table 7 spanned corporate end-users, bank
tellers, cashiers, waiters, and others among the rank and file. These                         For the second year in a row, it is regular
employees aren’t normally escalating their privileges in order to
                                                                                                employees and end-users—not highly
steal data because they don’t need to. They simply take advantage
of whatever standard user privileges were granted to them by their                                  trusted ones—who are behind the
organizations . This is a good time to remember that users need not                              majority of data compromises. This is
be superusers to make off with sensitive and/or valuable data. Case
findings suggest that regular employees typically seek “cashable”
                                                                                                  a good time to remember that users
forms of information like payment card data, bank account                                     need not be super users to make off with
numbers, and personal information.                                                                      sensitive and/or valuable data.
The proportion of internal breaches tied to more privileged and
trusted employees like executives, system administrators, and developers totals about 12% (less than half of what it was in
2009). When those in such positions are involved with breaches, case history shows they usually steal larger quantities and
more valuable forms of information. This makes a lot of sense in that highly privileged and senior employees have the “keys
to the kingdom” as they say. 2010, however, did not follow the pattern of history (maybe someone changed the locks?).


7 See the Error section under Threat Actions for an explanation of conditional events.


                                                                                         22
System and network administrators stole far less information than regular               Table 7 . Types of internal agents by percent
                                                                                        of breaches within Internal
employees. Executives, usually linked to the theft of IP and other sensitive
organizational information, did not take significantly more of such data
                                                                                         Regular employee/end-user          85% (!)
than other types of employees. Why? To be honest, we’re not sure. It may
have to do with a higher-than-normal percentage of cases for which we                    Finance/accounting staff            22%

were not able to ascertain the total amount of data loss. We do think the                Executive/upper management          11%
principle still holds and this is likely just an odd characteristic of this
                                                                                         Helpdesk staff                       4%
year’s caseload.
                                                                                         System/network administrator         3%
Finance and accounting staff represent a kind of in-between group in
                                                                                         Software developer                   2%
relation to those above with respect to privilege and trust. They were tied
to nearly twice the percentage of breaches in 2010 as in 2009. Their                     Unknown                              1%

position involves the oversight and management of accounts, records,                     Other(s)                             1%
and finances, which gives them greater opportunity to engage in illicit
activity of various sorts.

It’s worth the time to make a quick point on the types of assets targeted by insiders. Our data shows that external agents target
servers and applications and end-user systems most of time. The assets targeted by insiders vary between all types of assets. We
believe this is one the (many) reasons that insider threat is difficult to control. They have access to a plethora of assets and know
where and how to obtain data from them.

Partner Agents (<1% of breaches, <1% of records)
In comparison to previous years, breaches stemming from business partners declined sharply (based on partners identified as a
primary threat agent). There were only three (yes, 3) of them in the entire combined 2010 caseload. How does one write a
section about three events? Answer: One doesn’t. Instead, we’ll simply mention what they were and then briefly clarify other
ways in which partners factored into breaches but did not cause them.

There were two instances of partner error and one of misuse resulting in data compromise in 2010. One acted deliberately and
maliciously (Misuse) and the other two acted unintentionally (these are touched on in the Error section).

Extending the conversation from partners as threat agents to partners that factor into or relate to the breach in other ways gives
us something more to talk about. First, partners can contribute to a conditional event within the broader incident scenario.
Conditional events create circumstances or conditions that—if/when acted upon by another agent—allow the primary chain
of threat events to progress. In this respect, they are more akin to vulnerability than threat (which is why partners involved in
them are not considered primary threat agents). In 2010, partners contributed to conditional events in a sizeable 22% of
incidents. A common example of this is in the retail and hospitality industries where a remote vendor responsible for managing
a POS system neglects to change the default credentials, leaving it vulnerable to attack.

Something else to consider, a good number of assets involved in 2010 breaches were either hosted or managed by a partner.
This fact may have had absolutely nothing at all to do with the incident, but it is a partner-related datapoint and worth tracking
and monitoring over time.

All in all, what was said last year remains true; organizations that outsource their IT infrastructure and support also outsource a
great deal of trust. A partner’s security practices—often outside the victim’s control or expertise—can factor into breaches in
various ways. Third party policies, contracts, controls, and assessments should account for this.


                                                                 23
Threat Actions
Threat actions describe what the threat agent did to cause or to contribute to the breach. The majority of incidents involve
multiple threat actions in one or more categories (this is why the items in Figure 15 sum to more than 100%). VERIS defines seven
primary categories of threat actions, which are shown below along with the percent of breaches and compromised records
associated with each.


Figure 15 . Threat action categories by percent of breaches and percent of records


        Malware                                                                                                               49% / 79%

         Hacking                                                                                                                50% / 89%

           Social                         11% / 1%

          Misuse                                       17% (!) / 1%

        Physical                                                                 29% (!) / 10%

            Error   <1% / <1%

   Environmental    0% / 0%


2010 witnessed a fair degree of shuffling among the threat categories. Misuse had a three-fold decrease and dropped from the top
spot down to 4th place. Hacking and malware (#2 and #3 in 2009) each bumped up one notch to #1 and #2. Physical doubled as a
percentage of all breaches and sits in the #3 position. Social is no longer in the top three, falling from 28% to 11%. The “also rans” of
Error and Environmental are still bringing up the rear. Now let’s see if we can figure out what all the shuffling is about.


                              That Hacking and Malware are once again the most common threat
                        actions may come as no surprise to our long-term readers. After all, they’ve
                         simply regained what has been theirs all along before the usurper, Misuse,
                                                             dethroned them in last year’s report.

That Hacking and Malware are once again the most common threat actions may come as no surprise to our long-term readers.
After all, they’ve simply regained what has been theirs all along before the usurper, Misuse, dethroned them in last year’s report.
When one considers the circumstances surrounding this dethronement, however, it is actually quite a surprising result. The rise
of Misuse in the 2010 DBIR corresponded to the addition of the USSS caseload, which was very heavy in insider misuse. The
caseload examined in that report represented a semi-even ratio between Verizon and the USSS (57 cases from Verizon, 84 from
the USSS). Since the caseload for the 2011 report is nowhere near an even ratio (94 cases from Verizon, 667 from the USSS), logic
would hold that the percentage of Misuse would be astronomically higher than anything else. Viewed in this light, one can see
why the fall of Misuse is a very interesting development indeed.


                                                                      24
Figure 16 . Threat action categories over time by percent of breaches (Verizon cases)


  80%

  70%                                                                                                              Malware

  60%                                                                                                              Hacking
  50%
                                                                                                                   Social
  40%
                                                                                                                   Misuse
  30%
                                                                                                                   Physical
  20%

  10%                                                                                                              Error

   0%                                                                                                              Environmental

           2005              2006              2007             2008                2009           2010


The reasons behind the rise of Hacking and Malware are one and the same as those behind the rise of External threat agents, so
we won’t go over it again in full here. Suffice it to say that the “industrialization” trend we discussed in which standardized,
scalable, and automated attacks—which incorporated actions falling under the Hacking and Malware categories—are iterated
across numerous victims drove up the numbers in these categories. The effect of this shift is very apparent in Figure 17 showing
trends for the USSS over time.

Though very different in the nature of attack, the doubled percentage of breaches in the Physical category has roots in a
similar trend. Rather than remote automated attacks, efficient techniques for locally installing skimming devices on hundreds
of credit card input devices (ATMs, gas pumps, POS systems) were used against many organizations. The USSS investigated
quite a few cases of this sort, some of which covered many victims in wide geographic regions across the U.S. and Europe. A
methodology disclaimer is important
to mention here. In 2009, the physical            Figure 17 . Threat action categories over time by percent of breaches (USSS cases)
tampering/skimming          cases      we
                                                      90%
received from the USSS were not of the
large   multi-victim     variety.   Some              80%

involved a large number of affected                   70%                                                              Malware
devices, but they all belonged to one                 60%                                                              Hacking
victim (or we were unable to determine
                                                      50%
how many unique victims or incidents                                                                                   Social
                                                      40%
were involved). Therefore, we believe                                                                                  Misuse
that at least some of the rise in physical            30%

attacks in this 2010 caseload is due to                                                                                Physical
                                                      20%
increased sample size, higher visibility                                                                               Error
                                                      10%
into each case, and improved ability to
                                                      0%                                                               Environmental
recognize and split out cases affecting
multiple victims into distinct incidents.                     2007           2008          2009           2010


                                                                  25
Figures relating to compromised records were comparatively more stable across all threat categories in 2010. Hacking and
Malware were still the dominant duo of data loss, though slightly less so than in previous years. The only other category
responsible for a significant amount of loss was Physical.

In the spirit of the 2009 Supplemental DBIR, Table 8 lists the top 15 most prevalent threat action types (not categories) in 2010
along with their frequency (percent of breaches) and impact (percent of records). The information recorded in Table 8 is also
represented in Figure 18 with the percentage of breaches (frequency) along the x-axis and percentage of compromised records
(impact) along the y-axis. We will leave you to mull over these at your convenience and move on to a more in-depth analysis of
each threat action category.


Table 8 . Top 15 Threat Action Types by number of breaches and number of records

                  Category    Threat Action Type                                                                               Short Name     Breaches        Records
  1               Malware     Send data to external site/entity                                                                 SNDATA          297           1,729,719
  2               Malware     Backdoor (allows remote access / control)                                                         MALBAK          294           2,065,001
  3               Hacking     Exploitation of backdoor or command and control channel                                           HAKBAK          279           1,751,530
  4               Hacking     Exploitation of default or guessable credentials                                                  DFCRED          257           1,169,300
  5               Malware     Keylogger/Form-grabber/Spyware (capture data from user activity)                                  KEYLOG          250           1,538,680
  6               Physical    Tampering                                                                                         TAMPER          216           371,470
  7               Hacking     Brute force and dictionary attacks                                                                 BRUTE          200           1,316,588
  8               Malware     Disable or interfere with security controls                                                        DISABL         189           736,884
  9               Hacking     Footprinting and Fingerprinting                                                                   FTPRNT          185           720,129
 10 Malware                   System/network utilities (PsTools, Netcat)                                                         UTILITY        121           1,098,643
 11 Misuse                    Embezzlement, skimming, and related fraud                                                         EMBZZL          100            37,229
 12 Malware                   RAM scraper (captures data from volatile memory)                                                  RAMSCR           95           606,354
 13 Hacking                   Use of stolen login credentials                                                                   STLCRED          79           817,159
 14 Misuse                    Abuse of system access/privileges                                                                  ABUSE           65            22,364
 15 Social                    Solicitation/Bribery                                                                               BRIBE           59            23,361
                              Honorable Mention at #16
 16 Hacking                   SQL Injection                                                                                      SQLINJ          54           933,157


Figure 18 . Top 15 Threat Action Types plotted by percent of breaches (x) and percent of records (y)

                   60%

                   50%                                                                                                                               MALBAK
                                                                                                                                              HAKBAK
                   40%                                                                                                            KEYLOG                 SNDATA
   % of Records


                                                                                                                 BRUTE
                   30%                                                           UTILITY
                                                SQLINJ
                                                           STLCRED                                                                          DFCRED
                   20%                                                                                FTPRINT         DISABL
                                                                          RAMSCR
                   10%
                                                         ABUSE                                                          TAMPER
                                              BRIBE                         EMBZZL
                     0%

                             0%            5%                10%                 15%            20%             25%             30%           35%             40%

                                                                                                % of Breaches


                                                                                           26
Malware (49% of breaches, 79% of records)
Malware is any software or code developed or used for the purpose of compromising or harming information assets without
the owner’s informed consent. Malware factored into about half of the 2010 caseload and nearly 80% of all data lost. A majority
of breaches involving malware were against organizations in the Hospitality industry, with Financial Services being the second
most affected group.

Upon identification of malware during a data breach investigation, the IR team conducts an independent analysis to classify and
ascertain the capabilities of the malware with regards to the compromise at hand. Investigators often collaborate with ICSA
Labs, an independent division of Verizon, and use the resultant analysis to better assist the victim with containment, removal,
and recovery. Malware can be classified in many ways but we utilize a two-dimensional approach that identifies the infection
vector and the functionality used to breach data. These two dimensions are directly relevant to identifying appropriate detective
and preventive measures for malware.

Infection Vectors

As always (at least in our caseload), the most common malware infection pathway is installation or injection by a remote
attacker. This covers scenarios where an attacker breaches a system and then deploys malware or injects code via SQL injection
or other web application input functionality. It also accounts for four-fifths of the malware infections in our 2010 caseload, up
from around half in last year’s study. It’s popularity as an infection vector stems from the attacker’s desire to “set up shop” after
gaining access to the system. Installing malware is simply part of the moving in process.


Figure 19 . Malware infection vectors by percent of breaches within Malware

    81% (!)          4%               3%                   3% (!)              2%            <1%            <1%                <1%               10%


   Installed/       E-mail     Web/Internet           Web/Internet         Installed by     Network     Portable media     Coded into           Unknown
  Injected by                   (auto-executed/       (user-executed or   other malware   propagation     & devices         existing
                              ”drive-by” infection)     downloaded)
remote attacker                                                                                                          program/script
                                                                                                                         (i.e., a logic bomb)


The web, while still the second most common infection vector, decreased from last year. Web-based malware is divided into two
subcategories, code that is auto-executed (aka drive-by downloads), and code that requires additional user interaction beyond
the page visit; fake AV scaring users to “click here to scan and clean your infected system” is a common example of this tactic. The
main reason for the “drop” in web-based malware (which wasn’t really a drop at all since the number of incidents involving them
is similar to before) is that the highly-automated and scalable attack scenarios described throughout this document do not use
this pathway. Improvements in browser security could also be contributing to this shift, but we haven’t seen any direct evidence
to support this finding.

E-mail based malware doesn’t show significant changes from previous studies, while other infection vectors decreased.
Occasionally, we still see infection vectors such as network propagation and portable media devices, but there appears to be a
consistent shift towards attackers “owning the box” to get specific malware on the system. The somewhat high percentage of
“unknown” is attributable to many different factors. Most often it is due to a lack of evidence (no log data, software removal, and
premature cleanup) on the system. In these cases, we know malware was present, but the infection vector cannot be
conclusively determined.


                                                                               27
Malware Functionality

Equally important to the pathway of malware infection is the function it exhibits once it is within the victim’s environment.
Verizon’s IR team mostly focuses on how malware causes and contributes to the data breach. However, we often find all sorts of
other unrelated malware during the course of our investigation. This serves as an additional indication of inadequately managed
systems. Although malware frequently utilizes several methods to harm a system, it still serves one or more of three basic
purposes in data breach scenarios: enable or prolong access, capture data, or further the attack in some other manner.


Figure 20 . Malware functionality by percent of breaches within Malware and percent of records


                  Send data to external site/entity                                                                                       79% (!) / 45%

                                              Backdoor                                                                                78% (!) / 53%
                            (allows remote access/control)

               Keylogger/Form-grabber/Spyware                                                                             66% (!) / 40%
                           (capture data from user activity)

         Disable or interfere with security controls                                                      50% (!) / 19%

                           System/network utilities                                           32% / 28%
                                           (PsTools, Netcat)

                                          RAM scraper                                   25% / 16%
                      (captures data from volatile memory)


                         Scan or footprint network                         10% / 16%

  Download/Install additional malware or updates                     5% / 5%

                               Command & Control                    4% / 9%
                       (listens for and executes commands)

                             Capture data from an
                                                                    4% / 9%
                       application/system process
                  Capture data resident on system                  3% / 5%
                                          (e.g., cache, disk)

                                         Packet sniffer          1% / 12%
                               (capture data from network)


            Attack another external system/entity                1% / <1%

       Destroy or corrupt data resident on system                1% / <1%

     Infect other systems via network propagation                1% / 4%
                                                (nw worm)


                                            Send spam            1% / <1%

                   Brute force or dictionary attack              <1% / <1%

          Encrypt or seize data resident on system               <1% / <1%

      Infect other systems via e-mail propagation                <1% / <1%
                                             (e-mail worm)


                Infect removable media or devices                <1% / <1%

                          Initiate client-side attack            <1% / <1%
                                             (i.e., XSS, MitB)


                  Redirect to another site/address               <1% / <1%

                                              Unknown             2% / 1%


                                                                                   28
Per Figure 20, sending data to an external entity, backdoor, and keylogger functionalities continue to be the three most common
functions found in breach-related malware and all increased this year. It is important to note that none of these are mutually
exclusive and it’s common for a single piece of malicious code to feature several components. Backdoors, which allow attackers
unauthorized access to infected devices, are again atop the list with a two-fold increase. Once they have gained that foothold
they can install additional malware, use the device as a launch point for further attacks, retrieve captured data, and so on. Over
half of data loss in cases featuring malicious code involved a backdoor component.

Keyloggers and form grabbers were seen in two-thirds of cases, nearly doubling from the previous year. Commercially available
keylogging software, such as Perfect Keylogger and Ardamax Keylogger, are freely available on the web with fully functioned
pirated versions distributed on P2P networks and torrent sites. These utilities also allow the attacker to build a pre-configured
remote installation package that will be deployed on a target system. They exhibit many types of anti-forensic capabilities, such
as hiding itself from a list or running processes, and manipulation of timestamps of its components and output files. Attackers
can customize the software to create output files with user-defined filenames, which
enable the use of legitimate Windows filenames. Other features, such as encryption of                        Sending data to
output files and automated exfiltration methods via e-mail or FTP also exist. Historically,
                                                                                                           an external entity,
criminals use these types of keyloggers because of these features and ease
of configuration.                                                                                   backdoor, and keylogger
Keyloggers are also common in Zeus family of malware used to target consumer or                      functionalities continue
merchant credentials to online banking applications. An interesting two-victim                           to be the three most
dynamic develops where a customer victim (consumer or business) suffers the loss of
valid banking credentials, and a bank is victimized when the attacker uses the stolen
                                                                                                   common functions found
credentials to conduct a fraudulent transaction. Many times this entails a wire transfer          in breach-related malware
to an account outside of the United States where the funds disappear quickly into the             and all increased this year.
hands of money-mules.

In addition to keyloggers, the use of RAM scrapers in POS-directed attacks has also increased. RAM scrapers are designed to
capture payment card data from a system’s volatile memory, and the increase of its use is consistent with the decrease in packet
sniffers. Increased encryption of network traffic across both public and private networks has driven some of this transition. The
payment card data residing in RAM is not encrypted and is most likely “fresh” with a current expiration date. Another potential
factor in the reduction of packet sniffers may be that several of the groups tied to large cases involving packet sniffers are in jail
(e.g., Albert Gonzalez). That’s not at all to say sniffers are a lost art, but there does seem to be a connection.


Backdoors initiate outbound reverse connections from the infected system to circumvent firewalls and other security controls .
We’ve seen several types of backdoors throughout our investigations, some of which facilitate interactive remote access
employing SSH tunneling to forward RDP port 3389 to an IP address configured by the attacker, and others that communicate
to a “client” application accepting communication from the infected system . Attackers deploy the latter type of backdoor using
a “server” executable on a target system, which will communicate with a “client” application on the attacker’s system . These
backdoors are often configured to communicate on commonly used ports such as 80, 443, or 22 to conceal the suspicious traffic
from system administrators . Such backdoors are described in the hacker community as a Remote Administration Tool (RAT)
and are readily available on the web and across hacking forums . Generally, AV classifies RATs as remote access Trojans, however
commercial non-free versions of these tools exist and are advertised by the developers to circumvent AV . These standalone
“server” executables are usually configured and built using a GUI based “client” application with all attacker specified options
embedded within the executable . These types of backdoors commonly contain file transfer and keylogging functionality as
well as other anti-forensic techniques such as encrypting its traffic, password protection, and secure deletion capabilities . The
keylogging components of these backdoors allow criminals to capture authentication credentials and use them for subsequent
and/or expanded attacks against corporate networks . One particular organized crime group used the same backdoor/keylogger
on over 100 different organizations .


                                                                  29
Network utilities, such as PSTools are commonly used to deploy malware on systems and to harvest the output. Though these
tools are not inherently malicious, criminals are deploying them and using them in a malicious manner. If such utilities were
added to a system by an attacker, we categorized them under malware.

                                When malware captures sensitive information, it must then be exfiltrated from (taken out of ) the
While any amount
                                victim’s environment. There are two basic ways this happens: either the malware sends it out of
of data leaving the             the organization (found in nearly eight out of ten of incidents involving malware) or the attacker
owner’s possession              re-enters the network to retrieve it (see backdoor). The general rule of thumb is that smaller
                                packets are sent out (i.e., credentials captured by keyloggers) while larger hauls of data are
    is never a good             retrieved (i.e., the contents of a network file share transmitted through a backdoor’s file transfer
thing, the act does             capabilities). While any amount of data leaving the owner’s possession is never a good thing, the
    (or at least can)           act does (or at least can) provide evidence of foul play. It’s a matter of looking for the right
                                indicators in the correct places.
  provide evidence
                                For this reason (and others) we advocate paying attention to what goes out of your network and
  of foul play. It’s a          what changes take place within your systems. Don’t have any customers or partners in East Asia,
 matter of looking              yet network and firewall logs show periodic bursts of traffic sent there from your networks? What
                                about those ZIP or RAR files with hidden and read-only attributes that showed up in your root
        for the right
                                directory last week and have been growing steadily ever since? Maybe there’s a perfectly good
   indicators in the            explanation for these things… but you will never know for certain unless you take steps to
     correct places.            identify and verify them. It highlights the importance of detecting and responding to malware
                                quickly. In some incidents the affected company missed an opportunity to lessen the aftermath
of infection by ignoring or not adequately investigating initial anti-virus alerts. Regrettably, those alerts sound less often these
days, and AV alone is not always enough.

Malware Customization

This year nearly two-thirds of malware investigated in the Verizon caseload was customized—the highest we have ever seen
(see Figure 21). Additionally, most of the records stolen by malware were taken in breaches where customized forms were
observed. The extent of customization found in a piece of malware can range from a simple repack of existing malware to avoid
AV detection to code written from the ground up for a specific attack. In 2010 we have seen the majority of customized code
shifting to a level of effort that falls in between these two extremes.

Code modification to existing malware was present in a little less than half of Verizon cases involving malware. This is often
something like a “kit” in which you start with certain known base code that provides low-level functionality, but can add to it or
modify it to fit a specific purpose. Hackers can then collaborate on more advanced functionality to build a bigger and better
monster. Additionally, the modification and customization of such malware not only allows attackers to add or change
capabilities, but also hinders the detection of such malware. The infamous Zeus malware falls into this category. Attackers
commonly started off with a base version of Zeus, but a large community of individuals modified or recoded its elements to
enhance or change its functionality and detectability over time.

When code modification is present, over two-thirds would fall into this level of customization. Many of the freely available
backdoors and keyloggers also allow for low-difficulty customization and modification. For example, attackers no longer have
to modify code to alter the exfiltration strategy of a particular piece of malware, they can just type an IP address in a form, check
(or uncheck) some boxes, hit “Apply” and then “OK.”


                                                                    30
Figure 21 . Malware customization over time                                                    Level of malware customization by
by percent of breaches within Malware*                                                         percent of breaches within Malware*

   70%
                                                                                  63%
                                                                                                        18%    Custom-created
                                                   59%
   60%

   50%                                                          54%
                                                                                                        43%    Code modification (!)
   40%

   30%     28%
                                                                                                   2%          Repacked

   20%                                24%
                         21%                                                                            30%    No customization
   10%

                                                                                                         7%    Unknown
    0%
          2005         2006          2007         2008          2009             2010

                                                                     * Verizon caseload only                     * Verizon caseload only


           This year nearly two-thirds of malware investigated in the Verizon caseload was
         customized—the highest we have ever seen. The extent of customization found in
          a piece of malware can range from a simple repack of existing malware to avoid
                      AV detection to code written from the ground up for a specific attack.

In a year that includes more breaches than ever, the increased proportion of customized is not a good sign. This is especially true
when mixed with other findings of this report. It means that even the majority of highly-automated and non-targeted attacks
against small organizations utlize customized malware. This, in turn, means that the cost and difficulty of customization is
relatively low. This commoditized customization is made ever more accessible to an ever-increasing pool of criminals by an
extensive “malware-as-a-service” market. We find it hard to foresee anything but trouble here for the good guys.

Hacking (50% of breaches, 89% of records)
The term “hacking,” although ambiguous (and ubiquitous), essentially categorizes all attempts to intentionally access or harm
information assets without (or in excess of ) authorization by thwarting logical security mechanisms. Hacking affords the criminal
many advantages over alternate modes of attack. Namely, it can be accomplished remotely and anonymously, it doesn’t require
direct interaction or physical proximity, and there are many tools available to automate and accelerate attacks. The use of
automated tools, typically written and developed by someone other than the attacker, lowers the learning curve and allows
even less-skilled threat agents to successfully pull off an intrusion. In this section, we examine the types of hacking observed by
Verizon and the USSS in 2010, the paths through which these attacks were conducted, and other details about this
important category.


                                                                31
Hacking Methods

As shown in Figure 22, there are a handful of hacking methods that dwarf all others with regard to frequency and data loss in
2010. By contrast, 2009 results showed a more gradual tapering off from most to least common (though there were still some
definite frontrunners). Furthermore, none of the techniques in 2009 represented more than 40% of all hacking-related breaches.
All of the top four exceeded that percentage in 2010, suggesting a great many attacks leveraging the same (or similar)
combination of methods.


Figure 22 . Types of hacking by percent of breaches within Hacking and percent of records


                 Exploitation of backdoor or
                                                                                                                                73% (!) / 45% (!)
                 command/control channel
                    Exploitation of default or
                                                                                                                         67% (!) / 30% (!)
                       guessable credentials

           Brute force and dictionary attacks                                                        52% (!) / 34% (!)

            Footprinting and Fingerprinting                                                       49% (!) / 19% (!)

              Use of stolen login credentials                                     21% / 21% (!)

                                   SQL Injection                          14% (!) / 24% (!)

   Exploitation of insufficient authentication                        10% / 21%
                              (e.g., no login required)


                        Abuse of functionality                        10% / 19%

                                 Buffer overflow                     9% / 15%

    Exploitation of insufficient authorization            1% / 4%
               (weak or misconfigured access control)


                            Cross-site scripting          1% / <1%

                   Cross-site request forgery             <1% / <1%

                                   Cryptanalysis          <1% / <1%

                 DoS at the application layer             <1% / <1%
                        (consumes system resources)


                    Encryption Brute Forcing              <1% / <1%

                                           Other(s)       <1% / <1%

                                        Unknown              4% / 8%


The method utilized in the highest percentage of breaches and stolen records was exploitation of backdoors or command/
control functionality. This isn’t the backdoor itself (which is considered malware), but is inextricably linked to it. With a backdoor
installed, attackers can bypass security mechanisms to gain access without relying on legitimate channels. This offers the added
advantage of greater stealth and evasion of host-level logging. Legitimate remote access applications do not log an intruder’s
actions if he or she is not using them.


                                                                                    32
The next few techniques listed in Figure 22 are basically a blueprint for standardized and highly scalable attacks against soft
targets. That is to say, the perpetrator(s)—largely organized crime groups—set up automated systems to scan for certain
open ports and services (footprinting and fingerprinting), try a few well-known combinations of default credentials used on
various types of systems, and then—if still necessary (it’s often not)—run a brute-force attack to crack the system. These
scans run at all hours of the day and night, trying to gain access, and recording successes. The would-be assailant wakes up,
has some coffee (or tea, or maybe even vodka), and begins the workday with a nice compiled list of IPs for vulnerable devices
along with the exact usernames and passwords needed to access them. After that, put in a few hours cramming malware
onto selected systems, revisit last week’s victims to collect some captured data, and then head home early to the wife and
kids. This continues until they get caught, grow bored with it, die, or get hired by a security company (yes, the latter is a jibe,
but, unfortunately, it’s often true).


                             The would-be assailant wakes up, has some coffee (or tea, or maybe
                          even vodka), and begins the workday with a nice compiled list of IPs for
                       vulnerable devices along with the exact usernames and passwords needed
                           to access them. After that, put in a few hours cramming malware onto
                        selected systems, revisit last week’s victims to collect some captured data,
                                                    and then head home early to the wife and kids.

After the triad above was the use of stolen login credentials. This common technique is particularly vexing to victims because
it shrouds the attacker in a disguise of legitimacy. Rather than sounding alarms because an unrecognized or unauthorized
user is accessing sensitive assets (yes, we realize the data suggests that no alarm would be sounded anyway, but we’re trying
to be optimistic), it looks like Bob doing his job. Nothing out of the ordinary with that, right? Authenticated activity is much
less likely to trigger IDS alerts or be noticed by other detection mechanisms. It also makes it easier for the attacker to cover
his tracks as he makes off with the victim’s data.


That the use of stolen login credentials fell in 2010 from its top position is rather misleading . The distinction of what is a single
incident vs . multiple incidents can be difficult to make with this technique . For instance, if a bank notices that 100 accounts
showed signs of unauthorized access, they would likely consider these to be 100 different “incidents .” However, if an
investigation was conducted and all of those were traced to a single perpetrator, it might be viewed as one large incident
affecting multiple accounts . It comes down to perspective and knowledge of the details behind the attack . We mention this
simply because such scenarios were quite common in both Verizon’s and the USSS’ caseloads . We treated them as single
incidents, which has an effect on the stats associated with stolen credentials . One can rightly say that the actual frequency of
criminals using of stolen credentials (each instance of gaining access to a compromised account) was much higher than a
glance at Figure 22 (which is based on per incident stats) indicates .


                                                                   33
As with last year, we found that credentials are stolen more often by malware than, say, phishing or snooping them off sticky
pads (though those things do happen). Bank credential stealing malware such as Zeus or Spyeye will grant an intruder possession
of legitimate access credentials that often drive the remainder of the data breach. This occurs when an end-user downloads a
piece of malware, either via drive-by-download or through user interaction with some e-mail or other message tailored to the
user. The credentials are then distributed through botnets, compiled, and organized for each institution. The attacker will then
use these credentials to either make fraudulent financial transactions from business accounts, personal accounts (consumer
fraud), or steal some type of sensitive PII data for identity theft.


During one of Verizon’s cases in mid 2010, Romanian hackers were able to use this exact method to relieve a U .S . bank of
about several million dollars . The intruders started by stealing legitimate credentials to the bank’s ACH wire transfer portal
belonging to three separate internal employees, who all received an e-mail from the “FDIC” on a Friday afternoon . The
employees noted that the attached PDF file wouldn’t open correctly . The following Monday, several million dollars were
wired out of the bank using the three employees’ access credentials .


After we wished it a happy 10th birthday last year, SQL injection has returned for another party, but with less fanfare this time.
From 25% of hacking-related breaches and 89% of all data stolen, those numbers declined in 2010 to 14% and 24% respectively.
Of course, there’s that whole caseload-scaling thing to consider, so it’s not as though SQL injection is disappearing. It simply
hasn’t been as widely incorporated into the kind of canned
attacks described above for other techniques. Something                                               It’s difficult to tell if this trend (of few
interesting to note about SQL injection is that it factored into a                                    vulnerability exploits) exists because
disproportionately higher percentage of breaches in Asia.
                                                                                                   hackers prefer other vectors or if they’ve
Vulnerabilities and Patch Management                                                                 been forced in that direction because
In previous DBIRs, we’ve shown the relatively few numbers of                                        organizations are patching well. Most
attacks leading to data compromise that exploit patchable9
software or system vulnerabilities. Nearly all exploit configuration
                                                                                                                      likely, it’s a little of both.
weaknesses or inherent functionality of the system or application. This trend continued in 2010 as only five vulnerabilities were
exploited across the 381 breaches attributed to hacking. These are as follows: CVE-2009-3547, CVE-2007-5156, CVE-2009-2629,
CVE-2010-0738, and CVE-2007-1036. Though surprising, this makes sense if one considers the prevalence of techniques
discussed earlier in this section, few of which are vulnerabilities in code that can be “patched.”

It’s difficult to tell if this trend (of few vulnerability exploits) exists because hackers prefer other vectors or if they’ve been forced
in that direction because organizations are patching well. Most likely, it’s a little of both. Patching is definitely a security practice
that is well-known and receives a lot of attention (it’s often the core statistic of a security metrics program). For the most part,
organizations do seem to be keeping patch levels current, at least on Internet-facing systems. As you can see from those CVE
dates, most attacks exploit older vulnerabilities, ones that should have been eliminated by any reasonable patch deployment
cycle. Therefore, we continue to maintain that patching strategies should focus on coverage and consistency rather than raw
speed. The resources saved from doing that could then be put toward something more useful like code review and
configuration management.


9 The word “patchable” here is chosen carefully since we find that “vulnerability” does not have the same meaning for everyone within the security community. While
  programming errors and misconfigurations are vulnerabilities in the broader sense, lousy code can’t always be fixed through patching and the careless administration patch
  has yet to be released. Furthermore, many custom-developed or proprietary applications simply do not have routine patch creation or deployment schedules.


                                                                                      34
Attack Pathways                                       Figure 23 . Attack pathways by percent of breaches within Hacking and
                                                      percent of records
Having lost ground to web applications over
                                                          71% (!)           34%           22% (!)          11%            8%
the last few years, remote access and desktop             27% (!)           38%           38% (!)          24%           10%
services are once again at the number one spot
in the list of attack pathways in Figure 23. A
whopping 71% of all attacks in the Hacking
category were conducted through this vector.           Remote access     Backdoor or Web application   Network file     Unknown
Because there are so many types of remote                services      control channel               sharing services

access services in use by organizations, we give
a more detailed account of them in Table 9.

Remote access and desktop services, in combination with the exploitation of default and/or stolen credentials, is a huge
problem in the retail and hospitality industries. Opportunistic attacks are carried out across many victims who often share the
same support and/or software vendor. As soon as an intruder discovers a particular vendor’s authentication method and
                                                          schema (be it for TCP port 3389 for RDP; or TCP port 5631 and UDP
                                                          port 5632 for pcAnywhere), he will be able to exploit it across a
Table 9 . Types of remote access by percent of
                                                          multitude of that vendor’s partners and customers. Oftentimes, in
breaches within Hacking and percent of records
                                                          lieu of conducting a full port scan for these remote service
Local remote screen sharing              64%    24%       applications, attackers will customize their scripts to exclusively look
(e.g., RDP, PCAnywhere)

                                                          for these ports and search a broad swath of the Internet. This speeds
Online session screen sharing            5%     13%
(e.g., Go2Assist, LogMeIn, NetViewer)
                                                          up their capability of searching for and finding services unprotected
Remote Shell                             2%     1%        by router/firewall ACLs and allows them to quickly check for default
(e.g., ssh, telnet, rsh)
                                                          credentials as well. This of course relies on remote access
Web-based terminal services              2%     12%
(e.g., Citrix, MS Terminal Services)                      authentication schema being uniform across all of that particular
                                                          vendor’s customers—but hey, who are we kidding? They always are.
VPN                                      1%     <1%
                                                          The installation and exploitation of backdoors has already been
                                                          covered in this report. They do, however, warrant another mention
here as we discuss common paths of attack. Along the typical chain of events, the backdoor is often placed on a victim system
after gaining access via default or stolen credentials. The agent then has control of or can access the system at will without
leaving traces in logs (if they exist in the victim environment). It accomplishes the goals of concealment and persistence that
cybercriminals crave. As in years past, backdoors are frequently utilized to exfiltrate data from compromised systems.

Just because web applications dropped as an overall percentage of attacks, don’t believe for an instant that they are any less
critical a vector than they were a year ago. If you remove hospitality and retail victims from this dataset, web applications are
right back on top and are more numerous than ever. Please don’t let the bad guys catch your development and application
assessment teams napping.


                               Just because web applications dropped as an overall percentage of attacks,
                           don’t believe for an instant that they are any less critical a vector than they were
                             a year ago. If you remove hospitality and retail victims from this dataset, web
                                      applications are right back on top and are more numerous than ever.


                                                               35
Social (11% of breaches, <1% of records)
Social tactics employ deception, manipulation, intimidation, etc. to exploit the human element, or users, of information assets.
Typically, these actions are used in concert with various other threat categories and can be conducted through both technical
and non-technical means. Social attacks are down from 28% in 2009 to 11% in 2010. The amount of data stolen as a result of
social attacks, while previously low, is down from last year as well (3% to less than 1%).


Figure 24 . Types of social tactics by percent of breaches within Social


                           Solicitation/Bribery                                                                           74% (!)

                                        Pretexting                                           44% (!)
                          (classic Social Engineering)

                      Counterfeiting/Forgery                         16%
                              (fake website, docs, etc)

                                          Phishing             11% (!)
                              (or any type of *ishing)


                                      Hoax/Scam           4%

                                Influence tactics         4%
         (Leveraging authority or sense of obligation)


                           Extortion/Blackmail            3%


                                         Unknown          3%


Per Figure 24, solicitation and bribery remains the most common type of social tactic in 2010, but by a much wider margin than
before. This frequently entails collusion between an external agent and an insider, though other combinations occur as well.
Whoever is involved, one party uses petitions, promises, and payments to get another to participate in the crime, usually
because it would have been difficult or impossible without their aid. Widespread solicitation scenarios target waitstaff and
cashiers to skim payment cards and bank employees to perform all manner of illicit activities. Less common examples involve
recruiting system administrators and other privileged parties to steal data, open holes, disable security systems, etc.

Pretexting numbers are also quite high, and have more than doubled from the previous year. There are a myriad of ways in
which imaginative and resourceful criminals can utilize pretexting in an attack scenario. We observed convincingly-attired
repairmen walk brazenly into victim locations to steal, tamper with, and replace devices. We saw organized foreign criminals use
elaborate yarns to weasel their way into positions of influence in numerous organizations (or gain the trust of those that did). We
studied records of human resources staff hoodwinked into providing (and changing) personal and employment information to
would-be fraudsters. We witnessed Jedi masters convince Stormtroopers that these were not the droids they were looking for…
oh wait…no; that was Star Wars. Nevermind. But the others were definitely examples from 2010 cases.


                                                                           36
Figure 25 . Paths of social tactics by percent of breaches within Social

      78% (!)            14%              10%               6%               5%         4%               5%


     In-person        Documents           E-mail        Web/Internet        Phone   SMS/Texting        Unknown


 While counterfeiting and forgery can involve everything from websites to documents (and more), the use of fake credentials
 (drivers’ licenses, birth certificates, etc.) was 2010’s most prevalent example. Many of these had to do with identify theft and
 account takeover schemes targeting financial institutions.


In last year’s report, e-mail was the path du jour in most cases. Over the last
    year, however, criminals increasingly relied on the personal touch with a
                         whopping 78% of cases involving in-person contact.

 Phishing is not new by any means, but it does seem to be finding some renewed attention in the criminal community. Rather
 than the typical e-mail lure to change your bank password, external sources along with our own caseload hint that phishing
 is being used more often to gain a toehold in the victim’s environment through attached malware. This tactic, of course, is
 not new either; it simply seems to be hitting a (who know’s how temporary) growth spurt.

 The vectors through which social tactics were conducted changed significantly in 2010 (see Figure 25). In last year’s report,
 e-mail was the path du jour in most cases. Over the last year, however, criminals increasingly relied on the personal touch with
 a whopping 78% of cases involving in-person contact. This was the clear
 vector of choice for solicitation and pretexting—and understandably so.             Table 10 . Targets of social tactics by percent
 Even in our high-tech business world, many deals won’t get done without             of breaches within Social
 an in-person “meet and greet.” A good number of large multi-victim cases
                                                                                      Regular employee/end-user            80% (!)
 worked by the USSS involving in-person solicitation and pretexting helped
 to drive this up substantially. That some of them employed counterfeiting of         Finance/accounting staff             33% (!)
 identification credentials also drove documents up as vector as well.                Human resources staff                30% (!)

 Not much has changed this year with regard to the targets of social tactics          Customer (B2C)                        8%
 listed in Table 10. Regular employees continue to be singled out for mischief
                                                                                      Executive/upper management            5%
 of this sort (see paragraphs above for examples). This reinforces the need for
 greater and more comprehensive training and awareness campaigns with                 Helpdesk staff                        3%

 regard to social attacks. These should include information and tips on how           System/network administrator          1%
 to recognize and avoid falling for common ploys.
                                                                                      Unknown                               1%


                                                                       37
Misuse (17% of breaches, 1% of records)
We define Misuse as using entrusted organizational resources or privileges for any purpose or in a manner contrary to that
which was intended. These actions can be malicious or non-malicious in nature. The category is exclusive to parties that enjoy a
degree of trust from the organization such as insiders and partners. In 2009, Misuse was the most common of all threat actions,
but dropped substantially in 2010. In no way does this mean Misuse is rare; 17% corresponds to almost 130 breaches that
involved some form of Misuse.

The three most common types of Misuse observed in 2010 are a repeat of those identified in 2009, with embezzlement,
skimming, and related fraud once again on top. Several large internal fraud cases worked by the USSS helped make this type
of misuse even more predominant over the past year. In one, certain members of a Nigerian fraud ring were indicted for their
involvement in a long-running and extensive identity theft operation within some of America’s largest banks. The fraudsters
gained key positions within these institutions which allowed them to steal personally identifiable information, access and/or
create bank accounts, apply for fraudulent loans, sell information on the black market, and other nefarious activities.


Figure 26 . Types of misuse by percent of breaches within Misuse


  Embezzlement, skimming, and related fraud                                                                               75% (!)


           Abuse of system access/privileges                                                 49%


       Use of unapproved hardware/devices                                          39%


                Abuse of private knowledge                 7%


         Violation of web/Internet use policy         5%


            Violation of e-mail/IM use policy         4%

            Handling of data on unapproved
                                                 2% (!)
                              media/devices

     Storage/transfer of unapproved content      2%


        Use of unapproved software/services      1%


       Violation of asset/data disposal policy   1%


                                   Unknown       1%


             The three most common types of Misuse observed in 2010 are a repeat of those
            identified in 2009, with embezzlement, skimming, and related fraud once again
             on top. Several large internal fraud cases worked by the USSS helped make this
                                   type of misuse even more predominant over the past year.


                                                                   38
Other, less complex, instances of embezzlement, skimming, and related fraud were seen as well. These were commonly
perpetrated by bank tellers, restaurant waitstaff, retail clerks, or others in similar positions in which the “simple” handling of
financial transactions is inherent to the job. Oftentimes these employees used handheld skimmers and other devices to facilitate
the theft, which is why “use of unapproved hardware/devices” is rather high in Figure 26. While such activity may seem out of
sorts with some of the more technical attacks described in this report, it is nevertheless a real (and common) method of stealing
data—especially payment cards. As discussed in the section describing Social tactics, these scenarios very often involve an
external party that solicits and/or bribes the insider to commit the crime and provides them with the requisite devices to pull
it off.
                                                                                                   The 2010 caseload once
Abuse of system access/privileges, at the #2 spot in Figure 26, is similar in nature to
embezzlement, but specifically involves the misuse of logical access to information                  again reminds us that
systems. As suspected, many breaches involve both non-technical forms of                             “major” acts of misuse
embezzlement along with abuse of system access (and any other type of Misuse listed
                                                                                                   like data theft are often
in Figure 26, for that matter). The actions leading to the court martial of U.S. Army Private
Manning provide a now infamous real-world example of this type of Misuse. He abused                precipitated by “minor”
his (overly) privileged access to SIPRNET to browse and copy classified State Department                 acts of misconduct.
cables without authorization to an external hard-drive (unapproved device). While this
event stole the spotlight in 2010, it is by no means the only or most spectacular example
                                                                                                    This doesn’t mean that
of system abuse from 2010. The combined Verizon-USSS dataset contains scores of                         everyone who veers
them, but the worst aspect of such cases is that countless others will likely never              slightly from the straight
be discovered.
                                                                                                and narrow will inevitably
As evidenced by the examples above, privileged users typically need a means of moving
or exfiltrating data once they have misappropriated it. Figure 26 is essentially a laundry             careen headlong into
list of how this can be accomplished. Some use corporate or personal e-mail to send it               a life crime, but it does
to external parties or accounts. Some smuggle it out on various types of personal
                                                                                                  mean that questionable
devices or media. Others use approved devices, but for unapproved purposes or in an
unsanctioned manner. We continue to find that the success of a breach does not hinge              behavior should be seen
on the perpetrator being able to use a certain portable device (i.e., plugging up USB           for what it is—a potential
slots doesn’t eliminate the problem). Unfortunately, users have a plethora of choices
                                                                                                        warning sign—and
when it comes to media and devices fit for secreting data and removing it from their
employer. For this reason, it is generally easier to control data at the source than it is to         treated appropriately.
block a virtually limitless array of potential destinations. Certain technologies, however,
like DLP and behavioral monitoring may add some additional levels of protection between those end points.

The 2010 caseload once again reminds us that “major” acts of misuse like data theft are often precipitated by “minor” acts of
misconduct. This doesn’t mean that everyone who veers slightly from the straight and narrow will inevitably careen headlong
into a life of crime, but it does mean that questionable behavior should be seen for what it is—a potential warning sign—and
treated appropriately. Another lesson reinforced during this round of analysis is the importance of quickly deprovisioning user
access and privileges when they are no longer needed. Year after year we investigate breaches involving former employees or
business partners. A simple yet good rule of thumb is that if you no longer want them on your payroll, then don’t leave them in
your systems.


                                                                  39
Physical (29% of breaches, 10% of records)
This category encompasses human-driven threats that employ physical actions and/or require physical proximity. In previous
years physical attacks were consistently one of the least prevalent threat actions in terms of both percentage of breaches and
percentage of records lost. This was partially due to the nature of common physical actions; for instance, it is unlikely that a stolen
mobile device will precipitate a full-blown forensics investigation and would therefore not be in our caseload. Another factor is
that many of the action types we classify as Physical are less likely to be associated with confirmed data loss. Moreover, if physical
access to a device is available as part of normal job duties for insiders, then that local access is not classified as a physical action
                                                                                                       but rather falls under the
                                                                                                       category of misuse.
Figure 27: Types of physical actions by percent of breaches within Physical
and percent of records                                                                                 The analysis of the 2010 case
     98% (!)         17%             2% (!)         1%               <1%             <1%               dataset has resulted in three
      10%            <1%              1%            <1%              <1%             <1%
                                                                                                       noteworthy shifts in physical
                                                                                                       actions from data represented
                                                                                                       in previous reports. The first of
                                                                                                       these is that Physical actions
   Tampering      Surveillance       Theft         Snooping       Local access     Unknown             are twice as prevalent in our
                                                                                                       current caseload, with one or
                                                                                                       more action types found in
29% of the combined caseload of Verizon and USSS. Incidents involving ATM and gas pump credit card skimmers represent the
majority of physical actions. These cases would not typically be pursued by Verizon investigators, but certainly fall under the
jurisdiction of USSS. ATM and gas pump skimming is conducted largely by organized criminal groups and one “spree” can target 50
to 100 different business locations. These attacks have been occurring for years, but are on rise in many areas according to both
public reports and the caseload of the USSS.

The second change from last year is that we have witnessed a discernible increase in the proportion of record loss
associated with physical actions from prior years. Again, this is attributable to the increase in physical skimmer cases.
Record loss for these cases is an aggregate of the credit card numbers and/or PINs compromised and is therefore much
different than cases of theft that may involve a single document or device. Ten percent of all compromised records were
linked to cases involving a physical action in 2010. By way of comparison, physical actions were only associated with 1%
of data loss in 2009’s combined caseload.

The third change in Physical is represented in Figure 27 by the increase in tampering (98%), and surveillance (17%), and the decrease
of theft (2%) as physical action types from previous years. Yet again, this was directly influenced by the amount of ATM and gas
pump skimming cases in our data set. According to USSS data, ATM skimming is increasing and is becoming more organized.

Skimmers can vary greatly in sophistication both in inconspicuousness and feature sets. A standard ATM skimmer is a reader
device designed to fit on top of a legitimate card slot. Both readers are able to read the data on the magnetic strip, and the
credit card number is stored on the skimmer device to be retrieved at a later date. Hidden cameras are often used in
conjunction with the capture device to collect PINs upon user entry. These cameras are affixed above the keypad and are
concealed by the use of incredibly clever camouflage. In many instances, they fit almost perfectly over the existing ATM shell,
and are disguised by means of using the same material and color as the original. In other cases, this is achieved by disguising
the camera as a sign on the ATM that features the bank logo, or the logos of the cards accepted by the ATM. Fake PIN pad
covers are another method of PIN capture, and have the advantage of not relying on a line of sight to the key pad. However,
these are potentially riskier for the criminals as they are larger, more expensive, and because they are touched by customers,
potentially more vulnerable to discovery. These fraudulent devices are attached by junior members of organizations in a
matter of seconds using strong adhesives.


                                                                  40
As stated above, ATM skimmers are found with varied levels in sophistication. This type of crime is carried out by gangs
 which possess a considerable amount of organization. The techniques used to reduce the chances of discovering the
 fact that they have tampered with the machines begins with molds and overlays that mimic the existing card reader in
 shape, and perhaps more importantly, color and material. Even the most basic skimmers are not generic, but designed
 for specific ATM models in the same manner that mobile phone cases are manufactured for specific models. Better fit
 equates to less deviation from a non-altered device, and, therefore, less potential for scrutiny.

 The technology behind the skimmer is also becoming increasingly sophisticated. The more basic devices feature a
 built-in storage component for the magnetic stripe and PIN data. The payment card data resides on the skimmers until
 retrieved by a second visit from the criminal to detach the skimmer device. Advances in data exfiltration techniques
 have included the use of Bluetooth technology within the skimmer to allow for wireless retrieval within a finite
 proximity. This, of course, reduces the risk of apprehension when attempting to retrieve the device, which may occur if
 the skimmer is discovered. Additionally, it allows the possibility of collecting data at various intervals, so if a device is
 removed by a bank employee or law enforcement not all of the captured data is lost. The latest evolution in data
 retrieval is the use of technology, again embedded in the skimmer, that utilizes GSM standards and will text captured
                                                       data in real-time to the criminal’s cell phone. The correlation
      ATM and gas pump skimming is                     between data capture and criminal possession is streamlined from
      conducted largely by organized                   a one-time retrieval, to scheduled collections at the criminal’s
                                                       convenience, to an instantaneous event. The required proximity of
 criminal groups and one “spree” can                   the criminal collecting captured data increases exponentially from
    target 50 to 100 different business                required local physical access, to close proximity, to virtually
                                                       anywhere.
   locations. These attacks have been
                                                       The cases involving payment card capture at “Pay at the Pump”
 occurring for years, but are on rise in
                                                       terminals have featured different attributes than ATM skimming.
 many areas according to both public                   Access to the inside of the gas pump and the card reader hardware
reports and the caseload of the USSS.                  is achieved by using a master key to unlock the front of the device.
                                                       Devices are placed inline between the card reader and the
 remaining hardware. The data is not captured by a magnetic strip read, but from the communication of payment card
 data from the reader to the embedded POS terminal. There is no trace of tampering from the outside of the gas pump
 and Bluetooth transmission is typically utilized for retrieval of data. Gas pump skimming was more common in our
 caseload than cases involving ATM assets; however the number of records lost is considerably lower.

 Our caseload shows that ATMs and gas pumps are the most common assets targeted in skimming attacks, but they are
 not the only ones. The USSS has investigated cases in which card readers, designed as physical access control
 mechanisms to enclosed ATM locations (typically attached to banks and utilized for after-hours customers), have been
 tampered with for the same intent as the ATM card readers. Point-of-Sale (POS) terminals have been targeted in
 sophisticated tampering cases in which the devices are replaced with “new” devices redesigned to capture and store
 payment card data as it is passed from the swipe reader to the terminal for legitimate processing. The capture and
 exfiltration methods are similar to the gas pump skimmers, completely hidden inside the PED device and remote data
 collection. Criminals have even incorporated social engineering methods, such as dressing in uniforms and identifying
 themselves as technicians employed by the POS manufacturer. Upon arrival at the location, they inform staff that they
 are replacing devices for scheduled maintenance and switch the legitimate devices for devices they control. The
 majority of physical actions took place at the victim location in an outdoor area where, as one would expect, all gas
 pumps and most ATMs are located.


                                                              41
Error (<1% of breaches, <1% of records)
In VERIS, we define error as anything done (or left undone) incorrectly or inadvertently. This includes omissions, misconfigurations,
programming errors, trips and spills, malfunctions, etc. It is not hard to imagine that something befitting this broad definition
could be identified in nearly every incident scenario. When examining and classifying an incident, we are primarily concerned
with identifying critical errors that were either the primary cause of the incident or a significant contributing factor.

Making the determination of whether an error is “significant enough” to
be included in the event chain isn’t always easy. Because of this, last year        Table 11 . Types of causal and contributory errors
                                                                                    by number of breaches
we focused solely on presenting error when it was the primary cause of
the breach, which is usually easily discernible. An example of error as a                                   Causal     Contributory
primary cause would be if a company accidentally left confidential
                                                                                     Disposal error            1             0
information on an asset that was then donated to a charitable
                                                                                     Publishing error          1             0
organization. If it were never known whether or not the information was
accessed, this would be a “possession” loss. If that organization accessed           Omission                  0            192

the information or gave it to another one that did (let’s assume they did            Programming error         0            16
so innocently), it would be a “confidentiality” loss. In either case, the error
                                                                                     Misconfiguration          0            10
was the primary cause of exposure.
                                                                                     General user error        0             1
Error as a primary cause has historically been rare among our data
compromise cases, and 2010 is no exception (but this would undoubtedly
be different if this report focused on availability losses). Error was
identified as the primary cause of only two incidents out of the total population of 761 breaches investigated. These are shown
in Table 11 and included one disposal error involving a device that was repurposed, supposedly wiped, and then given to
another company. However, the receiving company (very nicely) reported that it still contained sensitive information. The
publishing error occurred when non-public information was accidentally posted to a public website.

This year, we include errors identified as a contributing factor to give a broader view of their role in data breaches. An error is a
contributing factor if it creates a condition that—if/when acted upon by another agent—allows the primary chain of events to
progress. Such errors occurred quite often in breaches in 2010 and are listed in the second column of Table 11. In reviewing
contributing errors, it is difficult not to notice the overwhelming representation of omission in the data set. Omission refers to
something not done that, according to policy and/or standard operating procedures, should have been done. Within the
Verizon and USSS caseload, a frequent example of this (especially in the retail and hospitality industry) is the failure to change
default credentials. This was most commonly linked to inadequate processes on the part of the victim to validate that things get
done properly and consistently. A dash of misconfigurations (an active mistake rather than a passive one like omissions) and
programming errors (often linked to flaws in custom web apps) populate Table 11 as well.

Environmental (0% of breaches, 0% of records)
This category not only includes natural events like earthquakes and floods but also hazards associated with the immediate
environment (or infrastructure) in which assets are located. The latter encompasses power failures, electrical interference, pipe
leaks, and atmospheric conditions. Nothing in this category contributed to data breaches in either the Verizon or USSS caseloads
in 2010. Although environmental hazards most often affect the attribute of availability, they can occasionally factor into scenarios
resulting in the loss of confidentiality as well. We have, for instance, investigated incidents in the past in which a power outage
led to a device rebooting without any of the previously-configured security settings in place. An intruder took advantage of this
window of opportunity, infiltrated the network, and compromised sensitive data. Such events are not common but are worth
some consideration.


                                                                   42
Assets and Attributes
In prior versions of this report, we focused primarily on assets from which data was stolen during a breach scenario. There is nothing
wrong with this approach, but it does exclude certain assets that serve various initial and intermediate purposes prior to the point
of compromise. We have elected to include all assets identified in the event chain for this 2011 DBIR. Also, past DBIRs have not
broken out the security attributes of those assets that are negatively impacted other than the obvious, confidentiality, which is in
scope for them all (it’s a report on data breaches). This year, we’ve added a brief tally of results pertaining to all six attributes.


Figure 28 . Categories of affected assets by percent of breaches                  Asset types
and percent of records
                                                                                  In the combined Verizon/USSS data set for 2010,
                                                                                  servers edged out user devices to maintain the top
                  Servers                                   57% / 76%
                                                                                  spot as the class of assets most often involved in a data
           User Devices                                     56% (!) / 22% (!)     breach. They are still associated with the majority of
            Offline Data         12% / 1%                                         data loss, though it’s now more of a true majority in
                  People        10% / <1%                                         Figure 28 than a super landslide majority like in

                Networks    2% / <1%
                                                                                  previous years. Within the servers category, POS,
                                                                                  database, and web servers were observed most often.
                                                                                  If we focus solely on Verizon’s caseload, a feeling of
nostalgia sets in and we once again see ratios more in line with previous DBIRs. Drilling down further in the Verizon data, we see that
servers accounted for 80% of breaches and 95% of compromised records, with POS and web servers leading both metrics.

The margin between servers and end-user devices has been shrinking over the last few years (at least with respect to percentage
of breaches). Though workstations, laptops, and mobile devices fall within this category, they are not responsible for these gains.
That credit goes to devices like POS terminals (not back-of-store servers), “pay at the pump” terminals, and ATMs (detailed
breakdown in Table 12). This is an interesting trend, one driven by both functionality—the ability to accept financial transactions—
and convenience—openness to public use. That combination makes them both attractive and accessible to a wide array of
criminals, who tend to “follow the easy money.” An interesting outcome of this trend is the relative size of breaches. In the 2010
caseload, for the first time, we saw no breaches involving a million or more records.

The offline data category was off its record mark of 25% set in 2009, showing a rather steep 13% drop. Last year, we associated
the large increase in offline data with the larger proportion of insider theft in the USSS dataset (insiders take data from documents,
media, or whatever else is within reach). Therefore, it is not a stretch to do the reverse and attribute the drop in this category to
the lower proportion of internal agents observed in 2010.


Figure 29 . Percent of records compromised from online assets

         100%                                                                        99%
                                                                                                          98%

                                                                        89%
          90%

                                       80%
          80%
                                                     81%                                                                 76%
                     73%

          70%


          60%

                     2004           2005             2006               2007          2008            2009             2010


                                                                        43
The risk of mobile computing is a topic that Verizon’s RISK team continues to receive questions about. Both smartphones and
tablets have experienced phenomenal growth and equally phenomenal mind share in the past few years, and our clients
frequently ask us for recommendations around policies, processes, and controls for this class of assets. While we acknowledge
the growth of mobile computing and the increasing attractiveness of the platform to potential threats, we also must
acknowledge that again this year we have no representation of smartphones or tablets as the source of a data breach.

                                        While we acknowledge the growth of mobile computing and the
                                    increasing attractiveness of the platform to potential threats, we also
                                    must acknowledge that again this year we have no representation of
                                                   smartphones or tablets as the source of a data breach.

Table 12 . Types of compromised assets by percent of breaches and percent of records*


Type                                            Category                                      % of Breaches                       % of Records
POS server (store controller)                   Servers                                           36% (!)                             28% (!)

POS terminal                                    User Devices                                      21% (!)                             13% (!)

Pay at the pump terminal                        User Devices                                      18% (!)                              <1%

Database server                                 Servers                                             14%                               15% (!)

Web app/server                                  Servers                                             9%                                 24%

Regular employee/end-user                       People                                              8%                                  0%

Automated teller machine (ATM)                  User Devices                                        8%                                  9%

Desktop/workstation                             User Devices                                        8%                                  0%

Payment card (credit, debit, etc)               Offline Data                                        7%                                  1%

File server                                     Servers                                             4%                                 <1%

Documents                                       Offline Data                                        4%                                 <1%

Finance/accounting staff                        People                                              4%                                  0%

Human resources staff                           People                                              3%                                  0%

Directory server (LDAP, AD)                     Servers                                             1%                                  0%

Physical security system (e.g., badge reader)   Networks                                            1%                                  0%

Mail server                                     Servers                                             1%                                  0%

Payment switch/gateway                          Servers                                             1%                                 10%

Remote access server                            Servers                                             1%                                  0%

Customer (B2C)                                  People                                              1%                                 <1%

Executive/upper management                      People                                              1%                                  0%

Unknown                                         Unknown                                             1%                                  1%


                                                           *Only assets involved in greater than 1% of breaches or greater than 1% of records shown


                                                                          44
Figure 30 . Distribution of operating systems by percent of affected assets*                  Operating Systems
      85%              10%                4%            1%                  <1%               One of the most frequent requests we’ve
                                                                                              heard over the past few years is for data on
                                                                                              the operating systems of compromised
                                                                                              assets. We’ve included that information in
   Windows            Linux               Unix        Mac OS X         Mainframe              Figure 30 this year, trusting our readers will
                                                                                              refrain from using it in “OS holy wars.”
                                                              * Verizon caseload only
                                                                                              We broke out OS categories into Linux, UNIX,
                                                                                              Mac OS X (yes, we know this is UNIX, but it’s
worth treating as a special case), Windows, and Mainframe. It might be tempting to focus on the fact that 85% of breached
assets run Microsoft Windows, but it is important to note that the attacks used against these systems have little to do with
OS vulnerabilities; it’s not exactly rocket science to breach a system using default or easily guessable credentials. Also, the
Verizon/USSS data generally mimics the market share representation we see from various industry analysts and publications,
leading us to believe that as far as OS preference is concerned, threat agents are generally agnostic.

            One of the most frequent requests we’ve heard over the past few years is for data on
            the operating systems of compromised assets. We’ve included that information this
                           year, trusting our readers will refrain from using it in “OS holy wars.”
Hosting and Management
Given the industry’s hyper-focus on cloud computing, we do our best to track relevant details during breach investigations and
subsequent analysis. As stated earlier in this report, we have yet to see a breach involving a successful attack against the
hypervisor. On the other hand, we constantly see breaches involving hosted systems, outsourced management, rogue vendors,
and even VMs (though the attack vectors have nothing to do with it being a VM or not). In other words, it’s more about giving
up control of our assets and data (and not controlling the associated risk) than any technology specific to The Cloud.

With that in mind, Figures 31 and 32 depict the location and management of the assets discussed in this section. Most assets
                                                                                                 encountered              during        Verizon’s
Figure 31 . Location/Hosting of                  Figure 32 . Management of                       investigations were hosted internally, but
assets by percent of breaches*                   assets by percent of breaches*                  half were fully or partly managed by a third
 2%             Unknown                          2%                Unknown                       party.   Overall,        both     hosting   and
       6%       N/A                                      5%        N/A
 1%             Mobile                                                                           management were a little more likely to be
       6%       Co-Located
                                                        16%        Co-Managed                    handled by external parties in 2010
       14%      External
                                                                                                 compared to prior years. The question of
                                                                                                 whether these variables contributes to the
                                                        34%        External                      susceptibility of assets to compromise is
                                                                                                 difficult to answer from these results, but
                                                                                                 worth     pondering        nevertheless.    The
       76%      Internal                                                                         combination         of     outsourcing      plus
                                                                                                 indifference   and/or       negligence      with
                                                         48%       Internal
                                                                                                 respect to vendor management—which is
                                                                                                 seen more often than you might think—is
                                                                                                 almost certainly a contributor.

                * Verizon caseload only                             * Verizon caseload only


                                                                       45
In other words, it’s more about giving up control of our
                                                        assets and data (and not controlling the associated risk)
                                                                     than any technology specific to The Cloud.

Security Attributes
Security attributes are exactly what they sound like they are: attributes that describe or pertain to the security of an
information asset. A security incident negatively affects one or more of these attributes. VERIS uses six primary security
attributes: Confidentiality, Possession or Control, Integrity, Authenticity, Availability, and Utility (also known as the
Parkerian Hexad). Table 13 shows how often each of these attributes was affected during breaches investigated
in 2010.


Table 13 . Security attributes affected by percent of breaches


 Attributes affected   Definition                                                                 Breaches
 Confidentiality       Limited access, observation, and disclosure                                 100%

 Possession            Exclusive (or intended) possession and control (and ability to prove it)     0%

 Integrity             Complete and unchanged from original state                                   90%

 Authenticity          Validity, conformance, and genuineness                                       5%

 Availability          Present and ready for use when needed                                        1%

 Utility               Usefulness or fitness for a purpose                                          0%


News flash: 100% of all data breaches compromise the confidentiality of information assets. Q.E.D. Moving on. The fact
that integrity is involved in 90% of breaches may come as a surprise to some, but consider how many events occur during
a breach that can introduce unauthorized changes to a system. The installation of malware alone explains over half of that
number (all malware changes the original state of the system), and we haven’t even scratched the surface of what
intruders typically do once they own a system. Values drop way off after integrity. Examples of events affecting the
authenticity of assets are swapping a legit device for a phony one and initiating fraudulent transactions. The latter could
drive this attribute much higher, but our focus in the investigation is on how data was compromised rather than, for
instance, what criminals did with it afterwards (which often involves fraud of various kinds). Availability isn’t the main goal
for attackers interested in breaching data, but it is occasionally a casualty of war. For example, malware can bog down a
system even if doing so wasn’t its primary function. We did investigate an incident affecting the utility of information in
2010, but it was not a breach and thus not represented here (a terminated admin encrypted some data and tried to extort
his former employer). Possession losses aren’t represented because if we could not confirm actual compromise of data,
the case would not be included in this report.


                                                                       46
Compromised Data
3.8 million records confirmed stolen in 2010. Compared to totals for the past few years, that’s basically a rounding error. That is
in no way intended to make light of the situation; as those affected by breaches discussed in this report know all too well, it’s still
3.8 million too many. The fact of the matter remains, however, that 3.8 million is a lot less than 360.8 million or 143.6 million, and
one is left wondering what in the world is going on.


Figure 33 . Number of records compromised per year
in breaches investigated by Verizon and the USSS (!)                          360,834,871


                                                            171,077,984

                                                                                                 143,643,022
                                          124,235,000
                        104,321,000


      11,488,000
                                                                                                                    3,878,370
         2004              2005              2006               2007              2008              2009               2010


                               3.8 million records confirmed stolen in 2010. Compared to totals for
                                the past few years, that’s basically a rounding error, and one is left
                                                          wondering what in the world is going on.

We’ve touched on various potential explanations for this trend throughout this report, but we’d like to explore these again and
offer some others in this section. Before engaging in speculation, though, let’s make sure we have our facts straight concerning
compromised data in the combined Verizon-USSS 2010 caseload. Table 14 is a good place to start.

Perhaps more so than anything else we could provide, Table 14 demonstrates the unique character of 2010 in terms of data loss.
Not only is there a huge disparity in the annual totals, but the mean, median, and percentiles are profoundly different. The mean
is down from 2 million records per breach to below 7,000. Before you attribute this to the “flaw of averages,” note that the median
is also a fraction of its former value. From 2004 through 2009, 13% of all breaches featured losses of over 1 million records. By
contrast, there was not a single incident in 2010 that broke that threshold; over 93% of them were smaller than 10,000 records.


                                                                  47
Table 14 . Descriptive statistics on records compromised, 2004-2010 (!)                                             With the descriptive statistics out of the way,
                                                                                                                    let’s switch modes and talk about what they
                                  2004-2009                 2010             All-Time ('04-'10)                     mean (sorry, lame statistician’s joke). And
 Total records                   915,599,877              3,878,370              919,478,247                        while we’re at it, let’s also talk about what
                                                                                                                    they probably don’t mean. We’ll do that first,
 Mean                              1,963,230                6,687                   878,850
                                                                                                                    in fact.
 Median                              20,000                  221                      775

 Standard deviation               13,141,644               32,854                  8,868,990                        Why the drop in records?

 Percentiles
                                                                                                                    The most obvious hypothesis we can easily
                                                                                                                    disprove is that the drop in data loss
            10th                        12                     8                       10
                                                                                                                    corresponds to a drop in breaches. The
            25th                       360                    10                       40                           opposite is true. The 2010 dataset has more
            50th                     20,000                  221                      775                           breaches than ever before, but fewer
                                                                                                                    compromised records.
            75th                    200,000                 2,401                    19,221
                                                                                                                    Another explanation that doesn’t seem to
            90th                   1,200,001                4,826                   250,000
                                                                                                                    hold water is that we (Verizon or the USSS)
            99th                  60,720,000               157,695                10,000,001
                                                                                                                    simply didn’t work the big cases like we have
                                                                                                                    in the past. As mentioned in the Year in
                                                                                                                    Review section, other public sources of
breach statistics also show dramatic declines in the number of compromised and exposed records in 2010. The year also lacked
(as far as we know, at least) the headline-grabbing mega breaches that tend to drive up data loss so quickly. These external data
points suggest that something other than sheer caseload bias is at work.

It is worth mentioning that 3.8 million is actually a low-end estimate; we were unable to quantify data losses in almost a quarter
of all cases and other times could confirm only a portion of the total amount10. Still, increasing 3.8 million by 25% doesn’t change
matters in the least. It is possible that one of those unknown quantities was actually a mega breach, but we think not. None
exhibited the typical signs that accompany large data compromises we have worked in the past.

                                      Our leading hypothesis is that the successful identification, prosecution,
                                      and incarceration of the perpetrators of many of the largest breaches in
                                                                      recent history is having a positive effect.
Cynics might argue that cybercriminals were just as active and successful in 2010, yet the breaches were never discovered. This
isn’t a stretch if you are familiar with the poor discovery-related findings we typically share in this report. However, this would
stipulate that criminals are either not using the stolen data or have found a means of bypassing Common Point of Purchase
(CPP) and other fraud detection mechanisms. CPP, however, remains the most frequent discovery method.

An optimist may interpret these results as a sign that the security industry is WINNING! Sorry, Charlie; while we’d really like that
to be the case, one year just isn’t enough time for such a wholesale improvement in security practices necessary cut data loss so
drastically. Plus, keep in mind that the number of incidents increased substantially (both in our caseload and those
publicly reported).


10 There are many reasons why ascertaining the full and exact amount of data stolen can be difficult. Some victims lack sufficient logs. Some destroy this information in trying to
   respond to or contain the breach. Many attackers disguise, encrypt, erase, or otherwise make it difficult to access data in order to “count records.”


                                                                                        48
Now let’s turn to some explanations that do seem plausible. Our leading hypothesis is that the successful identification,
prosecution, and incarceration of the perpetrators of many of the largest breaches in recent history is having a positive effect. If
you consider that a rather small number individuals were tied to a disproportionately large number of breaches and/or breached
records, then you begin to get the sense that taking a few of them out could make a huge difference.

A corollary of the above is that the “second tier” of the criminal community has effectively been deterred from engaging in high-
profile activity. Pulling off a huge heist might achieve fame and fortune, but it also attracts a lot of unwanted attention. Those
that wish to stay out of jail may have changed their goals and tactics to stay under the radar. This could be one of the chief
reasons behind the rash of “mini breaches” involving smaller organizations.

It is also possible that the talent pool is shallower than expected. Knocking off the kingpins could have precipitated a brain drain
                                                           of sorts in certain skillsets. We have circumstantial evidence of this, but
    The focus may continue to shift                        nothing concrete. For instance, a drop in certain techniques used by
   in the future from payment card                         certain criminals correlates with their arrest. But correlation, of course, is
                                                           not causation. It is also interesting that we consistently have a significant
 numbers to other data types, such
                                                           portion of our caseload that ties back to the same individuals or groups.
    as bank account data, personal                         If the attacker population were enormous, we wouldn’t expect to see
 information, and even intellectual                        that in our sample year after year.

     property (more on this below).                        In addition to arrests, law enforcement has been busy infiltrating black
                                                           markets and other dark corners of the Internet where criminals
These are not as flashy in the sheer                       congregate, cogitate, and negotiate. Their presence is known and
number of records lost, but can still                      stresses the tentative trust among thieves that exists in such communities.
                                                           This could disrupt the underground economy and account for some of
        be lucrative to the criminal.
                                                           what we’re seeing.

In the 2009 DBIR, we speculated that the flooding of the black market with millions and millions of stolen data records could
drive the price so low that releasing more would be disadvantageous. Criminals might opt to let the markets clear before
stealing more in bulk or selling what they already had. We could be in such a holding pattern now.

Furthermore, we have seen the scenario of large breaches and subsequent selling of card data on black markets replaced with
smaller captures and the direct use of the information for profit (recoding cards and making fraudulent ATM withdrawals). In
other words, the people behind the breaches are no longer becoming wholesalers after they capture the credit card information.

The focus may continue to shift in the future from payment card numbers to other data types, such as bank account data,
personal information, and even intellectual property (more on this below). These are not as flashy in the sheer number of records
lost, but can still be lucrative to the criminal. A single business’s bank account information, for instance, can result in a sizable loss
of money to the victim in the form of fraudulent transfer or withdrawal of funds.

Types of data compromised
When reviewing Table 15 for details regarding types of data compromised during breaches in the past year, results show that
payment card data maintains its predominance across the combined caseload. The 24% increase from 2009 is directly attributable
the large multi-victim cases worked by the USSS, which all had payment cards as the primary target (POS, gas pumps, ATMs, etc.).
Separating out Verizon’s 94 cases yields results that look more in line with the previous year’s ratios. Payment cards are desirable
to certain types of financially-motivated criminals because there are numerous established options for converting them to cash.


                                                                   49
Authentication credentials were nabbed in              Table 15 . Compromised data types by number and percent of breaches
                                                        and percent of records
 45% of incidents in 2010, boosting it to the
 second most compromised data type. Stolen
                                                                                              Number of       Percent of     Percent of
 credentials are most often a means to an end                                                  incidents      incidents       records
 but are increasingly an end in and of
                                                          Payment card numbers/data               593            78%            96%
 themselves. They can be used to further an
                                                          Authentication credentials              339            45%             3%
 attack by gaining privileged and persistent              (usernames, pwds, etc)

 access into the victim’s environment. There is           Personal Information
                                                          (Name, SS#, Addr, etc)
                                                                                                  111            15%             1%
 also a growing market for offloading stolen
 credentials directly by selling or renting               Sensitive organizational data            81            11%             0%
                                                          (reports, plans, etc)
 access to organizations (especially high
                                                          Bank account numbers/data                64            8%             <1%
 profile ones). That authentication credentials
                                                          Intellectual property                    41            5%             <1%
 represent such a low proportion of records
 shouldn’t be surprising; a lot of damage can             System information                       41            5%          unknown
                                                          (config, svcs, sw, etc)
 be done with just one valid account in the
                                                          Classified information                   20            3%          unknown
 wrong hands.
                                                          Medical records                          4             1%          unknown
 Other data types associated with fraud-for-
 profit activities are personal information and           Unknown                                  7             1%              0%

 bank account data. Only one or two breaches
 involved a substantial amount of records for
 either of these. For various reasons, quantifying an exact number was difficult in many instances, contributing to the lower
 percentage of data loss shown in Table 15. Not captured in the chart are the hundreds of millions of dollars lost through
 fraudulent access to compromised bank accounts, identity theft, and other downstream crimes committed with this data.

 Sensitive organizational data, intellectual property, and classified information still comprise a small proportion of compromised
 data when compared more cashable forms of data. However, that the ratios remained similar to previous years even in the
 face of huge gains in the number of smaller payment card breaches implies significant growth among these data types as
 well. At a glance, this appears to concur with recent speculation that payment cards are passé and that IP is the new goal of
 cybercriminals. This may well be true, but it’s a little too early to dub it a trend based on case evidence alone. Then again, it is
                                                                  noteworthy that the number of breaches involving such data has
Authentication credentials were nabbed                            never been higher in our caseload. It also should be noted that
                                                                  the real rate of theft for IP and classified information is likely higher
  in 45% of incidents in 2010, boosting it
                                                                  than any sources (including ours) show. Since fraud detection
  to the second most compromised data                             (e.g., CPP) is the most effective means of discovering a breach and
type. Stolen credentials are most often a                         since IP isn’t used for financial fraud, then it stands to reason that
                                                                  thieves could pilfer IP freely without being discovered. This is not
means to an end but are increasingly an
                                                                  a comforting thought, but we’ll leave you with it anyway.
                end in and of themselves.


                                                                       50
Attack Difficulty                                                                                                                       Figure 34 . Attack difficulty by percent
                                                                                                                                        of breaches and percent of records*
As we have pointed out in previous reports, skilled threat agents—especially well
organized groups of them—can breach any single organization they choose given                                                                     8%
                                                                                                                                                             High
                                                                                                                                                (18%)(!)
enough time, resources and inclination. They cannot, however, breach all
organizations. Therefore, unless the perceived benefit is inordinately high, it is not
optimal for him to expend his limited resources on a difficult target while an easier
one is available.
                                                                                                                                                  49%        Moderate
Rating the relative difficulty of the attacks we observe during investigations admittedly
involves some degree of subjectivity, but it is still a useful indicator of the level of effort
and expense required to breach corporate assets. It also provides better understanding
of the criminals that are responsible for these crimes and what defensive measures
organizations should take to protect themselves.

Our investigators11 assess the various details around the attack and then classify it
according to the following difficulty levels:
                                                                                                                                                  37%        Low
y None: No special skills or resources required. The average user could have
   done it.
y Low: Basic methods, no customization, and/or low resources required.
   Automated tools and script kiddies.
                                                                                                                                                  6%         None
y Moderate: Skilled techniques, some customization, and/or significant
   resources required.                                                                                                                                         * Verizon caseload only
y High: Advanced skills, significant customization, and/or extensive
   resources required.

Over the past few years, the percentage of highly difficult attacks has hovered somewhere in the mid-teens. Per Figure 34,
analysis of our 2010 caseload puts that statistic at 8%, which is the lowest figure among prior DBIRs. This is an interesting
finding and poses some interpretive difficulties. The fact that this pertains to Verizon’s caseload only (94 confirmed breaches),
rules out the USSS’ huge increase in sample size (which included many smaller and softer targets) as a possible explanation.
This seems to be a genuine shift (albeit not a dramatic one) away from highly difficult attacks in the past year.

An important observation is that this shift is more from “High” to “Moderate” than from “High or Moderate” to “Low or None”. The
sum of the top two difficulty levels in 2010 (57%) is basically the same as 2009 (59%) and higher than 2008 (48%) and years prior
(45%). Therefore, we cannot conclude that organizations are increasingly falling prey to simple attacks.

Another point to consider is that investigators noticed a higher proportion of automation with respect to attack methods in
2010. Those that once required some human finesse and guidance became a little more “fire and forget” and thus more
accessible to lesser-skilled assailants. Such attacks still have the same degree of effectiveness, but are not as difficult to pull off
(which is not a trend we want to see continue).

In our last two reports, the overwhelming majority of records compromised were associated with highly difficult attacks (~90%).
In 2010, however, this statistic dropped to a comparably scant 18%. At the risk of sounding like a broken record (get it?), the
much fewer records stolen overall and absence of “mega breaches” is the most likely factor. Most of the largest breaches have
historically utilized more sophisticated attacks.


11 Attack difficulty is not a part of the VERIS framework, and therefore, is not a data point collected by organizations partnering with us for this report. As a result, statistics in this
   section pertain only to Verizon’s 2010 caseload.


                                                                                             51
As has been true in the past, the more difficult parts of the attack sequence typically pertain to malware rather than the method
of intrusion (Hacking). Thus, our recommendation for prevention is still to focus on the front end. 90% of attacks are not highly
sophisticated, and the method of intrusion is relatively straightforward in most cases. Implement, double, and triple-check the
basics so that attackers are not granted a foothold from which to exploit your systems.


Attack Targeting
                                                                                             Figure 35 . Attack targeting by percent
Standard convention in the security industry classifies attacks into two broad               of breaches and percent of records*

categories: opportunistic and targeted. In past DBIRs, we further separated
opportunistic attacks into two subgroups, random and directed. We found it was                            17%
                                                                                                        (21%)(!)
getting increasingly difficult to reliably distinguish the two subgroups hence we                      Targeted
merged them back into a single category (i.e., the contrast between levels of
opportunity is less important than the contrast between targeted and
opportunistic). The updated definitions are provided below:                                                     83%
                                                                                                             Opportunistic
Opportunistic Attacks: The victim was identified because they exhibited a
weakness or vulnerability that the attacker(s) could exploit. The exact manner by
which this flaw was identified is immaterial; the point is that the victim became a
                                                                                                                   * Verizon caseload only
target primarily because of an opportunity.

Targeted Attacks: The victim was first chosen as the target and then the attacker(s)
determined a way to exploit them. This doesn’t necessarily mean that a weakness or vulnerability wasn’t exploited to accomplish
this; it simply means that opportunity is not the primary reason for the attack.

Based on data collected by Verizon’s IR team in 2010, the ratio of targeted to opportunistic attacks shown in Figure 35 remained
similar to previous years. The percentage of targeted attacks hovered in the high 20% range for 2008 and 2009 whereas it inched
down a few notches to 17% in 2010 (not a significant statistical change). The financial industry continued to experience a higher
rate of targeted attacks. The hospitality sectors (followed closely by the retail industry) were the highest victims of opportunistic
attacks. This was largely due to widespread knowledge in the criminal community about default credentials used for various
types of POS systems. Interestingly, more than half of all opportunistic attacks involved malware infections or hacking, some of
which included installation of RAM scrapers, keyloggers and/or backdoors on POS terminals and servers.

One finding that did constitute a significant change in 2010 was a sharp drop in the percentage of total records compromised
from targeted attacks. They accounted for 21% of records compromised compared to 89% and 90% for 2009 and 2008,
respectively. As with attack difficulty, this is mainly due to an absence of any mega-breaches in 2010, almost all of which have
been targeted in nature. Instead, we saw more targeted attacks at specific types of data that aren’t typically stolen in bulk, like
various types of sensitive organizational data and intellectual property. While this aspect may be in line with much of this year’s
media buzz around Aurora, APT, Stuxnet, and other highly targeted attacks, the general rule of thumb remains the same: Some
organizations will be a target regardless of what they do, but most become a target because of what they do (or don’t do).


          The general rule of thumb remains the same: Some organizations will be a target
           regardless of what they do, but most become a target because of what they do
                                                                           (or don’t do).


                                                                 52
Thus, our previous recommendation remains unchanged in that one of the fundamental self-assessments every organization
should undertake is to determine whether they are a Target of Opportunity or a Target of Choice. Those in the former category
should consistently seek to identify and remove opportunities to avoid needlessly attracting foes. Those in the latter category
should expect sophisticated attacks directed from skilled and determined adversaries. They should also expect the cost of
control to be much higher. However, remember that even Targets of Choice can fall to opportunistic attacks. Seasoned criminals
are not usually dumb and rarely work harder than necessary. Defend against dragons if you must, but don’t watch the skies so
much that common rogues slip inside the castle walls from below.


Unknown Unknowns
Evidence from prior DBIRs has established a correlation between data breaches and the victim’s level of knowledge of their
environment and data flow. When an investigation uncovers such gaps in knowledge, we refer to them as “unknown unknowns”.
Common scenarios include:

y Assets unknown or unclaimed by the organization (or business                        Figure 36 . Unknown Unknowns by percent
                                                                                      of breaches and percent of records* (!)
  group affected)
                                                                                                             100%
y Data the organization did not know existed on a particular asset
                                                                                                             80%
                                                                                       Unknown Assets
y Assets that had unknown network connections or accessibility
                                                                                                             60%
y Assets that had unknown user accounts or privileges
                                                                                                             40%
2010 marks the first year in which both the percentage of breaches and
                                                                                                             20%
data loss associated with unknowns declined. Even with this substantial
                                                                                                              0%
drop, however, over a quarter of cases still involve one or more of the                                             2007   2008        2009      2010

conditions listed above. In addition to an overall downward trend, each
                                                                                                             100%
of the four types of unknowns individually showed a decline as well in
                                                                                                             80%
Figure 36. Reductions of unknown privileges and network connections
                                                                                       Unknown Data


                                                                                                             60%
were the most notable changes.
                                                                                                             40%
We cited several reasons for these falling numbers in the 2010 DBIR, and
                                                                                                             20%
those reasons are still relevant this year. While we cannot empirically prove
                                                                                                              0%
it to be the case, we certainly hope that organizations are becoming more                                           2007   2008        2009      2010

aware of their computing environment and where data resides within it.
                                                                                                             100%
Another year of compliance regulations under companies’ belts may be
                                                                                       Unknown Connections


                                                                                                             80%
helping to improve matters somewhat. There is no doubt that we
                                                                                                             60%
encounter fewer POS systems, for instance, that store unencrypted data
                                                                                                             40%
locally in violation of PCI DSS. Mandated network scanning—and, more
                                                                                                             20%
importantly, the increased scrutiny that follows in order to clear flagged
                                                                                                              0%
anomalies—can uncover all kinds of unexpected devices, configurations,                                              2007   2008        2009      2010
services, ports, etc. before they contribute to your next breach.
                                                                                                             100%
While such actions taken by organizations may provide a partial explanation
                                                                                       Unknown Privileges


                                                                                                             80%
for what we’re seeing, our gut tells us that a shift in criminal tactics is the key
                                                                                                             60%
factor in this decline. Growing utilization of malware to capture data in-
                                                                                                             40%
transit, in memory, from user activity, and from system processes reduces the
                                                                                                             20%
reliance on unknowns in order to successfully compromise data. Why search
                                                                                                              0%
for data accidentally stored in the clear on some chance system when you                                            2007   2008        2009      2010
can capture exactly the data you want from the system of your choosing?
                                                                                                                                  * Verizon caseload only


                                                                      53
Instead of hunting for a user account with sufficient privileges, why not just use a keylogger or form-grabber to steal credentials
for one that you know will suit your needs? Such methods become evermore commonplace and we believe this results in
unknown unknowns being less prevalent across our caseload.

Not only were unknowns less prevalent, but the
amount of data compromised during breaches in                      2010 marks the first year in which both the
which they were a factor also realized a sizable             percentage of breaches and data loss associated
decline. In 2009, unknowns were found in just under
                                                                 with unknowns declined. While such actions
half of all cases, but those cases comprised over 90%
of all data stolen. A recurring theme of the 2010               taken by organizations may provide a partial
caseload is the lack of “the big one”—a single breach       explanation for what we’re seeing, our gut tells us
resulting in multi-millions of records lost. In the past,
                                                              that a shift in criminal tactics is the key factor in
most of these mega-breaches involved one or more
unknowns at some point in the event chain. That fact,                                                 this decline.
combined with a lower amount of unknowns
observed in 2010, resulted in only 26% of data loss attributed to a case with one or more unknown conditions. The sharpest drop
occurred in “unknown privileges” and “unknown data,” both of which fell from around 90% of records lost to 26% and 21%
respectively in 2010.

While we are glad to see the drop in the prevalence and impact of unknown unknowns, we doubt that the underlying problem
that allows them to exist has truly been addressed. Organizations should continue to strive to improve asset management, user
account management, dataflow analysis, and other practices that improve visibility across information assets. These efforts are
essential to a risk management strategy and will almost certainly pay dividends in the long run.


Timespan of Attack
The timeline of an attack must be one of the least understood aspects of a data breach—and yet a good understanding of the
breach timeline can be of great importance for properly aligning defense and response mechanisms. We will again describe the
timeline of breach scenarios using three major phases. One could distinguish many more if desired, but we think this distinction
provides a clear overview and maps well to how incident response processes are typically organized. Figure 37 shows the
phases and associated percentages.

Point of entry to compromise
The first phase depicts the time between the first entry into the victim’s environment to the moment when the data is located
and compromised. To use a more physical-world analogy, this is the time between the moment when the attacker first has his
foot in the door and the moment when he’s walking out the door with your belongings. In a substantial number of cases, the
desired data is not stored on the system that is the first point of entry. In fact, multiple steps are often required to conduct
reconnaissance on the network, locate the correct systems, and setup mechanisms to exfiltrate the data from the network.

Roughly one-third of breaches in 2010 reveal a timespan of mere minutes between entry and compromise (about the same
as 2009). To build upon the analogy above, these are cases in which the loot is lying just beyond the front door—i.e., on the
same system that was the initial target of the entry.

Similar to previous years, we continue to observe that in over half of cases, an attacker needs a minimum of “days” to
successfully complete this stage of the attack. Within that range, however, timeframes shifted noticeably away from “weeks/
months/years” end of the spectrum and into the “days” category. This shift was mainly a byproduct of the higher proportion
of automated attacks within 2010 caseload.


                                                                54
Figure 37 . Timespan of events by percent of breaches

                                    Minutes            Hours             Days             Weeks            Months         Years/Never


   Point of Entry to Compromise


                                      33%                 14%           44% (!)           5% (!)            4% (!)           <1%


      Compromise to Discovery


                                      <1%                 4%             17%               38%              36%               5%


      Discovery to Containment


                                      <1%                 11%            23%              49% (!)           15%               2%


  There is an interesting difference here between the Verizon and the USSS caseload. The USSS cases show almost twice the
  proportion of the “days or less” grouping. This is explained when one considers the fact that in the USSS caseload, we see both
  a greater share of ATM skimming cases and a larger number of POS attacks against small merchants. The former cases do not
  require weeks of preparation, in fact, the attacker wants to install the skimmer as discretely and quickly as possible. Also, the
  latter involves attacks that can be automated in order to share the same successful approach (or password) across a multitude
  of victims.


Similar to previous years, we continue to observe that in over half of cases, an attacker
                 needs a minimum of “days” to successfully find and compromise data.

  As stated last year, a couple of days might not sound like a tremendously long time frame, but we’d like to counter this
  argument. When someone attacks your network for several days, it allows for a greater opportunity for detection before
  brains beat boxes and significant data loss occurs. We can and should take better advantage of that reprieve than we are now.

  Compromise to discovery
  In past years, our reports have shown that victims generally allow a breach to exist for weeks, months, and even years before realizing
  they’ve been had. 2010 in this regard looks similar, though there was some minor movement among the timeframes. “Weeks”
  appears to be the gainer, taking share away slightly from the leftmost categories. We’d much rather see a mass migration from the
  right, which would indicate an improvement in discovery capabilities.

  When contrasting the Verizon and USSS datasets in Figure 38, one striking difference is that the “months or more” range is
  notably higher for the Verizon cases than for those of the USSS. This is a rather curious result since the USSS investigates a higher
  percentage of smaller organizations, which presumably would have slower discovery times. Normally, this would be true, but
  the USSS often promptly notifies victims after discovering information (through various operations) about a successful breach.


                                                                55
Another factor at work is the large number of Pay-           Figure 38 . Percent of breaches that remain
                                                             undiscovered for months or more
at-the-Pump and ATM skimming cases worked by
the USSS. Whether by CPP, complaining
                                                               80%
customers, or observant users, such thefts tend to
                                                               70%
be discovered relatively quickly.                                                                                        Verizon
                                                               60%
If there is any cause for hope in these statistics,
it’s that for the fourth straight year we’ve seen a            50%

decrease in the percentage of breaches                         40%
extending months or longer before discovery                    30%
                                                                                                                           USSS

(65% to 50% to 44% to 41%). Verizon’s cases are
                                                               20%
still above 60% and consistent with prior years’
data, but at least overall numbers are headed in               10%

the right direction. Now if we could just get                   0%
them to accelerate.                                                    <2008             2008              2009               2010


Discovery to containment
Regardless of the timespan involved, once an organization realizes that they have been the victim of a breach, quick and
effective remediation should be their first objective. We should mention that containment is not defined as the phase in
which everything is back to normal, but rather when the data outflow has been stopped. To return to our now somewhat
wearied analogy, the door or window is closed and a temporary lock has been installed. However, it’s still a long way from a
restored operating environment.

Here, the combined dataset again shows a tendency to shift towards the center as compared to last year, with more breaches
taking weeks to contain. The higher proportion of smaller organizations that generally don’t have any incident response policy
or staff in place is an important contributor to this result. For these victims, the level of effort required to ultimately contain the
data breach is low, but the process from initial breach discovery to uncovering the breach methods and taking the necessary
steps to contain it is often beyond their capabilities. We have also noticed that a tendency exists for displacement of responsibilitiy
when small businesses are the victims of a data breach. Because they usually assume little responsibility for their IT functions,
they believe that the vendor who sold them the POS software or terminals holds the responsibility to take action. This may or
may not be the case, but the resultant confusion and ambiguity reinforces the fact that organizations of all sizes must have some
level of preparation around incident handling and response.

   To quote last year’s report: Proper Planning Prevents Poor Performance. This
  mantra can expedite the containment of incidents, while ensuring that actions
                                 taken preserve evidence for investigative needs.
To quote last year’s report: Proper Planning Prevents Poor Performance. This mantra can expedite the containment of incidents,
while ensuring that actions taken preserve evidence for investigative needs. This does not mean that organizations have to
practice complicated technical forensic procedures, but rather that they should think about responsibilities and chain of
command, define a “freeze point” at which they need to engage external consulting, and ensure practical matters like network
diagrams and contact details are up to date and available. Moreover, after the incident is contained, reviewing lessons learned
and applying those to future planning is essential.


                                                                  56
A COLLECTION OF IR GHOST STORIES
Investigating as many breach cases as we do, we encounter a myriad of different situations upon our arrival on scene . Some of
these are quite unique, but most are all too familiar variations on a common theme, a theme in which unpreparedness, panic,
and the blame game play a major role . While these repetitious occurrences can be frustrating to investigators in the field,
they do serve to provide us with opportunities to illustrate to our readers things to avoid during a breach event . We hope
these ‘ghost stories’ will provide the reader with a bit of insight into common problems encountered . For instance, we often
see the shade of “DIY” in victim organizations . The scenario plays out like this: a breach has been discovered, the IT and
security staff try to solve the problem but lack the required training and procedures to do so . The weekend is fast approaching,
and management begins to panic . It’s often at this precise moment, typically late Friday afternoon, that we get the call:
“We think we have a problem and we have worked on it for the past couple of days—but can you please come and help us
out?” Of course, by now precious time is lost and the well-intended actions of the in-house group have complicated the
investigation or even spoiled the evidence . While it isn’t crucial that every part of an incident response is outsourced, it is
vital that the limitations of the internal group’s knowledge and skillset be known, and a proper escalation path be in place .
Once we do finally arrive onsite, one of the first things we ask for is a network diagram of the involved systems . Typically,
this elicits a response such as: “Well, we have one, but it’s a little bit outdated . We have decommissioned a few systems, and
added a few new environments . Oh, and I meant to include the merger we did last year .” You get the idea . In these situations,
we have found that the fastest and most reliable method is to use the “consensus network diagram” . This involves getting
everyone with knowledge about the involved systems in a room, giving them a whiteboard and a marker, and asking them to
start drawing . It takes a little while, but after everyone provides input there is generally a reasonably usable diagram on the
board . This sounds like a simple or even a pleasant exercise, but when you remember that meanwhile valuable data is still
leaking from the company, and the frantic CEO is demanding updates . In hindsight, it might have been preferable to have
done some of this work beforehand .
Another specter that frequently rears its ugly head is that of the disappearing backup . Theoretically, backups are great for
investigative purposes . Who wouldn’t want to be able to go back in time to see what happened on a system? Unfortunately,
many backup systems are built and managed with business continuity solely in mind and, therefore, are only capable of
restoring full backups . In such cases, the victim organization often needs to arrange a complete server to restore the backup
to . Not impossible to do, but, again, something that takes valuable time which could have otherwise been saved . We
recommend our readers avoid this situation by the simple expedients of either changing the backup software used or
proactively ensuring that a spare server is available .
The challenges that arise during a breach are not always of a technical nature . Perhaps the most feared fiend of all is that of
the third party contract . The typical Service Level Agreement, of course, has a fast response time for those problems deemed
most urgent . Unfortunately, “most urgent” is often defined as “an important or critical system being down .” Strange as it may
sound, data leakage often doesn’t fall into a category that warrants the highest priority and fastest response . Luckily, some
outsourcing companies have the correct mindset about such matters, and tend to try to give priority to those situations that
are clearly urgent . However, some stick to the contract and respond with “We will provide the requested log file within
24 hours, according to the SLA for a medium priority incident .” In one case, the victim took more than three weeks before
delivering firewall logs to the investigative team . This was because the outsourcing company that managed the system could
not locate the physical system, to which they had to attach the external hard drive, within their own datacenter . When
outsourcing data, the wise professional will make certain that the protocols for accessing said data during a crisis are fully
understood and are acceptable to the organization .


                                                                57
Breach Discovery Methods
One of the many benefits to studying breaches en masse rather than the myopic view of a single investigator’s caseload or even
one team’s caseload is that it allows one to spot things that would otherwise go unseen or appear unremarkable. A bird’s eye
view of the ways and means behind breach discovery is one of those areas where this is especially useful. And as veteran readers
know, the view hasn’t been very pretty.

The Verizon RISK Team uses three main categories to describe discovery methods: External, Internal Passive, and Internal Active.
External discovery is fairly self-explanatory; the breach was discovered by an external source and then reported to the victim. For
internal discovery we classify incidents as being discovered by Active methods (those that arise from processes specifically
designed for detection) or Passive methods (those in which the evidence of breach arises from non-security processes).

                                                           Over the past few years, we have been closely monitoring this data,
Figure 39 . Simplified breach discovery methods            since one might argue that the method of breach discovery could act
by percent of breaches                                     as a sort of “canary in the coalmine” for the ability of our victims set to
                                                           detect and respond to security incidents. Data around how victims
      5% Internal passive    3% Unknown
                                                           discover the breach would be an indicator of how well they know and
 6% Internal active
                                                           monitor their own environment. Discovery by Internal Active methods
                                                           suggests a capable and responsive security program. On the other
                                                           hand, if the organization is unaware of a breach (as we’re seeing is
                                                           more often the case than not in Compromise to Discovery data above)
                              86%
                                                           and must be told about it by a third party, it is likely they aren’t as
                             External
                              party                        knowledgeable as they should be with regard to their own networks
                                                           and systems.

                                            86% (!)        With that in mind, we have been watching a particular statistic from
                                                  2010
                                                           this section—breach discovery by External party. Past reports began
     75%                                                   to show an encouraging steady decline in breach discovery by third
                      69%                                  parties and we were hopeful that this would continue. Unfortunately,
   Pre-2008
                      2008       61%
                                                           this year Figure 39 shows a significant increase (25%) in third party
                                                           breach discovery. One might be tempted to attribute this increase to
                                  2009
                                                           the demographic mix of the victims, arguing that smaller companies
                                                           have fewer resources to expend on difficult and expensive security
functions such as traffic, log, and event monitoring. However, when looking at Verizon’s data in isolation we see twice the
number of companies with over 1,000 employees (30% vs. 15%) were notified of a breach by a third party. In the USSS data set
we saw roughly a 10% reduction in third party discovery (75% vs. 86%). Size just doesn’t seem to matter all that much.

A more detailed representation of breach discovery methods for 2010 are shown in Figure 40. The top discovery methods
remain relatively unchanged since 2007; third party fraud detection and law enforcement notification continue to be how most
victims find out about the data breach. Internal Active and Passive methods show fairly similar ratios at around 5% each, and
viewed independently, the Verizon and USSS data show very similar representations for Internal Active discovery methods.


              Past reports began to show an encouraging steady decline in breach discovery by
                third parties and we were hopeful that this would continue. Unfortunately, this
                         year we see a significant increase (25%) in third party breach discovery.


                                                                58
Figure 40 . Breach discovery methods by percent of breaches


                       Third party fraud detection                                                                         46%
                                              (e.g., CPP)


                    Notified by law enforcement                                                 30% (!)

         Reported by customer/partner affected
                                                                       6%
                               by the incident

       Unusual system behavior or performance                     3%

             Internal fraud detection mechanism               2%

                   Internal security audit or scan            2%

        Witnessed and/or reported by employee                 2%

Third party event monitoring and alerting service            1%
                                             (e.g., MSS)

                Brag or blackmail by perpetrator             1%

        Financial audit and reconciliation process           1%

Happenstance discovery by unrelated third party              1%

                       Signature-based antivirus             1%

                Third party security audit or scan          <1%

              Log analysis and/or review process            <1%

                         Physical security system           <1%
                                  (alarms, cameras, etc)

             System event alert or error message            <1%

                                      Press release         <1%
                              (victim didn’t know prior)

                    Signature-based network IDS             <1%

            Warned by external reports of recent
                                                            <1%
                                  threat activity

                                          Unknown                 3%

                                             Other(s)       <1%


External Discovery
The most common third party detection method is Common Point of Purchase analysis, or CPP. At a very basic level, CPP
identifies probable breach victims based on the purchase histories of stolen payment cards. Banks use it to limit their financial
losses due to fraudulent transactions, and it works quite well for that purpose. Unfortunately, for CPP to work, the thief must
begin committing fraud with the stolen cards. Notification by law enforcement can happen any number of ways. Very often—
especially in this particular caseload—law enforcement personnel learn of and alert numerous victims as they identify, research,
and monitor suspects. Sometimes confidential informants provide information on the activities and victims of other criminals.
Other third party external methods include notification by customers/business partners and in some small number of cases,
braggadocio on the part of the threat agent.


                                                                            59
You Down With CPP? CPP is a method that banks employ to limit their financial losses due to fraudulent transactions . Let’s
say 200 cardholders all experienced fraudulent purchases on their credit cards . CPP analysis would look at the purchasing
history of these cardholders and try to find a common point of sale (e .g ., stores) which they all shared . This is essentially
crunching data in such a way that the algorithm determines that all cards in question were used at StoreX in a given period
of time . Timeframing, history, geographic location, and many other data points are then used to determine if a particular
common point of purchase could be considered to have a high probability of incident .
CPP has the advantage of seeing through the fog within an organization by highlighting the glaringly obvious issues from
without . A scary thought about CPP is that this detection method is so successful because there is a mechanism (fraud) for
correlating the data together . Other types of valuable data such as personal information, health records, e-mail addresses, and
authentication credentials can often be harvested from many places, but they do not have the same protective mechanisms as
payment cards to detect the data breach . Thus, we believe the numbers around non-payment card breaches are far worse than
reported since there is no CPP like mechanism to detect their loss .


Internal Active Discovery
                                                                                         Figure 41 . Availability of log evidence
Internal active discovery relates to IDS/IPS/HIPS, log monitoring and other like         for forensics by percent of breaches*
technologies that security departments typically use to prevent, detect, and
respond to data breaches. Unfortunately, as referenced above, many smaller
organizations do not have the awareness, aptitude, funding, or technical
                                                                                                   31%
support to perform these tasks on par with the sophistication of the threats
                                                                                                Unavailable
they face. That said, past history has shown that even large businesses seem to
                                                                                                                     69%
have a difficult time utilizing their investments for significant return.
                                                                                                                  Available
We often joke (though it’s really not funny) that criminals seem to have better
ownership, insight, and control over the environment than the organization
paying the bills. Again this year we see a small representation of Internal Active
methods; only ~6% of the time did an organization’s designed security efforts                                 * Verizon caseload only
detect the breach. In the experience of the investigation team, many of these
technology controls are either misconfigured, in the wrong place, or—as is far
too often the case—not being utilized at all. For example, one breach victim had recently purchased a SIEM system, but then let
the admin go to save cost. We showed up to find it brimming over with alerts pointing to the breach, which was of great use to
us, but not so much for them. Again there doesn’t appear to be a club big enough for this dead horse; it might be a great idea
to leverage existing technology investments to help detect and respond to data breaches.

If there is one positive note that we can squeeze out of these statistics around active measures, it’s that discovery through log
analysis and review has dwindled down to 0%. So the good news is that things are only looking up from here. Yeah, that’s
squeezing pretty hard, but what else can we do? Figure 41 continues to show that good evidence of the breach usually exists
in the victim’s log files waiting to be used. See the “On logs, needles and haystacks” sidebar in the 2010 DBIR for a few tips on
smart and cost effective ways to analyze logs.

Internal Passive Discovery
Internal Passive is best described as when someone who is not responsible for security reports the signs
of an incident. Having people aware of the signs of a security incident and knowing what to do when the tell tale
signs of a compromise appear is a wonderful thing, a bit like free beer. The depressing alternative is when our
investigators hear stories from users about how they noticed strange things on a system they were using but
did not report it because they did not know how to report it, or did not feel it could be important.


                                                                  60
To take advantage of this “free beer” we recommend that every organization should have a good security awareness campaign,
and that they test their people frequently to make sure they understand what the signs of compromise might be for their
system, and what to do if they see them. As we said last year, evidence of compromise is not always in the form of subtle
indicators that appear in log and event histories admins might be encountering, but rather in obvious, noticeable change that
should have been investigated.


Anti-Forensics
With all the industry buzz around new and advanced threats, you might have anticipated a radical increase in the use of anti-
forensics. After all, if you want to be truly persistent, it will likely require repeated access to the victim’s environment and data—
each time with the possibility of leaving behind a digital footprint or two. Then again, if you happen to have budgets and
resources that most of us only dream about (perhaps the backing of a nation-state?), then wouldn’t you take advantage of anti-
forensics? And if you did, would there be any trace of your doing so?

The fact of the matter is that for the entire period that we have been studying breaches, we have seen consistent signs of anti-
forensics. Based on the most recent evidence, anti-forensics was used in approximately one-third of 2010 breaches worked by
Verizon. That represents neither a significant increase nor decrease over the prior year. The important thing to note here is that
these numbers are based on evidence. That is, hard facts collected during an investigation. Since the whole purpose of anti-
forensics is to remove such evidence, pessimists among us might view that third of breaches as the error rate for anti-forensics
rather than the usage rate. A different kind of pessimist might accept one-third as the usage rate and chalk the remaining gap


                  The fact of the matter is that for the entire period that we have been studying
                   breaches, we have seen consistent signs of anti-forensics. Based on the most
                    recent evidence, anti-forensics was used in approximately one-third of 2010
                  breaches worked by Verizon. That represents neither a significant increase nor
                                                                       decrease over the prior year.
up to non-existent logging and self-inflicted anti-forensics performed by the victim. Either way, we can only report what we see.

While the overall use of anti-forensics has remained relatively flat, the techniques deployed have an ebb and flow to them.
Previously, the most common form of anti-forensics observed in the field was Data Wiping, leading well ahead of all others. The
prior pervasiveness of Data Wiping, which includes removal and deletion of evidence, came as no surprise. However, in the last
year we have seen Data Hiding (~40%) pull up as a much closer second place to Data Wiping (~57%). With respect to Data
Hiding, the use of steganography has remained relatively rare and flat year-over-year. The use of encryption for the purposes of
Data Hiding has again contributed most significantly to the rise in Data Hiding. It could be opined that this is potentially a
response to the wider usage of DLP or FIM solutions that might otherwise detect clear-text repositories of soon-to-be-exfiltrated
data. Where Data Corruption (~4%) was observed, it continued to be mostly manifested as log tampering.

It is also interesting to consider these AF numbers in connection with the total quantity of breaches (up) and the total quantity
of records compromised (down) that are covered in this study. The steady anti-forensics usage in the face of a much smaller
records-per-breach ratio would tend to support the notion that anti-forensics is a tool for the masses and not limited to the elite
criminals or highest-value targets. In many cases, the anti-forensic tools being used are found to be common across multiple
cases. This likely ties into the increasing underground marketplace for “malware-as-a-service.”

This continues to be a trend of interest to our investigative team as the use of anti-forensics plays a significant role in daily
activities. We will continue to monitor and report on the evolution of anti-forensics.


                                                                 61
PCI DSS Compliance
The Payment Card Industry Data Security Standard (PCI DSS) is a set of control requirements created to help protect cardholder
information. Every year Verizon’s caseload contains a number of organizations that are required to adhere to the PCI DSS. Because
these are confirmed data breach victims, obvious questions arise with respect to the compliance status of these organizations.
This section examines this important topic from several perspectives.

                     “Compliance is a continuous process of adhering to the regulatory standard,”
                      and “Validation . . . is a point-in-time event . . . that attempts to measure and
                                                      describe the level of adherence to the standard.”
In Verizon’s Payment Card Industry Compliance Report (PCIR) from 2010, we made the distinction between “validation” and
“compliance.” In that report, we said that, “Compliance is a continuous process of adhering to the regulatory standard,” and
“Validation . . . is a point-in-time event . . . that attempts to measure and describe the level of adherence to the standard.”
Understanding this distinction between these two contents is important when we look at the data as collected by the
Verizon team.

                                                 Similar to past reports, most organizations (89%) suffering payment card
Figure 42 . PCI DSS compliance status based      breaches had not been validated compliant with PCI DSS at the time of the
on last official audit (or self-assessment)*
                                                 breach (see Figure 42). That means, of course, that some (11% to be exact) had
                             11% Compliant       passed their most recent validation within the last 12 months as required by the
                                                 PCI council (or at least attested to that fact during the investigation).

                                                 In comparison to past reports, this year’s compliance/non-compliance ratio
                                                 leans a bit more toward “non-compliant.” This modest change is likely due to
                                                 more level three and four merchants (smaller retailers, hotels, restaurants, etc.) in
                 89%                             the dataset, whereas previous caseloads reflected a higher percentage of level
             Not compliant                       one or two merchants and/or service providers (e.g., larger financial institutions).
                                                 In reviewing this demographic mix and the associated lack of compliance, we
                                                 believe that the data reinforces an assertion we’ve been making for the past
                     * Verizon caseload only
                                                 three years: to reduce risk, organizations of all sizes need to implement the basic
                                                 tenets of an information risk management program and maintain this initial
investment over time. This includes network and data defense technology basics (firewalls, anti-virus, identity and access
management), as well as the non-technical aspects of security and risk management (policy and process development).

While the above refers to the victim’s status based upon their last official validation, another important line of inquiry relates to
their state when the incident occurred. When our investigators work a case in which the victim organization processes payment
cards, a review is conducted of which PCI DSS requirements were and were not in place at the time of the breach. The results of
this assessment are recorded, appended to the case report, and then conveyed to the relevant payment card brands. This work
is not an official PCI DSS audit, nor does it either uphold or overrule the victim’s compliance status. That said, it does provide
insight into the condition of the security program of the victim organization at the time.

In the incident report delivered to the card brands, investigators break down compliance by PCI DSS requirement. If the DSS
represents the basics of an information security program, then we are able to get a high-level understanding of the state of
the security program at the time of investigation. In Table 16 we present the results of these assessments over time.
Additionally, we’ve added a column that presents data from our 2010 Payment Card Industry Compliance Report (PCIR).


                                                                 62
This report reflects information from Initial Reports on Compliance (IROCs) conducted by Verizon’s team of Qualified Security
Assessors (QSAs). The IROC is essentially an initial state (pre-validation) analysis of the client’s adherence to the DSS. We’ve
included this data for reference because it allows us to infer which sections of the PCI DSS organizations find most difficult
to satisfy.


Table 16 . Percent of relevant organizations in compliance with PCI DSS requirements based on post-breach reviews conducted
by Verizon IR team


Build and Maintain a Secure Network                                                                       2008 2009 2010 PCIR

Requirement 1: Install and maintain a firewall configuration to protect data                              30%   35%    18%    46%

Requirement 2: Do not use vendor-supplied defaults for system passwords and other security parameters     49%   30%    33%    48%

Protect Cardholder Data

Requirement 3: Protect Stored Data                                                                        11%   30%    21%    43%

Requirement 4: Encrypt transmission of cardholder data and sensitive information across public networks   68%   90%    89%    63%

Maintain a Vulnerability Management Program

Requirement 5: Use and regularly update anti-virus software                                               62%   53%    47%    70%

Requirement 6: Develop and maintain secure systems and applications                                       5%    21%    19%    48%

Implement Strong Access Control Measures

Requirement 7: Restrict access to data by bustiness need-to-know                                          24%   30%    33%    69%

Requirement 8: Assign a unique ID to each person with computer access                                     19%   35%    26%    44%

Requirement 9: Restrict physical access to cardholder data                                                43%   58%    65%    59%

Regularly Monitor and Test Networks

Requirement 10: Track and monitor all access to network resources and cardholder data                     5%    30%    11%    39%

Requirement 11: Regularly test security systems and processes                                             14%   25%    19%    38%

Maintain an Information Security Policy

Requirement 12: Maintain a policy that addresses information security                                     14%   40%    16%    44%


The 2010 compliance data simply doesn’t provide us with a basis for optimism. Overall, things look better than 2008, but worse
than 2009. Before jumping to conclusions about PCI backsliders, however, consider one important fact: this apparent decline
may be partially explained by the demographic differences discussed above. 2009 was a smaller caseload (54 breaches) with a
higher ratio of larger organizations than 2010 (94 breaches). Granted, that’s no excuse since all of the organizations represented
process, store, or transmit payment card information and, therefore, should meet all requirements.

Despite the rather poor showing, let’s see what we can learn. Eight of the twelve requirements posted lower numbers than the
year before, some by a fairly large margin. Requirements 1, 2, 5, and 12 are at or very near their historic lows, hinting at rather
immature security programs. Firewalls, Anti-Virus, changing default credentials, and related concepts could all be found in “best
practice” documents for information security from 15 years ago (or more). So, either the “security message” isn’t reaching smaller
businesses or we, as an industry, are not explaining the benefits well enough for them to make the extra effort, or they aren’t
willing or compelled to do so for various other reasons.


                                                                     63
In addition, low marks in other technical aspects of the PCI DSS (Requirements 3, 8, 10, 11) are similar to the areas that our QSA
clients struggled to meet. The association here is too strong to ignore; PCI compliance is not easy, and security is not something
to be addressed once every twelve months. Installing and maintaining a firewall configuration to protect data, developing and
maintaining secure systems and applications, restricting access to data by business need-to-know, tracking and monitoring all
access to network resources and cardholder data, and maintaining a policy that addresses information security (Requirements
1, 6, 7, 10, 12) are all aspects of the DSS that need an investment in continuous processes and upkeep to be effective.

What does appear to be working are areas where the security-conscious aspects of our industry can “bake security in.”
Requirement 4, “Encrypt transmission of cardholder data and sensitive information across public networks,” is one that has been
increasingly addressed by hardware and software vendors, as well as the vendor management programs of banks and card
processing vendors. We see Requirement 4 holding steady at around 90% compliance in victim environments over the past
two years.

We’ll end this year’s PCI section on a pragmatic note. One of the lingering questions from our discussions around PCI in this report
is always that of relevancy. It’s all well and good to validate compliance with the PCI DSS, but does it actually help reduce risk? Insofar
as that translates to a sincere security program—one that seeks to maintain validation on an ongoing basis—the data strongly
suggests the answer is “yes.” Let’s examine some of the results in Table 16 in light of threat actions discussed earlier in this report.

                     One of the lingering questions from our discussions around PCI in this report
                     is always that of relevancy. It’s all well and good to validate compliance with
                        the PCI DSS, but does it actually help reduce risk? Insofar as that translates
                      to a sincere security program—one that seeks to maintain validation on an
                                    ongoing basis—the data strongly suggests the answer is “yes.”

The first and perhaps most noteworthy example of this would be found in Requirement 2 (Do not use vendor-supplied defaults
for system passwords and other security parameters). In our previous section on Hacking, we find that “exploitation of default or
guessable credentials” is represented in two-thirds of all intrusions and accounts for nearly one-third of all records compromised.
Similarly, “exploitation of insufficient authentication” is found in 10% of all intrusions and ascribed to 21% of all records breached.

Requirement 5 (Use and regularly update anti-virus software) can be directly mapped to the high frequency of malware used to
compromise systems and data. Sure, over 60% of malware is customized and not likely to be detected by AV, but that means
about 40% stands a decent chance of being recognized. Who doesn’t want a 40% reduction in risk?

When malware isn’t recognized by AV and is installed on the system, all is not lost. Requirement 1 (install and maintain firewall
configuration) and Requirement 10 (track and monitor all network access) are a critical second line of defense against backdoors
and other common types of malware and intrusion methods.

Let’s do one more (though we could go on for some time). Requirement 6 (Develop and maintain secure systems and applications)
and Requirement 11 (Regularly test security systems and processes) are both important processes that relate to the broader
category of Hacking (50% of breaches/89% of records). Because Hacking is often used in order to install malware, secure
development and testing can be considered to reduce the risk of that threat action as well (page 24, 49% of breaches/79%
of records).

Every year that we study threat actions leading to data breaches, the story is the same; most victims aren’t overpowered by
unknowable and unstoppable attacks. For the most part, we know them well enough and we also know how to stop them.
Mapping common threat actions from 1700+ confirmed breaches to PCI DSS requirements simply does not reveal many gaping
holes or grossly inadequate coverage. Does that mean the DSS is perfect? Not at all; few things are. Fortunately, perfection is not
a precondition for significant risk reduction benefits.


                                                                    64
Conclusions and Recommendations
 At the conclusion of our last report, we stated:

     “Creating a list of solid recommendations gets progressively more difficult every year we publish this report. Think about it; our
     findings shift and evolve over time but rarely are they completely new or unexpected. Why would it be any different for
     recommendations based on those findings? Sure, we could wing it and prattle off a lengthy list of to-dos to meet a quota but
     we figure you can get that elsewhere. We’re more interested in having merit than having many.”

 But surely after examining another 800 breaches in the past year, we’d have plenty of new recommendations to solve all your
 security woes, right? Quite wrong, actually. The latest round of evidence leads us to the same conclusion as before: your security
 woes are not caused by the lack of something new (Figure 43 looks about like it always does). They almost surely have more to
 do with not using, under using, or misusing something old.

 The argument levied against that notion is that our adversaries are clever                  Figure 43 . Cost of recommended preventive
 rascals and will adapt in order to our thwart our “old” defenses. That is true              measures by percent of breaches*

 (and we’ve seen and discussed evidence of such adaptation), but let’s be real,                      4% Difficult and expensive
 shall we? As a whole, do you really think we’re making them scramble to
 adapt? Year after year our data seems to suggest that we are not, and that is
 something that needs to change. If they adapt, then they adapt. C’est la vie.
                                                                                                        33%                63%
 But let’s quit allowing them to find success in stagnation.
                                                                                                    Intermediate        Simple and
                                                                                                                          cheap
 To that end, we’ve found some old recipes for achieving newfound success.
 We examined top attacks from 2010 and identified recommendations from
 our previous reports most applicable to them. They are categorized and
 listed below and we hope they help you at the planning and budget
 negotiations table.
                                                                                                                     * Verizon caseload only


 Overall
 Achieve essential, and then worry about excellent: We find that many organizations achieve very high levels of security in
 numerous areas but neglect others. Criminals will almost always prefer the easier route. Identifying a set of essential controls and
 ensuring their implementation across the organization without exception, and then moving on to more advanced controls
 where needed is a superior strategy against real-world attacks.

   The argument levied against that notion is that our adversaries are clever rascals
and will adapt in order to our thwart our “old” defenses. That is true (and we’ve seen
  and discussed evidence of such adaptation), but let’s be real, shall we? As a whole,
                           do you really think we’re making them scramble to adapt?

 Access Control
 Change default credentials: Simple and sweet, when system/network admins stand up a new system, change the password. If
 you outsource this to a third party, check that they’ve changed the password. Don’t assume that your staff or your partners
 consistently follows through on all policies and procedures. Along with changing default credentials, organizations should
 ensure that passwords are unique and not shared among users or used on different systems. This was especially problematic for
 assets managed by a third party.


                                                                     65
Every year that we study threat actions leading to data breaches, the story is the
same; most victims aren’t overpowered by unknowable and unstoppable attacks. For
    the most part, we know them well enough and we also know how to stop them.

 User account review: Prior year’s data breach reports and years of experience lead us to believe in the value of reviewing user
 accounts on a regular basis. The review should consist of a formal process to confirm that active accounts are valid, necessary,
 properly configured, and given appropriate (preferably least) privileges.

 Restrict and monitor privileged users: Trust but verify. Use pre-employment screening to eliminate the problem before it starts.
 Don’t give users more privileges than they need (this is a biggie) and use separation of duties. Make sure they have direction
 (they know policies and expectations) and supervision (to make sure they adhere to them). Privileged use should be logged and
 generate messages to management. Unplanned privileged use should generate alarms and be investigated.


 Network Management
 Secure remote access services: In many instances, remote access services have been enabled and are Internet-facing. We
 recommend tying these services down where only specific IP addresses or networks can access them. Additionally, it’s important
 to limit access to sensitive systems within the network. Many organizations will allow any device on the network to connect and
 remotely access any other device; we highly recommend not managing your devices this way. Tie down remote access services
 to specific management networks via access control lists.

 Monitor and filter egress network traffic: At some point during the sequence of events in many breaches, something (data,
 communications, connections) goes out that, if prevented, could break the chain and stop the breach. By monitoring,
 understanding, and controlling outbound traffic, an organization will greatly increase its chances of mitigating malicious activity.


 Secure Development
 Application testing and code review: SQL injection attacks, cross-site scripting, authentication bypass, and exploitation of
 session variables contributed to nearly half of breaches attributed to hacking or network intrusion. It is no secret that attackers
 are moving up the stack and targeting the application layer. Why don’t our defenses follow suit? As with everything else, put out
 the fires first: even lightweight web application scanning and testing would have found many of the problems that led to major
 breaches in the past year. Next, include regular reviews of architecture, privileges, and source code. Incorporating a Security
 Development Life-Cycle (SDLC) approach for application development is recommended as well. Finally, help your developers
 learn to appreciate and write more secure code.


 Log Management and Analysis
 Enable application and network witness logs and monitor them: All too often, evidence of events leading to breaches was
 available to the victim but this information was neither noticed nor acted upon. Processes that provide sensible, efficient, and
 effective monitoring and response are critical to protecting data.

 However, don’t just focus your logging efforts on network, operating system, IDS, and firewall logs and neglect remote access
 services, web applications, databases, and other critical applications. These can be a rich data set for detecting, preventing, and
 investigating breaches.

 Define “suspicious” and “anomalous” (then look for whatever “it” is): This is admittedly vague, but—in truth— generalizing
 what this entails in order to prescribe something for everyone would counteract the point. Discover what is critical, identify what
 constitutes normal behavior, and then set focused mechanisms in place to look for and alert upon deviations from normality.


                                                                 66
Change your approach to event monitoring and log analysis: Based on the data we collect in the Time of Breach events, we
believe that organizations would be better served to focus less on the “real-time” methods of detection, and more on the “this-
week” methods. If we can shift Compromise to Discovery time frame from Weeks and Months to Days, it will significantly reduce
the damage done to your organization. Focus on the obvious things rather than the minutia. This need not be expensive; a
simple script to count log lines/length and send an alert if out of tolerance can be quite effective. We are confident that this
approach will reap benefits and save time, effort, and money.


Training and Awareness
Increase awareness of social engineering: Educate employees about different methods of social engineering and the vectors
from which these attacks could come. In many of our cases, we see where users click on links they shouldn’t and open
attachments received from identified persons. Reward users for reporting suspicious e-mail and sites and create the incentives
necessary for vigilance.

Train employees and customers to look for signs tampering and fraud: Such awareness campaigns have been around in
certain areas for some time, but ATM and Pay-at-the-Pump tampering/fraud seem to be increasing in number and scope.
Organizations operating such devices should consider conducting regular examinations of them. Additionally, empower
customers to help protect themselves as well as aiding the organization in spotting potential issues.


Incident Management
Create an Incident Response Plan: If and when a breach is suspected to have occurred, the victim organization must be ready
to respond. An effective Incident Response Plan helps reduce the scale of a breach and ensures that evidence is collected in the
proper manner.

Engage in mock incident testing: I mean listen, we’re sitting here talking about practice; not an incident, not an incident, not
an incident—but we’re talking about practice (sports fans among you might get that reference). Yes, we are talking about
practice, because practice makes perfect. In order to operate efficiently, organizations should undergo routine IR training that
covers response strategies, threat identification, threat classification, process definition, proper evidence handling, and
mock scenarios.


A Call to Data Sharing
One of the most critical and persistent challenges plaguing efforts to manage information risk is a lack of data. As community
decision-makers and practitioners, we have little data because we do not share and while there are many reasons for this, doubts
that it can be done in a practical, private, and mutually beneficial manner are chief among them. We would like to think that this
report is an example that sensitive and useful data can be shared responsibly to the benefit of many. In the past two years,
several other investigative firms have begun to share their results and we commend those efforts. Every little “bit” shared helps.
It would be great if others joined in as well—and if you’d like to report results using VERIS so we can all compare apples to apples,
we’ll be glad to help however we can.

We would also like to extend an invitation to other organizations to consider using the VERIS community website12 to
anonymously report security incidents (any kind—not just data breaches). All (aggregated and anonymous) results will be made
freely available to the community. By sharing incident information, you will add to the collective knowledge of the community
while gaining access to the VERIS dataset for yourself. The overall goal is to lay a foundation from which we can constructively
and cooperatively learn from our experiences to better manage risk.

We realize that your time is valuable, so we once again thank you for taking out a chunk of it to read this report.


12 https://www2.icsalabs.com/veris/


                                                                 67
Appendix A: Case Statistics from the Dutch High Tech Crime Unit
The data and statistics below represent a sample of 32 data breach investigations by the Dutch National High Tech Crime Unit
reaching back to 2006. As mentioned in the methodology earlier in our report, the NHTCU caseload varies from year to year, data
breaches being only one aspect of their mission. The NHTCU targets cases
they classify as “high tech crime,” which can roughly be defined as those         Table A1 . Organizational size by number
forms of crime that are organized, target computer systems, and use               of breaches (number of employees)

sophisticated new technology or methods. Cyber-related issues that target          1 to 10                         0
vital national interests are also taken up.
                                                                                   11 to 100                       1
These 32 breaches encompassed a total of 144,076 data records confirmed
                                                                                   101 to 1,000                    4
by the NHTCU to be compromised. However, the extent of data loss could
not be determined for the majority of incidents, so this figure represents         1,001 to 10,000                 9

the lowest end of the potential range (we discuss reasons for this in the          10,001 to 100,000               14
main report). In this section, we highlight findings from these investigations,
                                                                                   Over 100,000                    2
concentrating on the agents, actions, assets, and attributes involved. In
                                                                                   Unknown                         2
reviewing this data, you will see that these are not unlike those seen in both
the Verizon and USSS case sets over the last several years.


Demographics                                                                      Figure A1 . Industry groups represented
                                                                                  by number of breaches
The NHTCU’s cases spanned several different industries, organizational sizes,
and locations. The top victim industry was that of Financial Services, which      Financial Services                                 16

included some of the largest banks in the Netherlands as well as others                  Education                     7
throughout Europe and the United States. Those victims within the Education
                                                                                      Tech Services                    7
industry consisted mostly of European universities. Technology Services
                                                                                       Government       1
victims were a mix of managed IT and security services firms and software
development shops. Several of these organizations lost valuable IP and other                   Retail   1
sensitive data. Per Table A1, organizational size was weighted toward
larger organizations.
                                                                                  Figure A2 . Threat agents (inclusive) by number
Agents                                                                            of breaches
                                                                                             32
Every case involving a data breach within the NHTCU’s incidents involved
an external agent, of which most were from Eastern and Western Europe.
Based on the details of case selection listed above, it’s not surprising that                                  1              -
three-quarters of the external agents are categorized as organized criminal               External          Internal       Partner
groups. The next largest group is unaffiliated person(s). One of the NHTCU’s
investigations included an insider who did not act deliberately, but
nonetheless broke a policy regarding the reuse of corporate passwords             Figure A3 . Compromised records by threat agent
that led directly to one of the data breaches.
                                                                                       144,076               17               -
Yet another dataset showing a strong majority of external agents in both
frequency and data loss. Isn’t that interesting?


                                                                                       External         Internal           Partner


                                                                 68
Actions
                                                          Figure A4 . Top threat action types by number of breaches
The top three threat action categories were
Hacking, Malware, and Social. The most common               Hacking      Use of stolen login credentials                               27
types of hacking actions used were the use of                                                                                          22
                                                            Malware      Send data to external site/entity
stolen login credentials, exploiting backdoors,
                                                            Malware      Capture data from an application/system process               16
and man-in-the-middle attacks. These were
often carried out via the web or backdoors                  Malware      Download/install additional malware or updates                16

opened by malware. Malware functions most                   Hacking      Man-in-the-middle attack                                      15
often seen were form grabbers (capture data
                                                            Social       Phishing (or any type of *ishing)                             15
from user activity), backdoors that allowed
remote access, and exfiltration mechanisms such             Social       Spam                                                          15

as sending data to an external entity. Infection            Social       Counterfeiting/forgery (fake website, docs, etc)              15
vectors reflect two of the common pathways                                                                                             8
                                                            Malware      Backdoor (allows remote access/control)
seen in Verizon and USSS data sets of user-
                                                            Hacking      Exploitation of backdoor or command and control channel       8
executed or download via the web or Internet or
where it was installed directly by the attacker.            Malware      Packet sniffer (capture data from network)                    7

Lastly, the action category of Social shows                 Malware      System/network utilities (PsTools, Netcat)                    7
phishing and spam attacks via e-mail combined
                                                            Hacking      SQL injection                                                 4
with fake websites that mostly targeted
customers of Financial Services organizations.

In several incidents, organized crime utilized all three of the above actions to meet their goal of stealing data and performing
fraud. All in all though, the actions were very similar to those seen in the Verizon and USSS cases over the last several years.


Figure A5 . Threat action categories by number of breaches and records


        Malware                                                                                                24 / unknown

        Hacking                                                                                                               30 / 139,477

           Social                                                               17 / 1

          Misuse          1 / 17

        Physical          1 / 4,599

            Error   0/-

   Environmental    0/-


                                                                 69
Assets
The most common types of assets involved in breaches investigated by the NHTCU were those within the Servers category. The
assets attacked most often in this category were web, database, and file servers. The actions most often used against these
devices were use of stolen login credentials and SQL injection. End-users systems regularly attacked were desktop and PIN entry
devices. The attacks against desktops were form grabber malware as well as man-in-the-middle attacks. Agents tampered with
a dozen or so PIN entry devices belonging to one large firm as part of intricate carding schemes. Lastly, the People category
consisted mostly of customers of financial services institutions. In these incidents, the attackers would utilize Social attacks to
steal credentials and the commit fraudulent financial transactions. The majority of assets were hosted externally and managed
by a third party.


Figure A6 . Categories of affected assets by number of breaches and records


                    Servers                                                                                             30 / 139,477

           End-User Devices                                                                17 / 4,599

                    People                                                             16 / -

                Offline Data          2/-

 Networks & NW Devices         0/-


Attributes
These results pertain to data breaches, so the security attribute of confidentiality was involved in all 32 incidents. Similar to the
Verizon-USSS dataset, this was closely followed by losses of integrity, which encompasses a myriad of unauthorized changes to
systems during an attack scenario. Losses of authenticity dealt with fraudulent transactions initiated after perpetrators gained
access to and control of these assets.


Figure A7 . Security Attributes Affected by number of breaches

 Attributes affected            Definition                                                                 Breaches
 Confidentiality                Limited access, observation, and disclosure                                  32

 Possession                     Exclusive (or intended) possession and control (and ability to prove it)      0

 Integrity                      Complete and unchanged from original state                                   31

 Authenticity                   Validity, conformance, and genuineness                                       17

 Availability                   Present and ready for use when needed                                         0

 Utility                        Usefulness or fitness for a purpose                                           0


                                                                           70
Breach Discovery
Similar to every other dataset we’ve studied, most breaches investigated by the NHTCU lasted several months before the victim
learned of them. Also in line with our other findings, this discovery was usually made by a third party. This was usually found by
law enforcement personnel (the NHTCU and others) during the investigation of another (sometimes related) incident.

We’d like to thank the NHTCU for providing us (and you) with this case data and enabling this brief overview of breach trends in
Europe. Such cooperation is critical to understanding and managing breaches around the world. We also hope it helps you
accomplish that goal in your neck of the woods.


Appendix B: Project Taurus and the Bredolab Takedown
In 2010, the Dutch NHTCU decided to start a public-private partnership to combat botnets. Getting together with members of
the CERT community, industry, and internet infrastructure they devised a three stage approach, consisting of intelligence,
intervention, and investigation. Project Taurus was born. All partners combined their state of the art botnet information and all
botnets were tracked real time using a university-developed tool. The goal was a notice and takedown for most of the botnets
and a deeper investigation into some of them. Then, one of the partners, a large internet service provider, found a botnet
command and control server in their infrastructure.

The partners started investigating and found a cluster of 143 malicious servers, seven of which were directly related to a botnet
called Bredolab. At that point, Bredolab had been able to infect 30 million unique IP addresses. In a ten week period the partners
were able to draw a picture of the botnet infrastructure based on the network traffic. They were also able to identify the
suspected operator of the network, an Armenian who planned to come to the Netherlands for a dance party. The network was
set to be dismantled on the day the Armenian would arrive at Amsterdam airport. The Armenian was to be arrested on arrival
but due to visa problems he never showed up.

Instead, he noticed someone attacking his botnet, assumed it was a competitor and fought back. After trying several backdoors,
he decided to DDoS what was left of his own botnet. Due to good international cooperation, the command and control server
of the DDoS botnet was quickly dismantled. An Interpol red notice led to the arrest of the suspect the following day at
Yerevan airport.

A piece of code was written and put on the botnet server to be downloaded by the bots. This code would cause a warning
window containing cleaning instructions to pop up at the victims’ computers. The law enforcement obligation of helping the
victims was judged to precede potential judicial concerns in this action. The combination of creativity, new techniques, close
cooperation, and hard work enabled the Taurus partners to go further than any of them would have been able to go alone.


About Verizon Investigative Response
Security breaches and the compromise of sensitive information are a very real concern for organizations worldwide. When such
incidents are discovered, response is critical. The damage must be contained quickly, customer data protected, the root causes
found, and an accurate record of events produced for authorities. Furthermore, the investigation process must collect this
evidence without adversely affecting the integrity of the information assets involved in the crime.

The IR team has a wealth of experience and expertise, handling over 800 security breach and data compromise cases in the last
six years. Included among them are many of the largest breaches ever reported. During these investigations, the team regularly
interacts with governmental agencies and law enforcement personnel from around the world to transition case evidence and
set the stage for prosecution. The expansive data set generated through these activities offers an interesting glimpse into the
trends surrounding computer crime and data compromise.


                                                               71
About the United States Secret Service
As the original guardian of the nation’s financial payment system, the United States Secret Service has established a long history
of protecting American consumers, industries and financial institutions from fraud. Over the last 145 years, our investigative
mission and statutory authority have expanded, and today the Secret Service is recognized worldwide for our expertise and
innovative approaches to detecting, investigating and preventing financial and cyber fraud.

Today’s global economy has streamlined commerce for both corporations and consumers. Financial institutions and systems are
readily accessible worldwide. Today’s financial fraud and cybercriminals have adapted to this new means of global trade and
seek to exploit this dependence on information technology. Cybercriminals consequently have become experts at stealing
stored data, data in transit, and encrypted data. They operate based on trust, long standing criminal relationships, high levels of
operational security, and reliability. The culture also has evolved over the last decade and is now described as non-state
sponsored, transnational and is almost impossible to infiltrate due to its dynamic nature and operational security.

To combat these emerging threats, the Secret Service has adopted a multi-faceted approach to aggressively combat cyber and
computer related crimes by establishing a network of 31 Electronic Crimes Task Forces (ECTF), including the first international
ECTF located in Rome, Italy, 38 Financial Crimes Task Forces (FCTF) and a Cyber Investigations Branch. This approach enables the
Secret Service to detect, prevent, and aggressively investigate electronic crimes including cyber attacks on the nation’s critical
infrastructures and financial payment systems.

For more information or to report a data breach, please contact your local Secret Service office at www .secretservice .gov.


About the Dutch National High Tech Crime Unit
The Dutch National High Tech Crime Unit (NHTCU) is a team within the Dutch National Police Agency, dedicated to investigating
advanced forms of cybercrime. The team’s vision is to make the Netherlands an unsafe place for cyber crime. In addition to
Dutch victims and criminals, this includes the use of Dutch infrastructure in criminal activities.

The team specializes in using out of the box investigation methods and techniques to find and target the most important
players in the criminal chain. The team has excellent contacts in North America, Western and Eastern Europe, and often plays the
role of bridge builder between High Tech Crime Units in different countries.

Another success factor is the advanced cooperation with other public and private partners, where information is freely shared
and joint strategies are implemented. An example of such cooperation can be read in the description of the Bredolab case. The
NHTCU recently started up the Dutch Electronic Crimes Task Force, a new cooperation with financial and other parties to
institutionalize public-private partnership as a means to actively combat certain types of cybercrime.


pplwc


                                                                 72
U2FsdGVkX180AaM+aGDY0cUgudzihpyjBoJJEIwu5CW4aLf7EeoMz3FuwU0WrSmK
D+pq8WBiECoFNB1K0qesbQBtCkbrOZyufwWKEcy3KwTQfdG6LSiswvfHq0R1slNT


                                                                                                              © 2011 Verizon. All Rights Reserved. MC14949 04/11. The Verizon and Verizon Business names and logos and all other names, logos, and slogans identifying Verizon’s products and services are trademarks and service marks
                                                                                                              or registered trademarks and service marks of Verizon Trademark Services LLC or its affiliates in the United States and/or other countries. All other trademarks and service marks are the property of their respective owners.
dKuZ0DREk3N5NK5BDzbrFwI+4znBihkILoatsKQ6uR0BlxoHQnoyNT/tYMKv/r/Q
1IDr5qedtUFhGIBSjKgRNg+kUeTzyi/U+jKSzLPR2BiBj2N4YqjCqvzVgFfsqVgU
asOjYIcxyPcRug6TL+OqRoiA8D1IoSRZ1egd7OxoBBx6vYFnsjCvZ7FQB9llGX/7
bAslhxlyQlm05K7zi4MRE8pjp7+S8o86GQqbwNB/R7oqvXjMva4smb9fvIz5xWLR
a8NGak2fYo7PlOtWYcg/o2+pX2SazaABum3uggTxaPAqs1XdTFlswkuRslshkj6o
OsPwv/+/WO4+PEYDseZW4tlcigq37i1Dy6SLBCk8d2CO5Lo9UqKyZWRNTxb6795z
/10O02TTBvFCv4O7uo13HRQw2xYqxsODzjxoZXnmffWhV2+59Dus1iHQJaSr6QGF
0GqrHD6vT54XKP8ph8M7f5pxBC6b8qdV2Gz3agDJEcsAvrfnC7wgdVhK0rqueZGL
zQVU2KoFte2xS2CTs4bqAOygsATBQ9CjQPYb4p1ay6zW4iE9XbcA7r80foQ69MmZ
Mk8iL22lfOMlECHcmKjCln7rGH9X0n/4/VMgrf4pKnHJeqCc58Trlf5LvjEoWJVW
BLc9nrBUeJZAo50s1q2EtBA0EICyz63uOnzbN543CGI=


                                                                           verizonbusiness.com/thinkforward
                                                                           verizonbusiness.com/socialmedia
                                                         verizonbusiness.com

2011 Data Breach Investigations[1]

  • 1.
    2011 Data Breach Investigations Report A study conducted by the Verizon RISK Team with cooperation from the U.S. Secret Service and the Dutch High Tech Crime Unit.
  • 2.
    2011 Data BreachInvestigations Report LEAD ANALYSTS/ TABLE OF CONTENTS AUTHORS: Executive Summary . . . . . . . . . . . . . . . . . . . . . . . . . . . . . . . . . . . . . . . . . . . . . . . . . . . . . . . . . . . . . . . 2 Wade Baker Alexander Hutton Year in Review, 2010 . . . . . . . . . . . . . . . . . . . . . . . . . . . . . . . . . . . . . . . . . . . . . . . . . . . . . . . . . . . . . . . 4 C. David Hylender 2010: The U .S . Secret Service Perspective . . . . . . . . . . . . . . . . . . . . . . . . . . . . . . . . . . . . . . . . 6 Joseph Pamula, Ph.D. 2011 DBIR: Methodology . . . . . . . . . . . . . . . . . . . . . . . . . . . . . . . . . . . . . . . . . . . . . . . . . . . . . . . . . . 7 Christopher Porter Verizon Data Collection Methodology . . . . . . . . . . . . . . . . . . . . . . . . . . . . . . . . . . . . . . . . . . . 7 Marc Spitler USSS Data Collection Methodology . . . . . . . . . . . . . . . . . . . . . . . . . . . . . . . . . . . . . . . . . . . . . 8 NHTCU Data Collection Methodology . . . . . . . . . . . . . . . . . . . . . . . . . . . . . . . . . . . . . . . . . . . 8 AUTHORS Classifying Incidents Using VERIS . . . . . . . . . . . . . . . . . . . . . . . . . . . . . . . . . . . . . . . . . . . . . . . . 9 Andy Bonillo Turning the Incident Narrative into Metrics . . . . . . . . . . . . . . . . . . . . . . . . . . . . . . . . . . . . . 10 Ben van Erck Mark Goudie A Word on Sample Bias . . . . . . . . . . . . . . . . . . . . . . . . . . . . . . . . . . . . . . . . . . . . . . . . . . . . . . . . 11 Jelle Niemantsverdriet Results and Analysis . . . . . . . . . . . . . . . . . . . . . . . . . . . . . . . . . . . . . . . . . . . . . . . . . . . . . . . . . . . . . . 11 Christopher Novak Demographics . . . . . . . . . . . . . . . . . . . . . . . . . . . . . . . . . . . . . . . . . . . . . . . . . . . . . . . . . . . . . . . . 12 Rafael Perelstein 2010 Threat Event Overview . . . . . . . . . . . . . . . . . . . . . . . . . . . . . . . . . . . . . . . . . . . . . . . . . . . 15 Mike Rosen Threat Agents . . . . . . . . . . . . . . . . . . . . . . . . . . . . . . . . . . . . . . . . . . . . . . . . . . . . . . . . . . . . . . . . . 17 Bryan Sartin Peter Tippett, M.D., Ph.D. Breach Size by Threat Agents . . . . . . . . . . . . . . . . . . . . . . . . . . . . . . . . . . . . . . . . . . . . . . 19 J. Andrew Valentine External Agents . . . . . . . . . . . . . . . . . . . . . . . . . . . . . . . . . . . . . . . . . . . . . . . . . . . . . . . . . . . 20 Men and women of the Internal Agents . . . . . . . . . . . . . . . . . . . . . . . . . . . . . . . . . . . . . . . . . . . . . . . . . . . . . . . . . . . 22 U.S. Secret Service Partner Agents . . . . . . . . . . . . . . . . . . . . . . . . . . . . . . . . . . . . . . . . . . . . . . . . . . . . . . . . . . . 23 Men and women of the Dutch High Tech Crime Unit Threat Actions . . . . . . . . . . . . . . . . . . . . . . . . . . . . . . . . . . . . . . . . . . . . . . . . . . . . . . . . . . . . . . . . . 24 Malware . . . . . . . . . . . . . . . . . . . . . . . . . . . . . . . . . . . . . . . . . . . . . . . . . . . . . . . . . . . . . . . . . . 27 CONTRIBUTORS: Hacking . . . . . . . . . . . . . . . . . . . . . . . . . . . . . . . . . . . . . . . . . . . . . . . . . . . . . . . . . . . . . . . . . . 31 Steve Adams Social . . . . . . . . . . . . . . . . . . . . . . . . . . . . . . . . . . . . . . . . . . . . . . . . . . . . . . . . . . . . . . . . . . . . 36 Thijs Bosschert Misuse . . . . . . . . . . . . . . . . . . . . . . . . . . . . . . . . . . . . . . . . . . . . . . . . . . . . . . . . . . . . . . . . . . . 38 Eric Brohm Physical . . . . . . . . . . . . . . . . . . . . . . . . . . . . . . . . . . . . . . . . . . . . . . . . . . . . . . . . . . . . . . . . . . 40 Calvin Chang Error . . . . . . . . . . . . . . . . . . . . . . . . . . . . . . . . . . . . . . . . . . . . . . . . . . . . . . . . . . . . . . . . . . . . . 42 Ron Dormido Environmental . . . . . . . . . . . . . . . . . . . . . . . . . . . . . . . . . . . . . . . . . . . . . . . . . . . . . . . . . . . . 42 Kylee Evans Jason Fisher Assets and Attributes . . . . . . . . . . . . . . . . . . . . . . . . . . . . . . . . . . . . . . . . . . . . . . . . . . . . . . . . . . 43 Eric Gentry Compromised Data . . . . . . . . . . . . . . . . . . . . . . . . . . . . . . . . . . . . . . . . . . . . . . . . . . . . . . . . . . . 47 John Grim Attack Difficulty . . . . . . . . . . . . . . . . . . . . . . . . . . . . . . . . . . . . . . . . . . . . . . . . . . . . . . . . . . . . . . . 51 Clarence Hill Attack Targeting . . . . . . . . . . . . . . . . . . . . . . . . . . . . . . . . . . . . . . . . . . . . . . . . . . . . . . . . . . . . . . . 52 Kenny Lee Unknown Unknowns . . . . . . . . . . . . . . . . . . . . . . . . . . . . . . . . . . . . . . . . . . . . . . . . . . . . . . . . . . 53 Wayne Lee Kevin Long Timespan of Attack . . . . . . . . . . . . . . . . . . . . . . . . . . . . . . . . . . . . . . . . . . . . . . . . . . . . . . . . . . . . 54 David Ostertag Breach Discovery Methods . . . . . . . . . . . . . . . . . . . . . . . . . . . . . . . . . . . . . . . . . . . . . . . . . . . . . 58 Matthew Speicher Anti-Forensics . . . . . . . . . . . . . . . . . . . . . . . . . . . . . . . . . . . . . . . . . . . . . . . . . . . . . . . . . . . . . . . . . 60 Enrico Telemaque PCI DSS Compliance . . . . . . . . . . . . . . . . . . . . . . . . . . . . . . . . . . . . . . . . . . . . . . . . . . . . . . . . . . . 62 Yuichi Uzawa Conclusions and Recommendations . . . . . . . . . . . . . . . . . . . . . . . . . . . . . . . . . . . . . . . . . . . . . . 65 Nicolas Villatte Paul Wright Appendix A: Case Statistics from the Dutch High Tech Crime Unit . . . . . . . . . . . . . . . . . . 68 Appendix B: Project Taurus and the Bredolab Takedown . . . . . . . . . . . . . . . . . . . . . . . . . . . 71 SPECIAL THANKS TO: About Verizon Investigative Response . . . . . . . . . . . . . . . . . . . . . . . . . . . . . . . . . . . . . . . . . . . . . 71 Christopher Abod About the United States Secret Service . . . . . . . . . . . . . . . . . . . . . . . . . . . . . . . . . . . . . . . . . . . . 72 Brianna Boyle About the Dutch National High Tech Crime Unit . . . . . . . . . . . . . . . . . . . . . . . . . . . . . . . . . . . 72 Mike Brubaker Anita Fortunato For additional updates and commentary, please visit And our continued gratitude http://securityblog .verizonbusiness .com . to all those we’ve named For inquiries directed to the United States Secret Service, contact before and haven’t yet databreachstudy@usss .dhs .gov .
  • 3.
    2011 Data BreachInvestigations Report (DBIR) Executive Summary 361 million >> 144 million >> 4 million. Thus goes the tally of total records compromised across the combined caseload of Verizon and the United States Secret Service (USSS) over the last three years. After four years of increasing losses culminating in 2008’s record-setting 361 million, we speculated whether 2009’s drop to 144 million was a fluke or a sign of things to come. 2010’s total of less than four million compromised records seems to suggest it was a sign. But of what? And is it a permanent change in direction or a temporary detour? To help us answer that, we are very glad to have the United States Secret Service (USSS) back with us for the 2011 DBIR. Additionally, we have the pleasure of welcoming the Dutch National High Tech Crime Unit (NHTCU) to the team. Through this cooperative effort, we had the privilege—and challenge—of examining about 800 new data compromise incidents since our last report (with 761 of those for 2010). To put that in perspective, the entire Verizon-USSS dataset from 2004 to 2009 numbered just over 900 breaches. We very nearly doubled the size of our dataset in 2010 alone! It is fascinating from a research standpoint that the all-time lowest amount of data loss occurred in the same year as the all- time highest amount of incidents investigated. In addition to being the largest caseload ever, it was also extremely diverse in the threat agents, threat actions, affected assets, and security attributes involved. We witnessed highly automated and prolific external attacks, low and slow attacks, intricate internal fraud rings, country-wide device tampering schemes, cunning social engineering plots, and much more. Some of the raw statistics may seem to contradict this claim of diversity (e.g., the percent of breaches attributed to external agents is more lopsided than ever), but one must consider the change in scale. Whereas “10%” used to mean approximately 10-15 breaches across an annual caseload averaging 100-150, it now means 75 breaches in the context of the 2010 caseload. Consider that fact as you digest and ponder results from this year’s report. With the addition of Verizon’s 2010 caseload and data contributed from the USSS and NHTCU, the DBIR series now spans 7 years, 1700+ breaches, and over 900 million compromised records. We continue to learn a great deal from this ongoing study and we’re glad to have the opportunity once again to share these findings with you. As always, our goal is that the data and analysis presented in this report prove helpful to the planning and security efforts of our readers. As usual, we begin with a few highlights below. Who is behind data breaches? 92% stemmed from external agents (+22%) If you’ve followed these numbers over the years, you may be thinking we change our position more than a professional 17% implicated insiders (-31%) contortionist . We’ll admit to a fair share of head scratching among the RISK team as we tried to interpret what they were telling us . In 2009, breaches involving insiders shot up due to <1% resulted from business partners (-10%) incorporating the USSS data, but returned again to pre-USSS levels in 2010 (even though they’re still with us) . Read the 9% involved multiple parties (-18%) report for the full scoop on this, but it basically boils down to a HUGE increase in smaller external attacks rather than a decrease in insider activity . Oh, and partner-caused breaches continued their steady decline . 2
  • 4.
    How do breachesoccur? Due to the lower proportion of internal threat agents, Misuse lost its pole position among the list of threat action 50% utilized some form of hacking (+10%) categories . Hacking and Malware have retaken the lead and are playing dirtier than ever . Absent, weak, and stolen 49% incorporated malware (+11%) credentials are careening out of control . Gaining quickly, however, is a newcomer to the top three—Physical . After doubling as a percentage of all breaches in 2009, it managed 29% involved physical attacks (+14%) to double again in 2010 . Maybe cybercrime is getting less “cyber”? Misuse and Social, though lower in percentage, were 17% resulted from privilege misuse (-31%) still high in number and provided some amazing examples of misbehavior, deception, and plotting for the highlight reel . 11% employed social tactics (-17%) What commonalities exist? 83% of victims were targets of opportunity (<>) Unfortunately, breaching organizations still doesn’t typically require highly sophisticated attacks, most victims are a target of opportunity rather than choice, the majority of data is stolen 92% of attacks were not highly difficult (+7%) from servers, victims usually don’t know about their breach until a third party notifies them, and almost all breaches are 76% of all data was compromised from servers (-22%) avoidable (at least in hindsight) without difficult or expensive corrective action . We would really, really like to report some 86% were discovered by a third party (+25%) major change here (negative numbers), but our results won’t let us . Though not applicable to all organizations in our sample, 96% of breaches were avoidable through simple or intermediate controls (<>) post-breach assessments of those subject to the PCI-DSS revealed compliance levels that were quite low . 89% of victims subject to PCI-DSS had not achieved compliance (+10%) Where should mitigation efforts be focused? We put our collective minds together and honestly tried to come up with something new to say here, but we just couldn’t Eliminate unnecessary data; keep tabs on what’s left do it . Wait—that’s actually not quite true . We would like to remind organizations that have or manage payment card Ensure essential controls are met input devices (like ATMs, gas pumps, POS terminals, and other kiosks) to check them regularly for signs of tampering and Check the above again skimmers . Related attacks have been increasing over the last few years . Assess remote access services We’re willing to cook up something new if needed, but the Test and review web applications items to the right (and in the Conclusions and Recommendations section) are a healthy part of a balanced diet . Plus, our 2010 Audit user accounts and monitor privileged activity caseload suggests that there are many out there who have not yet tried these dishes and it would be impolite to clear the Monitor and mine event logs table before they’re done . If you’re mainly looking for junk food, plenty of other places serve that . Examine ATMs and other payment card input devices for tampering Bon appetit! 3
  • 5.
    Year in Review,2010 Cloud, Aurora, Mobility, Zeus, APT, Wikileaks, Stuxnet, Anonymous. If a word cloud were created using infosec headlines from 2010, these would certainly be rendered big and bold. It’s an interesting juxtaposition of themes. While the Cloud and mobile devices increasingly allow us to do anything from anywhere with anyone at any time, Aurora, Zeus, Advanced Persistent Threats (APTs), Wikileaks, and Stuxnet remind us of the difficulty of protecting our information assets in a usability-driven world. Because our caseload (and that of the USSS and NHTCU) is a window into that world, one would expect to glimpse aspects of it in this annual report on breach trends. And this year’s DBIR meets that expectation. Apart from the word “Security,” “Cloud” was the next most- We are often asked whether “the Cloud” common word among presentation titles at the 2011 RSA factors into many of the breaches we Conference. It’s definitely in our collective hearts and minds. As such, we are often asked whether “the Cloud” factors into investigate. The easy answer is “No—not many of the breaches we investigate. The question is both really.” It’s more about giving up control of easy and difficult to answer. The easy answer is “No—not really.” our assets and data (and not controlling We have yet to see a breach involving a successful exploit of a hypervisor allowing an attacker to jump across virtual the associated risk) than any technology machines (VMs), for instance. On the other hand, we constantly specific to the Cloud. see breaches involving hosted systems, outsourced management, rogue vendors, and even VMs (though the attack vectors have nothing to do with it being a VM or not). In other words, it’s more about giving up control of our assets and data (and not controlling the associated risk) than any technology specific to the Cloud. While we’re on the topic of giving up control of our assets and data, we might as well touch on mobile devices. This is another oft-asked topic during our breach-related presentations and discussions. The fact of the matter is that mobile computing devices (tablets, smartphones, mobile phones, etc.) are rarely the source of data loss across our caseload. That has a lot to do with the kind of cases we investigate (which tend to involve deliberate breach and compromise situations rather than accidental loss of devices). Plus, this report includes only confirmed incidents of data compromise. The threats to mobile devices are real and we fully expect them to increase and diversify along with the use, uses, and users of such devices. Just consider the effect of the iPad since its debut one year ago; many CxOs who were once technology-indifferent now demand to use their iPads at work. The convenience and functionality of these and other similar devices will drive widespread corporate adoption and security will once again find itself rushing to catch up. Zeus sprouted up within our 2009 caseload, but came to full bloom in 2010. Between the USSS and ourselves, Zeus and its evil business partners, account takeover and transfer fraud, were rampant among consumers and businesses alike. All of these receive further treatment in this report, so we will simply mention it here and move on. 4
  • 6.
    If Zeus showsus that criminals have their minds on our money, Aurora, APTs, Stuxnet, and Anonymous remind us that some threat agents have more than money on their minds. These gave information risk a more sinister, targeted, and personal feel for us all in 2010 (some might add hopeless). Whether these feelings are justified by a significant increase in risk is difficult to discern. Perhaps these feelings are, in fact, justified. Perhaps they are justified only for a subset of us. Maybe risk did not change at all, but our awareness of it changed dramatically. Maybe it’s a nugget of truth surrounded by multiple layers of fear, uncertainty, and doubt. What we do know with certainty is that our 2010 caseload revealed certain characteristics that one might associate with these events. For instance, numbers of public sector victims hit an all-time high. We studied more incidents involving theft of classified information, intellectual property, and other sensitive organizational data than ever before. Simply an artifact of a much larger and more diverse sample caseload rather than a real change? Maybe...or maybe not. APTs deserve some special treatment here. Some will remember that we voiced concern in the 2010 DBIR and subsequent blog posts over the APT hysteria sweeping the security community. We still believe that a “scope creep” exists in the definition of APT. The term’s originators use it primarily in reference to state-sponsored attacks from the People’s Republic of China. Others use it to describe any threat possessing above average skill and determination. The logical outcome of the former is to seriously assess and seriously address security posture within government agencies and the defense industrial base (which is right and good). The logical outcome of the latter is to conclude that “everyone is a target” of APT (which is an oxymoron and leads to irrational fears about the boogeyman while common thieves clean you out of house and home). It is simply not possible for everyone to be a target. It is undoubtedly true (based on investigative experience) that some are the target of state-sponsored attacks (originating from China and/or elsewhere). It is also undoubtedly true (also based on experience) that some who think they are victims of APTs are really the victims of organized criminals, hacktivists, glorified script kiddies, and their own mistakes. Because “APTs” (any definition) are real, it’s time we get real about defining and defending against them. Outside the spotlight of these headlines, however, a very different story played out in 2010. The amount of compromised data hit an all-time low across the combined Verizon and USSS caseload. DataLossDB, the Identity Theft Resource Center, and other sources also show a marked decline in total records lost and exposed. What’s going on? The headlines seem more hopeless than ever yet the numbers (some of them at least) seem almost hopeful. Why the contrast? What’s the “real” 2010? We believe threads of truth exist in both stories. As discussed above, there is some truth behind the headlines. Similarly, data loss figures point to a possible and real change in the motives and tactics used by criminals to steal information. We’ve done our best to relay these stories and statistics within these pages and unpack their core messages and meaning. We hope this effort will play some small part in leading us all to a happier ending in 2011 and beyond. If Zeus shows us that criminals have their minds on our money, Aurora, APTs, Stuxnet, and Anonymous remind us that some threat agents have more than money on their minds. These gave information risk a more sinister, targeted, and personal feel for us all in 2010. 5
  • 7.
    2010: The U.S.Secret Service Perspective The U.S. Secret Service is one of the nation’s oldest federal law enforcement agencies. Established in 1865, the Secret Service was founded to combat the widespread counterfeiting of U.S. currency. Today, the agency’s primary investigative mission continues to be safeguarding the payment and financial systems of the United States. However, the mission has evolved to include combating worldwide financial and computer cybercrimes. Using advanced technologies and task force partnerships, the Secret Service In 2010, the Secret Service computer experts, forensic specialists, investigative experts and intelligence arrested more than 1,200 analysts provide rapid response and criminal information in support of financial analysis, infrastructure protection and criminal investigations. suspects for cybercrime The agency has 118 domestic field offices and 23 foreign offices. The Secret violations. These Service’s 31 Electronic Crimes Task Forces (ECTFs) bring together federal, state and investigations involved local law enforcement agencies, private industry and academic institutions in a over $500 million in actual collaborative effort to respond, confront and suppress cybercrimes. In addition to the ECTFs, the agency continues to build strong partnerships with foreign law fraud loss and prevented enforcement agencies worldwide. approximately $7 billion in Over the past several years the Secret Service has successfully investigated several additional losses. of the largest cybercriminal cases in the U.S. In 2010, the Secret Service arrested more than 1,200 suspects for cybercrime violations. These investigations involved over $500 million in actual fraud loss and prevented approximately $7 billion in additional losses. For example in 2010, Albert Gonzalez received a 20 year prison sentence for his role in the TJX and Heartland Payment System breaches. Maksym Yastremskiy was given a 30 year prison sentence in Turkey as the seller of payment card data for Gonzalez and other cybercriminals. Additionally, Vladislov Horohorin, aka BadB, was arrested in Nice, France on a Secret Service warrant and is currently being extradited to the U.S. BadB was an original founder of the CarderPlanet criminal forum and he had been the largest and well- known trafficker of stolen payment card data for nearly a decade. In a joint investigation with the Netherlands High Tech Crime Unit, the Secret Service provided investigative assistance that led to the take down of the Bredolab Botnet and the arrest of the Botherder nicknamed “Atata” by Armenian authorities. The Secret Service has focused attention on numerous “bullet proof hosters,” who provide web hosting services that allow their customer’s considerable leniency in the types of materials their customers may upload and distribute. Seizures in excess of 200TB of data, belonging to bullet proof hosters, have made the proliferation of malware more challenging for cybercriminals and provided a substantial number of investigative leads. With all these factors taken into account, it is not surprising that the number of compromised records significantly decreased during 2010. After any major investigation and arrest, the cybercriminal underground evaluates what happened and evolves from the lessons learned during the prosecution of their peers. It appears that cybercriminals are currently satisfied with compromising Point of Sale (POS) systems and performing account takeovers and Automated Clearing House (ACH) transaction fraud. There has been an increase in these areas in 2010. In relation to prior years, it appeared that there were more data breaches in 2010, but the compromised data decreased due to the size of the compromised company’s databases. This shows willingness in the cybercriminal underground to go after the smaller, easier targets that provide them with a smaller yet steady stream of compromised data. 6
  • 8.
    There has alsobeen noticeable increase in account takeovers. This can be directly related to the continued rise of the Zeus Trojan and other malware variants created to capture login credentials to financial websites. These account takeovers result in fraudulent transfers from the victim’s account to an account under the control of the perpetrator. The Secret Service and the financial services community are working together to combat this growing trend. The Financial Services Information Sharing and Analysis Center (FS-ISAC) has teamed up with the Secret Service, U.S. Treasury, Department of Justice and many other agencies to create the Account Takeover Task Force (ATOTF). The ATOTF focuses on prevention, detection and response to account takeovers. As cybercriminals continue to adapt and evolve, so will the Secret Service. As seen in the arrests of Yastremskiy, Horohorin, Atata, and others, there is no safe haven for these criminals. 2011 DBIR: Methodology Here we are again—our fourth installment of the DBIR series (sixth if you count the ’08 and ’09 mid-year supplementals). To our readers, it may seem like the 2010 DBIR published ages ago. To us, it feels more like yesterday. The expanding scope and increasing depth of the report makes it almost one continuous effort throughout the year. It is, however, a labor of love and we’re very glad to be sharing our research into the world of data breaches with you once again. We are also very glad to have We are also very glad to have the USSS back with us for the 2011 DBIR. the USSS back with us for the Additionally, we have the pleasure of welcoming the NHTCU to the 2011 DBIR. Additionally, we have team. Through this cooperative effort, we had the privilege—and challenge—of examining about 800 new data compromise incidents the pleasure of welcoming the since our last report. To put that in perspective, the entire Verizon-USSS NHTCU to the team. Through this dataset from 2004 to 2009 numbered just over 900 breaches. We very cooperative effort, we had the nearly doubled the size of our dataset in 2010 alone! privilege—and challenge—of But anyone can put together a large dataset, right? What matters is what that dataset is comprised of, how it was put together, and what examining about 800 new data conclusions we can draw from it. That is precisely what the rest of this compromise incidents since our section attempts to do. last report. Verizon Data Collection Methodology The underlying methodology used by Verizon remains unchanged from that of previous years. All results are based on firsthand evidence collected during paid external forensic investigations conducted by Verizon from 2004 to 2010. The 2010 caseload is the primary analytical focus of the report, but the entire range of data is referenced extensively throughout. Though the Investigative Response (IR) team works a variety of engagements, only those involving a confirmed data compromise are represented in this report. To help ensure reliable and consistent input, all investigators use the Verizon Enterprise Risk and Incident Sharing (VERIS) framework to record case data and other relevant details (fuller explanation of this to follow). The information collected using VERIS is then submitted to members of the RISK Intelligence team for further validation and analysis. During the aggregation process, information regarding the identity of breach victims is removed from the repository of case data. 7
  • 9.
    USSS Data CollectionMethodology In terms of data collection, the USSS methodology differs little from that of Verizon. Agents of the USSS use an internal application based on the VERIS framework to record pertinent case details for inclusion in the DBIR.. To accomplish this, they utilized investigative notes, reports provided by the victim or other forensic firms, and their own experience gained in handling the case. From the numerous cases worked by the USSS during 2010, the scope was narrowed to only those involving confirmed organizational data breaches1 in alignment with the focus of the DBIR. The scope was further narrowed to include only cases for which Verizon did not conduct the forensic investigation2. For the 2010 DBIR, a sample of qualifying USSS cases was included since the scope of data collection spanned multiple years. This year information was collected on a much larger proportion of relevant 2010 cases (those not included mainly consist of ongoing cases and some currently in trial). Thus, this 2011 DBIR covers most of the organizational data breaches investigated by the USSS in 2010. This yielded 667 confirmed data breaches for which information was collected within the timeframe set for this report. As you will see, this larger sample greatly increased the variety of breaches we were able to study, and this, in turn, affects the stats we discuss in this report. The resulting dataset was purged of any information that might identify organizations or individuals involved in the case and then provided to Verizon’s RISK Intelligence team for analysis. NHTCU Data Collection Methodology Like Verizon and the USSS, the NHTCU leveraged VERIS to collect data presented in Appendix A of this report. Verizon RISK team members spent time onsite with the NHTCU to identify cases meeting the criteria for inclusion in the DBIR and to classify those incidents using VERIS. The caseload of the NHTCU is dynamic and varies substantially year by year depending upon various factors. Much of their efforts in 2010 were dedicated to busting up a large child pornography underground and criminal botnet research, investigations, and takedowns. Thus, the number of qualifying corporate breach cases worked in 2010 was not sufficient to use as a standalone dataset3. Therefore, a sample of over 30 qualifying breaches was taken from cases worked over the last several years to enable comparative analysis. For these reasons, NHTCU caseload statistics are not included alongside those of Verizon and USSS in the main body of this report. Appendix A presents these findings and are definitely worth a look. A BRIEF PRIMER ON VERIS VERIS is a framework designed to provide a common language for describing security incidents in a structured and repeatable manner . It takes the narrative of “who did what to what or whom with what result” and translates it into the kind of data you see presented in this report . Because many readers asked about the methodology behind the DBIR and because we hope to facilitate more information sharing on security incidents, we released VERIS earlier this year for free public use . A 4 brief overview of VERIS is available on our website and the complete framework can be obtained from the VERIS community 5 wiki . Both are good companion references to this report for understanding terminology and context . 1 The USSS works many cases related to theft and fraud that are not included in this report. For instance, crimes committed against consumers that do not involve an organization or its assets are not included. Criminal activities that occur after data are stolen (i.e., “white plastic fraud” and identity theft) are also not within the scope of this study. 2 The USSS is often involved in one manner or another with cases worked by Verizon (especially the larger ones). To eliminate redundancy, these cases were removed from the USSS sample. Where both Verizon and the USSS worked a case, Verizon-contributed data were used. 3 Though it should be noted that the NHTCU has hard drives from over one hundred organizations affected by these botnets that almost certainly contain evidence of data compromise. Time did not permit us to examine those drives for this report. 4 http://www .verizonbusiness .com/resources/whitepapers/wp_verizon-incident-sharing-metrics-framework_en_xg .pdf 5 https://verisframework .wiki .zoho .com/ 8
  • 10.
    Classifying Incidents UsingVERIS The Incident Classification section of the VERIS Framework translates the incident narrative of “who did what to what (or whom) with what result” into a form more suitable for trending and analysis. To accomplish this, VERIS employs the A4 Threat Model developed by Verizon’s RISK team. In the A4 model, a security INCIDENT is viewed as a series of EVENTS that adversely affects the information assets of an organization. Every event is comprised of the following ELEMENTS (the 4 A’s): y Agent: Whose actions affected the asset y Action: What actions affected the asset y Asset: Which assets were affected y Attribute: How the asset was affected It is our position that the 4 A’s represent the minimum information necessary to adequately describe any incident or threat scenario. Furthermore, this structure provides an optimal framework within which to measure frequency, associate controls, link impact, and many other concepts required for risk management. If we calculate all the combinations of the A4 model’s highest-level elements, (3 Agents, 7 Actions, 5 Assets, and 6 Attributes), 630 distinct Threat Events emerge. The grid below graphically represents these and designates a Threat Event Number (hereafter referenced by TE#) to each. TE1, for instance, coincides with External Malware that affects the Confidentiality of a Server. Figure 1 . A4 Grid depicting the 630 high-level VERIS Threat Events Malware Hacking Social Misuse Error Physical Environmental Ext Int Prt Ext Int Prt Ext Int Prt Ext Int Prt Ext Int Prt Ext Int Prt Ext Int Prt Conf 1 2 3 4 5 6 7 8 9 10 11 12 13 14 15 16 17 18 19 20 21 Poss 22 23 24 25 26 27 28 29 30 31 32 33 34 35 36 37 38 39 40 41 42 Integ 43 44 45 46 47 48 49 50 51 52 53 54 55 56 57 58 59 60 61 62 63 Servers Auth 64 65 66 67 68 69 70 71 72 73 74 75 76 77 78 79 80 81 82 83 84 Avail 85 86 87 88 89 90 91 92 93 94 95 96 97 98 99 100 101 102 103 104 105 Util 106 107 108 109 110 111 112 113 114 115 116 117 118 119 120 121 122 123 124 125 126 Conf 127 128 129 130 131 132 133 134 135 136 137 138 139 140 141 142 143 144 145 146 147 Poss 148 149 150 151 152 153 154 155 156 157 158 159 160 161 162 163 164 165 166 167 168 Integ 169 170 171 172 173 174 175 176 177 178 179 180 181 182 183 184 185 186 187 188 189 Networks Auth 190 191 192 193 194 195 196 197 198 199 200 201 202 203 204 205 206 207 208 209 210 Avail 211 212 213 214 215 216 217 218 219 220 221 222 223 224 225 226 227 228 229 230 231 Util 232 233 234 235 236 237 238 239 240 241 242 243 244 245 246 247 248 249 250 251 252 Conf 253 254 255 256 257 258 259 260 261 262 263 264 265 266 267 268 269 270 271 272 273 Poss 274 275 276 277 278 279 280 281 282 283 284 285 286 287 288 289 290 291 292 293 294 User Integ 295 296 297 298 299 300 301 302 303 304 305 306 307 308 309 310 311 312 313 314 315 Devices Auth 316 317 318 319 320 321 322 323 324 325 326 327 328 329 330 331 332 333 334 335 336 Avail 337 338 339 340 341 342 343 344 345 346 347 348 349 350 351 352 353 354 355 356 357 Util 358 359 360 361 362 363 364 365 366 367 368 369 370 371 372 373 374 375 376 377 378 Conf 379 380 381 382 383 384 385 386 387 388 389 390 391 392 393 394 395 396 397 398 399 Poss 400 401 402 403 404 405 406 407 408 409 410 411 412 413 414 415 416 417 418 419 420 Offline Integ 421 422 423 424 425 426 427 428 429 430 431 432 433 434 435 436 437 438 439 440 441 Data Auth 442 443 444 445 446 447 448 449 450 451 452 453 454 455 456 457 458 459 460 461 462 Avail 463 464 465 466 467 468 469 470 471 472 473 474 475 476 477 478 479 480 481 482 483 Util 484 485 486 487 488 489 490 491 492 493 494 495 496 497 498 499 500 501 502 503 504 Conf 505 506 507 508 509 510 511 512 513 514 515 516 517 518 519 520 521 522 523 524 525 Poss 526 527 528 529 530 531 532 533 534 535 536 537 538 539 540 541 542 543 544 545 546 Integ 547 548 549 550 551 552 553 554 555 556 557 558 559 560 561 562 563 564 565 566 567 People Auth 568 569 570 571 572 573 574 575 576 577 578 579 580 581 582 583 584 585 586 587 588 Avail 589 590 591 592 593 594 595 596 597 598 599 600 601 602 603 604 605 606 607 608 609 Util 610 611 612 613 614 615 616 617 618 619 620 621 622 623 624 625 626 627 628 629 630 9
  • 11.
    Turning the IncidentNarrative into Metrics As stated above, incidents often involve multiple threat events. Identifying which ones are in play and using them to reconstruct the chain of events is how we model an incident to generate the statistics in this report. By way of example, we describe below a simplified hypothetical incident where a targeted phishing attack is used to exfiltrate sensitive data and intellectual property (IP) from an organization. Figure 2 . Example VERIS incident scenario E1 E2 E3 CE1 E4 External agent sends External agent accesses System administrator failed External agent accesses a a phishing e-mail that Malware infects the exec’s the exec’s laptop via the to enable proper mapped file server from successfully lures an laptop, creating a backdoor backdoor, viewing e-mail authentication when the exec’s laptop and steals executive to open and installing a keylogger . and other sensitive data . building a new file server . intellectual property . the attachment . TE#553 TE#295 TE#256 TE# 56 TE#4 External External External Internal External Social Malware Hacking Error Hacking People User Devices User Devices Servers Servers Integrity Integrity Confidentiality Integrity Confidentiality The flowchart-like figure representing the incident includes four primary threat events and one conditional event (the diamond)6. A brief description of each event is given along with the corresponding TE#s and A4 categories from the matrix exhibited earlier. Once the construction of the main event chain is complete, additional classification can add more specificity around the elements comprising each event (i.e., the particular type of External agent or exact Social tactics used, etc). The incident is now “VERIS-ized” and useful metrics are available for reporting and further analysis. One final note before we conclude this sub-section. The process described above has value beyond just describing the incident itself; it also helps identify what might have been done (or not done) to prevent it. The goal is straightforward: break the chain of events and you stop the incident from proceeding. For instance, security awareness training and e-mail filtering could help keep E1 from occurring. If not, anti-virus and a least privilege implementation on the laptop might prevent E2. Stopping progression between E2 and E3 may be accomplished through egress filtering or netflow analysis to detect and prevent backdoor access. Training and change control procedures could help avoid the administrator’s misconfiguration described in the conditional event and preclude the compromise of intellectual property in E4. These are just a few examples of potential controls for each event, but the ability to visualize a layered approach to deterring, preventing, and detecting the incident should be apparent. The process described above has value beyond just describing the incident itself; it also helps identify what might have been done (or not done) to prevent it. The goal is straightforward: break the chain of events and you stop the incident from proceeding. 6 See the Error section under Threat Actions for an explanation of conditional events. 10
  • 12.
    A Word onSample Bias We would like to reiterate that we make no claim that the findings of this report are representative of all data breaches in all organizations at all times. Even though the merged Verizon-USSS and NHTCU datasets (presumably) more closely reflects reality than either in isolation, it is still a sample. Although we believe many of the findings presented in this report to be appropriate for generalization (and our confidence in this grows as we gather more data and compare it to that of others), bias undoubtedly exists. Unfortunately, we cannot measure exactly how much bias exists (i.e., in order to give a precise margin of error). We have no way of knowing what proportion of all data breaches are represented because we have no way of knowing the total number of data breaches across all organizations in 2010. Many breaches go unreported (though our sample does contain many of those). Many more are as yet unknown by the victim (and thereby unknown to us). What we do know is that our knowledge grows along with what we are able to study and that grew more than ever in 2010. At the end of the day, all we as researchers can do is pass our findings on to you to evaluate and use as you see fit. Results and Analysis Values shown in dark gray pertain to The 2010 combined dataset represents the largest we have ever reported in breaches while values in red pertain to any single year. Verizon investigated 94 incidents in which data compromise data records . The “breach” is the incident under investigation in a case and “records” was confirmed. The USSS worked and submitted a whopping 667. Thus, the refer to the amount of data units (files, results and analysis in this section examine a grand total of 761 breaches. card numbers, etc .) compromised in the The total number of known compromised data records across those breach . If one of these values represents a incidents was 3.8 million. substantial change from prior years, this is marked with a “(!)” symbol . In several places throughout the text, we show and discuss the entire range of data for both organizations (2004-2010 for Verizon, 2007-2010 for the USSS, and 2006-2009 for the NHTCU presented in Appendix A). As with last year, the Table 1 . Key for translating percents and chosen approach is to present the combined dataset intact and highlight numbers for 2009 and 2010 datasets interesting differences (or similarities) within the text where appropriate. There are, however, certain data points that were collected by Verizon but not the 2009 2010 141 breaches 761 breaches USSS; these are identified in the text/figures. 3% 4 23 The figures in this report utilize a consistent format. Values shown in dark gray pertain to breaches while values in red pertain to data records. The 10% 14 76 “breach” is the incident under investigation in a case and “records” refer to 25% 35 190 the amount of data units (files, card numbers, etc.) compromised in the 33% 47 251 breach. If one of these values represents a substantial change from prior 50% 71 381 years, this is marked with a “(!)” symbol. Many figures and tables in this report add up to over 100%; this is not an error. Because the number of breaches in 75% 106 571 this report is so high, the use of percentages is a bit deceiving in some 100% 141 761 places. Where appropriate, we show the raw numbers of breaches instead of or in addition to the percentages. A handy percent to number conversion table is shown in Table 1. Not all figures and tables contain all possible options but only those having a value greater than 0. If you are interested in seeing all options for any particular figure, these can be found in the VERIS framework. Let’s dig in, shall we? 11
  • 13.
    Demographics Demographics, as wehave pointed out in the past, typically proves to be one of the more difficult sections of this report to compose. The challenge lies in the process of attempting to attribute broader meaning to the statistics generated each year. Clearly, all results are dependent upon our annual investigative casework, but one always wonders if the demographic data has greater secrets to tell us if we could only decipher them. For instance, it may or may not be relevant or indicative of a growing trend if one industry vertical shows a higher rate of attack than another, or if organizations in a certain geographical area appear to be targeted more frequently. Ultimately, we may not be able to discern micro-trend from macro-trend, but demographic data undoubtedly helps set the stage for interpreting breach statistics from 2010 (and we suspect, as you will see throughout this report, perhaps even beyond). Criminals may be making a classic risk vs. reward decision and opting to “play it safe” in light of recent arrests and prosecutions following large- scale intrusions into Financial Services firms. Numerous smaller strikes on hotels, restaurants, and retailers represent a lower-risk alternative, and cybercriminals may be taking greater advantage of that option. We live in a world absolutely saturated with information, so it is hardly surprising that breaches continue to happen in a widely diverse group of organizations scattered over a geographically disparate area. However, this year, as we have seen in the past, some types of organizations appear to be singled out more so than others. As you can see in Figure 3, the top three victim verticals remain the same year in and year out. They just switch places occasionally, as they did this year with Hospitality (mostly hotels and restaurants) regaining the number one spot, followed by Retail, which was itself followed very closely by Financial Services. Our readers might think they are looking at the 2008 DBIR since the results closely resemble those found in that report (it’s okay, folks; this is the 2011 DBIR—though at least one of us did wear a circa 2008 Three Wolf Moon shirt during the drafting of this report). This rise of breaches in the Hospitality and Retail sectors is one of those areas where we do suspect the numbers reflect trends broader than this immediate caseload. Typically, such organizations represent smaller, softer, and less reactive targets than, for instance, financial institutions. Criminals may be making a classic risk vs. reward decision and opting to “play it safe” in light of recent arrests and prosecutions following large-scale intrusions into Financial Services firms. Numerous smaller strikes on hotels, restaurants, and retailers represent a lower-risk alternative, and cybercriminals may be taking greater advantage of that option. Supporting evidence for this theory will be presented throughout this report. 12
  • 14.
    Figure 3 .Industry groups represented by percent of breaches Hospitality 40% (!) Retail 25% (!) Financial Services 22% Government 4% Manufacturing 2% Tech Services 2% Business Services 1% Healthcare 1% Media <1% Transportation <1% Other 2% As is usually the case, there was quite a chasm between the top three industries and the rest of the pack. Leading that second tier was Government, credited with 4% of breaches. This is on par with past reports from a percentage standpoint, but it is important to note the scaling factor that comes in to play here. In 2009, that was 4% of 141 total or 6 breaches. 2010’s equal-sounding 4% (3.5%, actually) corresponds to a much-higher 27 breaches since the total caseload expanded to 761. So, while percentage points suggest “no change,” we actually investigated four-fold more government breaches than before. Keep this in mind, because that same math applies to all “smaller” percentages in the report. Certainly, an interesting change this go around is that unlike previous years in which 90% or Figure 4 . Compromised more of records lost were derived from financial services targets, 2010 exhibited a much more records by industry group (!) even distribution. The main factor in this shift is the lack of “mega-breaches” in our combined 9% All Others caseload. Many incidents involving the compromise of multi-millions of records (or more) in the last few years occurred in financial institutions. Without one or two of these skewing the results, things naturally balance out a bit more. Another factor to consider is that criminals Financial 35% Services seemed to gain interest in stealing data other than payment cards. Account takeovers, theft of IP and other sensitive data, stolen authentication credentials, botnet activity, etc. (which are typically less mega-breach-able) affected firms at increased rates in 2010. With regard to organizational size, this caseload shows a substantially higher concentration of smaller organizations and franchises. However, we once again remind readers to consider differences of scale. Though the percentages obscure this fact, we Retail & investigated almost twice as many breaches affecting organizations in the 1,000-10,000 56% Hospitality employee range than in 2009 (26% in ’09 and 8% in ’10…you can do the math). 13
  • 15.
    Table 2 .Organizational size by number Therefore, one should not conclude that larger organizations were breached less often in of breaches (number of employees) 2010, but rather we saw a virtual explosion of breaches involving smaller organizations 1 to 10 46 (which were often small independent franchise locations of large organizations). Plus, our greatly expanded window into the world of data breaches (courtesy of the USSS) allowed 11 to 100 436 (!) us to see a bigger sample of organizations that would not normally contract a third party 101 to 1,000 74 forensic firm. Law enforcement, thank goodness, is no respecter of size and works all 1,001 to 10,000 49 reported breaches. One final observation before we conclude this paragraph is that Table 2 10,001 to 100,000 59 is actually closer than our previous reports to a realistic size distribution for organizations (not just breach victims). Small to medium businesses typically comprise the vast majority Over 100,000 55 of firms in most economies. With our continuing inclusion of data from organizations such Unknown 40 as the USSS and the NHTCU we will probably continue to see more representative numbers with regard to organizational size. Obviously, data breaches are not a country or region-specific phenomenon; they can occur anywhere that information traverses or resides. That’s not to say that no regional differences and trends exist, because they most certainly do (though they are often not as amplified as we tend to think). As Figure 5 shows, Verizon and the USSS investigated breaches occurring in many places around the world in 2010. For those keeping track, the map shows more countries highlighted than ever before. Roughly one-third of Verizon’s cases were worked across the greater European and Asia-Pacific regions (split fairly evenly, but with a slight tilt toward APAC). Appendix A, which isolates breaches worked by the NHTCU, is a must-see for those interested in European breach statistics. In North and South America, most breaches occurred in the United States, but other countries in those regions are represented in Figure 5 as well. The USSS’ casework was, of course, primarily focused within the continental United States though investigating and prosecuting the criminals behind them takes them all over the world. While these case statistics are certainly dependent upon the firm working them, they also have much to do with the differences in international laws governing disclosure. Higher numbers of known breaches in one area of the world does not mean it is any more a hotbed of crime than other parts of the globe. In many cases, it is simply the result of mandatory breach notification and subsequent investigation. Figure 5 . Countries Represented in 2010 Caseload Countries in which a breach was confirmed Australia Mexico Belgium Netherlands Canada New Zealand China Phillipines Czech Republic Poland Dominican Russia Republic Spain Ecuador Sweden France Taiwan Germany United Kingdom Greece United States Japan Countries in which a breach was investigated but not confirmed Ghana Luxembourg Ireland Switzerland Italy United Arab Emirates 14
  • 16.
    2010 Threat EventOverview We typically present statistics for Agents, Actions, Assets, and Attributes (though we focus on Confidentiality because this report is about data breaches) in separate sections of the DBIR. That structure remains in this report, but we wanted to show a different representation to tie it all together and give readers a view of the big picture. Plus, it is good to remember that agents are not disassociated from their actions or the assets and attributes they affect. Figure 6 is a modified version of Figure 1 presented in an earlier section, but rather than TE#s, it tallies the total number of breaches in which each Threat Event was part of the incident scenario. If the 761 breaches contained in the 2010 Verizon-USSS caseload can be boiled down to one single image, this is our best concept of it. Many observations could be made from this, but we’ll start by highlighting a few of them. From a threat management standpoint, it is interesting that only 55 of the 630 possible threat events have a value greater than 0. This means over 90% of the threat-space was not in play at all. Furthermore, even among the 9% that were observed, frequency counts gravitate toward a smaller subset of dominant threat events. Tables 3 through 5 expand on this and list the top 10 events in the combined, Verizon, and USSS datasets. Figure 6 . A4 Grid depicting the frequency of VERIS Threat Events across 2010 caseload Malware Hacking Social Misuse Error Physical Environmental Ext Int Prt Ext Int Prt Ext Int Prt Ext Int Prt Ext Int Prt Ext Int Prt Ext Int Prt Conf 319 1 369 10 50 1 1 Poss Integ 323 1 353 2 3 43 Servers Auth 2 16 2 3 16 Avail 3 4 2 1 Util Conf 1 1 11 Poss Integ 1 1 11 Networks Auth Avail Util Conf 214 1 174 2 4 201 Poss User Integ 214 2 173 3 201 4 Devices Auth 2 2 2 1 Avail 2 1 Util Conf 1 87 1 1 Poss Offline Integ 1 Data Auth Avail Util Conf 8 1 Poss Integ 72 24 People Auth Avail Util None Least frequent Most Frequent From a threat management standpoint, it is interesting that only 55 of the 630 possible threat events have a value greater than 0. This means over 90% of the threat-space was not in play at all. 15
  • 17.
    It is fascinatingthat the top four threat events in Table 3: Top 10 VERIS Threat Events, combined caseload both caseloads are the same and involve external Threat Event Threat Event Counts agents hacking and installing malware to 1 External .Hacking .Servers .Confidentiality TE #4 369 compromise the confidentiality and integrity of 2 External .Hacking .Servers .Integrity TE #46 353 servers. Think about it—out of 630 possibilities, 3 External .Malware .Servers .Integrity TE #43 323 what is the likelihood that two completely different 4 External .Malware .Servers .Confidentiality TE #1 319 datasets “just happen” to share the four most 5 External .Malware .UserDevices .Confidentiality TE #253 214 common events? These results may surprise some 6 External .Malware .UserDevices .Integrity TE #295 214 since internal agents and misuse were so prominent in the 2009 report, but we’ll get into that later. Some 7 External .Physical .UserDevices .Confidentiality TE #268 201 may also wonder about the presence of integrity, 8 External .Physical .UserDevices .Integrity TE #310 201 but should consider that the installation of malware 9 External .Hacking .UserDevices .Confidentiality TE #256 174 and many other actions taken by attackers 10 External .Hacking .UserDevices .Integrity TE #298 173 (configuration changes, adding users, altering logs, etc.) introduce unauthorized modifications to the systems involved. Table 4 . Top 10 VERIS Threat Events, Verizon caseload It is fascinating that the top four Threat Event Threat Event Counts 1 External .Hacking .Servers .Confidentiality TE #4 63 threat events in both caseloads are 2 External .Hacking .Servers .Integrity TE #46 56 the same and involve external agents 3 External .Malware .Servers .Integrity TE #43 42 hacking and installing malware to 4 External .Malware .Servers .Confidentiality TE #1 37 5 External .Malware .UserDevices .Integrity TE #295 22 compromise the confidentiality and 6 External .Malware .UserDevices .Confidentiality TE #253 21 integrity of servers. Think about it— 7 External .Hacking .UserDevices .Confidentiality TE #256 13 out of 630 possibilities, what is the 8 External .Hacking .UserDevices .Integrity TE #298 12 9 Internal .Misuse .Servers .Confidentiality TE #389 7 likelihood that two completely 10 External .Social .People .Integrity TE#553 5 different datasets “just happen” to share the four most common events? Table 5 . Top 10 VERIS Threat Events, USSS caseload After the top four, the Verizon and USSS caseloads diverge a bit. The USSS investigated a large number Threat Event Threat Event Counts of cases involving tampering with and extracting 1 External .Hacking .Servers .Confidentiality TE #4 306 data from ATMs, gas pumps, and POS terminals. 2 External .Hacking .Servers .Integrity TE #46 297 This accounts for the prevalence of External. 3 External .Malware .Servers .Confidentiality TE #1 282 Physical.UserDevices.X events, which will be 4 External .Malware .Servers .Integrity TE #43 281 discussed later in this report. Toward the bottom of 5 External .Physical .UserDevices .Confidentiality TE #268 200 the list, the two caseloads come back into 6 External .Physical .UserDevices .Integrity TE #310 200 agreement around external agents hacking user 7 External .Malware .UserDevices .Confidentiality TE #253 193 devices (which is often done to gain an initial 8 External .Malware .UserDevices .Integrity TE #295 192 foothold as part of the larger attack). We hope you 9 External .Hacking .UserDevices .Confidentiality TE #256 161 enjoyed this short digression and we now return 10 External .Hacking .UserDevices .Integrity TE #298 161 to our regularly scheduled programming. 16
  • 18.
    VERIS Classification Note:If the agent’s Threat Agents role in the breach is limited to a contributory error (see explanation in the Error Threat agents refer to entities that cause or contribute to an incident. There can be sub-section under Threat Actions), the agent more than one agent involved in any incident and their involvement can be malicious would not be included here . For example, if an insider’s unintentional misconfiguration or non-malicious, intentional or accidental, direct or indirect. Critical to any forensic of an application left it vulnerable to attack, the insider would not be considered an investigation is to identify the source of the breach, not only for purposes of response agent if the application were successfully and containment, but also for implementing current and future defensive strategies. breached by another agent . An insider who deliberately steals data or whose Verizon recognizes three primary categories of threat agents—External, Internal, inappropriate behavior (i .e ., policy violations) facilitated the breach would and Partner. be considered an agent in the breach . External: External threats originate from sources outside the organization and its network of partners. Examples include lone hackers, organized crime groups, and government entities, as well as environmental events such as weather and earthquakes. Typically, no trust or privilege is implied for external entities. Internal: Internal threats are those originating from within the organization. This encompasses company executives, employees, independent contractors (i.e., 1099 staff ), interns, etc., as well as internal infrastructure. Insiders are trusted and privileged (some more than others). Partners: Partners include any third party sharing a business relationship with the organization. This includes suppliers, vendors, hosting providers, outsourced IT support, etc. Some level of trust and privilege is usually implied between business partners. Figure 7 displays the distribution of threat agents among breach cases worked by Verizon and the USSS in 2010. Veteran DBIR readers will almost certainly recognize the much lower percentage of internal breaches compared to what was presented in our last report. Except for partner, these results more closely resemble those from two years ago (and prior) than 2009. Why the roller coaster time machine? First of all, readers should remember to be careful when drawing conclusions from statistics without exploring the root issues and trends behind them. Many interpreted the more than doubling of internal breaches reported in last year’s DBIR as proof that insider threat was rocketing upward. This was probably stoked somewhat by rumors and reports at the time of a poor economy driving employees to desperate acts of crime. In point of fact, the apparent “increase” was due to incorporating the USSS dataset, which had a higher proportion—but actually a decreasing trend—of insider breaches. The Verizon trend line for internal incidents was flat. Figure 7 . Threat agents (inclusive) by percent of breaches These results are not so much a decrease 92% in internal agents as much as they are a 91% comparatively huge increase in external agents. Figure 7 has similar potential for interpretive pitfalls. At 17% of all breaches, illicit insider activity is near an all-time low. Does this mean that insiders are a concern of yesteryear? Not likely. These results are not so much a decrease in internal agents as much as they are a comparatively huge increase in external agents. Or, perhaps, it is simply that our window into the world of 17% (!) external threats is simply much larger than it was a year before. Either way, 16% <1% the raw number of breaches attributed to outsiders exploded within the External Internal Partner USSS’ 2010 caseload, and skewed slightly more in that direction in Verizon’s as well. Suspected 17
  • 19.
    External agents have Wehypothesize this rise in the past year reflects an ongoing industrialization process of sorts in attack methods used by certain groups of external agents, most notably created economies of scale financially motivated organized criminals. They have created economies of scale by by refining standardized, refining standardized, automated, and highly repeatable attacks directed at smaller, automated, and highly vulnerable, and largely homogenous targets. That’s not to say all external attacks fall into this category, but this was where much of the growth occurred between our repeatable attacks directed 2009 and 2010 caseloads. Several cases worked by the USSS spanned numerous at smaller, vulnerable, and organizations victimized by the same attacker or group. For instance, at least 140 breaches from 2010 were tied to a single individual using the exact same methods. largely homogenous targets. Even more astounding is that several hundred more have been discovered and linked to him already in 2011 (not included in this report). Figure 8 . Threat agents over time by percent of breaches 100% 90% 80% 70% 60% VZ External 50% VZ Internal 40% VZ Partner 30% USSS External 20% 10% USSS Internal 0% USSS Partner 2005 2006 2007 2008 2009 2010 Insider attacks, fortunately, are not so scalable. They can target their employer and perhaps some of its partners or customers, but not typically in the manner or to the extent described above. Thus, in a 2010 caseload expanded by these mass external operations, breaches involving internal agents declined as a percentage of total cases. One should keep in mind, however, that the actual number of insider incidents was almost twice as large. This information would suggest that the insider threat is still present and not declining; it just didn’t increase as much as external threats. We hope these results will be viewed with the above in mind. With that horse sufficiently flogged, let’s move on to partners. Although the previous discussion can also explain the drop in percentage of breaches attributed to business partners, 2010 seems to continue a legitimate downward trend that began in 2008. We hypothesized in previous years that this may be due to increased regulation, heightened awareness, more assessments, better technology, or combinations of these (maybe even something else entirely). What has not declined are the number of incidents in which partners were “in the picture” for circumstances surrounding the breach. By this we mean that the partner was not an active (or causal) threat agent, but they were responsible for hosting, managing, securing, etc. the systems involved. More discussion on these scenarios can be found in the Partner and Error sections of this report. 18
  • 20.
    Reviewing Figure 9,which contrasts single and multi-agent Figure 9 . Threat agents (exclusive) by percent of breaches breaches, we can make a few observations about these 83% 7% <1% 9% results. The 9% of cases involving more than one agent is well below that of 2008 and 2009. In prior years, the multi- agent breaches worked by Verizon exhibited an External- Partner combination. Verizon’s 2010 data mirrors that most External only Internal only Partner only Multiple agents often shown in the USSS data, which is an External-Internal pairing. This often involves an outsider colluding with an insider to embezzle or skim data and/or funds, but also includes scenarios such as an insider breaking web use policy, picking up malware, and then having their machine used as a base camp by external attackers. Breach Size by Threat Agents The amount of data compromised certainly does not capture the full impact of a breach, but it is, at least, an indicator of it. It is also something that can (ordinarily) be measured by investigators during the normal scope of an engagement. We would love to collect more information on the financial impact of breaches we investigate, but such is not our primary objective (though it is one of the most requested additions to this report). Additionally, by the time the full consequences are known to the client (if they ever are), we’re long gone. Figure 10 . Compromised records by threat agent, 2010 Figure 10 records the distribution of the 3.8 million records compromised across the merged 2010 dataset among 3,838,549 15,971 4 23,846 threat agents. The effect reveals even larger disparity than we typically see; the data loss inflicted by External agents continues to far outweigh that done by insiders and partners. It’s interesting to note that while a few mega- External only Internal only Partner only Multiple agents breaches always helped tip the scales toward outsiders in years past, 2010 is different. Instead, the same result was achieved in a caseload lacking huge breaches but rife with Figure 11 . Compromised records by threat agent, 2004-2010 many smaller external breaches. Still, the total number of records depicted in Figure 10 pales in comparison to 804,559,200 28,869,798 43,744,577 46,475,750 those in previous years, which is why Figure 11 (showing the overall tally since we began collecting data in 2004) hasn’t changed much since our last report. External only Internal only Partner only Multiple agents Another important facet of this metric to consider is the various types of data compromised. Some, like payment card numbers and personal information are often stolen in bulk, whereas criminals may only target a few documents comprising intellectual property and classified data. Data types quantify differently as well as have varying levels of value to the breached organization. IP for instance may be low in the number of records, but have a much higher financial impact. Based on data from this past year, insiders were at least three times more likely to steal IP than outsiders. Is that enough to make insiders the most impactful category of agent in 2010? We honestly cannot answer that, but it is possible. 19
  • 21.
    External Agents (92%of breaches, 99+% of records) Figure 12 . Role of external agents by percent of breaches As discussed in the previous section, external threat agents are the dominant force in both within External percentage of breaches and percentage of compromised records. Almost all of them acted Unintentional (0%) 6% Indirect against the victim organizations deliberately and maliciously. While external agents can unintentionally cause harm, the subject of this report is such that those we observe usually have sinister motives. Zooming in to review the various types of external threat agents observed in 2010, we see in Table 6 that the primary offenders remain unchanged from the previous year. Organized criminal groups (58%) led the list, followed by unaffiliated person(s) (40%), with all others trailing a good distance behind. Both of the former increased rather dramatically, from 24% and 21% respectively in 2009. This effect has much to do with the aforementioned 94% Direct “industrialization” and scaling tactics observed among external breaches. The USSS dataset in particular shows quite a few remarkable examples of attacks replicated by the same group or individual across dozens of victims. Should we conclude that organized criminals tried harder (hit more victims) but were less successful (stole less data)? This may or may not be true, and there’s a chance they might actually be more successful overall if measures other than record counts are considered. When examining compromised records for organized criminals, we see a different picture than the one we have come to know (and dis-love). Prior reports pinned upwards of 80-90+% of all stolen data on the activity of these groups; here they declined to a little over 50%. Should we conclude that organized criminals tried harder (hit more victims) but were less successful (stole less data)? This may or may not be true, and there’s a chance they might actually be more successful overall if measures other than record counts are considered. For instance, many of the perpetrators of the largest known breaches are living behind bars now (not considered by most to be a high quality of life). An approach using a standardized methodology to take a little data from a lot of organizations may help achieve a decent (or indecent, rather) living while avoiding incarceration (at least for a time). Table 6 . Types of external agents by percent of breaches within External The “unaffiliated person(s)” label is used when the perpetrator is identified, but there are no known associations between that individual and larger organized Organized criminal group 58% (!) criminal groups, governments, activist groups, etc. They are, apparently at least, Unaffiliated person(s) 40% (!) acting alone. Growth in activity from this type of external agent may signal a growing entrepreneurial spirit and/or lessening co-dependency amongst Former employee 2% (no longer had access) criminals. It could be that the canned tools used to attack POS systems, for Competitor 1% instance, may be maturing to the point that even “script-kiddies” can use them. Unknown 14% Another take is that they are not, in fact, acting alone, but are rather “guns for hire” for some other entity lurking behind the shadows. If true, this has its own Other <1% set of implications. We will surely be watching to see if this trend continues over the next few years. 20
  • 22.
    The number ofexternal agents categorized as “unknowns” dropped this year compared to last year, which can mainly be attributed to the USSS, as they were able to successfully identify (and in many cases arrest and prosecute) the criminals. A greater percentage of the unknown agents were found in the Verizon incidents. There are two main reasons for this. First, a considerable number of clients kept insufficient log information to successfully identify the attacker; it simply can’t be determined by forensics alone. This is in part due to the demographics of the 2010 caseload; smaller organizations are less likely to have the resources or the expertise to manage their IT infrastructure. The second reason is that many victim organizations do not wish to expand the investigation to include this line of inquiry when the attack has already been successfully mitigated. Similar to “unaffiliated person(s),” one wonders about their true agenda and alliegances. Lastly, we wanted to mention another group of external agents that are sometimes lumped in with insiders—that is, former employees. There is some grey area around exactly when an employee (internal agent) becomes a former employee (external agent) and the classification depends on the individual’s employment status with the organization when the breach occurred as opposed to when it was discovered or investigated. In our recent casework, we observed several examples involving former employees stealing data from their ex-employer. One of them sold their shared administrative credentials on the black market, which resulted in authorized access soon after. Since these credentials were still shared among active employees, they weren’t disabled as this individual left. Another stole data while employed, nabbed more after leaving, and then extorted their former organization. Yet another sold their knowledge about the inner workings of a system to a competitor. Several others were nice enough to continue visiting the internal network occasionally to catch up on the latest developments and gossip. Deprovisioning of user accounts, anyone? Origin of external agents Ascertaining the geographic origin of external agents generally suffers from problems with making this determination based upon IP addresses. Even when the country of the source IP(s) can be accurately pinpointed, it is often not the country where the actual attacker resides, but rather a host in a botnet or just another “hop” used by the real culprit. In some cases, however, various types of additional information help refine or corroborate IP-based geolocation. All Figure 13 . Origin of external agents by percent of breaches these issues aside, knowing the origin of within External attacks (whether immediate or ultimate) is still very useful for many reasons. Europe-East (incl. Russia, Turkey) 65% (!) For 2010, Figure 13 shows a similar order of Americas-North 19% regions as in years past, except there is a striking Asia-South/Southeast 6% jump in the percentage of incidents originating from Eastern Europe. North America is the Africa 4% runner-up, but it was by a much wider margin Asia-East 3% (!) than before. The disparity was largely due to the Europe-West (incl. Northern, Southern) 2% widespread and prolific attacks from organized criminal groups typically hailing from Eastern Americas-Central <1% Europe. Conversely, many of the unaffiliated and Middle East <1% unidentified agents originate from Asia, which is Oceania (Australia, New Zealand, etc.) <1% in the three spot. In the individual Verizon dataset, North America is the main source Americas-South <1% followed by East Asia and Eastern Europe. This Asia-Central 0% leaves little doubt as to the origin of the majority Unknown 12% of breaches worked by the USSS. 21
  • 23.
    Figure 14 .Role of internal Internal Agents (17% of breaches, 1% of records) agents by percent of breaches within Internal Mentioned already in the overview to the Threat Agents section, the reduction of insider <1% Unintentional breaches from 48% to 17% is more of a function of the greater number of outsiders 6% Inappropriate represented in this year’s cases. Last year we discussed that many hypothesized we would begin to see an uptick in the number of insider attacks due to the financial strain created by the global economic conditions. In reviewing the trends in both the Verizon and USSS caseloads, if it is happening, we are not seeing the consequences of it quite yet. A counter argument can be made that because of the global economic conditions and the competitive job market, insiders have placed more value on their trusted employment and benefits. Fear of losing your job changes the risk versus reward model for committing or conspiring to commit a crime in the workplace. 93% Deliberate Insiders can cause or contribute to breaches in all sorts of ways. For classification purposes, we group these into three major buckets. They either acted deliberately and maliciously, inappropriately but not maliciously, or unintentionally without malice. Much like last year, investigators determined that nearly all internal breaches (93%) were the result of deliberate malicious activity. This may seem odd, but one should remember that we’re specifically discussing data loss cases investigated by either a third party forensics group (Verizon) or a law enforcement agency (USSS). Also keep in mind that if the insider’s only involvement was related to a conditional event7, they are not considered a primary threat agent and thus not depicted in the statistics above. For the second year in a row, it is regular employees and end-users—not highly trusted ones—who are behind the majority of data compromises. That ratio was roughly even in our first two reports, but since the addition of the USSS cases, lesser-privileged insiders are increasingly dominant. Examples of regular employees represented by the 88% shown in Table 7 spanned corporate end-users, bank tellers, cashiers, waiters, and others among the rank and file. These For the second year in a row, it is regular employees aren’t normally escalating their privileges in order to employees and end-users—not highly steal data because they don’t need to. They simply take advantage of whatever standard user privileges were granted to them by their trusted ones—who are behind the organizations . This is a good time to remember that users need not majority of data compromises. This is be superusers to make off with sensitive and/or valuable data. Case findings suggest that regular employees typically seek “cashable” a good time to remember that users forms of information like payment card data, bank account need not be super users to make off with numbers, and personal information. sensitive and/or valuable data. The proportion of internal breaches tied to more privileged and trusted employees like executives, system administrators, and developers totals about 12% (less than half of what it was in 2009). When those in such positions are involved with breaches, case history shows they usually steal larger quantities and more valuable forms of information. This makes a lot of sense in that highly privileged and senior employees have the “keys to the kingdom” as they say. 2010, however, did not follow the pattern of history (maybe someone changed the locks?). 7 See the Error section under Threat Actions for an explanation of conditional events. 22
  • 24.
    System and networkadministrators stole far less information than regular Table 7 . Types of internal agents by percent of breaches within Internal employees. Executives, usually linked to the theft of IP and other sensitive organizational information, did not take significantly more of such data Regular employee/end-user 85% (!) than other types of employees. Why? To be honest, we’re not sure. It may have to do with a higher-than-normal percentage of cases for which we Finance/accounting staff 22% were not able to ascertain the total amount of data loss. We do think the Executive/upper management 11% principle still holds and this is likely just an odd characteristic of this Helpdesk staff 4% year’s caseload. System/network administrator 3% Finance and accounting staff represent a kind of in-between group in Software developer 2% relation to those above with respect to privilege and trust. They were tied to nearly twice the percentage of breaches in 2010 as in 2009. Their Unknown 1% position involves the oversight and management of accounts, records, Other(s) 1% and finances, which gives them greater opportunity to engage in illicit activity of various sorts. It’s worth the time to make a quick point on the types of assets targeted by insiders. Our data shows that external agents target servers and applications and end-user systems most of time. The assets targeted by insiders vary between all types of assets. We believe this is one the (many) reasons that insider threat is difficult to control. They have access to a plethora of assets and know where and how to obtain data from them. Partner Agents (<1% of breaches, <1% of records) In comparison to previous years, breaches stemming from business partners declined sharply (based on partners identified as a primary threat agent). There were only three (yes, 3) of them in the entire combined 2010 caseload. How does one write a section about three events? Answer: One doesn’t. Instead, we’ll simply mention what they were and then briefly clarify other ways in which partners factored into breaches but did not cause them. There were two instances of partner error and one of misuse resulting in data compromise in 2010. One acted deliberately and maliciously (Misuse) and the other two acted unintentionally (these are touched on in the Error section). Extending the conversation from partners as threat agents to partners that factor into or relate to the breach in other ways gives us something more to talk about. First, partners can contribute to a conditional event within the broader incident scenario. Conditional events create circumstances or conditions that—if/when acted upon by another agent—allow the primary chain of threat events to progress. In this respect, they are more akin to vulnerability than threat (which is why partners involved in them are not considered primary threat agents). In 2010, partners contributed to conditional events in a sizeable 22% of incidents. A common example of this is in the retail and hospitality industries where a remote vendor responsible for managing a POS system neglects to change the default credentials, leaving it vulnerable to attack. Something else to consider, a good number of assets involved in 2010 breaches were either hosted or managed by a partner. This fact may have had absolutely nothing at all to do with the incident, but it is a partner-related datapoint and worth tracking and monitoring over time. All in all, what was said last year remains true; organizations that outsource their IT infrastructure and support also outsource a great deal of trust. A partner’s security practices—often outside the victim’s control or expertise—can factor into breaches in various ways. Third party policies, contracts, controls, and assessments should account for this. 23
  • 25.
    Threat Actions Threat actionsdescribe what the threat agent did to cause or to contribute to the breach. The majority of incidents involve multiple threat actions in one or more categories (this is why the items in Figure 15 sum to more than 100%). VERIS defines seven primary categories of threat actions, which are shown below along with the percent of breaches and compromised records associated with each. Figure 15 . Threat action categories by percent of breaches and percent of records Malware 49% / 79% Hacking 50% / 89% Social 11% / 1% Misuse 17% (!) / 1% Physical 29% (!) / 10% Error <1% / <1% Environmental 0% / 0% 2010 witnessed a fair degree of shuffling among the threat categories. Misuse had a three-fold decrease and dropped from the top spot down to 4th place. Hacking and malware (#2 and #3 in 2009) each bumped up one notch to #1 and #2. Physical doubled as a percentage of all breaches and sits in the #3 position. Social is no longer in the top three, falling from 28% to 11%. The “also rans” of Error and Environmental are still bringing up the rear. Now let’s see if we can figure out what all the shuffling is about. That Hacking and Malware are once again the most common threat actions may come as no surprise to our long-term readers. After all, they’ve simply regained what has been theirs all along before the usurper, Misuse, dethroned them in last year’s report. That Hacking and Malware are once again the most common threat actions may come as no surprise to our long-term readers. After all, they’ve simply regained what has been theirs all along before the usurper, Misuse, dethroned them in last year’s report. When one considers the circumstances surrounding this dethronement, however, it is actually quite a surprising result. The rise of Misuse in the 2010 DBIR corresponded to the addition of the USSS caseload, which was very heavy in insider misuse. The caseload examined in that report represented a semi-even ratio between Verizon and the USSS (57 cases from Verizon, 84 from the USSS). Since the caseload for the 2011 report is nowhere near an even ratio (94 cases from Verizon, 667 from the USSS), logic would hold that the percentage of Misuse would be astronomically higher than anything else. Viewed in this light, one can see why the fall of Misuse is a very interesting development indeed. 24
  • 26.
    Figure 16 .Threat action categories over time by percent of breaches (Verizon cases) 80% 70% Malware 60% Hacking 50% Social 40% Misuse 30% Physical 20% 10% Error 0% Environmental 2005 2006 2007 2008 2009 2010 The reasons behind the rise of Hacking and Malware are one and the same as those behind the rise of External threat agents, so we won’t go over it again in full here. Suffice it to say that the “industrialization” trend we discussed in which standardized, scalable, and automated attacks—which incorporated actions falling under the Hacking and Malware categories—are iterated across numerous victims drove up the numbers in these categories. The effect of this shift is very apparent in Figure 17 showing trends for the USSS over time. Though very different in the nature of attack, the doubled percentage of breaches in the Physical category has roots in a similar trend. Rather than remote automated attacks, efficient techniques for locally installing skimming devices on hundreds of credit card input devices (ATMs, gas pumps, POS systems) were used against many organizations. The USSS investigated quite a few cases of this sort, some of which covered many victims in wide geographic regions across the U.S. and Europe. A methodology disclaimer is important to mention here. In 2009, the physical Figure 17 . Threat action categories over time by percent of breaches (USSS cases) tampering/skimming cases we 90% received from the USSS were not of the large multi-victim variety. Some 80% involved a large number of affected 70% Malware devices, but they all belonged to one 60% Hacking victim (or we were unable to determine 50% how many unique victims or incidents Social 40% were involved). Therefore, we believe Misuse that at least some of the rise in physical 30% attacks in this 2010 caseload is due to Physical 20% increased sample size, higher visibility Error 10% into each case, and improved ability to 0% Environmental recognize and split out cases affecting multiple victims into distinct incidents. 2007 2008 2009 2010 25
  • 27.
    Figures relating tocompromised records were comparatively more stable across all threat categories in 2010. Hacking and Malware were still the dominant duo of data loss, though slightly less so than in previous years. The only other category responsible for a significant amount of loss was Physical. In the spirit of the 2009 Supplemental DBIR, Table 8 lists the top 15 most prevalent threat action types (not categories) in 2010 along with their frequency (percent of breaches) and impact (percent of records). The information recorded in Table 8 is also represented in Figure 18 with the percentage of breaches (frequency) along the x-axis and percentage of compromised records (impact) along the y-axis. We will leave you to mull over these at your convenience and move on to a more in-depth analysis of each threat action category. Table 8 . Top 15 Threat Action Types by number of breaches and number of records Category Threat Action Type Short Name Breaches Records 1 Malware Send data to external site/entity SNDATA 297 1,729,719 2 Malware Backdoor (allows remote access / control) MALBAK 294 2,065,001 3 Hacking Exploitation of backdoor or command and control channel HAKBAK 279 1,751,530 4 Hacking Exploitation of default or guessable credentials DFCRED 257 1,169,300 5 Malware Keylogger/Form-grabber/Spyware (capture data from user activity) KEYLOG 250 1,538,680 6 Physical Tampering TAMPER 216 371,470 7 Hacking Brute force and dictionary attacks BRUTE 200 1,316,588 8 Malware Disable or interfere with security controls DISABL 189 736,884 9 Hacking Footprinting and Fingerprinting FTPRNT 185 720,129 10 Malware System/network utilities (PsTools, Netcat) UTILITY 121 1,098,643 11 Misuse Embezzlement, skimming, and related fraud EMBZZL 100 37,229 12 Malware RAM scraper (captures data from volatile memory) RAMSCR 95 606,354 13 Hacking Use of stolen login credentials STLCRED 79 817,159 14 Misuse Abuse of system access/privileges ABUSE 65 22,364 15 Social Solicitation/Bribery BRIBE 59 23,361 Honorable Mention at #16 16 Hacking SQL Injection SQLINJ 54 933,157 Figure 18 . Top 15 Threat Action Types plotted by percent of breaches (x) and percent of records (y) 60% 50% MALBAK HAKBAK 40% KEYLOG SNDATA % of Records BRUTE 30% UTILITY SQLINJ STLCRED DFCRED 20% FTPRINT DISABL RAMSCR 10% ABUSE TAMPER BRIBE EMBZZL 0% 0% 5% 10% 15% 20% 25% 30% 35% 40% % of Breaches 26
  • 28.
    Malware (49% ofbreaches, 79% of records) Malware is any software or code developed or used for the purpose of compromising or harming information assets without the owner’s informed consent. Malware factored into about half of the 2010 caseload and nearly 80% of all data lost. A majority of breaches involving malware were against organizations in the Hospitality industry, with Financial Services being the second most affected group. Upon identification of malware during a data breach investigation, the IR team conducts an independent analysis to classify and ascertain the capabilities of the malware with regards to the compromise at hand. Investigators often collaborate with ICSA Labs, an independent division of Verizon, and use the resultant analysis to better assist the victim with containment, removal, and recovery. Malware can be classified in many ways but we utilize a two-dimensional approach that identifies the infection vector and the functionality used to breach data. These two dimensions are directly relevant to identifying appropriate detective and preventive measures for malware. Infection Vectors As always (at least in our caseload), the most common malware infection pathway is installation or injection by a remote attacker. This covers scenarios where an attacker breaches a system and then deploys malware or injects code via SQL injection or other web application input functionality. It also accounts for four-fifths of the malware infections in our 2010 caseload, up from around half in last year’s study. It’s popularity as an infection vector stems from the attacker’s desire to “set up shop” after gaining access to the system. Installing malware is simply part of the moving in process. Figure 19 . Malware infection vectors by percent of breaches within Malware 81% (!) 4% 3% 3% (!) 2% <1% <1% <1% 10% Installed/ E-mail Web/Internet Web/Internet Installed by Network Portable media Coded into Unknown Injected by (auto-executed/ (user-executed or other malware propagation & devices existing ”drive-by” infection) downloaded) remote attacker program/script (i.e., a logic bomb) The web, while still the second most common infection vector, decreased from last year. Web-based malware is divided into two subcategories, code that is auto-executed (aka drive-by downloads), and code that requires additional user interaction beyond the page visit; fake AV scaring users to “click here to scan and clean your infected system” is a common example of this tactic. The main reason for the “drop” in web-based malware (which wasn’t really a drop at all since the number of incidents involving them is similar to before) is that the highly-automated and scalable attack scenarios described throughout this document do not use this pathway. Improvements in browser security could also be contributing to this shift, but we haven’t seen any direct evidence to support this finding. E-mail based malware doesn’t show significant changes from previous studies, while other infection vectors decreased. Occasionally, we still see infection vectors such as network propagation and portable media devices, but there appears to be a consistent shift towards attackers “owning the box” to get specific malware on the system. The somewhat high percentage of “unknown” is attributable to many different factors. Most often it is due to a lack of evidence (no log data, software removal, and premature cleanup) on the system. In these cases, we know malware was present, but the infection vector cannot be conclusively determined. 27
  • 29.
    Malware Functionality Equally importantto the pathway of malware infection is the function it exhibits once it is within the victim’s environment. Verizon’s IR team mostly focuses on how malware causes and contributes to the data breach. However, we often find all sorts of other unrelated malware during the course of our investigation. This serves as an additional indication of inadequately managed systems. Although malware frequently utilizes several methods to harm a system, it still serves one or more of three basic purposes in data breach scenarios: enable or prolong access, capture data, or further the attack in some other manner. Figure 20 . Malware functionality by percent of breaches within Malware and percent of records Send data to external site/entity 79% (!) / 45% Backdoor 78% (!) / 53% (allows remote access/control) Keylogger/Form-grabber/Spyware 66% (!) / 40% (capture data from user activity) Disable or interfere with security controls 50% (!) / 19% System/network utilities 32% / 28% (PsTools, Netcat) RAM scraper 25% / 16% (captures data from volatile memory) Scan or footprint network 10% / 16% Download/Install additional malware or updates 5% / 5% Command & Control 4% / 9% (listens for and executes commands) Capture data from an 4% / 9% application/system process Capture data resident on system 3% / 5% (e.g., cache, disk) Packet sniffer 1% / 12% (capture data from network) Attack another external system/entity 1% / <1% Destroy or corrupt data resident on system 1% / <1% Infect other systems via network propagation 1% / 4% (nw worm) Send spam 1% / <1% Brute force or dictionary attack <1% / <1% Encrypt or seize data resident on system <1% / <1% Infect other systems via e-mail propagation <1% / <1% (e-mail worm) Infect removable media or devices <1% / <1% Initiate client-side attack <1% / <1% (i.e., XSS, MitB) Redirect to another site/address <1% / <1% Unknown 2% / 1% 28
  • 30.
    Per Figure 20,sending data to an external entity, backdoor, and keylogger functionalities continue to be the three most common functions found in breach-related malware and all increased this year. It is important to note that none of these are mutually exclusive and it’s common for a single piece of malicious code to feature several components. Backdoors, which allow attackers unauthorized access to infected devices, are again atop the list with a two-fold increase. Once they have gained that foothold they can install additional malware, use the device as a launch point for further attacks, retrieve captured data, and so on. Over half of data loss in cases featuring malicious code involved a backdoor component. Keyloggers and form grabbers were seen in two-thirds of cases, nearly doubling from the previous year. Commercially available keylogging software, such as Perfect Keylogger and Ardamax Keylogger, are freely available on the web with fully functioned pirated versions distributed on P2P networks and torrent sites. These utilities also allow the attacker to build a pre-configured remote installation package that will be deployed on a target system. They exhibit many types of anti-forensic capabilities, such as hiding itself from a list or running processes, and manipulation of timestamps of its components and output files. Attackers can customize the software to create output files with user-defined filenames, which enable the use of legitimate Windows filenames. Other features, such as encryption of Sending data to output files and automated exfiltration methods via e-mail or FTP also exist. Historically, an external entity, criminals use these types of keyloggers because of these features and ease of configuration. backdoor, and keylogger Keyloggers are also common in Zeus family of malware used to target consumer or functionalities continue merchant credentials to online banking applications. An interesting two-victim to be the three most dynamic develops where a customer victim (consumer or business) suffers the loss of valid banking credentials, and a bank is victimized when the attacker uses the stolen common functions found credentials to conduct a fraudulent transaction. Many times this entails a wire transfer in breach-related malware to an account outside of the United States where the funds disappear quickly into the and all increased this year. hands of money-mules. In addition to keyloggers, the use of RAM scrapers in POS-directed attacks has also increased. RAM scrapers are designed to capture payment card data from a system’s volatile memory, and the increase of its use is consistent with the decrease in packet sniffers. Increased encryption of network traffic across both public and private networks has driven some of this transition. The payment card data residing in RAM is not encrypted and is most likely “fresh” with a current expiration date. Another potential factor in the reduction of packet sniffers may be that several of the groups tied to large cases involving packet sniffers are in jail (e.g., Albert Gonzalez). That’s not at all to say sniffers are a lost art, but there does seem to be a connection. Backdoors initiate outbound reverse connections from the infected system to circumvent firewalls and other security controls . We’ve seen several types of backdoors throughout our investigations, some of which facilitate interactive remote access employing SSH tunneling to forward RDP port 3389 to an IP address configured by the attacker, and others that communicate to a “client” application accepting communication from the infected system . Attackers deploy the latter type of backdoor using a “server” executable on a target system, which will communicate with a “client” application on the attacker’s system . These backdoors are often configured to communicate on commonly used ports such as 80, 443, or 22 to conceal the suspicious traffic from system administrators . Such backdoors are described in the hacker community as a Remote Administration Tool (RAT) and are readily available on the web and across hacking forums . Generally, AV classifies RATs as remote access Trojans, however commercial non-free versions of these tools exist and are advertised by the developers to circumvent AV . These standalone “server” executables are usually configured and built using a GUI based “client” application with all attacker specified options embedded within the executable . These types of backdoors commonly contain file transfer and keylogging functionality as well as other anti-forensic techniques such as encrypting its traffic, password protection, and secure deletion capabilities . The keylogging components of these backdoors allow criminals to capture authentication credentials and use them for subsequent and/or expanded attacks against corporate networks . One particular organized crime group used the same backdoor/keylogger on over 100 different organizations . 29
  • 31.
    Network utilities, suchas PSTools are commonly used to deploy malware on systems and to harvest the output. Though these tools are not inherently malicious, criminals are deploying them and using them in a malicious manner. If such utilities were added to a system by an attacker, we categorized them under malware. When malware captures sensitive information, it must then be exfiltrated from (taken out of ) the While any amount victim’s environment. There are two basic ways this happens: either the malware sends it out of of data leaving the the organization (found in nearly eight out of ten of incidents involving malware) or the attacker owner’s possession re-enters the network to retrieve it (see backdoor). The general rule of thumb is that smaller packets are sent out (i.e., credentials captured by keyloggers) while larger hauls of data are is never a good retrieved (i.e., the contents of a network file share transmitted through a backdoor’s file transfer thing, the act does capabilities). While any amount of data leaving the owner’s possession is never a good thing, the (or at least can) act does (or at least can) provide evidence of foul play. It’s a matter of looking for the right indicators in the correct places. provide evidence For this reason (and others) we advocate paying attention to what goes out of your network and of foul play. It’s a what changes take place within your systems. Don’t have any customers or partners in East Asia, matter of looking yet network and firewall logs show periodic bursts of traffic sent there from your networks? What about those ZIP or RAR files with hidden and read-only attributes that showed up in your root for the right directory last week and have been growing steadily ever since? Maybe there’s a perfectly good indicators in the explanation for these things… but you will never know for certain unless you take steps to correct places. identify and verify them. It highlights the importance of detecting and responding to malware quickly. In some incidents the affected company missed an opportunity to lessen the aftermath of infection by ignoring or not adequately investigating initial anti-virus alerts. Regrettably, those alerts sound less often these days, and AV alone is not always enough. Malware Customization This year nearly two-thirds of malware investigated in the Verizon caseload was customized—the highest we have ever seen (see Figure 21). Additionally, most of the records stolen by malware were taken in breaches where customized forms were observed. The extent of customization found in a piece of malware can range from a simple repack of existing malware to avoid AV detection to code written from the ground up for a specific attack. In 2010 we have seen the majority of customized code shifting to a level of effort that falls in between these two extremes. Code modification to existing malware was present in a little less than half of Verizon cases involving malware. This is often something like a “kit” in which you start with certain known base code that provides low-level functionality, but can add to it or modify it to fit a specific purpose. Hackers can then collaborate on more advanced functionality to build a bigger and better monster. Additionally, the modification and customization of such malware not only allows attackers to add or change capabilities, but also hinders the detection of such malware. The infamous Zeus malware falls into this category. Attackers commonly started off with a base version of Zeus, but a large community of individuals modified or recoded its elements to enhance or change its functionality and detectability over time. When code modification is present, over two-thirds would fall into this level of customization. Many of the freely available backdoors and keyloggers also allow for low-difficulty customization and modification. For example, attackers no longer have to modify code to alter the exfiltration strategy of a particular piece of malware, they can just type an IP address in a form, check (or uncheck) some boxes, hit “Apply” and then “OK.” 30
  • 32.
    Figure 21 .Malware customization over time Level of malware customization by by percent of breaches within Malware* percent of breaches within Malware* 70% 63% 18% Custom-created 59% 60% 50% 54% 43% Code modification (!) 40% 30% 28% 2% Repacked 20% 24% 21% 30% No customization 10% 7% Unknown 0% 2005 2006 2007 2008 2009 2010 * Verizon caseload only * Verizon caseload only This year nearly two-thirds of malware investigated in the Verizon caseload was customized—the highest we have ever seen. The extent of customization found in a piece of malware can range from a simple repack of existing malware to avoid AV detection to code written from the ground up for a specific attack. In a year that includes more breaches than ever, the increased proportion of customized is not a good sign. This is especially true when mixed with other findings of this report. It means that even the majority of highly-automated and non-targeted attacks against small organizations utlize customized malware. This, in turn, means that the cost and difficulty of customization is relatively low. This commoditized customization is made ever more accessible to an ever-increasing pool of criminals by an extensive “malware-as-a-service” market. We find it hard to foresee anything but trouble here for the good guys. Hacking (50% of breaches, 89% of records) The term “hacking,” although ambiguous (and ubiquitous), essentially categorizes all attempts to intentionally access or harm information assets without (or in excess of ) authorization by thwarting logical security mechanisms. Hacking affords the criminal many advantages over alternate modes of attack. Namely, it can be accomplished remotely and anonymously, it doesn’t require direct interaction or physical proximity, and there are many tools available to automate and accelerate attacks. The use of automated tools, typically written and developed by someone other than the attacker, lowers the learning curve and allows even less-skilled threat agents to successfully pull off an intrusion. In this section, we examine the types of hacking observed by Verizon and the USSS in 2010, the paths through which these attacks were conducted, and other details about this important category. 31
  • 33.
    Hacking Methods As shownin Figure 22, there are a handful of hacking methods that dwarf all others with regard to frequency and data loss in 2010. By contrast, 2009 results showed a more gradual tapering off from most to least common (though there were still some definite frontrunners). Furthermore, none of the techniques in 2009 represented more than 40% of all hacking-related breaches. All of the top four exceeded that percentage in 2010, suggesting a great many attacks leveraging the same (or similar) combination of methods. Figure 22 . Types of hacking by percent of breaches within Hacking and percent of records Exploitation of backdoor or 73% (!) / 45% (!) command/control channel Exploitation of default or 67% (!) / 30% (!) guessable credentials Brute force and dictionary attacks 52% (!) / 34% (!) Footprinting and Fingerprinting 49% (!) / 19% (!) Use of stolen login credentials 21% / 21% (!) SQL Injection 14% (!) / 24% (!) Exploitation of insufficient authentication 10% / 21% (e.g., no login required) Abuse of functionality 10% / 19% Buffer overflow 9% / 15% Exploitation of insufficient authorization 1% / 4% (weak or misconfigured access control) Cross-site scripting 1% / <1% Cross-site request forgery <1% / <1% Cryptanalysis <1% / <1% DoS at the application layer <1% / <1% (consumes system resources) Encryption Brute Forcing <1% / <1% Other(s) <1% / <1% Unknown 4% / 8% The method utilized in the highest percentage of breaches and stolen records was exploitation of backdoors or command/ control functionality. This isn’t the backdoor itself (which is considered malware), but is inextricably linked to it. With a backdoor installed, attackers can bypass security mechanisms to gain access without relying on legitimate channels. This offers the added advantage of greater stealth and evasion of host-level logging. Legitimate remote access applications do not log an intruder’s actions if he or she is not using them. 32
  • 34.
    The next fewtechniques listed in Figure 22 are basically a blueprint for standardized and highly scalable attacks against soft targets. That is to say, the perpetrator(s)—largely organized crime groups—set up automated systems to scan for certain open ports and services (footprinting and fingerprinting), try a few well-known combinations of default credentials used on various types of systems, and then—if still necessary (it’s often not)—run a brute-force attack to crack the system. These scans run at all hours of the day and night, trying to gain access, and recording successes. The would-be assailant wakes up, has some coffee (or tea, or maybe even vodka), and begins the workday with a nice compiled list of IPs for vulnerable devices along with the exact usernames and passwords needed to access them. After that, put in a few hours cramming malware onto selected systems, revisit last week’s victims to collect some captured data, and then head home early to the wife and kids. This continues until they get caught, grow bored with it, die, or get hired by a security company (yes, the latter is a jibe, but, unfortunately, it’s often true). The would-be assailant wakes up, has some coffee (or tea, or maybe even vodka), and begins the workday with a nice compiled list of IPs for vulnerable devices along with the exact usernames and passwords needed to access them. After that, put in a few hours cramming malware onto selected systems, revisit last week’s victims to collect some captured data, and then head home early to the wife and kids. After the triad above was the use of stolen login credentials. This common technique is particularly vexing to victims because it shrouds the attacker in a disguise of legitimacy. Rather than sounding alarms because an unrecognized or unauthorized user is accessing sensitive assets (yes, we realize the data suggests that no alarm would be sounded anyway, but we’re trying to be optimistic), it looks like Bob doing his job. Nothing out of the ordinary with that, right? Authenticated activity is much less likely to trigger IDS alerts or be noticed by other detection mechanisms. It also makes it easier for the attacker to cover his tracks as he makes off with the victim’s data. That the use of stolen login credentials fell in 2010 from its top position is rather misleading . The distinction of what is a single incident vs . multiple incidents can be difficult to make with this technique . For instance, if a bank notices that 100 accounts showed signs of unauthorized access, they would likely consider these to be 100 different “incidents .” However, if an investigation was conducted and all of those were traced to a single perpetrator, it might be viewed as one large incident affecting multiple accounts . It comes down to perspective and knowledge of the details behind the attack . We mention this simply because such scenarios were quite common in both Verizon’s and the USSS’ caseloads . We treated them as single incidents, which has an effect on the stats associated with stolen credentials . One can rightly say that the actual frequency of criminals using of stolen credentials (each instance of gaining access to a compromised account) was much higher than a glance at Figure 22 (which is based on per incident stats) indicates . 33
  • 35.
    As with lastyear, we found that credentials are stolen more often by malware than, say, phishing or snooping them off sticky pads (though those things do happen). Bank credential stealing malware such as Zeus or Spyeye will grant an intruder possession of legitimate access credentials that often drive the remainder of the data breach. This occurs when an end-user downloads a piece of malware, either via drive-by-download or through user interaction with some e-mail or other message tailored to the user. The credentials are then distributed through botnets, compiled, and organized for each institution. The attacker will then use these credentials to either make fraudulent financial transactions from business accounts, personal accounts (consumer fraud), or steal some type of sensitive PII data for identity theft. During one of Verizon’s cases in mid 2010, Romanian hackers were able to use this exact method to relieve a U .S . bank of about several million dollars . The intruders started by stealing legitimate credentials to the bank’s ACH wire transfer portal belonging to three separate internal employees, who all received an e-mail from the “FDIC” on a Friday afternoon . The employees noted that the attached PDF file wouldn’t open correctly . The following Monday, several million dollars were wired out of the bank using the three employees’ access credentials . After we wished it a happy 10th birthday last year, SQL injection has returned for another party, but with less fanfare this time. From 25% of hacking-related breaches and 89% of all data stolen, those numbers declined in 2010 to 14% and 24% respectively. Of course, there’s that whole caseload-scaling thing to consider, so it’s not as though SQL injection is disappearing. It simply hasn’t been as widely incorporated into the kind of canned attacks described above for other techniques. Something It’s difficult to tell if this trend (of few interesting to note about SQL injection is that it factored into a vulnerability exploits) exists because disproportionately higher percentage of breaches in Asia. hackers prefer other vectors or if they’ve Vulnerabilities and Patch Management been forced in that direction because In previous DBIRs, we’ve shown the relatively few numbers of organizations are patching well. Most attacks leading to data compromise that exploit patchable9 software or system vulnerabilities. Nearly all exploit configuration likely, it’s a little of both. weaknesses or inherent functionality of the system or application. This trend continued in 2010 as only five vulnerabilities were exploited across the 381 breaches attributed to hacking. These are as follows: CVE-2009-3547, CVE-2007-5156, CVE-2009-2629, CVE-2010-0738, and CVE-2007-1036. Though surprising, this makes sense if one considers the prevalence of techniques discussed earlier in this section, few of which are vulnerabilities in code that can be “patched.” It’s difficult to tell if this trend (of few vulnerability exploits) exists because hackers prefer other vectors or if they’ve been forced in that direction because organizations are patching well. Most likely, it’s a little of both. Patching is definitely a security practice that is well-known and receives a lot of attention (it’s often the core statistic of a security metrics program). For the most part, organizations do seem to be keeping patch levels current, at least on Internet-facing systems. As you can see from those CVE dates, most attacks exploit older vulnerabilities, ones that should have been eliminated by any reasonable patch deployment cycle. Therefore, we continue to maintain that patching strategies should focus on coverage and consistency rather than raw speed. The resources saved from doing that could then be put toward something more useful like code review and configuration management. 9 The word “patchable” here is chosen carefully since we find that “vulnerability” does not have the same meaning for everyone within the security community. While programming errors and misconfigurations are vulnerabilities in the broader sense, lousy code can’t always be fixed through patching and the careless administration patch has yet to be released. Furthermore, many custom-developed or proprietary applications simply do not have routine patch creation or deployment schedules. 34
  • 36.
    Attack Pathways Figure 23 . Attack pathways by percent of breaches within Hacking and percent of records Having lost ground to web applications over 71% (!) 34% 22% (!) 11% 8% the last few years, remote access and desktop 27% (!) 38% 38% (!) 24% 10% services are once again at the number one spot in the list of attack pathways in Figure 23. A whopping 71% of all attacks in the Hacking category were conducted through this vector. Remote access Backdoor or Web application Network file Unknown Because there are so many types of remote services control channel sharing services access services in use by organizations, we give a more detailed account of them in Table 9. Remote access and desktop services, in combination with the exploitation of default and/or stolen credentials, is a huge problem in the retail and hospitality industries. Opportunistic attacks are carried out across many victims who often share the same support and/or software vendor. As soon as an intruder discovers a particular vendor’s authentication method and schema (be it for TCP port 3389 for RDP; or TCP port 5631 and UDP port 5632 for pcAnywhere), he will be able to exploit it across a Table 9 . Types of remote access by percent of multitude of that vendor’s partners and customers. Oftentimes, in breaches within Hacking and percent of records lieu of conducting a full port scan for these remote service Local remote screen sharing 64% 24% applications, attackers will customize their scripts to exclusively look (e.g., RDP, PCAnywhere) for these ports and search a broad swath of the Internet. This speeds Online session screen sharing 5% 13% (e.g., Go2Assist, LogMeIn, NetViewer) up their capability of searching for and finding services unprotected Remote Shell 2% 1% by router/firewall ACLs and allows them to quickly check for default (e.g., ssh, telnet, rsh) credentials as well. This of course relies on remote access Web-based terminal services 2% 12% (e.g., Citrix, MS Terminal Services) authentication schema being uniform across all of that particular vendor’s customers—but hey, who are we kidding? They always are. VPN 1% <1% The installation and exploitation of backdoors has already been covered in this report. They do, however, warrant another mention here as we discuss common paths of attack. Along the typical chain of events, the backdoor is often placed on a victim system after gaining access via default or stolen credentials. The agent then has control of or can access the system at will without leaving traces in logs (if they exist in the victim environment). It accomplishes the goals of concealment and persistence that cybercriminals crave. As in years past, backdoors are frequently utilized to exfiltrate data from compromised systems. Just because web applications dropped as an overall percentage of attacks, don’t believe for an instant that they are any less critical a vector than they were a year ago. If you remove hospitality and retail victims from this dataset, web applications are right back on top and are more numerous than ever. Please don’t let the bad guys catch your development and application assessment teams napping. Just because web applications dropped as an overall percentage of attacks, don’t believe for an instant that they are any less critical a vector than they were a year ago. If you remove hospitality and retail victims from this dataset, web applications are right back on top and are more numerous than ever. 35
  • 37.
    Social (11% ofbreaches, <1% of records) Social tactics employ deception, manipulation, intimidation, etc. to exploit the human element, or users, of information assets. Typically, these actions are used in concert with various other threat categories and can be conducted through both technical and non-technical means. Social attacks are down from 28% in 2009 to 11% in 2010. The amount of data stolen as a result of social attacks, while previously low, is down from last year as well (3% to less than 1%). Figure 24 . Types of social tactics by percent of breaches within Social Solicitation/Bribery 74% (!) Pretexting 44% (!) (classic Social Engineering) Counterfeiting/Forgery 16% (fake website, docs, etc) Phishing 11% (!) (or any type of *ishing) Hoax/Scam 4% Influence tactics 4% (Leveraging authority or sense of obligation) Extortion/Blackmail 3% Unknown 3% Per Figure 24, solicitation and bribery remains the most common type of social tactic in 2010, but by a much wider margin than before. This frequently entails collusion between an external agent and an insider, though other combinations occur as well. Whoever is involved, one party uses petitions, promises, and payments to get another to participate in the crime, usually because it would have been difficult or impossible without their aid. Widespread solicitation scenarios target waitstaff and cashiers to skim payment cards and bank employees to perform all manner of illicit activities. Less common examples involve recruiting system administrators and other privileged parties to steal data, open holes, disable security systems, etc. Pretexting numbers are also quite high, and have more than doubled from the previous year. There are a myriad of ways in which imaginative and resourceful criminals can utilize pretexting in an attack scenario. We observed convincingly-attired repairmen walk brazenly into victim locations to steal, tamper with, and replace devices. We saw organized foreign criminals use elaborate yarns to weasel their way into positions of influence in numerous organizations (or gain the trust of those that did). We studied records of human resources staff hoodwinked into providing (and changing) personal and employment information to would-be fraudsters. We witnessed Jedi masters convince Stormtroopers that these were not the droids they were looking for… oh wait…no; that was Star Wars. Nevermind. But the others were definitely examples from 2010 cases. 36
  • 38.
    Figure 25 .Paths of social tactics by percent of breaches within Social 78% (!) 14% 10% 6% 5% 4% 5% In-person Documents E-mail Web/Internet Phone SMS/Texting Unknown While counterfeiting and forgery can involve everything from websites to documents (and more), the use of fake credentials (drivers’ licenses, birth certificates, etc.) was 2010’s most prevalent example. Many of these had to do with identify theft and account takeover schemes targeting financial institutions. In last year’s report, e-mail was the path du jour in most cases. Over the last year, however, criminals increasingly relied on the personal touch with a whopping 78% of cases involving in-person contact. Phishing is not new by any means, but it does seem to be finding some renewed attention in the criminal community. Rather than the typical e-mail lure to change your bank password, external sources along with our own caseload hint that phishing is being used more often to gain a toehold in the victim’s environment through attached malware. This tactic, of course, is not new either; it simply seems to be hitting a (who know’s how temporary) growth spurt. The vectors through which social tactics were conducted changed significantly in 2010 (see Figure 25). In last year’s report, e-mail was the path du jour in most cases. Over the last year, however, criminals increasingly relied on the personal touch with a whopping 78% of cases involving in-person contact. This was the clear vector of choice for solicitation and pretexting—and understandably so. Table 10 . Targets of social tactics by percent Even in our high-tech business world, many deals won’t get done without of breaches within Social an in-person “meet and greet.” A good number of large multi-victim cases Regular employee/end-user 80% (!) worked by the USSS involving in-person solicitation and pretexting helped to drive this up substantially. That some of them employed counterfeiting of Finance/accounting staff 33% (!) identification credentials also drove documents up as vector as well. Human resources staff 30% (!) Not much has changed this year with regard to the targets of social tactics Customer (B2C) 8% listed in Table 10. Regular employees continue to be singled out for mischief Executive/upper management 5% of this sort (see paragraphs above for examples). This reinforces the need for greater and more comprehensive training and awareness campaigns with Helpdesk staff 3% regard to social attacks. These should include information and tips on how System/network administrator 1% to recognize and avoid falling for common ploys. Unknown 1% 37
  • 39.
    Misuse (17% ofbreaches, 1% of records) We define Misuse as using entrusted organizational resources or privileges for any purpose or in a manner contrary to that which was intended. These actions can be malicious or non-malicious in nature. The category is exclusive to parties that enjoy a degree of trust from the organization such as insiders and partners. In 2009, Misuse was the most common of all threat actions, but dropped substantially in 2010. In no way does this mean Misuse is rare; 17% corresponds to almost 130 breaches that involved some form of Misuse. The three most common types of Misuse observed in 2010 are a repeat of those identified in 2009, with embezzlement, skimming, and related fraud once again on top. Several large internal fraud cases worked by the USSS helped make this type of misuse even more predominant over the past year. In one, certain members of a Nigerian fraud ring were indicted for their involvement in a long-running and extensive identity theft operation within some of America’s largest banks. The fraudsters gained key positions within these institutions which allowed them to steal personally identifiable information, access and/or create bank accounts, apply for fraudulent loans, sell information on the black market, and other nefarious activities. Figure 26 . Types of misuse by percent of breaches within Misuse Embezzlement, skimming, and related fraud 75% (!) Abuse of system access/privileges 49% Use of unapproved hardware/devices 39% Abuse of private knowledge 7% Violation of web/Internet use policy 5% Violation of e-mail/IM use policy 4% Handling of data on unapproved 2% (!) media/devices Storage/transfer of unapproved content 2% Use of unapproved software/services 1% Violation of asset/data disposal policy 1% Unknown 1% The three most common types of Misuse observed in 2010 are a repeat of those identified in 2009, with embezzlement, skimming, and related fraud once again on top. Several large internal fraud cases worked by the USSS helped make this type of misuse even more predominant over the past year. 38
  • 40.
    Other, less complex,instances of embezzlement, skimming, and related fraud were seen as well. These were commonly perpetrated by bank tellers, restaurant waitstaff, retail clerks, or others in similar positions in which the “simple” handling of financial transactions is inherent to the job. Oftentimes these employees used handheld skimmers and other devices to facilitate the theft, which is why “use of unapproved hardware/devices” is rather high in Figure 26. While such activity may seem out of sorts with some of the more technical attacks described in this report, it is nevertheless a real (and common) method of stealing data—especially payment cards. As discussed in the section describing Social tactics, these scenarios very often involve an external party that solicits and/or bribes the insider to commit the crime and provides them with the requisite devices to pull it off. The 2010 caseload once Abuse of system access/privileges, at the #2 spot in Figure 26, is similar in nature to embezzlement, but specifically involves the misuse of logical access to information again reminds us that systems. As suspected, many breaches involve both non-technical forms of “major” acts of misuse embezzlement along with abuse of system access (and any other type of Misuse listed like data theft are often in Figure 26, for that matter). The actions leading to the court martial of U.S. Army Private Manning provide a now infamous real-world example of this type of Misuse. He abused precipitated by “minor” his (overly) privileged access to SIPRNET to browse and copy classified State Department acts of misconduct. cables without authorization to an external hard-drive (unapproved device). While this event stole the spotlight in 2010, it is by no means the only or most spectacular example This doesn’t mean that of system abuse from 2010. The combined Verizon-USSS dataset contains scores of everyone who veers them, but the worst aspect of such cases is that countless others will likely never slightly from the straight be discovered. and narrow will inevitably As evidenced by the examples above, privileged users typically need a means of moving or exfiltrating data once they have misappropriated it. Figure 26 is essentially a laundry careen headlong into list of how this can be accomplished. Some use corporate or personal e-mail to send it a life crime, but it does to external parties or accounts. Some smuggle it out on various types of personal mean that questionable devices or media. Others use approved devices, but for unapproved purposes or in an unsanctioned manner. We continue to find that the success of a breach does not hinge behavior should be seen on the perpetrator being able to use a certain portable device (i.e., plugging up USB for what it is—a potential slots doesn’t eliminate the problem). Unfortunately, users have a plethora of choices warning sign—and when it comes to media and devices fit for secreting data and removing it from their employer. For this reason, it is generally easier to control data at the source than it is to treated appropriately. block a virtually limitless array of potential destinations. Certain technologies, however, like DLP and behavioral monitoring may add some additional levels of protection between those end points. The 2010 caseload once again reminds us that “major” acts of misuse like data theft are often precipitated by “minor” acts of misconduct. This doesn’t mean that everyone who veers slightly from the straight and narrow will inevitably careen headlong into a life of crime, but it does mean that questionable behavior should be seen for what it is—a potential warning sign—and treated appropriately. Another lesson reinforced during this round of analysis is the importance of quickly deprovisioning user access and privileges when they are no longer needed. Year after year we investigate breaches involving former employees or business partners. A simple yet good rule of thumb is that if you no longer want them on your payroll, then don’t leave them in your systems. 39
  • 41.
    Physical (29% ofbreaches, 10% of records) This category encompasses human-driven threats that employ physical actions and/or require physical proximity. In previous years physical attacks were consistently one of the least prevalent threat actions in terms of both percentage of breaches and percentage of records lost. This was partially due to the nature of common physical actions; for instance, it is unlikely that a stolen mobile device will precipitate a full-blown forensics investigation and would therefore not be in our caseload. Another factor is that many of the action types we classify as Physical are less likely to be associated with confirmed data loss. Moreover, if physical access to a device is available as part of normal job duties for insiders, then that local access is not classified as a physical action but rather falls under the category of misuse. Figure 27: Types of physical actions by percent of breaches within Physical and percent of records The analysis of the 2010 case 98% (!) 17% 2% (!) 1% <1% <1% dataset has resulted in three 10% <1% 1% <1% <1% <1% noteworthy shifts in physical actions from data represented in previous reports. The first of these is that Physical actions Tampering Surveillance Theft Snooping Local access Unknown are twice as prevalent in our current caseload, with one or more action types found in 29% of the combined caseload of Verizon and USSS. Incidents involving ATM and gas pump credit card skimmers represent the majority of physical actions. These cases would not typically be pursued by Verizon investigators, but certainly fall under the jurisdiction of USSS. ATM and gas pump skimming is conducted largely by organized criminal groups and one “spree” can target 50 to 100 different business locations. These attacks have been occurring for years, but are on rise in many areas according to both public reports and the caseload of the USSS. The second change from last year is that we have witnessed a discernible increase in the proportion of record loss associated with physical actions from prior years. Again, this is attributable to the increase in physical skimmer cases. Record loss for these cases is an aggregate of the credit card numbers and/or PINs compromised and is therefore much different than cases of theft that may involve a single document or device. Ten percent of all compromised records were linked to cases involving a physical action in 2010. By way of comparison, physical actions were only associated with 1% of data loss in 2009’s combined caseload. The third change in Physical is represented in Figure 27 by the increase in tampering (98%), and surveillance (17%), and the decrease of theft (2%) as physical action types from previous years. Yet again, this was directly influenced by the amount of ATM and gas pump skimming cases in our data set. According to USSS data, ATM skimming is increasing and is becoming more organized. Skimmers can vary greatly in sophistication both in inconspicuousness and feature sets. A standard ATM skimmer is a reader device designed to fit on top of a legitimate card slot. Both readers are able to read the data on the magnetic strip, and the credit card number is stored on the skimmer device to be retrieved at a later date. Hidden cameras are often used in conjunction with the capture device to collect PINs upon user entry. These cameras are affixed above the keypad and are concealed by the use of incredibly clever camouflage. In many instances, they fit almost perfectly over the existing ATM shell, and are disguised by means of using the same material and color as the original. In other cases, this is achieved by disguising the camera as a sign on the ATM that features the bank logo, or the logos of the cards accepted by the ATM. Fake PIN pad covers are another method of PIN capture, and have the advantage of not relying on a line of sight to the key pad. However, these are potentially riskier for the criminals as they are larger, more expensive, and because they are touched by customers, potentially more vulnerable to discovery. These fraudulent devices are attached by junior members of organizations in a matter of seconds using strong adhesives. 40
  • 42.
    As stated above,ATM skimmers are found with varied levels in sophistication. This type of crime is carried out by gangs which possess a considerable amount of organization. The techniques used to reduce the chances of discovering the fact that they have tampered with the machines begins with molds and overlays that mimic the existing card reader in shape, and perhaps more importantly, color and material. Even the most basic skimmers are not generic, but designed for specific ATM models in the same manner that mobile phone cases are manufactured for specific models. Better fit equates to less deviation from a non-altered device, and, therefore, less potential for scrutiny. The technology behind the skimmer is also becoming increasingly sophisticated. The more basic devices feature a built-in storage component for the magnetic stripe and PIN data. The payment card data resides on the skimmers until retrieved by a second visit from the criminal to detach the skimmer device. Advances in data exfiltration techniques have included the use of Bluetooth technology within the skimmer to allow for wireless retrieval within a finite proximity. This, of course, reduces the risk of apprehension when attempting to retrieve the device, which may occur if the skimmer is discovered. Additionally, it allows the possibility of collecting data at various intervals, so if a device is removed by a bank employee or law enforcement not all of the captured data is lost. The latest evolution in data retrieval is the use of technology, again embedded in the skimmer, that utilizes GSM standards and will text captured data in real-time to the criminal’s cell phone. The correlation ATM and gas pump skimming is between data capture and criminal possession is streamlined from conducted largely by organized a one-time retrieval, to scheduled collections at the criminal’s convenience, to an instantaneous event. The required proximity of criminal groups and one “spree” can the criminal collecting captured data increases exponentially from target 50 to 100 different business required local physical access, to close proximity, to virtually anywhere. locations. These attacks have been The cases involving payment card capture at “Pay at the Pump” occurring for years, but are on rise in terminals have featured different attributes than ATM skimming. many areas according to both public Access to the inside of the gas pump and the card reader hardware reports and the caseload of the USSS. is achieved by using a master key to unlock the front of the device. Devices are placed inline between the card reader and the remaining hardware. The data is not captured by a magnetic strip read, but from the communication of payment card data from the reader to the embedded POS terminal. There is no trace of tampering from the outside of the gas pump and Bluetooth transmission is typically utilized for retrieval of data. Gas pump skimming was more common in our caseload than cases involving ATM assets; however the number of records lost is considerably lower. Our caseload shows that ATMs and gas pumps are the most common assets targeted in skimming attacks, but they are not the only ones. The USSS has investigated cases in which card readers, designed as physical access control mechanisms to enclosed ATM locations (typically attached to banks and utilized for after-hours customers), have been tampered with for the same intent as the ATM card readers. Point-of-Sale (POS) terminals have been targeted in sophisticated tampering cases in which the devices are replaced with “new” devices redesigned to capture and store payment card data as it is passed from the swipe reader to the terminal for legitimate processing. The capture and exfiltration methods are similar to the gas pump skimmers, completely hidden inside the PED device and remote data collection. Criminals have even incorporated social engineering methods, such as dressing in uniforms and identifying themselves as technicians employed by the POS manufacturer. Upon arrival at the location, they inform staff that they are replacing devices for scheduled maintenance and switch the legitimate devices for devices they control. The majority of physical actions took place at the victim location in an outdoor area where, as one would expect, all gas pumps and most ATMs are located. 41
  • 43.
    Error (<1% ofbreaches, <1% of records) In VERIS, we define error as anything done (or left undone) incorrectly or inadvertently. This includes omissions, misconfigurations, programming errors, trips and spills, malfunctions, etc. It is not hard to imagine that something befitting this broad definition could be identified in nearly every incident scenario. When examining and classifying an incident, we are primarily concerned with identifying critical errors that were either the primary cause of the incident or a significant contributing factor. Making the determination of whether an error is “significant enough” to be included in the event chain isn’t always easy. Because of this, last year Table 11 . Types of causal and contributory errors by number of breaches we focused solely on presenting error when it was the primary cause of the breach, which is usually easily discernible. An example of error as a Causal Contributory primary cause would be if a company accidentally left confidential Disposal error 1 0 information on an asset that was then donated to a charitable Publishing error 1 0 organization. If it were never known whether or not the information was accessed, this would be a “possession” loss. If that organization accessed Omission 0 192 the information or gave it to another one that did (let’s assume they did Programming error 0 16 so innocently), it would be a “confidentiality” loss. In either case, the error Misconfiguration 0 10 was the primary cause of exposure. General user error 0 1 Error as a primary cause has historically been rare among our data compromise cases, and 2010 is no exception (but this would undoubtedly be different if this report focused on availability losses). Error was identified as the primary cause of only two incidents out of the total population of 761 breaches investigated. These are shown in Table 11 and included one disposal error involving a device that was repurposed, supposedly wiped, and then given to another company. However, the receiving company (very nicely) reported that it still contained sensitive information. The publishing error occurred when non-public information was accidentally posted to a public website. This year, we include errors identified as a contributing factor to give a broader view of their role in data breaches. An error is a contributing factor if it creates a condition that—if/when acted upon by another agent—allows the primary chain of events to progress. Such errors occurred quite often in breaches in 2010 and are listed in the second column of Table 11. In reviewing contributing errors, it is difficult not to notice the overwhelming representation of omission in the data set. Omission refers to something not done that, according to policy and/or standard operating procedures, should have been done. Within the Verizon and USSS caseload, a frequent example of this (especially in the retail and hospitality industry) is the failure to change default credentials. This was most commonly linked to inadequate processes on the part of the victim to validate that things get done properly and consistently. A dash of misconfigurations (an active mistake rather than a passive one like omissions) and programming errors (often linked to flaws in custom web apps) populate Table 11 as well. Environmental (0% of breaches, 0% of records) This category not only includes natural events like earthquakes and floods but also hazards associated with the immediate environment (or infrastructure) in which assets are located. The latter encompasses power failures, electrical interference, pipe leaks, and atmospheric conditions. Nothing in this category contributed to data breaches in either the Verizon or USSS caseloads in 2010. Although environmental hazards most often affect the attribute of availability, they can occasionally factor into scenarios resulting in the loss of confidentiality as well. We have, for instance, investigated incidents in the past in which a power outage led to a device rebooting without any of the previously-configured security settings in place. An intruder took advantage of this window of opportunity, infiltrated the network, and compromised sensitive data. Such events are not common but are worth some consideration. 42
  • 44.
    Assets and Attributes Inprior versions of this report, we focused primarily on assets from which data was stolen during a breach scenario. There is nothing wrong with this approach, but it does exclude certain assets that serve various initial and intermediate purposes prior to the point of compromise. We have elected to include all assets identified in the event chain for this 2011 DBIR. Also, past DBIRs have not broken out the security attributes of those assets that are negatively impacted other than the obvious, confidentiality, which is in scope for them all (it’s a report on data breaches). This year, we’ve added a brief tally of results pertaining to all six attributes. Figure 28 . Categories of affected assets by percent of breaches Asset types and percent of records In the combined Verizon/USSS data set for 2010, servers edged out user devices to maintain the top Servers 57% / 76% spot as the class of assets most often involved in a data User Devices 56% (!) / 22% (!) breach. They are still associated with the majority of Offline Data 12% / 1% data loss, though it’s now more of a true majority in People 10% / <1% Figure 28 than a super landslide majority like in Networks 2% / <1% previous years. Within the servers category, POS, database, and web servers were observed most often. If we focus solely on Verizon’s caseload, a feeling of nostalgia sets in and we once again see ratios more in line with previous DBIRs. Drilling down further in the Verizon data, we see that servers accounted for 80% of breaches and 95% of compromised records, with POS and web servers leading both metrics. The margin between servers and end-user devices has been shrinking over the last few years (at least with respect to percentage of breaches). Though workstations, laptops, and mobile devices fall within this category, they are not responsible for these gains. That credit goes to devices like POS terminals (not back-of-store servers), “pay at the pump” terminals, and ATMs (detailed breakdown in Table 12). This is an interesting trend, one driven by both functionality—the ability to accept financial transactions— and convenience—openness to public use. That combination makes them both attractive and accessible to a wide array of criminals, who tend to “follow the easy money.” An interesting outcome of this trend is the relative size of breaches. In the 2010 caseload, for the first time, we saw no breaches involving a million or more records. The offline data category was off its record mark of 25% set in 2009, showing a rather steep 13% drop. Last year, we associated the large increase in offline data with the larger proportion of insider theft in the USSS dataset (insiders take data from documents, media, or whatever else is within reach). Therefore, it is not a stretch to do the reverse and attribute the drop in this category to the lower proportion of internal agents observed in 2010. Figure 29 . Percent of records compromised from online assets 100% 99% 98% 89% 90% 80% 80% 81% 76% 73% 70% 60% 2004 2005 2006 2007 2008 2009 2010 43
  • 45.
    The risk ofmobile computing is a topic that Verizon’s RISK team continues to receive questions about. Both smartphones and tablets have experienced phenomenal growth and equally phenomenal mind share in the past few years, and our clients frequently ask us for recommendations around policies, processes, and controls for this class of assets. While we acknowledge the growth of mobile computing and the increasing attractiveness of the platform to potential threats, we also must acknowledge that again this year we have no representation of smartphones or tablets as the source of a data breach. While we acknowledge the growth of mobile computing and the increasing attractiveness of the platform to potential threats, we also must acknowledge that again this year we have no representation of smartphones or tablets as the source of a data breach. Table 12 . Types of compromised assets by percent of breaches and percent of records* Type Category % of Breaches % of Records POS server (store controller) Servers 36% (!) 28% (!) POS terminal User Devices 21% (!) 13% (!) Pay at the pump terminal User Devices 18% (!) <1% Database server Servers 14% 15% (!) Web app/server Servers 9% 24% Regular employee/end-user People 8% 0% Automated teller machine (ATM) User Devices 8% 9% Desktop/workstation User Devices 8% 0% Payment card (credit, debit, etc) Offline Data 7% 1% File server Servers 4% <1% Documents Offline Data 4% <1% Finance/accounting staff People 4% 0% Human resources staff People 3% 0% Directory server (LDAP, AD) Servers 1% 0% Physical security system (e.g., badge reader) Networks 1% 0% Mail server Servers 1% 0% Payment switch/gateway Servers 1% 10% Remote access server Servers 1% 0% Customer (B2C) People 1% <1% Executive/upper management People 1% 0% Unknown Unknown 1% 1% *Only assets involved in greater than 1% of breaches or greater than 1% of records shown 44
  • 46.
    Figure 30 .Distribution of operating systems by percent of affected assets* Operating Systems 85% 10% 4% 1% <1% One of the most frequent requests we’ve heard over the past few years is for data on the operating systems of compromised assets. We’ve included that information in Windows Linux Unix Mac OS X Mainframe Figure 30 this year, trusting our readers will refrain from using it in “OS holy wars.” * Verizon caseload only We broke out OS categories into Linux, UNIX, Mac OS X (yes, we know this is UNIX, but it’s worth treating as a special case), Windows, and Mainframe. It might be tempting to focus on the fact that 85% of breached assets run Microsoft Windows, but it is important to note that the attacks used against these systems have little to do with OS vulnerabilities; it’s not exactly rocket science to breach a system using default or easily guessable credentials. Also, the Verizon/USSS data generally mimics the market share representation we see from various industry analysts and publications, leading us to believe that as far as OS preference is concerned, threat agents are generally agnostic. One of the most frequent requests we’ve heard over the past few years is for data on the operating systems of compromised assets. We’ve included that information this year, trusting our readers will refrain from using it in “OS holy wars.” Hosting and Management Given the industry’s hyper-focus on cloud computing, we do our best to track relevant details during breach investigations and subsequent analysis. As stated earlier in this report, we have yet to see a breach involving a successful attack against the hypervisor. On the other hand, we constantly see breaches involving hosted systems, outsourced management, rogue vendors, and even VMs (though the attack vectors have nothing to do with it being a VM or not). In other words, it’s more about giving up control of our assets and data (and not controlling the associated risk) than any technology specific to The Cloud. With that in mind, Figures 31 and 32 depict the location and management of the assets discussed in this section. Most assets encountered during Verizon’s Figure 31 . Location/Hosting of Figure 32 . Management of investigations were hosted internally, but assets by percent of breaches* assets by percent of breaches* half were fully or partly managed by a third 2% Unknown 2% Unknown party. Overall, both hosting and 6% N/A 5% N/A 1% Mobile management were a little more likely to be 6% Co-Located 16% Co-Managed handled by external parties in 2010 14% External compared to prior years. The question of whether these variables contributes to the 34% External susceptibility of assets to compromise is difficult to answer from these results, but worth pondering nevertheless. The 76% Internal combination of outsourcing plus indifference and/or negligence with 48% Internal respect to vendor management—which is seen more often than you might think—is almost certainly a contributor. * Verizon caseload only * Verizon caseload only 45
  • 47.
    In other words,it’s more about giving up control of our assets and data (and not controlling the associated risk) than any technology specific to The Cloud. Security Attributes Security attributes are exactly what they sound like they are: attributes that describe or pertain to the security of an information asset. A security incident negatively affects one or more of these attributes. VERIS uses six primary security attributes: Confidentiality, Possession or Control, Integrity, Authenticity, Availability, and Utility (also known as the Parkerian Hexad). Table 13 shows how often each of these attributes was affected during breaches investigated in 2010. Table 13 . Security attributes affected by percent of breaches Attributes affected Definition Breaches Confidentiality Limited access, observation, and disclosure 100% Possession Exclusive (or intended) possession and control (and ability to prove it) 0% Integrity Complete and unchanged from original state 90% Authenticity Validity, conformance, and genuineness 5% Availability Present and ready for use when needed 1% Utility Usefulness or fitness for a purpose 0% News flash: 100% of all data breaches compromise the confidentiality of information assets. Q.E.D. Moving on. The fact that integrity is involved in 90% of breaches may come as a surprise to some, but consider how many events occur during a breach that can introduce unauthorized changes to a system. The installation of malware alone explains over half of that number (all malware changes the original state of the system), and we haven’t even scratched the surface of what intruders typically do once they own a system. Values drop way off after integrity. Examples of events affecting the authenticity of assets are swapping a legit device for a phony one and initiating fraudulent transactions. The latter could drive this attribute much higher, but our focus in the investigation is on how data was compromised rather than, for instance, what criminals did with it afterwards (which often involves fraud of various kinds). Availability isn’t the main goal for attackers interested in breaching data, but it is occasionally a casualty of war. For example, malware can bog down a system even if doing so wasn’t its primary function. We did investigate an incident affecting the utility of information in 2010, but it was not a breach and thus not represented here (a terminated admin encrypted some data and tried to extort his former employer). Possession losses aren’t represented because if we could not confirm actual compromise of data, the case would not be included in this report. 46
  • 48.
    Compromised Data 3.8 millionrecords confirmed stolen in 2010. Compared to totals for the past few years, that’s basically a rounding error. That is in no way intended to make light of the situation; as those affected by breaches discussed in this report know all too well, it’s still 3.8 million too many. The fact of the matter remains, however, that 3.8 million is a lot less than 360.8 million or 143.6 million, and one is left wondering what in the world is going on. Figure 33 . Number of records compromised per year in breaches investigated by Verizon and the USSS (!) 360,834,871 171,077,984 143,643,022 124,235,000 104,321,000 11,488,000 3,878,370 2004 2005 2006 2007 2008 2009 2010 3.8 million records confirmed stolen in 2010. Compared to totals for the past few years, that’s basically a rounding error, and one is left wondering what in the world is going on. We’ve touched on various potential explanations for this trend throughout this report, but we’d like to explore these again and offer some others in this section. Before engaging in speculation, though, let’s make sure we have our facts straight concerning compromised data in the combined Verizon-USSS 2010 caseload. Table 14 is a good place to start. Perhaps more so than anything else we could provide, Table 14 demonstrates the unique character of 2010 in terms of data loss. Not only is there a huge disparity in the annual totals, but the mean, median, and percentiles are profoundly different. The mean is down from 2 million records per breach to below 7,000. Before you attribute this to the “flaw of averages,” note that the median is also a fraction of its former value. From 2004 through 2009, 13% of all breaches featured losses of over 1 million records. By contrast, there was not a single incident in 2010 that broke that threshold; over 93% of them were smaller than 10,000 records. 47
  • 49.
    Table 14 .Descriptive statistics on records compromised, 2004-2010 (!) With the descriptive statistics out of the way, let’s switch modes and talk about what they 2004-2009 2010 All-Time ('04-'10) mean (sorry, lame statistician’s joke). And Total records 915,599,877 3,878,370 919,478,247 while we’re at it, let’s also talk about what they probably don’t mean. We’ll do that first, Mean 1,963,230 6,687 878,850 in fact. Median 20,000 221 775 Standard deviation 13,141,644 32,854 8,868,990 Why the drop in records? Percentiles The most obvious hypothesis we can easily disprove is that the drop in data loss 10th 12 8 10 corresponds to a drop in breaches. The 25th 360 10 40 opposite is true. The 2010 dataset has more 50th 20,000 221 775 breaches than ever before, but fewer compromised records. 75th 200,000 2,401 19,221 Another explanation that doesn’t seem to 90th 1,200,001 4,826 250,000 hold water is that we (Verizon or the USSS) 99th 60,720,000 157,695 10,000,001 simply didn’t work the big cases like we have in the past. As mentioned in the Year in Review section, other public sources of breach statistics also show dramatic declines in the number of compromised and exposed records in 2010. The year also lacked (as far as we know, at least) the headline-grabbing mega breaches that tend to drive up data loss so quickly. These external data points suggest that something other than sheer caseload bias is at work. It is worth mentioning that 3.8 million is actually a low-end estimate; we were unable to quantify data losses in almost a quarter of all cases and other times could confirm only a portion of the total amount10. Still, increasing 3.8 million by 25% doesn’t change matters in the least. It is possible that one of those unknown quantities was actually a mega breach, but we think not. None exhibited the typical signs that accompany large data compromises we have worked in the past. Our leading hypothesis is that the successful identification, prosecution, and incarceration of the perpetrators of many of the largest breaches in recent history is having a positive effect. Cynics might argue that cybercriminals were just as active and successful in 2010, yet the breaches were never discovered. This isn’t a stretch if you are familiar with the poor discovery-related findings we typically share in this report. However, this would stipulate that criminals are either not using the stolen data or have found a means of bypassing Common Point of Purchase (CPP) and other fraud detection mechanisms. CPP, however, remains the most frequent discovery method. An optimist may interpret these results as a sign that the security industry is WINNING! Sorry, Charlie; while we’d really like that to be the case, one year just isn’t enough time for such a wholesale improvement in security practices necessary cut data loss so drastically. Plus, keep in mind that the number of incidents increased substantially (both in our caseload and those publicly reported). 10 There are many reasons why ascertaining the full and exact amount of data stolen can be difficult. Some victims lack sufficient logs. Some destroy this information in trying to respond to or contain the breach. Many attackers disguise, encrypt, erase, or otherwise make it difficult to access data in order to “count records.” 48
  • 50.
    Now let’s turnto some explanations that do seem plausible. Our leading hypothesis is that the successful identification, prosecution, and incarceration of the perpetrators of many of the largest breaches in recent history is having a positive effect. If you consider that a rather small number individuals were tied to a disproportionately large number of breaches and/or breached records, then you begin to get the sense that taking a few of them out could make a huge difference. A corollary of the above is that the “second tier” of the criminal community has effectively been deterred from engaging in high- profile activity. Pulling off a huge heist might achieve fame and fortune, but it also attracts a lot of unwanted attention. Those that wish to stay out of jail may have changed their goals and tactics to stay under the radar. This could be one of the chief reasons behind the rash of “mini breaches” involving smaller organizations. It is also possible that the talent pool is shallower than expected. Knocking off the kingpins could have precipitated a brain drain of sorts in certain skillsets. We have circumstantial evidence of this, but The focus may continue to shift nothing concrete. For instance, a drop in certain techniques used by in the future from payment card certain criminals correlates with their arrest. But correlation, of course, is not causation. It is also interesting that we consistently have a significant numbers to other data types, such portion of our caseload that ties back to the same individuals or groups. as bank account data, personal If the attacker population were enormous, we wouldn’t expect to see information, and even intellectual that in our sample year after year. property (more on this below). In addition to arrests, law enforcement has been busy infiltrating black markets and other dark corners of the Internet where criminals These are not as flashy in the sheer congregate, cogitate, and negotiate. Their presence is known and number of records lost, but can still stresses the tentative trust among thieves that exists in such communities. This could disrupt the underground economy and account for some of be lucrative to the criminal. what we’re seeing. In the 2009 DBIR, we speculated that the flooding of the black market with millions and millions of stolen data records could drive the price so low that releasing more would be disadvantageous. Criminals might opt to let the markets clear before stealing more in bulk or selling what they already had. We could be in such a holding pattern now. Furthermore, we have seen the scenario of large breaches and subsequent selling of card data on black markets replaced with smaller captures and the direct use of the information for profit (recoding cards and making fraudulent ATM withdrawals). In other words, the people behind the breaches are no longer becoming wholesalers after they capture the credit card information. The focus may continue to shift in the future from payment card numbers to other data types, such as bank account data, personal information, and even intellectual property (more on this below). These are not as flashy in the sheer number of records lost, but can still be lucrative to the criminal. A single business’s bank account information, for instance, can result in a sizable loss of money to the victim in the form of fraudulent transfer or withdrawal of funds. Types of data compromised When reviewing Table 15 for details regarding types of data compromised during breaches in the past year, results show that payment card data maintains its predominance across the combined caseload. The 24% increase from 2009 is directly attributable the large multi-victim cases worked by the USSS, which all had payment cards as the primary target (POS, gas pumps, ATMs, etc.). Separating out Verizon’s 94 cases yields results that look more in line with the previous year’s ratios. Payment cards are desirable to certain types of financially-motivated criminals because there are numerous established options for converting them to cash. 49
  • 51.
    Authentication credentials werenabbed in Table 15 . Compromised data types by number and percent of breaches and percent of records 45% of incidents in 2010, boosting it to the second most compromised data type. Stolen Number of Percent of Percent of credentials are most often a means to an end incidents incidents records but are increasingly an end in and of Payment card numbers/data 593 78% 96% themselves. They can be used to further an Authentication credentials 339 45% 3% attack by gaining privileged and persistent (usernames, pwds, etc) access into the victim’s environment. There is Personal Information (Name, SS#, Addr, etc) 111 15% 1% also a growing market for offloading stolen credentials directly by selling or renting Sensitive organizational data 81 11% 0% (reports, plans, etc) access to organizations (especially high Bank account numbers/data 64 8% <1% profile ones). That authentication credentials Intellectual property 41 5% <1% represent such a low proportion of records shouldn’t be surprising; a lot of damage can System information 41 5% unknown (config, svcs, sw, etc) be done with just one valid account in the Classified information 20 3% unknown wrong hands. Medical records 4 1% unknown Other data types associated with fraud-for- profit activities are personal information and Unknown 7 1% 0% bank account data. Only one or two breaches involved a substantial amount of records for either of these. For various reasons, quantifying an exact number was difficult in many instances, contributing to the lower percentage of data loss shown in Table 15. Not captured in the chart are the hundreds of millions of dollars lost through fraudulent access to compromised bank accounts, identity theft, and other downstream crimes committed with this data. Sensitive organizational data, intellectual property, and classified information still comprise a small proportion of compromised data when compared more cashable forms of data. However, that the ratios remained similar to previous years even in the face of huge gains in the number of smaller payment card breaches implies significant growth among these data types as well. At a glance, this appears to concur with recent speculation that payment cards are passé and that IP is the new goal of cybercriminals. This may well be true, but it’s a little too early to dub it a trend based on case evidence alone. Then again, it is noteworthy that the number of breaches involving such data has Authentication credentials were nabbed never been higher in our caseload. It also should be noted that the real rate of theft for IP and classified information is likely higher in 45% of incidents in 2010, boosting it than any sources (including ours) show. Since fraud detection to the second most compromised data (e.g., CPP) is the most effective means of discovering a breach and type. Stolen credentials are most often a since IP isn’t used for financial fraud, then it stands to reason that thieves could pilfer IP freely without being discovered. This is not means to an end but are increasingly an a comforting thought, but we’ll leave you with it anyway. end in and of themselves. 50
  • 52.
    Attack Difficulty Figure 34 . Attack difficulty by percent of breaches and percent of records* As we have pointed out in previous reports, skilled threat agents—especially well organized groups of them—can breach any single organization they choose given 8% High (18%)(!) enough time, resources and inclination. They cannot, however, breach all organizations. Therefore, unless the perceived benefit is inordinately high, it is not optimal for him to expend his limited resources on a difficult target while an easier one is available. 49% Moderate Rating the relative difficulty of the attacks we observe during investigations admittedly involves some degree of subjectivity, but it is still a useful indicator of the level of effort and expense required to breach corporate assets. It also provides better understanding of the criminals that are responsible for these crimes and what defensive measures organizations should take to protect themselves. Our investigators11 assess the various details around the attack and then classify it according to the following difficulty levels: 37% Low y None: No special skills or resources required. The average user could have done it. y Low: Basic methods, no customization, and/or low resources required. Automated tools and script kiddies. 6% None y Moderate: Skilled techniques, some customization, and/or significant resources required. * Verizon caseload only y High: Advanced skills, significant customization, and/or extensive resources required. Over the past few years, the percentage of highly difficult attacks has hovered somewhere in the mid-teens. Per Figure 34, analysis of our 2010 caseload puts that statistic at 8%, which is the lowest figure among prior DBIRs. This is an interesting finding and poses some interpretive difficulties. The fact that this pertains to Verizon’s caseload only (94 confirmed breaches), rules out the USSS’ huge increase in sample size (which included many smaller and softer targets) as a possible explanation. This seems to be a genuine shift (albeit not a dramatic one) away from highly difficult attacks in the past year. An important observation is that this shift is more from “High” to “Moderate” than from “High or Moderate” to “Low or None”. The sum of the top two difficulty levels in 2010 (57%) is basically the same as 2009 (59%) and higher than 2008 (48%) and years prior (45%). Therefore, we cannot conclude that organizations are increasingly falling prey to simple attacks. Another point to consider is that investigators noticed a higher proportion of automation with respect to attack methods in 2010. Those that once required some human finesse and guidance became a little more “fire and forget” and thus more accessible to lesser-skilled assailants. Such attacks still have the same degree of effectiveness, but are not as difficult to pull off (which is not a trend we want to see continue). In our last two reports, the overwhelming majority of records compromised were associated with highly difficult attacks (~90%). In 2010, however, this statistic dropped to a comparably scant 18%. At the risk of sounding like a broken record (get it?), the much fewer records stolen overall and absence of “mega breaches” is the most likely factor. Most of the largest breaches have historically utilized more sophisticated attacks. 11 Attack difficulty is not a part of the VERIS framework, and therefore, is not a data point collected by organizations partnering with us for this report. As a result, statistics in this section pertain only to Verizon’s 2010 caseload. 51
  • 53.
    As has beentrue in the past, the more difficult parts of the attack sequence typically pertain to malware rather than the method of intrusion (Hacking). Thus, our recommendation for prevention is still to focus on the front end. 90% of attacks are not highly sophisticated, and the method of intrusion is relatively straightforward in most cases. Implement, double, and triple-check the basics so that attackers are not granted a foothold from which to exploit your systems. Attack Targeting Figure 35 . Attack targeting by percent Standard convention in the security industry classifies attacks into two broad of breaches and percent of records* categories: opportunistic and targeted. In past DBIRs, we further separated opportunistic attacks into two subgroups, random and directed. We found it was 17% (21%)(!) getting increasingly difficult to reliably distinguish the two subgroups hence we Targeted merged them back into a single category (i.e., the contrast between levels of opportunity is less important than the contrast between targeted and opportunistic). The updated definitions are provided below: 83% Opportunistic Opportunistic Attacks: The victim was identified because they exhibited a weakness or vulnerability that the attacker(s) could exploit. The exact manner by which this flaw was identified is immaterial; the point is that the victim became a * Verizon caseload only target primarily because of an opportunity. Targeted Attacks: The victim was first chosen as the target and then the attacker(s) determined a way to exploit them. This doesn’t necessarily mean that a weakness or vulnerability wasn’t exploited to accomplish this; it simply means that opportunity is not the primary reason for the attack. Based on data collected by Verizon’s IR team in 2010, the ratio of targeted to opportunistic attacks shown in Figure 35 remained similar to previous years. The percentage of targeted attacks hovered in the high 20% range for 2008 and 2009 whereas it inched down a few notches to 17% in 2010 (not a significant statistical change). The financial industry continued to experience a higher rate of targeted attacks. The hospitality sectors (followed closely by the retail industry) were the highest victims of opportunistic attacks. This was largely due to widespread knowledge in the criminal community about default credentials used for various types of POS systems. Interestingly, more than half of all opportunistic attacks involved malware infections or hacking, some of which included installation of RAM scrapers, keyloggers and/or backdoors on POS terminals and servers. One finding that did constitute a significant change in 2010 was a sharp drop in the percentage of total records compromised from targeted attacks. They accounted for 21% of records compromised compared to 89% and 90% for 2009 and 2008, respectively. As with attack difficulty, this is mainly due to an absence of any mega-breaches in 2010, almost all of which have been targeted in nature. Instead, we saw more targeted attacks at specific types of data that aren’t typically stolen in bulk, like various types of sensitive organizational data and intellectual property. While this aspect may be in line with much of this year’s media buzz around Aurora, APT, Stuxnet, and other highly targeted attacks, the general rule of thumb remains the same: Some organizations will be a target regardless of what they do, but most become a target because of what they do (or don’t do). The general rule of thumb remains the same: Some organizations will be a target regardless of what they do, but most become a target because of what they do (or don’t do). 52
  • 54.
    Thus, our previousrecommendation remains unchanged in that one of the fundamental self-assessments every organization should undertake is to determine whether they are a Target of Opportunity or a Target of Choice. Those in the former category should consistently seek to identify and remove opportunities to avoid needlessly attracting foes. Those in the latter category should expect sophisticated attacks directed from skilled and determined adversaries. They should also expect the cost of control to be much higher. However, remember that even Targets of Choice can fall to opportunistic attacks. Seasoned criminals are not usually dumb and rarely work harder than necessary. Defend against dragons if you must, but don’t watch the skies so much that common rogues slip inside the castle walls from below. Unknown Unknowns Evidence from prior DBIRs has established a correlation between data breaches and the victim’s level of knowledge of their environment and data flow. When an investigation uncovers such gaps in knowledge, we refer to them as “unknown unknowns”. Common scenarios include: y Assets unknown or unclaimed by the organization (or business Figure 36 . Unknown Unknowns by percent of breaches and percent of records* (!) group affected) 100% y Data the organization did not know existed on a particular asset 80% Unknown Assets y Assets that had unknown network connections or accessibility 60% y Assets that had unknown user accounts or privileges 40% 2010 marks the first year in which both the percentage of breaches and 20% data loss associated with unknowns declined. Even with this substantial 0% drop, however, over a quarter of cases still involve one or more of the 2007 2008 2009 2010 conditions listed above. In addition to an overall downward trend, each 100% of the four types of unknowns individually showed a decline as well in 80% Figure 36. Reductions of unknown privileges and network connections Unknown Data 60% were the most notable changes. 40% We cited several reasons for these falling numbers in the 2010 DBIR, and 20% those reasons are still relevant this year. While we cannot empirically prove 0% it to be the case, we certainly hope that organizations are becoming more 2007 2008 2009 2010 aware of their computing environment and where data resides within it. 100% Another year of compliance regulations under companies’ belts may be Unknown Connections 80% helping to improve matters somewhat. There is no doubt that we 60% encounter fewer POS systems, for instance, that store unencrypted data 40% locally in violation of PCI DSS. Mandated network scanning—and, more 20% importantly, the increased scrutiny that follows in order to clear flagged 0% anomalies—can uncover all kinds of unexpected devices, configurations, 2007 2008 2009 2010 services, ports, etc. before they contribute to your next breach. 100% While such actions taken by organizations may provide a partial explanation Unknown Privileges 80% for what we’re seeing, our gut tells us that a shift in criminal tactics is the key 60% factor in this decline. Growing utilization of malware to capture data in- 40% transit, in memory, from user activity, and from system processes reduces the 20% reliance on unknowns in order to successfully compromise data. Why search 0% for data accidentally stored in the clear on some chance system when you 2007 2008 2009 2010 can capture exactly the data you want from the system of your choosing? * Verizon caseload only 53
  • 55.
    Instead of huntingfor a user account with sufficient privileges, why not just use a keylogger or form-grabber to steal credentials for one that you know will suit your needs? Such methods become evermore commonplace and we believe this results in unknown unknowns being less prevalent across our caseload. Not only were unknowns less prevalent, but the amount of data compromised during breaches in 2010 marks the first year in which both the which they were a factor also realized a sizable percentage of breaches and data loss associated decline. In 2009, unknowns were found in just under with unknowns declined. While such actions half of all cases, but those cases comprised over 90% of all data stolen. A recurring theme of the 2010 taken by organizations may provide a partial caseload is the lack of “the big one”—a single breach explanation for what we’re seeing, our gut tells us resulting in multi-millions of records lost. In the past, that a shift in criminal tactics is the key factor in most of these mega-breaches involved one or more unknowns at some point in the event chain. That fact, this decline. combined with a lower amount of unknowns observed in 2010, resulted in only 26% of data loss attributed to a case with one or more unknown conditions. The sharpest drop occurred in “unknown privileges” and “unknown data,” both of which fell from around 90% of records lost to 26% and 21% respectively in 2010. While we are glad to see the drop in the prevalence and impact of unknown unknowns, we doubt that the underlying problem that allows them to exist has truly been addressed. Organizations should continue to strive to improve asset management, user account management, dataflow analysis, and other practices that improve visibility across information assets. These efforts are essential to a risk management strategy and will almost certainly pay dividends in the long run. Timespan of Attack The timeline of an attack must be one of the least understood aspects of a data breach—and yet a good understanding of the breach timeline can be of great importance for properly aligning defense and response mechanisms. We will again describe the timeline of breach scenarios using three major phases. One could distinguish many more if desired, but we think this distinction provides a clear overview and maps well to how incident response processes are typically organized. Figure 37 shows the phases and associated percentages. Point of entry to compromise The first phase depicts the time between the first entry into the victim’s environment to the moment when the data is located and compromised. To use a more physical-world analogy, this is the time between the moment when the attacker first has his foot in the door and the moment when he’s walking out the door with your belongings. In a substantial number of cases, the desired data is not stored on the system that is the first point of entry. In fact, multiple steps are often required to conduct reconnaissance on the network, locate the correct systems, and setup mechanisms to exfiltrate the data from the network. Roughly one-third of breaches in 2010 reveal a timespan of mere minutes between entry and compromise (about the same as 2009). To build upon the analogy above, these are cases in which the loot is lying just beyond the front door—i.e., on the same system that was the initial target of the entry. Similar to previous years, we continue to observe that in over half of cases, an attacker needs a minimum of “days” to successfully complete this stage of the attack. Within that range, however, timeframes shifted noticeably away from “weeks/ months/years” end of the spectrum and into the “days” category. This shift was mainly a byproduct of the higher proportion of automated attacks within 2010 caseload. 54
  • 56.
    Figure 37 .Timespan of events by percent of breaches Minutes Hours Days Weeks Months Years/Never Point of Entry to Compromise 33% 14% 44% (!) 5% (!) 4% (!) <1% Compromise to Discovery <1% 4% 17% 38% 36% 5% Discovery to Containment <1% 11% 23% 49% (!) 15% 2% There is an interesting difference here between the Verizon and the USSS caseload. The USSS cases show almost twice the proportion of the “days or less” grouping. This is explained when one considers the fact that in the USSS caseload, we see both a greater share of ATM skimming cases and a larger number of POS attacks against small merchants. The former cases do not require weeks of preparation, in fact, the attacker wants to install the skimmer as discretely and quickly as possible. Also, the latter involves attacks that can be automated in order to share the same successful approach (or password) across a multitude of victims. Similar to previous years, we continue to observe that in over half of cases, an attacker needs a minimum of “days” to successfully find and compromise data. As stated last year, a couple of days might not sound like a tremendously long time frame, but we’d like to counter this argument. When someone attacks your network for several days, it allows for a greater opportunity for detection before brains beat boxes and significant data loss occurs. We can and should take better advantage of that reprieve than we are now. Compromise to discovery In past years, our reports have shown that victims generally allow a breach to exist for weeks, months, and even years before realizing they’ve been had. 2010 in this regard looks similar, though there was some minor movement among the timeframes. “Weeks” appears to be the gainer, taking share away slightly from the leftmost categories. We’d much rather see a mass migration from the right, which would indicate an improvement in discovery capabilities. When contrasting the Verizon and USSS datasets in Figure 38, one striking difference is that the “months or more” range is notably higher for the Verizon cases than for those of the USSS. This is a rather curious result since the USSS investigates a higher percentage of smaller organizations, which presumably would have slower discovery times. Normally, this would be true, but the USSS often promptly notifies victims after discovering information (through various operations) about a successful breach. 55
  • 57.
    Another factor atwork is the large number of Pay- Figure 38 . Percent of breaches that remain undiscovered for months or more at-the-Pump and ATM skimming cases worked by the USSS. Whether by CPP, complaining 80% customers, or observant users, such thefts tend to 70% be discovered relatively quickly. Verizon 60% If there is any cause for hope in these statistics, it’s that for the fourth straight year we’ve seen a 50% decrease in the percentage of breaches 40% extending months or longer before discovery 30% USSS (65% to 50% to 44% to 41%). Verizon’s cases are 20% still above 60% and consistent with prior years’ data, but at least overall numbers are headed in 10% the right direction. Now if we could just get 0% them to accelerate. <2008 2008 2009 2010 Discovery to containment Regardless of the timespan involved, once an organization realizes that they have been the victim of a breach, quick and effective remediation should be their first objective. We should mention that containment is not defined as the phase in which everything is back to normal, but rather when the data outflow has been stopped. To return to our now somewhat wearied analogy, the door or window is closed and a temporary lock has been installed. However, it’s still a long way from a restored operating environment. Here, the combined dataset again shows a tendency to shift towards the center as compared to last year, with more breaches taking weeks to contain. The higher proportion of smaller organizations that generally don’t have any incident response policy or staff in place is an important contributor to this result. For these victims, the level of effort required to ultimately contain the data breach is low, but the process from initial breach discovery to uncovering the breach methods and taking the necessary steps to contain it is often beyond their capabilities. We have also noticed that a tendency exists for displacement of responsibilitiy when small businesses are the victims of a data breach. Because they usually assume little responsibility for their IT functions, they believe that the vendor who sold them the POS software or terminals holds the responsibility to take action. This may or may not be the case, but the resultant confusion and ambiguity reinforces the fact that organizations of all sizes must have some level of preparation around incident handling and response. To quote last year’s report: Proper Planning Prevents Poor Performance. This mantra can expedite the containment of incidents, while ensuring that actions taken preserve evidence for investigative needs. To quote last year’s report: Proper Planning Prevents Poor Performance. This mantra can expedite the containment of incidents, while ensuring that actions taken preserve evidence for investigative needs. This does not mean that organizations have to practice complicated technical forensic procedures, but rather that they should think about responsibilities and chain of command, define a “freeze point” at which they need to engage external consulting, and ensure practical matters like network diagrams and contact details are up to date and available. Moreover, after the incident is contained, reviewing lessons learned and applying those to future planning is essential. 56
  • 58.
    A COLLECTION OFIR GHOST STORIES Investigating as many breach cases as we do, we encounter a myriad of different situations upon our arrival on scene . Some of these are quite unique, but most are all too familiar variations on a common theme, a theme in which unpreparedness, panic, and the blame game play a major role . While these repetitious occurrences can be frustrating to investigators in the field, they do serve to provide us with opportunities to illustrate to our readers things to avoid during a breach event . We hope these ‘ghost stories’ will provide the reader with a bit of insight into common problems encountered . For instance, we often see the shade of “DIY” in victim organizations . The scenario plays out like this: a breach has been discovered, the IT and security staff try to solve the problem but lack the required training and procedures to do so . The weekend is fast approaching, and management begins to panic . It’s often at this precise moment, typically late Friday afternoon, that we get the call: “We think we have a problem and we have worked on it for the past couple of days—but can you please come and help us out?” Of course, by now precious time is lost and the well-intended actions of the in-house group have complicated the investigation or even spoiled the evidence . While it isn’t crucial that every part of an incident response is outsourced, it is vital that the limitations of the internal group’s knowledge and skillset be known, and a proper escalation path be in place . Once we do finally arrive onsite, one of the first things we ask for is a network diagram of the involved systems . Typically, this elicits a response such as: “Well, we have one, but it’s a little bit outdated . We have decommissioned a few systems, and added a few new environments . Oh, and I meant to include the merger we did last year .” You get the idea . In these situations, we have found that the fastest and most reliable method is to use the “consensus network diagram” . This involves getting everyone with knowledge about the involved systems in a room, giving them a whiteboard and a marker, and asking them to start drawing . It takes a little while, but after everyone provides input there is generally a reasonably usable diagram on the board . This sounds like a simple or even a pleasant exercise, but when you remember that meanwhile valuable data is still leaking from the company, and the frantic CEO is demanding updates . In hindsight, it might have been preferable to have done some of this work beforehand . Another specter that frequently rears its ugly head is that of the disappearing backup . Theoretically, backups are great for investigative purposes . Who wouldn’t want to be able to go back in time to see what happened on a system? Unfortunately, many backup systems are built and managed with business continuity solely in mind and, therefore, are only capable of restoring full backups . In such cases, the victim organization often needs to arrange a complete server to restore the backup to . Not impossible to do, but, again, something that takes valuable time which could have otherwise been saved . We recommend our readers avoid this situation by the simple expedients of either changing the backup software used or proactively ensuring that a spare server is available . The challenges that arise during a breach are not always of a technical nature . Perhaps the most feared fiend of all is that of the third party contract . The typical Service Level Agreement, of course, has a fast response time for those problems deemed most urgent . Unfortunately, “most urgent” is often defined as “an important or critical system being down .” Strange as it may sound, data leakage often doesn’t fall into a category that warrants the highest priority and fastest response . Luckily, some outsourcing companies have the correct mindset about such matters, and tend to try to give priority to those situations that are clearly urgent . However, some stick to the contract and respond with “We will provide the requested log file within 24 hours, according to the SLA for a medium priority incident .” In one case, the victim took more than three weeks before delivering firewall logs to the investigative team . This was because the outsourcing company that managed the system could not locate the physical system, to which they had to attach the external hard drive, within their own datacenter . When outsourcing data, the wise professional will make certain that the protocols for accessing said data during a crisis are fully understood and are acceptable to the organization . 57
  • 59.
    Breach Discovery Methods Oneof the many benefits to studying breaches en masse rather than the myopic view of a single investigator’s caseload or even one team’s caseload is that it allows one to spot things that would otherwise go unseen or appear unremarkable. A bird’s eye view of the ways and means behind breach discovery is one of those areas where this is especially useful. And as veteran readers know, the view hasn’t been very pretty. The Verizon RISK Team uses three main categories to describe discovery methods: External, Internal Passive, and Internal Active. External discovery is fairly self-explanatory; the breach was discovered by an external source and then reported to the victim. For internal discovery we classify incidents as being discovered by Active methods (those that arise from processes specifically designed for detection) or Passive methods (those in which the evidence of breach arises from non-security processes). Over the past few years, we have been closely monitoring this data, Figure 39 . Simplified breach discovery methods since one might argue that the method of breach discovery could act by percent of breaches as a sort of “canary in the coalmine” for the ability of our victims set to detect and respond to security incidents. Data around how victims 5% Internal passive 3% Unknown discover the breach would be an indicator of how well they know and 6% Internal active monitor their own environment. Discovery by Internal Active methods suggests a capable and responsive security program. On the other hand, if the organization is unaware of a breach (as we’re seeing is more often the case than not in Compromise to Discovery data above) 86% and must be told about it by a third party, it is likely they aren’t as External party knowledgeable as they should be with regard to their own networks and systems. 86% (!) With that in mind, we have been watching a particular statistic from 2010 this section—breach discovery by External party. Past reports began 75% to show an encouraging steady decline in breach discovery by third 69% parties and we were hopeful that this would continue. Unfortunately, Pre-2008 2008 61% this year Figure 39 shows a significant increase (25%) in third party breach discovery. One might be tempted to attribute this increase to 2009 the demographic mix of the victims, arguing that smaller companies have fewer resources to expend on difficult and expensive security functions such as traffic, log, and event monitoring. However, when looking at Verizon’s data in isolation we see twice the number of companies with over 1,000 employees (30% vs. 15%) were notified of a breach by a third party. In the USSS data set we saw roughly a 10% reduction in third party discovery (75% vs. 86%). Size just doesn’t seem to matter all that much. A more detailed representation of breach discovery methods for 2010 are shown in Figure 40. The top discovery methods remain relatively unchanged since 2007; third party fraud detection and law enforcement notification continue to be how most victims find out about the data breach. Internal Active and Passive methods show fairly similar ratios at around 5% each, and viewed independently, the Verizon and USSS data show very similar representations for Internal Active discovery methods. Past reports began to show an encouraging steady decline in breach discovery by third parties and we were hopeful that this would continue. Unfortunately, this year we see a significant increase (25%) in third party breach discovery. 58
  • 60.
    Figure 40 .Breach discovery methods by percent of breaches Third party fraud detection 46% (e.g., CPP) Notified by law enforcement 30% (!) Reported by customer/partner affected 6% by the incident Unusual system behavior or performance 3% Internal fraud detection mechanism 2% Internal security audit or scan 2% Witnessed and/or reported by employee 2% Third party event monitoring and alerting service 1% (e.g., MSS) Brag or blackmail by perpetrator 1% Financial audit and reconciliation process 1% Happenstance discovery by unrelated third party 1% Signature-based antivirus 1% Third party security audit or scan <1% Log analysis and/or review process <1% Physical security system <1% (alarms, cameras, etc) System event alert or error message <1% Press release <1% (victim didn’t know prior) Signature-based network IDS <1% Warned by external reports of recent <1% threat activity Unknown 3% Other(s) <1% External Discovery The most common third party detection method is Common Point of Purchase analysis, or CPP. At a very basic level, CPP identifies probable breach victims based on the purchase histories of stolen payment cards. Banks use it to limit their financial losses due to fraudulent transactions, and it works quite well for that purpose. Unfortunately, for CPP to work, the thief must begin committing fraud with the stolen cards. Notification by law enforcement can happen any number of ways. Very often— especially in this particular caseload—law enforcement personnel learn of and alert numerous victims as they identify, research, and monitor suspects. Sometimes confidential informants provide information on the activities and victims of other criminals. Other third party external methods include notification by customers/business partners and in some small number of cases, braggadocio on the part of the threat agent. 59
  • 61.
    You Down WithCPP? CPP is a method that banks employ to limit their financial losses due to fraudulent transactions . Let’s say 200 cardholders all experienced fraudulent purchases on their credit cards . CPP analysis would look at the purchasing history of these cardholders and try to find a common point of sale (e .g ., stores) which they all shared . This is essentially crunching data in such a way that the algorithm determines that all cards in question were used at StoreX in a given period of time . Timeframing, history, geographic location, and many other data points are then used to determine if a particular common point of purchase could be considered to have a high probability of incident . CPP has the advantage of seeing through the fog within an organization by highlighting the glaringly obvious issues from without . A scary thought about CPP is that this detection method is so successful because there is a mechanism (fraud) for correlating the data together . Other types of valuable data such as personal information, health records, e-mail addresses, and authentication credentials can often be harvested from many places, but they do not have the same protective mechanisms as payment cards to detect the data breach . Thus, we believe the numbers around non-payment card breaches are far worse than reported since there is no CPP like mechanism to detect their loss . Internal Active Discovery Figure 41 . Availability of log evidence Internal active discovery relates to IDS/IPS/HIPS, log monitoring and other like for forensics by percent of breaches* technologies that security departments typically use to prevent, detect, and respond to data breaches. Unfortunately, as referenced above, many smaller organizations do not have the awareness, aptitude, funding, or technical 31% support to perform these tasks on par with the sophistication of the threats Unavailable they face. That said, past history has shown that even large businesses seem to 69% have a difficult time utilizing their investments for significant return. Available We often joke (though it’s really not funny) that criminals seem to have better ownership, insight, and control over the environment than the organization paying the bills. Again this year we see a small representation of Internal Active methods; only ~6% of the time did an organization’s designed security efforts * Verizon caseload only detect the breach. In the experience of the investigation team, many of these technology controls are either misconfigured, in the wrong place, or—as is far too often the case—not being utilized at all. For example, one breach victim had recently purchased a SIEM system, but then let the admin go to save cost. We showed up to find it brimming over with alerts pointing to the breach, which was of great use to us, but not so much for them. Again there doesn’t appear to be a club big enough for this dead horse; it might be a great idea to leverage existing technology investments to help detect and respond to data breaches. If there is one positive note that we can squeeze out of these statistics around active measures, it’s that discovery through log analysis and review has dwindled down to 0%. So the good news is that things are only looking up from here. Yeah, that’s squeezing pretty hard, but what else can we do? Figure 41 continues to show that good evidence of the breach usually exists in the victim’s log files waiting to be used. See the “On logs, needles and haystacks” sidebar in the 2010 DBIR for a few tips on smart and cost effective ways to analyze logs. Internal Passive Discovery Internal Passive is best described as when someone who is not responsible for security reports the signs of an incident. Having people aware of the signs of a security incident and knowing what to do when the tell tale signs of a compromise appear is a wonderful thing, a bit like free beer. The depressing alternative is when our investigators hear stories from users about how they noticed strange things on a system they were using but did not report it because they did not know how to report it, or did not feel it could be important. 60
  • 62.
    To take advantageof this “free beer” we recommend that every organization should have a good security awareness campaign, and that they test their people frequently to make sure they understand what the signs of compromise might be for their system, and what to do if they see them. As we said last year, evidence of compromise is not always in the form of subtle indicators that appear in log and event histories admins might be encountering, but rather in obvious, noticeable change that should have been investigated. Anti-Forensics With all the industry buzz around new and advanced threats, you might have anticipated a radical increase in the use of anti- forensics. After all, if you want to be truly persistent, it will likely require repeated access to the victim’s environment and data— each time with the possibility of leaving behind a digital footprint or two. Then again, if you happen to have budgets and resources that most of us only dream about (perhaps the backing of a nation-state?), then wouldn’t you take advantage of anti- forensics? And if you did, would there be any trace of your doing so? The fact of the matter is that for the entire period that we have been studying breaches, we have seen consistent signs of anti- forensics. Based on the most recent evidence, anti-forensics was used in approximately one-third of 2010 breaches worked by Verizon. That represents neither a significant increase nor decrease over the prior year. The important thing to note here is that these numbers are based on evidence. That is, hard facts collected during an investigation. Since the whole purpose of anti- forensics is to remove such evidence, pessimists among us might view that third of breaches as the error rate for anti-forensics rather than the usage rate. A different kind of pessimist might accept one-third as the usage rate and chalk the remaining gap The fact of the matter is that for the entire period that we have been studying breaches, we have seen consistent signs of anti-forensics. Based on the most recent evidence, anti-forensics was used in approximately one-third of 2010 breaches worked by Verizon. That represents neither a significant increase nor decrease over the prior year. up to non-existent logging and self-inflicted anti-forensics performed by the victim. Either way, we can only report what we see. While the overall use of anti-forensics has remained relatively flat, the techniques deployed have an ebb and flow to them. Previously, the most common form of anti-forensics observed in the field was Data Wiping, leading well ahead of all others. The prior pervasiveness of Data Wiping, which includes removal and deletion of evidence, came as no surprise. However, in the last year we have seen Data Hiding (~40%) pull up as a much closer second place to Data Wiping (~57%). With respect to Data Hiding, the use of steganography has remained relatively rare and flat year-over-year. The use of encryption for the purposes of Data Hiding has again contributed most significantly to the rise in Data Hiding. It could be opined that this is potentially a response to the wider usage of DLP or FIM solutions that might otherwise detect clear-text repositories of soon-to-be-exfiltrated data. Where Data Corruption (~4%) was observed, it continued to be mostly manifested as log tampering. It is also interesting to consider these AF numbers in connection with the total quantity of breaches (up) and the total quantity of records compromised (down) that are covered in this study. The steady anti-forensics usage in the face of a much smaller records-per-breach ratio would tend to support the notion that anti-forensics is a tool for the masses and not limited to the elite criminals or highest-value targets. In many cases, the anti-forensic tools being used are found to be common across multiple cases. This likely ties into the increasing underground marketplace for “malware-as-a-service.” This continues to be a trend of interest to our investigative team as the use of anti-forensics plays a significant role in daily activities. We will continue to monitor and report on the evolution of anti-forensics. 61
  • 63.
    PCI DSS Compliance ThePayment Card Industry Data Security Standard (PCI DSS) is a set of control requirements created to help protect cardholder information. Every year Verizon’s caseload contains a number of organizations that are required to adhere to the PCI DSS. Because these are confirmed data breach victims, obvious questions arise with respect to the compliance status of these organizations. This section examines this important topic from several perspectives. “Compliance is a continuous process of adhering to the regulatory standard,” and “Validation . . . is a point-in-time event . . . that attempts to measure and describe the level of adherence to the standard.” In Verizon’s Payment Card Industry Compliance Report (PCIR) from 2010, we made the distinction between “validation” and “compliance.” In that report, we said that, “Compliance is a continuous process of adhering to the regulatory standard,” and “Validation . . . is a point-in-time event . . . that attempts to measure and describe the level of adherence to the standard.” Understanding this distinction between these two contents is important when we look at the data as collected by the Verizon team. Similar to past reports, most organizations (89%) suffering payment card Figure 42 . PCI DSS compliance status based breaches had not been validated compliant with PCI DSS at the time of the on last official audit (or self-assessment)* breach (see Figure 42). That means, of course, that some (11% to be exact) had 11% Compliant passed their most recent validation within the last 12 months as required by the PCI council (or at least attested to that fact during the investigation). In comparison to past reports, this year’s compliance/non-compliance ratio leans a bit more toward “non-compliant.” This modest change is likely due to more level three and four merchants (smaller retailers, hotels, restaurants, etc.) in 89% the dataset, whereas previous caseloads reflected a higher percentage of level Not compliant one or two merchants and/or service providers (e.g., larger financial institutions). In reviewing this demographic mix and the associated lack of compliance, we believe that the data reinforces an assertion we’ve been making for the past * Verizon caseload only three years: to reduce risk, organizations of all sizes need to implement the basic tenets of an information risk management program and maintain this initial investment over time. This includes network and data defense technology basics (firewalls, anti-virus, identity and access management), as well as the non-technical aspects of security and risk management (policy and process development). While the above refers to the victim’s status based upon their last official validation, another important line of inquiry relates to their state when the incident occurred. When our investigators work a case in which the victim organization processes payment cards, a review is conducted of which PCI DSS requirements were and were not in place at the time of the breach. The results of this assessment are recorded, appended to the case report, and then conveyed to the relevant payment card brands. This work is not an official PCI DSS audit, nor does it either uphold or overrule the victim’s compliance status. That said, it does provide insight into the condition of the security program of the victim organization at the time. In the incident report delivered to the card brands, investigators break down compliance by PCI DSS requirement. If the DSS represents the basics of an information security program, then we are able to get a high-level understanding of the state of the security program at the time of investigation. In Table 16 we present the results of these assessments over time. Additionally, we’ve added a column that presents data from our 2010 Payment Card Industry Compliance Report (PCIR). 62
  • 64.
    This report reflectsinformation from Initial Reports on Compliance (IROCs) conducted by Verizon’s team of Qualified Security Assessors (QSAs). The IROC is essentially an initial state (pre-validation) analysis of the client’s adherence to the DSS. We’ve included this data for reference because it allows us to infer which sections of the PCI DSS organizations find most difficult to satisfy. Table 16 . Percent of relevant organizations in compliance with PCI DSS requirements based on post-breach reviews conducted by Verizon IR team Build and Maintain a Secure Network 2008 2009 2010 PCIR Requirement 1: Install and maintain a firewall configuration to protect data 30% 35% 18% 46% Requirement 2: Do not use vendor-supplied defaults for system passwords and other security parameters 49% 30% 33% 48% Protect Cardholder Data Requirement 3: Protect Stored Data 11% 30% 21% 43% Requirement 4: Encrypt transmission of cardholder data and sensitive information across public networks 68% 90% 89% 63% Maintain a Vulnerability Management Program Requirement 5: Use and regularly update anti-virus software 62% 53% 47% 70% Requirement 6: Develop and maintain secure systems and applications 5% 21% 19% 48% Implement Strong Access Control Measures Requirement 7: Restrict access to data by bustiness need-to-know 24% 30% 33% 69% Requirement 8: Assign a unique ID to each person with computer access 19% 35% 26% 44% Requirement 9: Restrict physical access to cardholder data 43% 58% 65% 59% Regularly Monitor and Test Networks Requirement 10: Track and monitor all access to network resources and cardholder data 5% 30% 11% 39% Requirement 11: Regularly test security systems and processes 14% 25% 19% 38% Maintain an Information Security Policy Requirement 12: Maintain a policy that addresses information security 14% 40% 16% 44% The 2010 compliance data simply doesn’t provide us with a basis for optimism. Overall, things look better than 2008, but worse than 2009. Before jumping to conclusions about PCI backsliders, however, consider one important fact: this apparent decline may be partially explained by the demographic differences discussed above. 2009 was a smaller caseload (54 breaches) with a higher ratio of larger organizations than 2010 (94 breaches). Granted, that’s no excuse since all of the organizations represented process, store, or transmit payment card information and, therefore, should meet all requirements. Despite the rather poor showing, let’s see what we can learn. Eight of the twelve requirements posted lower numbers than the year before, some by a fairly large margin. Requirements 1, 2, 5, and 12 are at or very near their historic lows, hinting at rather immature security programs. Firewalls, Anti-Virus, changing default credentials, and related concepts could all be found in “best practice” documents for information security from 15 years ago (or more). So, either the “security message” isn’t reaching smaller businesses or we, as an industry, are not explaining the benefits well enough for them to make the extra effort, or they aren’t willing or compelled to do so for various other reasons. 63
  • 65.
    In addition, lowmarks in other technical aspects of the PCI DSS (Requirements 3, 8, 10, 11) are similar to the areas that our QSA clients struggled to meet. The association here is too strong to ignore; PCI compliance is not easy, and security is not something to be addressed once every twelve months. Installing and maintaining a firewall configuration to protect data, developing and maintaining secure systems and applications, restricting access to data by business need-to-know, tracking and monitoring all access to network resources and cardholder data, and maintaining a policy that addresses information security (Requirements 1, 6, 7, 10, 12) are all aspects of the DSS that need an investment in continuous processes and upkeep to be effective. What does appear to be working are areas where the security-conscious aspects of our industry can “bake security in.” Requirement 4, “Encrypt transmission of cardholder data and sensitive information across public networks,” is one that has been increasingly addressed by hardware and software vendors, as well as the vendor management programs of banks and card processing vendors. We see Requirement 4 holding steady at around 90% compliance in victim environments over the past two years. We’ll end this year’s PCI section on a pragmatic note. One of the lingering questions from our discussions around PCI in this report is always that of relevancy. It’s all well and good to validate compliance with the PCI DSS, but does it actually help reduce risk? Insofar as that translates to a sincere security program—one that seeks to maintain validation on an ongoing basis—the data strongly suggests the answer is “yes.” Let’s examine some of the results in Table 16 in light of threat actions discussed earlier in this report. One of the lingering questions from our discussions around PCI in this report is always that of relevancy. It’s all well and good to validate compliance with the PCI DSS, but does it actually help reduce risk? Insofar as that translates to a sincere security program—one that seeks to maintain validation on an ongoing basis—the data strongly suggests the answer is “yes.” The first and perhaps most noteworthy example of this would be found in Requirement 2 (Do not use vendor-supplied defaults for system passwords and other security parameters). In our previous section on Hacking, we find that “exploitation of default or guessable credentials” is represented in two-thirds of all intrusions and accounts for nearly one-third of all records compromised. Similarly, “exploitation of insufficient authentication” is found in 10% of all intrusions and ascribed to 21% of all records breached. Requirement 5 (Use and regularly update anti-virus software) can be directly mapped to the high frequency of malware used to compromise systems and data. Sure, over 60% of malware is customized and not likely to be detected by AV, but that means about 40% stands a decent chance of being recognized. Who doesn’t want a 40% reduction in risk? When malware isn’t recognized by AV and is installed on the system, all is not lost. Requirement 1 (install and maintain firewall configuration) and Requirement 10 (track and monitor all network access) are a critical second line of defense against backdoors and other common types of malware and intrusion methods. Let’s do one more (though we could go on for some time). Requirement 6 (Develop and maintain secure systems and applications) and Requirement 11 (Regularly test security systems and processes) are both important processes that relate to the broader category of Hacking (50% of breaches/89% of records). Because Hacking is often used in order to install malware, secure development and testing can be considered to reduce the risk of that threat action as well (page 24, 49% of breaches/79% of records). Every year that we study threat actions leading to data breaches, the story is the same; most victims aren’t overpowered by unknowable and unstoppable attacks. For the most part, we know them well enough and we also know how to stop them. Mapping common threat actions from 1700+ confirmed breaches to PCI DSS requirements simply does not reveal many gaping holes or grossly inadequate coverage. Does that mean the DSS is perfect? Not at all; few things are. Fortunately, perfection is not a precondition for significant risk reduction benefits. 64
  • 66.
    Conclusions and Recommendations At the conclusion of our last report, we stated: “Creating a list of solid recommendations gets progressively more difficult every year we publish this report. Think about it; our findings shift and evolve over time but rarely are they completely new or unexpected. Why would it be any different for recommendations based on those findings? Sure, we could wing it and prattle off a lengthy list of to-dos to meet a quota but we figure you can get that elsewhere. We’re more interested in having merit than having many.” But surely after examining another 800 breaches in the past year, we’d have plenty of new recommendations to solve all your security woes, right? Quite wrong, actually. The latest round of evidence leads us to the same conclusion as before: your security woes are not caused by the lack of something new (Figure 43 looks about like it always does). They almost surely have more to do with not using, under using, or misusing something old. The argument levied against that notion is that our adversaries are clever Figure 43 . Cost of recommended preventive rascals and will adapt in order to our thwart our “old” defenses. That is true measures by percent of breaches* (and we’ve seen and discussed evidence of such adaptation), but let’s be real, 4% Difficult and expensive shall we? As a whole, do you really think we’re making them scramble to adapt? Year after year our data seems to suggest that we are not, and that is something that needs to change. If they adapt, then they adapt. C’est la vie. 33% 63% But let’s quit allowing them to find success in stagnation. Intermediate Simple and cheap To that end, we’ve found some old recipes for achieving newfound success. We examined top attacks from 2010 and identified recommendations from our previous reports most applicable to them. They are categorized and listed below and we hope they help you at the planning and budget negotiations table. * Verizon caseload only Overall Achieve essential, and then worry about excellent: We find that many organizations achieve very high levels of security in numerous areas but neglect others. Criminals will almost always prefer the easier route. Identifying a set of essential controls and ensuring their implementation across the organization without exception, and then moving on to more advanced controls where needed is a superior strategy against real-world attacks. The argument levied against that notion is that our adversaries are clever rascals and will adapt in order to our thwart our “old” defenses. That is true (and we’ve seen and discussed evidence of such adaptation), but let’s be real, shall we? As a whole, do you really think we’re making them scramble to adapt? Access Control Change default credentials: Simple and sweet, when system/network admins stand up a new system, change the password. If you outsource this to a third party, check that they’ve changed the password. Don’t assume that your staff or your partners consistently follows through on all policies and procedures. Along with changing default credentials, organizations should ensure that passwords are unique and not shared among users or used on different systems. This was especially problematic for assets managed by a third party. 65
  • 67.
    Every year thatwe study threat actions leading to data breaches, the story is the same; most victims aren’t overpowered by unknowable and unstoppable attacks. For the most part, we know them well enough and we also know how to stop them. User account review: Prior year’s data breach reports and years of experience lead us to believe in the value of reviewing user accounts on a regular basis. The review should consist of a formal process to confirm that active accounts are valid, necessary, properly configured, and given appropriate (preferably least) privileges. Restrict and monitor privileged users: Trust but verify. Use pre-employment screening to eliminate the problem before it starts. Don’t give users more privileges than they need (this is a biggie) and use separation of duties. Make sure they have direction (they know policies and expectations) and supervision (to make sure they adhere to them). Privileged use should be logged and generate messages to management. Unplanned privileged use should generate alarms and be investigated. Network Management Secure remote access services: In many instances, remote access services have been enabled and are Internet-facing. We recommend tying these services down where only specific IP addresses or networks can access them. Additionally, it’s important to limit access to sensitive systems within the network. Many organizations will allow any device on the network to connect and remotely access any other device; we highly recommend not managing your devices this way. Tie down remote access services to specific management networks via access control lists. Monitor and filter egress network traffic: At some point during the sequence of events in many breaches, something (data, communications, connections) goes out that, if prevented, could break the chain and stop the breach. By monitoring, understanding, and controlling outbound traffic, an organization will greatly increase its chances of mitigating malicious activity. Secure Development Application testing and code review: SQL injection attacks, cross-site scripting, authentication bypass, and exploitation of session variables contributed to nearly half of breaches attributed to hacking or network intrusion. It is no secret that attackers are moving up the stack and targeting the application layer. Why don’t our defenses follow suit? As with everything else, put out the fires first: even lightweight web application scanning and testing would have found many of the problems that led to major breaches in the past year. Next, include regular reviews of architecture, privileges, and source code. Incorporating a Security Development Life-Cycle (SDLC) approach for application development is recommended as well. Finally, help your developers learn to appreciate and write more secure code. Log Management and Analysis Enable application and network witness logs and monitor them: All too often, evidence of events leading to breaches was available to the victim but this information was neither noticed nor acted upon. Processes that provide sensible, efficient, and effective monitoring and response are critical to protecting data. However, don’t just focus your logging efforts on network, operating system, IDS, and firewall logs and neglect remote access services, web applications, databases, and other critical applications. These can be a rich data set for detecting, preventing, and investigating breaches. Define “suspicious” and “anomalous” (then look for whatever “it” is): This is admittedly vague, but—in truth— generalizing what this entails in order to prescribe something for everyone would counteract the point. Discover what is critical, identify what constitutes normal behavior, and then set focused mechanisms in place to look for and alert upon deviations from normality. 66
  • 68.
    Change your approachto event monitoring and log analysis: Based on the data we collect in the Time of Breach events, we believe that organizations would be better served to focus less on the “real-time” methods of detection, and more on the “this- week” methods. If we can shift Compromise to Discovery time frame from Weeks and Months to Days, it will significantly reduce the damage done to your organization. Focus on the obvious things rather than the minutia. This need not be expensive; a simple script to count log lines/length and send an alert if out of tolerance can be quite effective. We are confident that this approach will reap benefits and save time, effort, and money. Training and Awareness Increase awareness of social engineering: Educate employees about different methods of social engineering and the vectors from which these attacks could come. In many of our cases, we see where users click on links they shouldn’t and open attachments received from identified persons. Reward users for reporting suspicious e-mail and sites and create the incentives necessary for vigilance. Train employees and customers to look for signs tampering and fraud: Such awareness campaigns have been around in certain areas for some time, but ATM and Pay-at-the-Pump tampering/fraud seem to be increasing in number and scope. Organizations operating such devices should consider conducting regular examinations of them. Additionally, empower customers to help protect themselves as well as aiding the organization in spotting potential issues. Incident Management Create an Incident Response Plan: If and when a breach is suspected to have occurred, the victim organization must be ready to respond. An effective Incident Response Plan helps reduce the scale of a breach and ensures that evidence is collected in the proper manner. Engage in mock incident testing: I mean listen, we’re sitting here talking about practice; not an incident, not an incident, not an incident—but we’re talking about practice (sports fans among you might get that reference). Yes, we are talking about practice, because practice makes perfect. In order to operate efficiently, organizations should undergo routine IR training that covers response strategies, threat identification, threat classification, process definition, proper evidence handling, and mock scenarios. A Call to Data Sharing One of the most critical and persistent challenges plaguing efforts to manage information risk is a lack of data. As community decision-makers and practitioners, we have little data because we do not share and while there are many reasons for this, doubts that it can be done in a practical, private, and mutually beneficial manner are chief among them. We would like to think that this report is an example that sensitive and useful data can be shared responsibly to the benefit of many. In the past two years, several other investigative firms have begun to share their results and we commend those efforts. Every little “bit” shared helps. It would be great if others joined in as well—and if you’d like to report results using VERIS so we can all compare apples to apples, we’ll be glad to help however we can. We would also like to extend an invitation to other organizations to consider using the VERIS community website12 to anonymously report security incidents (any kind—not just data breaches). All (aggregated and anonymous) results will be made freely available to the community. By sharing incident information, you will add to the collective knowledge of the community while gaining access to the VERIS dataset for yourself. The overall goal is to lay a foundation from which we can constructively and cooperatively learn from our experiences to better manage risk. We realize that your time is valuable, so we once again thank you for taking out a chunk of it to read this report. 12 https://www2.icsalabs.com/veris/ 67
  • 69.
    Appendix A: CaseStatistics from the Dutch High Tech Crime Unit The data and statistics below represent a sample of 32 data breach investigations by the Dutch National High Tech Crime Unit reaching back to 2006. As mentioned in the methodology earlier in our report, the NHTCU caseload varies from year to year, data breaches being only one aspect of their mission. The NHTCU targets cases they classify as “high tech crime,” which can roughly be defined as those Table A1 . Organizational size by number forms of crime that are organized, target computer systems, and use of breaches (number of employees) sophisticated new technology or methods. Cyber-related issues that target 1 to 10 0 vital national interests are also taken up. 11 to 100 1 These 32 breaches encompassed a total of 144,076 data records confirmed 101 to 1,000 4 by the NHTCU to be compromised. However, the extent of data loss could not be determined for the majority of incidents, so this figure represents 1,001 to 10,000 9 the lowest end of the potential range (we discuss reasons for this in the 10,001 to 100,000 14 main report). In this section, we highlight findings from these investigations, Over 100,000 2 concentrating on the agents, actions, assets, and attributes involved. In Unknown 2 reviewing this data, you will see that these are not unlike those seen in both the Verizon and USSS case sets over the last several years. Demographics Figure A1 . Industry groups represented by number of breaches The NHTCU’s cases spanned several different industries, organizational sizes, and locations. The top victim industry was that of Financial Services, which Financial Services 16 included some of the largest banks in the Netherlands as well as others Education 7 throughout Europe and the United States. Those victims within the Education Tech Services 7 industry consisted mostly of European universities. Technology Services Government 1 victims were a mix of managed IT and security services firms and software development shops. Several of these organizations lost valuable IP and other Retail 1 sensitive data. Per Table A1, organizational size was weighted toward larger organizations. Figure A2 . Threat agents (inclusive) by number Agents of breaches 32 Every case involving a data breach within the NHTCU’s incidents involved an external agent, of which most were from Eastern and Western Europe. Based on the details of case selection listed above, it’s not surprising that 1 - three-quarters of the external agents are categorized as organized criminal External Internal Partner groups. The next largest group is unaffiliated person(s). One of the NHTCU’s investigations included an insider who did not act deliberately, but nonetheless broke a policy regarding the reuse of corporate passwords Figure A3 . Compromised records by threat agent that led directly to one of the data breaches. 144,076 17 - Yet another dataset showing a strong majority of external agents in both frequency and data loss. Isn’t that interesting? External Internal Partner 68
  • 70.
    Actions Figure A4 . Top threat action types by number of breaches The top three threat action categories were Hacking, Malware, and Social. The most common Hacking Use of stolen login credentials 27 types of hacking actions used were the use of 22 Malware Send data to external site/entity stolen login credentials, exploiting backdoors, Malware Capture data from an application/system process 16 and man-in-the-middle attacks. These were often carried out via the web or backdoors Malware Download/install additional malware or updates 16 opened by malware. Malware functions most Hacking Man-in-the-middle attack 15 often seen were form grabbers (capture data Social Phishing (or any type of *ishing) 15 from user activity), backdoors that allowed remote access, and exfiltration mechanisms such Social Spam 15 as sending data to an external entity. Infection Social Counterfeiting/forgery (fake website, docs, etc) 15 vectors reflect two of the common pathways 8 Malware Backdoor (allows remote access/control) seen in Verizon and USSS data sets of user- Hacking Exploitation of backdoor or command and control channel 8 executed or download via the web or Internet or where it was installed directly by the attacker. Malware Packet sniffer (capture data from network) 7 Lastly, the action category of Social shows Malware System/network utilities (PsTools, Netcat) 7 phishing and spam attacks via e-mail combined Hacking SQL injection 4 with fake websites that mostly targeted customers of Financial Services organizations. In several incidents, organized crime utilized all three of the above actions to meet their goal of stealing data and performing fraud. All in all though, the actions were very similar to those seen in the Verizon and USSS cases over the last several years. Figure A5 . Threat action categories by number of breaches and records Malware 24 / unknown Hacking 30 / 139,477 Social 17 / 1 Misuse 1 / 17 Physical 1 / 4,599 Error 0/- Environmental 0/- 69
  • 71.
    Assets The most commontypes of assets involved in breaches investigated by the NHTCU were those within the Servers category. The assets attacked most often in this category were web, database, and file servers. The actions most often used against these devices were use of stolen login credentials and SQL injection. End-users systems regularly attacked were desktop and PIN entry devices. The attacks against desktops were form grabber malware as well as man-in-the-middle attacks. Agents tampered with a dozen or so PIN entry devices belonging to one large firm as part of intricate carding schemes. Lastly, the People category consisted mostly of customers of financial services institutions. In these incidents, the attackers would utilize Social attacks to steal credentials and the commit fraudulent financial transactions. The majority of assets were hosted externally and managed by a third party. Figure A6 . Categories of affected assets by number of breaches and records Servers 30 / 139,477 End-User Devices 17 / 4,599 People 16 / - Offline Data 2/- Networks & NW Devices 0/- Attributes These results pertain to data breaches, so the security attribute of confidentiality was involved in all 32 incidents. Similar to the Verizon-USSS dataset, this was closely followed by losses of integrity, which encompasses a myriad of unauthorized changes to systems during an attack scenario. Losses of authenticity dealt with fraudulent transactions initiated after perpetrators gained access to and control of these assets. Figure A7 . Security Attributes Affected by number of breaches Attributes affected Definition Breaches Confidentiality Limited access, observation, and disclosure 32 Possession Exclusive (or intended) possession and control (and ability to prove it) 0 Integrity Complete and unchanged from original state 31 Authenticity Validity, conformance, and genuineness 17 Availability Present and ready for use when needed 0 Utility Usefulness or fitness for a purpose 0 70
  • 72.
    Breach Discovery Similar toevery other dataset we’ve studied, most breaches investigated by the NHTCU lasted several months before the victim learned of them. Also in line with our other findings, this discovery was usually made by a third party. This was usually found by law enforcement personnel (the NHTCU and others) during the investigation of another (sometimes related) incident. We’d like to thank the NHTCU for providing us (and you) with this case data and enabling this brief overview of breach trends in Europe. Such cooperation is critical to understanding and managing breaches around the world. We also hope it helps you accomplish that goal in your neck of the woods. Appendix B: Project Taurus and the Bredolab Takedown In 2010, the Dutch NHTCU decided to start a public-private partnership to combat botnets. Getting together with members of the CERT community, industry, and internet infrastructure they devised a three stage approach, consisting of intelligence, intervention, and investigation. Project Taurus was born. All partners combined their state of the art botnet information and all botnets were tracked real time using a university-developed tool. The goal was a notice and takedown for most of the botnets and a deeper investigation into some of them. Then, one of the partners, a large internet service provider, found a botnet command and control server in their infrastructure. The partners started investigating and found a cluster of 143 malicious servers, seven of which were directly related to a botnet called Bredolab. At that point, Bredolab had been able to infect 30 million unique IP addresses. In a ten week period the partners were able to draw a picture of the botnet infrastructure based on the network traffic. They were also able to identify the suspected operator of the network, an Armenian who planned to come to the Netherlands for a dance party. The network was set to be dismantled on the day the Armenian would arrive at Amsterdam airport. The Armenian was to be arrested on arrival but due to visa problems he never showed up. Instead, he noticed someone attacking his botnet, assumed it was a competitor and fought back. After trying several backdoors, he decided to DDoS what was left of his own botnet. Due to good international cooperation, the command and control server of the DDoS botnet was quickly dismantled. An Interpol red notice led to the arrest of the suspect the following day at Yerevan airport. A piece of code was written and put on the botnet server to be downloaded by the bots. This code would cause a warning window containing cleaning instructions to pop up at the victims’ computers. The law enforcement obligation of helping the victims was judged to precede potential judicial concerns in this action. The combination of creativity, new techniques, close cooperation, and hard work enabled the Taurus partners to go further than any of them would have been able to go alone. About Verizon Investigative Response Security breaches and the compromise of sensitive information are a very real concern for organizations worldwide. When such incidents are discovered, response is critical. The damage must be contained quickly, customer data protected, the root causes found, and an accurate record of events produced for authorities. Furthermore, the investigation process must collect this evidence without adversely affecting the integrity of the information assets involved in the crime. The IR team has a wealth of experience and expertise, handling over 800 security breach and data compromise cases in the last six years. Included among them are many of the largest breaches ever reported. During these investigations, the team regularly interacts with governmental agencies and law enforcement personnel from around the world to transition case evidence and set the stage for prosecution. The expansive data set generated through these activities offers an interesting glimpse into the trends surrounding computer crime and data compromise. 71
  • 73.
    About the UnitedStates Secret Service As the original guardian of the nation’s financial payment system, the United States Secret Service has established a long history of protecting American consumers, industries and financial institutions from fraud. Over the last 145 years, our investigative mission and statutory authority have expanded, and today the Secret Service is recognized worldwide for our expertise and innovative approaches to detecting, investigating and preventing financial and cyber fraud. Today’s global economy has streamlined commerce for both corporations and consumers. Financial institutions and systems are readily accessible worldwide. Today’s financial fraud and cybercriminals have adapted to this new means of global trade and seek to exploit this dependence on information technology. Cybercriminals consequently have become experts at stealing stored data, data in transit, and encrypted data. They operate based on trust, long standing criminal relationships, high levels of operational security, and reliability. The culture also has evolved over the last decade and is now described as non-state sponsored, transnational and is almost impossible to infiltrate due to its dynamic nature and operational security. To combat these emerging threats, the Secret Service has adopted a multi-faceted approach to aggressively combat cyber and computer related crimes by establishing a network of 31 Electronic Crimes Task Forces (ECTF), including the first international ECTF located in Rome, Italy, 38 Financial Crimes Task Forces (FCTF) and a Cyber Investigations Branch. This approach enables the Secret Service to detect, prevent, and aggressively investigate electronic crimes including cyber attacks on the nation’s critical infrastructures and financial payment systems. For more information or to report a data breach, please contact your local Secret Service office at www .secretservice .gov. About the Dutch National High Tech Crime Unit The Dutch National High Tech Crime Unit (NHTCU) is a team within the Dutch National Police Agency, dedicated to investigating advanced forms of cybercrime. The team’s vision is to make the Netherlands an unsafe place for cyber crime. In addition to Dutch victims and criminals, this includes the use of Dutch infrastructure in criminal activities. The team specializes in using out of the box investigation methods and techniques to find and target the most important players in the criminal chain. The team has excellent contacts in North America, Western and Eastern Europe, and often plays the role of bridge builder between High Tech Crime Units in different countries. Another success factor is the advanced cooperation with other public and private partners, where information is freely shared and joint strategies are implemented. An example of such cooperation can be read in the description of the Bredolab case. The NHTCU recently started up the Dutch Electronic Crimes Task Force, a new cooperation with financial and other parties to institutionalize public-private partnership as a means to actively combat certain types of cybercrime. pplwc 72
  • 74.
    U2FsdGVkX180AaM+aGDY0cUgudzihpyjBoJJEIwu5CW4aLf7EeoMz3FuwU0WrSmK D+pq8WBiECoFNB1K0qesbQBtCkbrOZyufwWKEcy3KwTQfdG6LSiswvfHq0R1slNT © 2011 Verizon. All Rights Reserved. MC14949 04/11. The Verizon and Verizon Business names and logos and all other names, logos, and slogans identifying Verizon’s products and services are trademarks and service marks or registered trademarks and service marks of Verizon Trademark Services LLC or its affiliates in the United States and/or other countries. All other trademarks and service marks are the property of their respective owners. dKuZ0DREk3N5NK5BDzbrFwI+4znBihkILoatsKQ6uR0BlxoHQnoyNT/tYMKv/r/Q 1IDr5qedtUFhGIBSjKgRNg+kUeTzyi/U+jKSzLPR2BiBj2N4YqjCqvzVgFfsqVgU asOjYIcxyPcRug6TL+OqRoiA8D1IoSRZ1egd7OxoBBx6vYFnsjCvZ7FQB9llGX/7 bAslhxlyQlm05K7zi4MRE8pjp7+S8o86GQqbwNB/R7oqvXjMva4smb9fvIz5xWLR a8NGak2fYo7PlOtWYcg/o2+pX2SazaABum3uggTxaPAqs1XdTFlswkuRslshkj6o OsPwv/+/WO4+PEYDseZW4tlcigq37i1Dy6SLBCk8d2CO5Lo9UqKyZWRNTxb6795z /10O02TTBvFCv4O7uo13HRQw2xYqxsODzjxoZXnmffWhV2+59Dus1iHQJaSr6QGF 0GqrHD6vT54XKP8ph8M7f5pxBC6b8qdV2Gz3agDJEcsAvrfnC7wgdVhK0rqueZGL zQVU2KoFte2xS2CTs4bqAOygsATBQ9CjQPYb4p1ay6zW4iE9XbcA7r80foQ69MmZ Mk8iL22lfOMlECHcmKjCln7rGH9X0n/4/VMgrf4pKnHJeqCc58Trlf5LvjEoWJVW BLc9nrBUeJZAo50s1q2EtBA0EICyz63uOnzbN543CGI= verizonbusiness.com/thinkforward verizonbusiness.com/socialmedia verizonbusiness.com