1. M.Sangeetha / International Journal of Engineering Research and Applications
(IJERA) ISSN: 2248-9622 www.ijera.com
Vol. 3, Issue 1, January -February 2013, pp.1532-1536
Analysing Image Quality via Color Spaces
M.Sangeetha1
1
Department of Computer Science , Sri Sarada Niketan College for Women, Amaravathi Pudur, Karaikudi-
630301, Tamilnadu, India.
Abstract
Color space is the mathematical axis spaces: It results from other spaces by applying
representation of a set of colors. A large amount mathematical operations that aim at decor relating
of color spaces have been proposed for different individual components.
purposes. But the RGB color space is a basic and
widely used color space, and other color spaces This work proposes that, RGB color space
are usually defined by transformation of the are transformed into different color spaces and
RGB color space. This paper focuses on the applied in images. Next, separate images have to be
application of Other color spaces in images by analyzed, to find the certain image quality factors.
transforming the RGB color space. Also a Image qualities should be better with another that
statistical analysis of the sensitivity and color space is good. The impact of this proposed
consistency behavior of objective image quality work is all are known RGB is the first and best color
measures are performed. So that resulting the space. But what is the next color space we are not
image qualities can be decided that which Color known. In this proposed work to analyze which
space is better without the interference of RGB color space better and provide rank of color space
color space. depends upon the quality factors. This work is an
extension of Jian Yang, ChengjunLiu, and LeiZhang
Keywords: Color Space, Image Quality, RGB which used Color space normalization techniques
color space. used in face recognition. Here, we introduce the new
method for color space apply in whole image and
1. Introduction detect the quality of the image. In the general way,
Color is the brains reaction to a specific the simplicity of implementation, the low processing
optical input signals from the eye. The retinas in our cost and the high quality of results can be
eyes though have three types of color receptors in considered as the main contributions of our work.
the form of cones. We can actually only detect three Also, we verified that our methods are more robust
of these visible colors - red - blue and green. These than other implemented methods.
colors are called primary color space. In this three This paper is organized as follows. In
colors that are mixed in our brain to create several Section 2 we present a related works. In Section 3
different “sensations” of the color. These sensations we propose a color space conversion. In Section 4
have been defined by the CIE different Measuring we propose a quality measures to find the image
Color like Brightness, Hue, Colorfulness, Lightness, quality. In section 5 gives my proposed works in
Chroma, and Saturation. So this measuring color this paper. In Section 6 we report on a experimental
combination to produce the different color space analysis for both color space conversion result and
from primary color space. comparative analysis for all color spaces. Some
conclusions and a summary of future works are
A color space is a method of representing given in Section 6.
each color in terms of a combination of several
numeric values. It is a method by which we can 2. Related Works:
specify, create and visualize color. Different color Jian Yang, ChengjunLiu, LeiZhang paper
spaces are better for different concerned presents the concept of color space normalization
applications. Now days we can use several color (CSN) and two CSN techniques for enhancing the
space. Some of the color spaces are,RGB, discriminating power of color spaces for face
CMY,XYZ,xyY,|1|2|3|,UVW,LSLM,L*a*b,L*u*v, recognition. The experimental results reveal that
LHC,LHS,HSV,HSI,YUV,YIQ,YCbCr. All these some color spaces, like RGB and XYZ, are
color spaces under the category of primary relatively weak for recognition, where as other color
spaces: It is based on the trichromatic theory which spaces, such as I1I2I3, YUV, YIQ and LSLM, are
states that any color can be expressed as a mixture relatively powerful.
of three primaries. Luminance-chrominance: It İsmail Avcıbas, Bülent Sankur statistical
represents colors in terms of luminosity and two analysis of the sensitivity and consistency behavior
chromaticity components. Perceptual spaces: It is of objective image quality measures. We categorize
based on the human visual system and commonly the quality measures and compare them for still
strives for being perceptual uniform. Independent image any applications. The measures have been
1532 | P a g e
2. M.Sangeetha / International Journal of Engineering Research and Applications
(IJERA) ISSN: 2248-9622 www.ijera.com
Vol. 3, Issue 1, January -February 2013, pp.1532-1536
categorized into pixel difference-based, correlation- compute chroma, by multiplying saturation by the
based, edge-based, spectral-based, context-based maximum chroma for a given lightness or value.
and HVS-based (Human Visual System-based) Next, we find the point on one of the bottom three
measures. faces of the RGB cube which has the same hue and
chroma as our color (and therefore projects onto the
3. Color space conversion same point in the chromaticity plane). Finally, we
Color space conversion is the translation of add equal amounts of R, G, and B to reach the
the representation of a color from one basis to proper lightness or value.
another. This typically occurs in the context of
converting an image that is represented in one color
space to another color space, the goal being to make
the translated image look as similar as possible to
the original. All the image get color information
from which contains only RGB values. In the RGB
color space each color appears as a combination of
red, green, and blue. RGB is a basic color space for
computer graphics because color displays use red, 3.4. RGB to YCbCr conversion
green, and blue to create the desired color. This It is used as a part of the color image
model is called additive, and the colors are called pipeline in video and digital photography systems.
primary colors. Basically the color space value of Y is the luma component and CB and CR are the
RGB is to be known for formulating the other color blue-difference and red-difference chroma
space conversion. In this paper we concentrate components. The equations of the RGB to YCbCr
following color space conversion. are formed in a way that rotates the entire nominal
RGB color cube and scales it to fit within a (larger)
3.1. RGB to YIQ conversion YCbCr color cube.
The YIQ color space was formerly used in
the National Tele-vision System Committee (NTSC)
television standard. The Y component represents the
luma information, and is the only component used
by black-and-white television receivers. I and Q
represent the chrominance information. The YIQ 3.5.RGB to L*a*b
system, which is intended to take advantage of It is more often used as an informal abbreviation for
human color-response characteristics, and can be the CIE 1976 (L*, a*, b*) color space , whose
derived from the corresponding RGB space as coordinates are actually (L*, a*, and b*). The color
follows. spaces are related in purpose, but differ in
implementation. Perceptually uniform means that a
The L*a*b* color space includes all perceivable
colors which means that its gamut exceeds those of
the RGB and CMYK color models. One of the most
important attributes of the L*a*b*-model is the
device independency. This means that the colors are
3.2. RGB to XYZ conversion
defined independent of their nature of creation.
The XYZ color space was derived from a
series of experiments in the study of the human
perception by the International Commission on
Illumination.The transformation from the RGB
color space to the XYZ color space is as follow
3.3. RGB to HSI conversion 4. Quality Measures
HSI means Hue ,Saturation ad Intensity for Conversion of an image in each color space
human perception. It represents color s similarly the quality may be differing from one color space to
how the human eye senses colors.The conversion other depending on the color space. In the case of
starts form RGB to HIS as follows. First, we conversion image, it is important to reproduce the
1533 | P a g e
3. M.Sangeetha / International Journal of Engineering Research and Applications
(IJERA) ISSN: 2248-9622 www.ijera.com
Vol. 3, Issue 1, January -February 2013, pp.1532-1536
image close to the original image so that even the
smallest details are readable. Conventional measures
are designed to quantify the error, sensitivity 4.3 Average Difference
between the original image and the converted one, A lower value of Average Difference (AD)
while keeping most of the signal characteristics gives a “cleaner” image as more noise is reduced
intact. Imaging systems may introduce some and it is computed Using Table(1)
amounts of distortion or artifacts in the signal, so the
quality measures are an important problem. There 4.4 Maximum Difference
are several techniques and metrics that can be Maximum difference (MD) is calculated
measured objectively and automatically evaluated using Table(1) and it has a good correlation with
by a computer program. Therefore, they can be MOS for all tested conversion images so this is
classified as full-reference (FR) methods and no- preferred as a very simple measure as a reference for
reference (NR) methods. In FR image quality measuring conversion image quality in different
assessment methods, the quality of a test image is color spaces. Large value of MD means that the
evaluated by comparing it with a reference image image is of poor quality.
that is assumed to have perfect quality. NR metrics
try to assess the quality of an image without any 4.5 Normalized Correlation
reference to the original one. In this paper we are The closeness between two digital images
using FR methods to measure the quality from can also be quantified in terms of correlation
original RGB color space Image to Converts Other function. These measures measure the similarity
color spaces images. between two images like a original color space in
the image other one converted color space image,
4.1 Mean Square Error hence in this sense they are complementary to the
In the image processing the most difference based measures. All the correlation based
frequently used measures are deviations between the measures tend to 1, as the difference between two
original and reconstructed images of which the images tend to zero. As difference measure and
mean square error (MSE) or signal to noise ratio correlation measures complement each other,
(SNR) being the most common measures. The minimizing Distance measures are maximizing
reasons for these metrics widespread popularity are correlation measure and Normalised Correlation is
their mathematical tractability and the fact that it is given Table(1).
often straightforward to design systems that
minimize the MSE but cannot capture the artifacts 4.6 Normalized Absolute Error
like blur or blocking artifacts. The effectiveness of Normalized absolute error computed by
the coder is optimized by having the minimum MSE table(1) is a measure of how far is the conversion
at a particular conversion. Calculated MSE in color image from the original image with the value of zero
space image into original image to use the Table(1). being the perfect fit . Large value of NAE indicates
poor quality of the image.
4.2 Peak signal-to-Noise Ratio
Larger SNR and PSNR indicate a smaller 4.7 Structural Content
difference between the original (without noise) and Correlation, a familiar concept in image
reconstructed image. The main advantage of this processing, estimates the similarity of the structure
measure is ease of computation but it does not of two signals. This measure effectively compares
reflect perceptual quality. An important property of the total weight of an original signal to that of a
PSNR is that a slight spatial shift of an image can coded or given. It is therefore a global metric;
cause a large numerical distortion but no visual localized distortions are missed .This measure is
distortion and conversely a small average distortion also called as structural content. The Structural
can result in a damaging visual artifact, if all the content is given by Table(1) and if it is spread at 1,
error is concentrated in a small important region. then the converted image is of better quality and
This metric neglects global and composite errors large value of SC means that the image is poor
PSNR is calculated using Table(1). quality .
1534 | P a g e
4. M.Sangeetha / International Journal of Engineering Research and Applications
(IJERA) ISSN: 2248-9622 www.ijera.com
Vol. 3, Issue 1, January -February 2013, pp.1532-1536
5. Methodology quality wise image for each color space ,the high
Hundred images, twenty images each in quality of the image should be identified. That
RGB to YIQ color space, RGB to YCbCr color image color space better for other color spaces. In
space , RGB to HSI color space , RGB to L*a*b this proposed techniques we are conversion from
color space and RGB to XYZ color space, of size five color spaces each color space calculated
converted each image equal size for the analysis. quality measure.
The conversion ratio and other quality measures
are computed using the original and coded images. 6. Result and Discussion
In an our analysis original image is RGB color 6.1 Experimental Results:
space image and converted other color space In this section, we show the result for
image. If the quality of the image should be RGB color space into different color spaces
calculated above quality measure for each color applying for original image.
space along with the image. So we obtain the
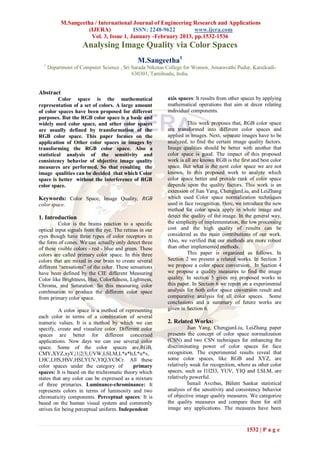
Figure 1: Original RGB color space Image
RGB to HSI RGB to L*a*b RGB to YIQ RGB to YCbCr RGB to XYZ
Figure 2: Conversion of other color space Images
1535 | P a g e
5. M.Sangeetha / International Journal of Engineering Research and Applications
(IJERA) ISSN: 2248-9622 www.ijera.com
Vol. 3, Issue 1, January -February 2013, pp.1532-1536
6.2.Comparative Analysis Result: Enhancing the discriminating power of
Table 2.gives computed values of the Conversion color spaces for face recognition”.
different color space values and other objective [4] I. Avcibas, B. Sankur, K. Sayood,
quality measures obtained. “Statistical Evaluation of Quality
Conversion from RGB color space into Measures In Image Compression”, J. of
Electronic Imaging, (in review).
7. Discussions and Conclusions: [5] Adrian Ford and Alan Roberts August 11,
The conversion ratio for RGB to YIQ 1998(b),” Colour Space Conversions”.
color space, RGB to YCbCr color space, RGB to [6] Bauer S., Zovko-Cihlar B. and Grgic M.
HSI color space, RGB to L*a*b color space and (1996a) „Objective and Subjective
RGB to XYZ color space obtained MSE and PSNR Evaluations of Picture Quality in Digital
image quality factor is better in RGB to L*a*b Video Systems‟,Multimedia Technology
color space the result is 7308.84 for MSE and 9.49 and Digital Communication Services,
PSNR with low value indicates a good quality lCOMT 1996, pp. 145-150.
image and that is observed with the value. Average [7] Hamid Rahim Sheikh, Muhammad Farooq
difference of the each color space is varying from Sabir and Alan C. Bovik (2006) „A
one to other color spaces. The RGB to L*a*b color statistical evaluation of recent full
space obtained value is very low for 5.02 so the reference image quality
result gives a “cleaner” image as more noise is assessmentalgorithms‟, IEEE Trans Image
reduced and better quality of the image. Processing, Vol. 15, No. 11, pp. 3440-
The Structural content result smaller value 3451.
of SC means that the image is good quality . In an [8] Richard Dosselmann and Xue Dong Yang
our result obtained SC value is 1.00 in RGB to (2005) „Existing and emerging image
L*a*b color space is smaller value. So in SC quality metrics‟, CCECE/CCGEI, pp.
depends upon the Image quality better color space 1906-1913.
is RGB to L*a*b.Large value of Normalized [9] Sonja Grgic, Mislav Grgic and Branka
Absolute Error indicates poor quality of the image. Zovko-Cihlar (1996) „Objective and
In an our result obtained NAE value is 0.17 in RGB subjective measuruments for video
to L*a*b color space is smaller value so better compression system‟,Proceedings of the
quality. Also in NAE depends upon the Image International Conference of Multimedia
quality better color space is RGB to L*a*b.So our Technologies, ICOMT 1996, pp. 145-150.
main contribution result is overall image applied [10] Tomas Kratochvil and Pavel Simicek
any color spaces is better quality obtained for RGB (2005) „Utilization of MATLAB for
to L*a*b. picture quality evaluation‟, Institute of
From this work, we observed that the Radio Electronics, Brno University of
color space conversion present an perfect image Technology, Czech. Republic.
quality for each color space and basis for future
developments such as: (i) we are implemented only
5 color space from RGB color spaces; but now a
days there are several color spaces used .so convert
all the color space from the RGB color space that is
more effective (ii) we are implemented only some
quality measure to find the quality of the image, so SangeethaMuthaiah received her
implemented different quality factor to be used in B.Sc Degree from Madurai KamarajUniversity,
future enhancement and obtain the better quality Madurai. She also received M.Sc.,and M.Phil.,
result. Degree from Alagapppa University, Karaikudi in
References: 2008, 2010 respectively. She is currently working
[1] Rafael C. Gonzales. Digital Image
as Lecturer, Department of Computer Science, Sri
Processing. Tom Robbins, 2 edition, 2002.
[2] Users Guide Statistics Toolbox 7. Sarada Niketan College for Women, Amaravathi
MathWorks Matlab. MathWorks Matlab, Pudur, Karaikudi-630301, Tamilnadu, India . Her
2010. research interest includes Data mining and Image
[3] Jian Yang , ChengjunLiu , LeiZhang Processing ad hoc wireless Networks &Security
,2009,” Color space normalization: and Computer Algorithms.
1536 | P a g e