Download to read offline

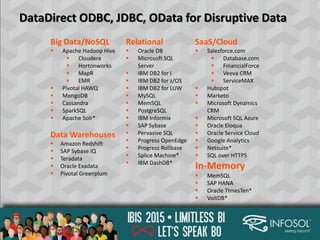
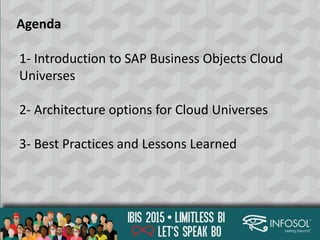


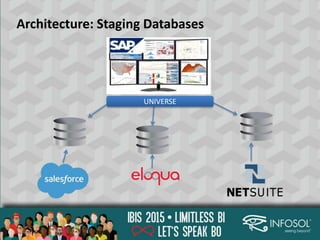


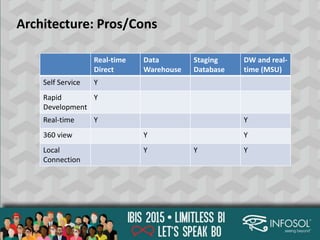

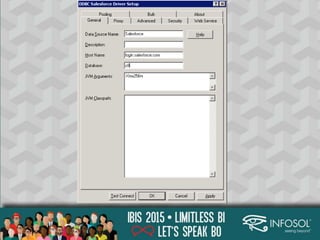
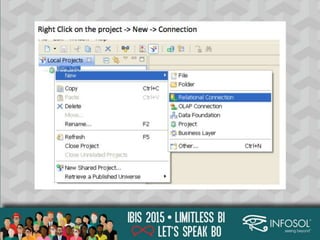
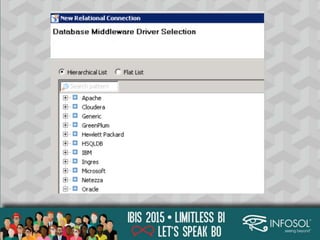

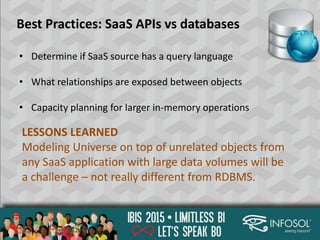

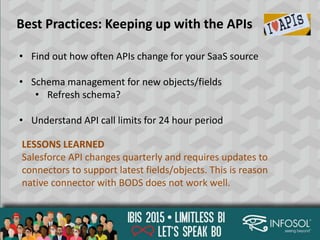
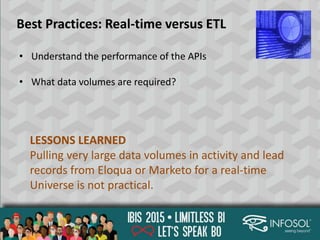

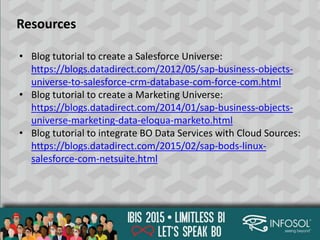


The document discusses the integration of cloud data sources with SAP BusinessObjects, outlining architecture options and best practices for managing cloud universes. It emphasizes understanding cloud universes, real-time data blending, and handling authentication, along with lessons learned from using various SaaS databases. Various resources and examples are provided to assist professionals in the BI community with implementing these integrations.


![Journey to Marketing Data Lake [BRK1098]](https://cdn.slidesharecdn.com/ss_thumbnails/oraclemme-final-170418005539-thumbnail.jpg?width=640&height=640&fit=bounds)


![Data APIs Don't Discriminate [API World Stage Talk]](https://cdn.slidesharecdn.com/ss_thumbnails/apiworldstage2017-170927153840-thumbnail.jpg?width=640&height=640&fit=bounds)


![Lect 1 Number systems and base conversions. [Autosaved].pptx](https://cdn.slidesharecdn.com/ss_thumbnails/lect1numbersystemsandbaseconversions-260111134109-67c2d865-thumbnail.jpg?width=640&height=640&fit=bounds)


