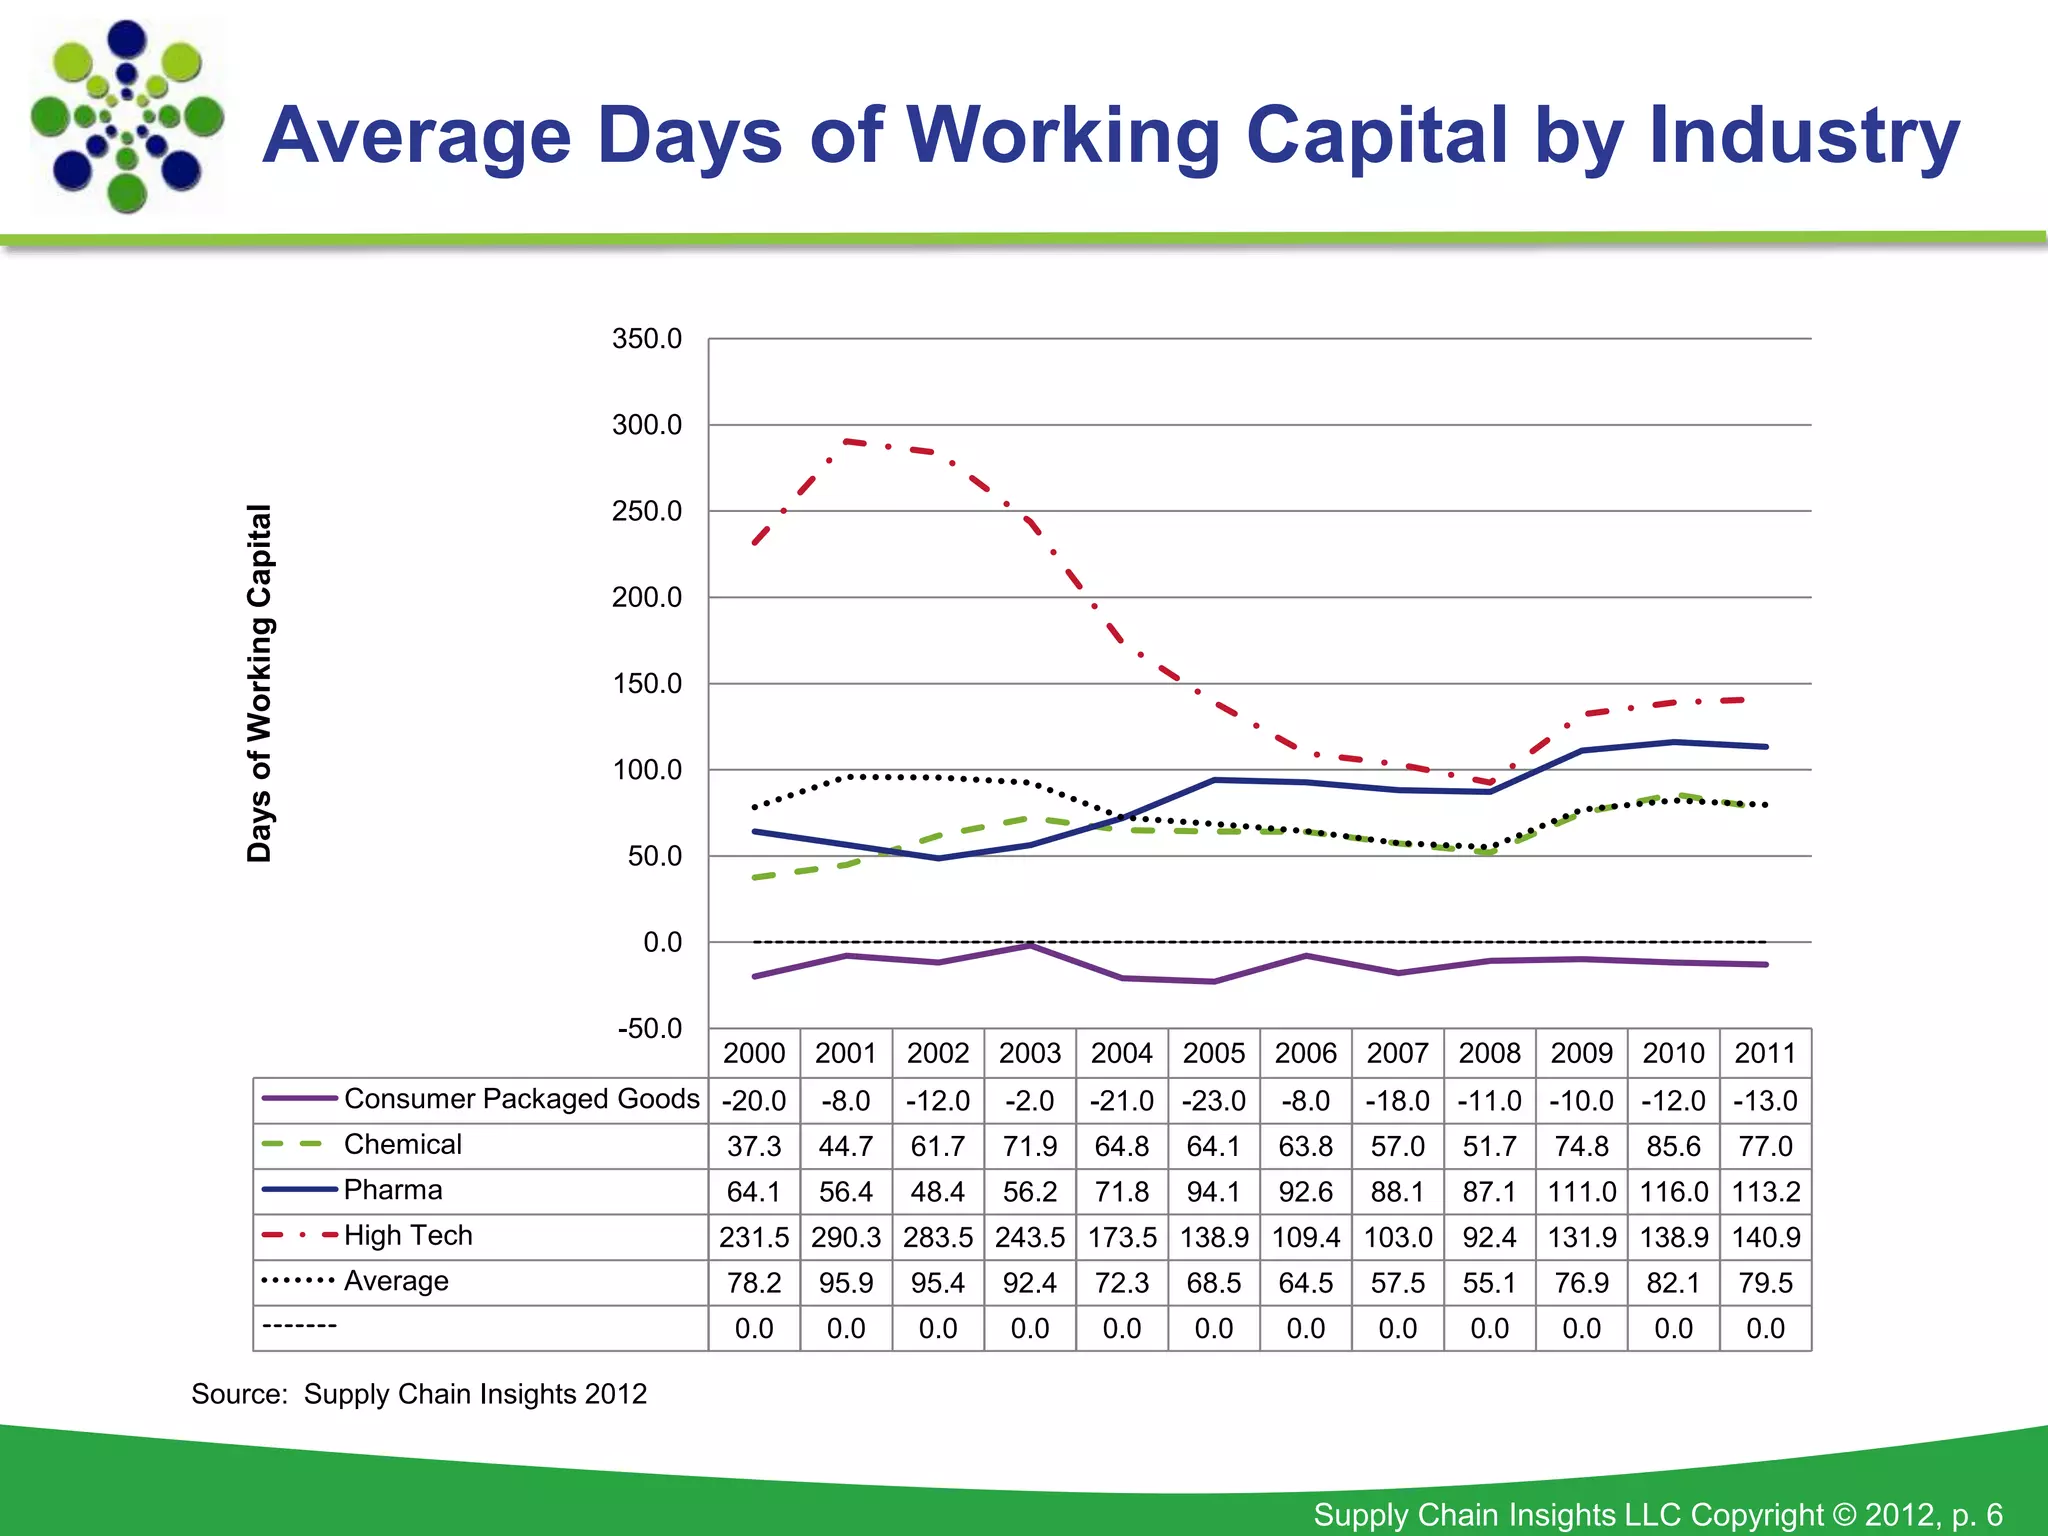
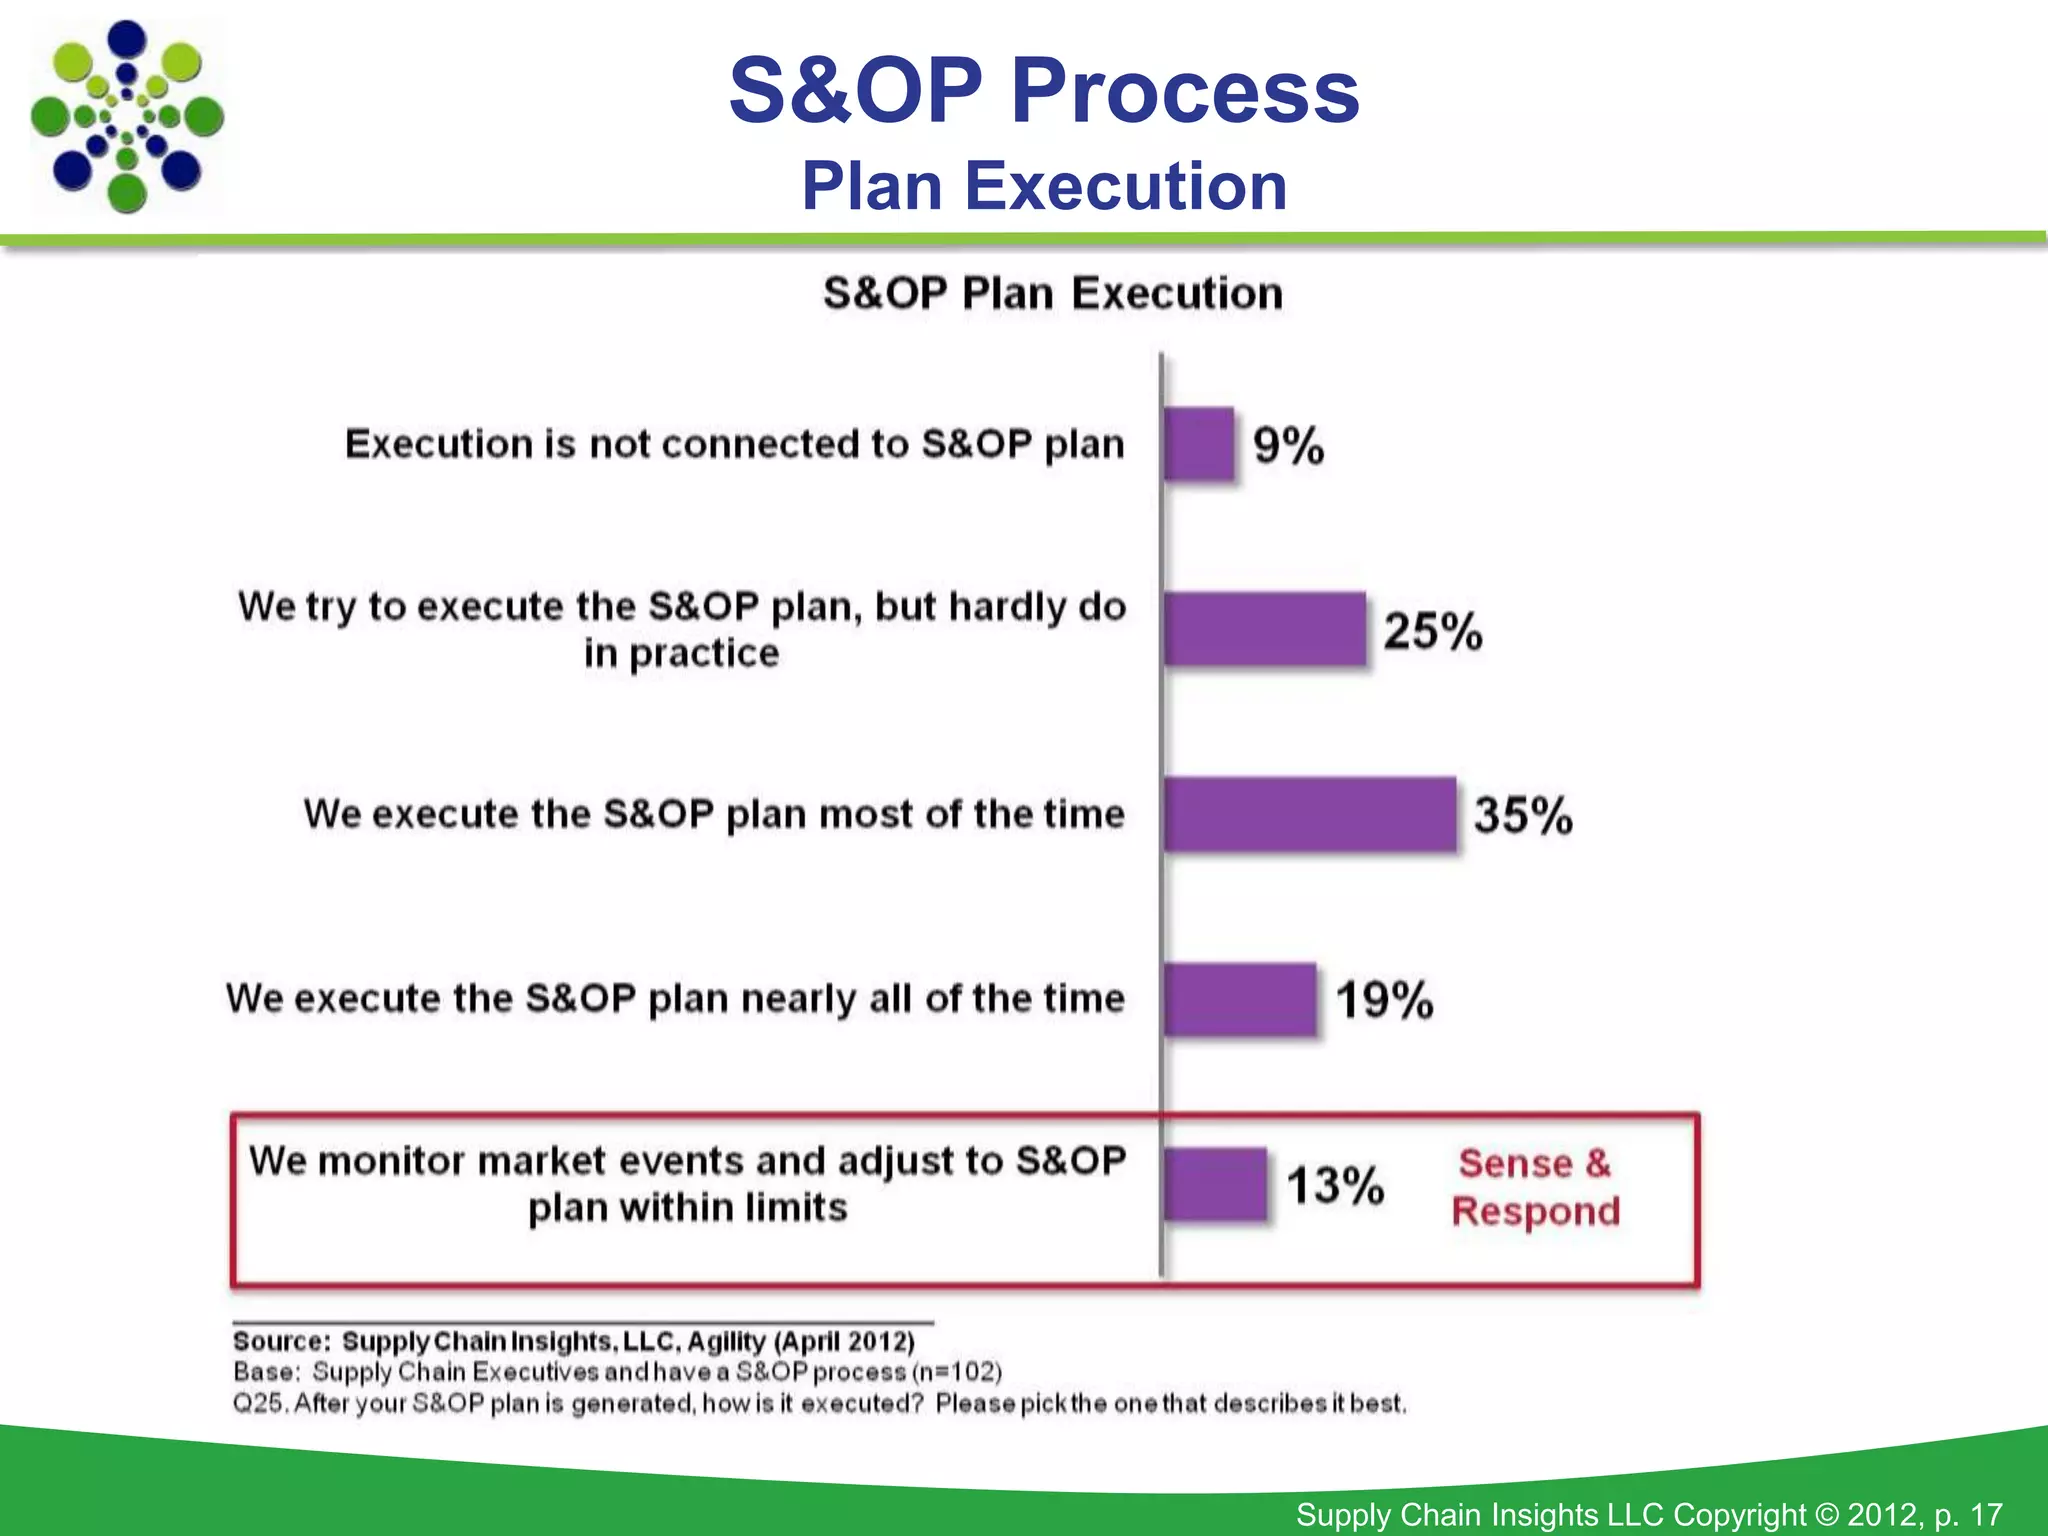
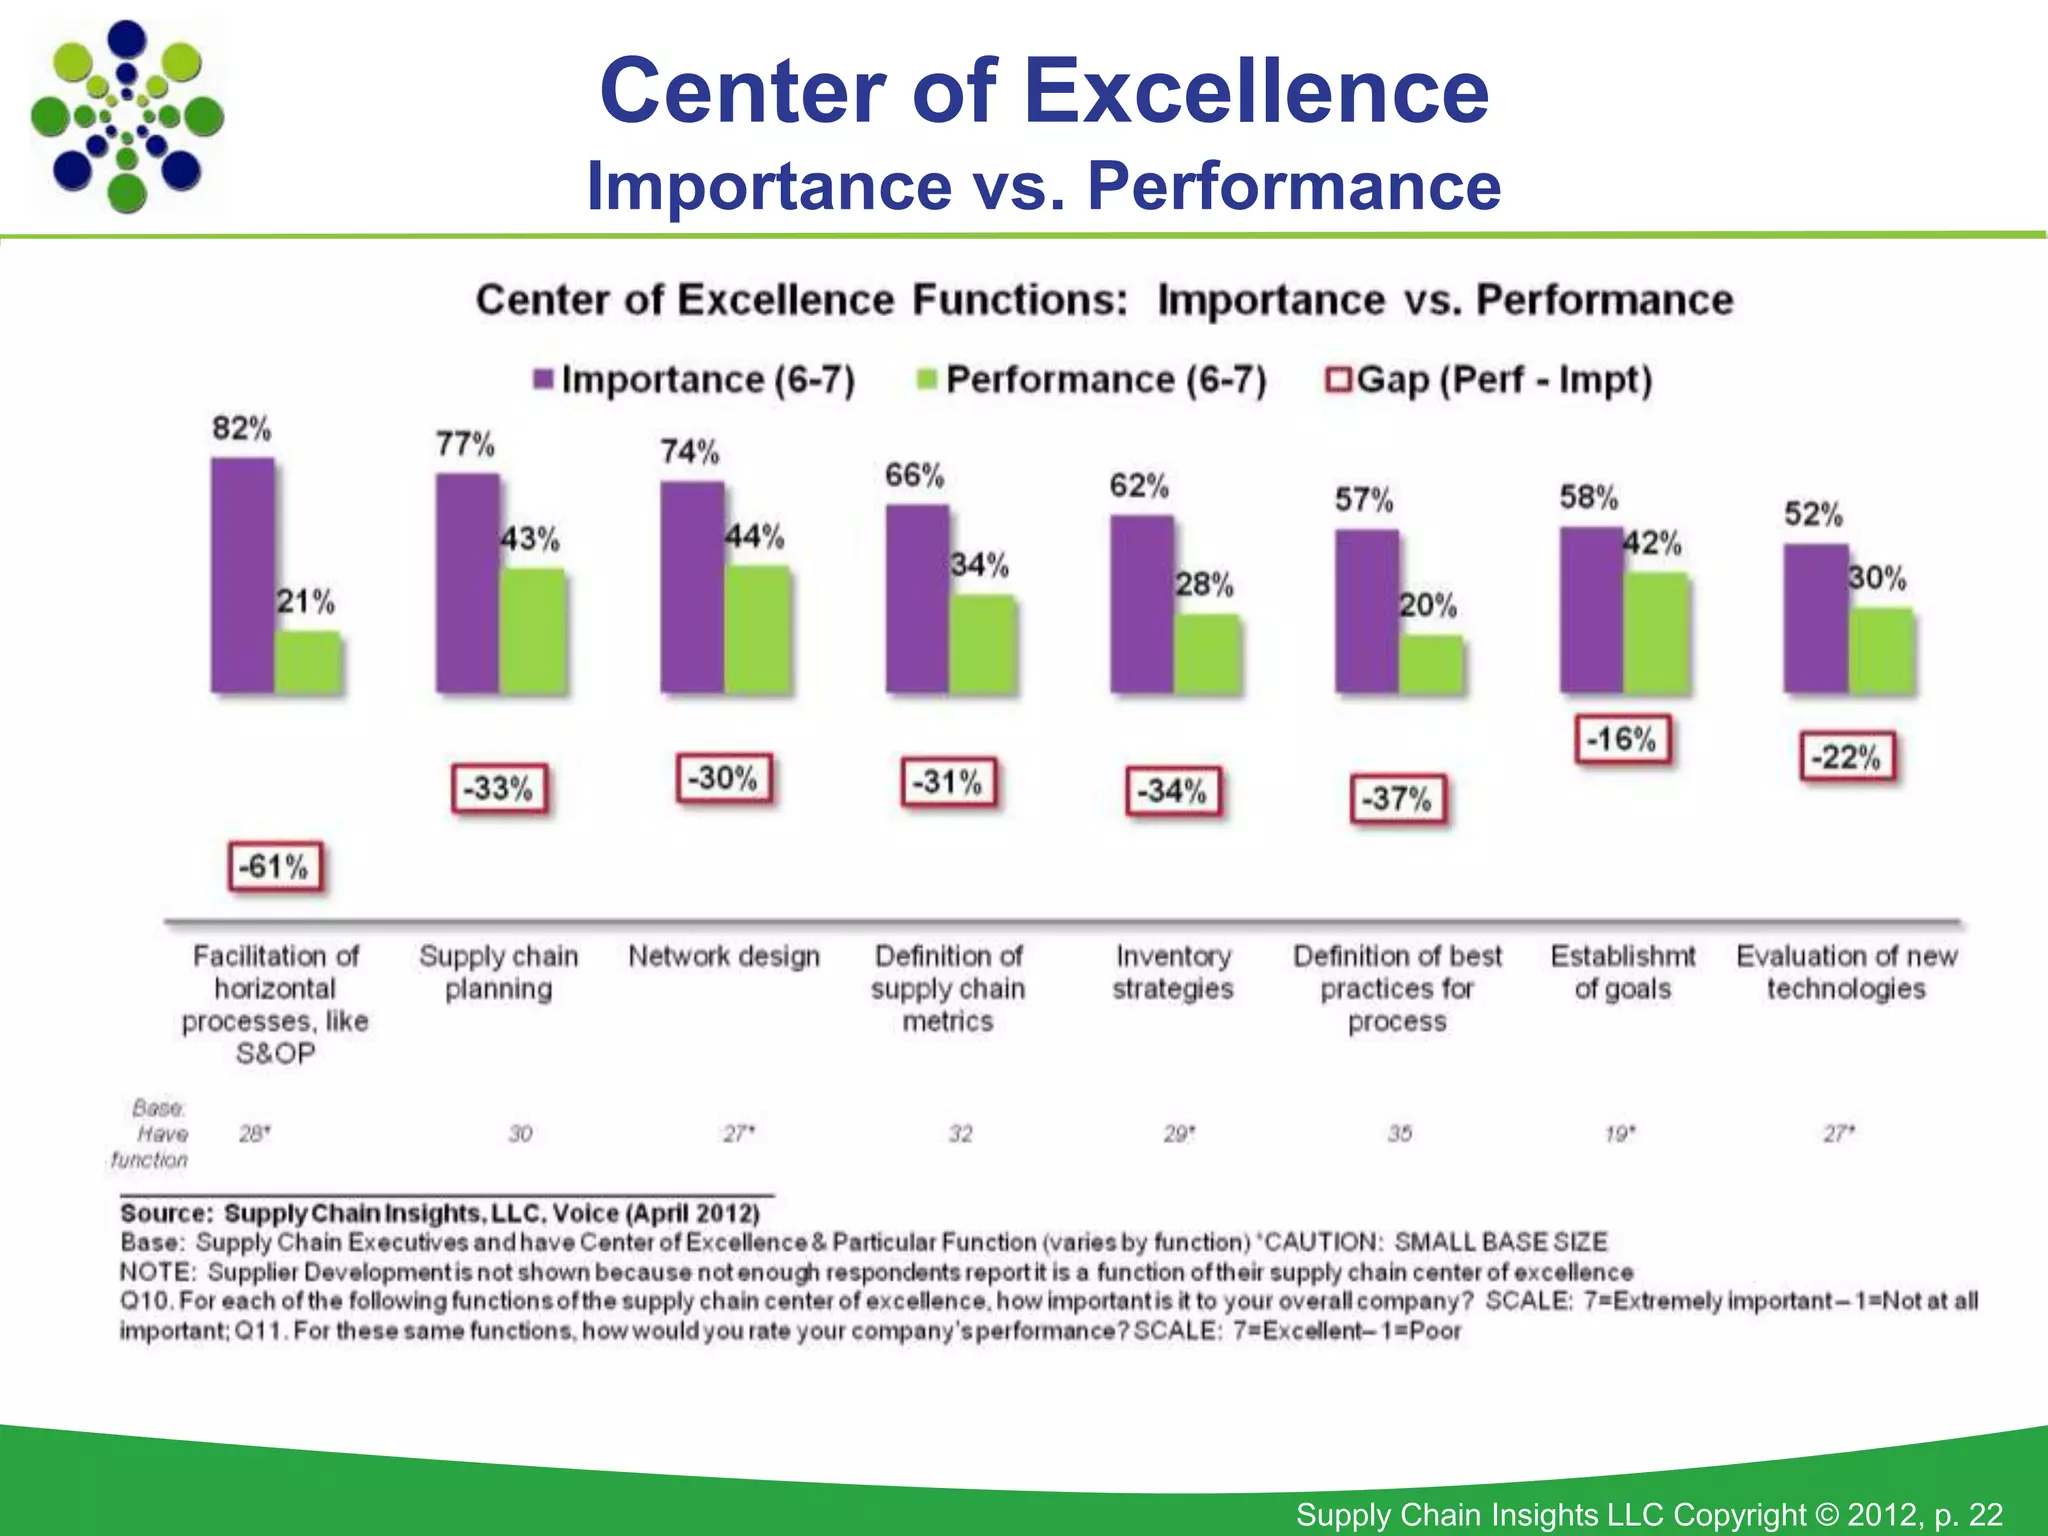
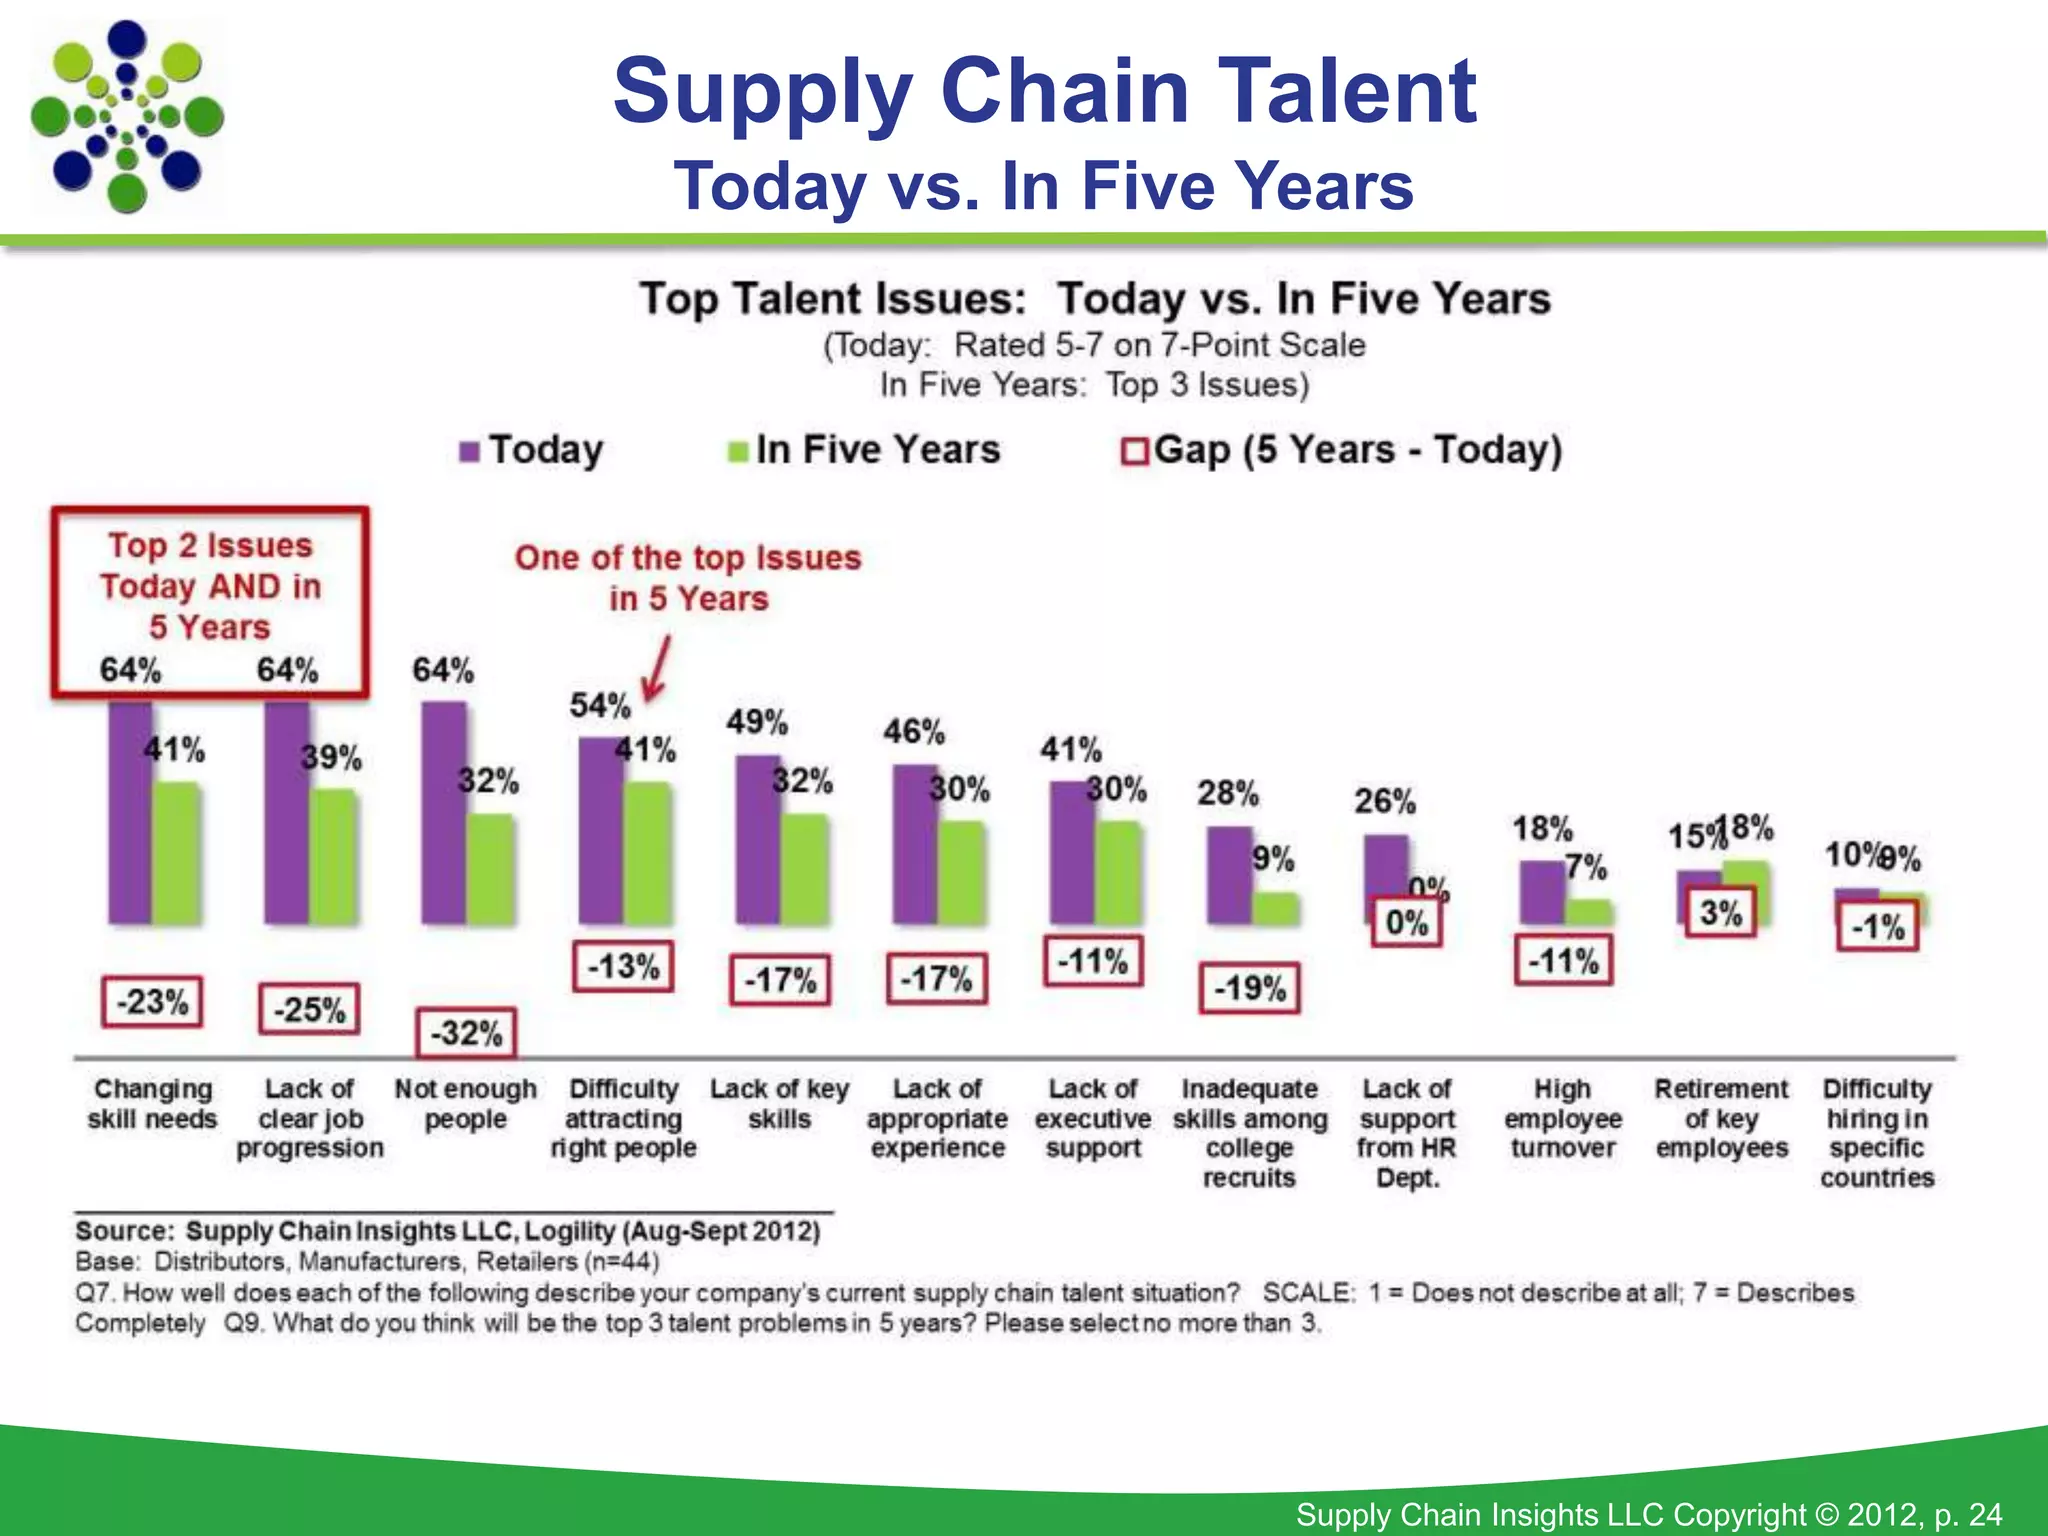
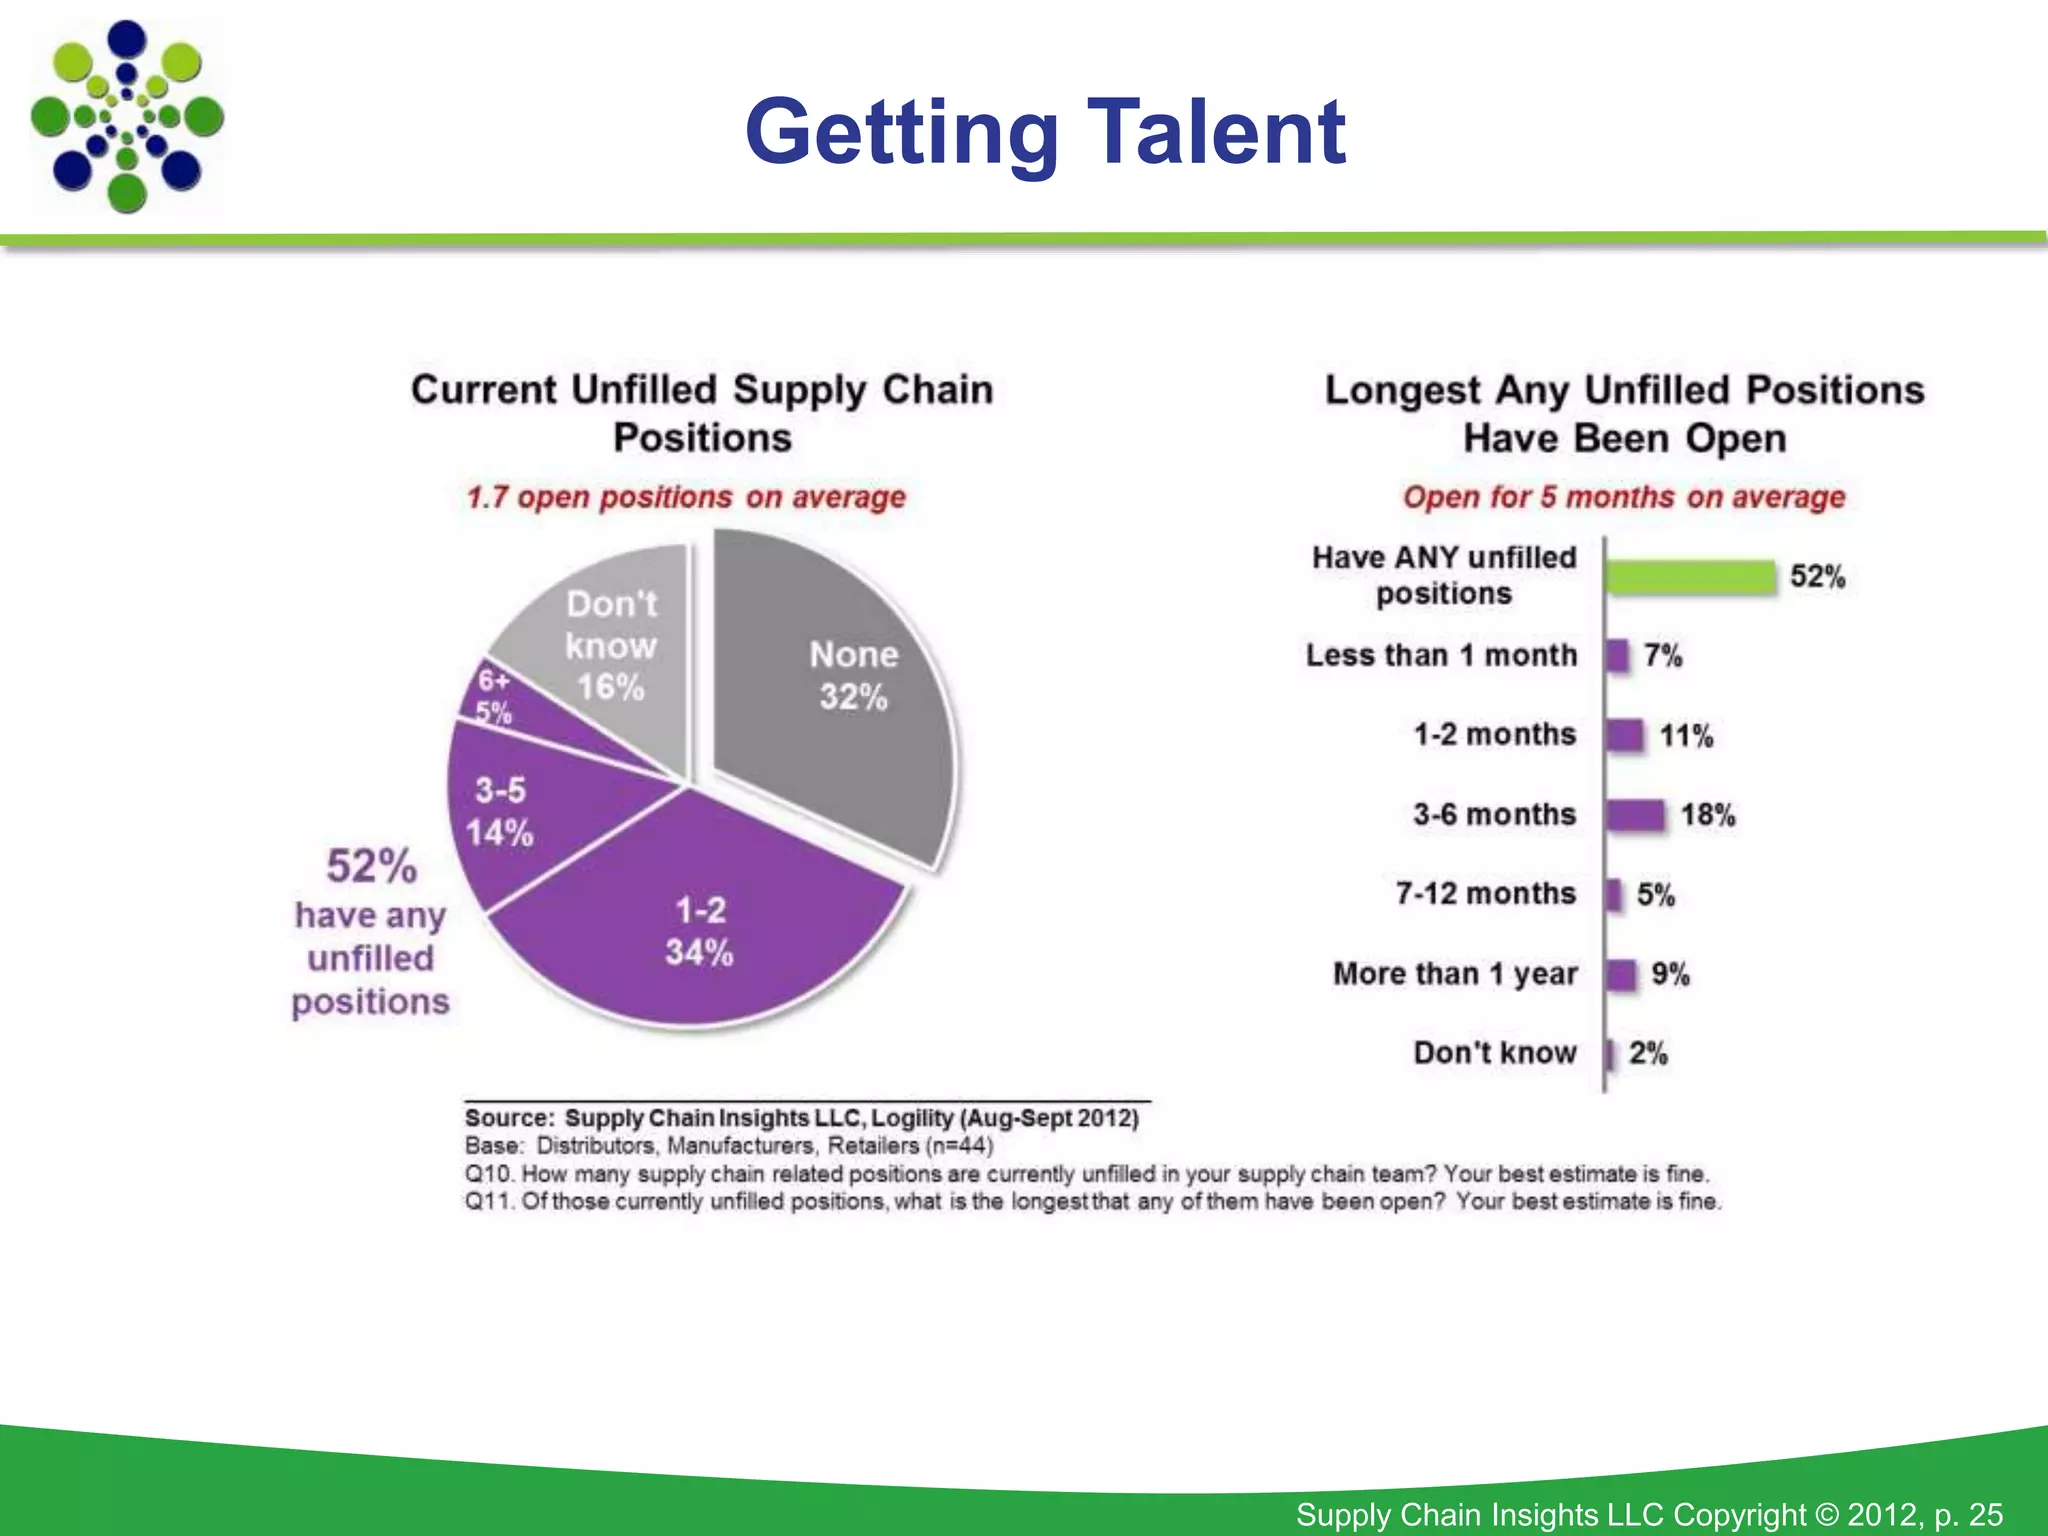
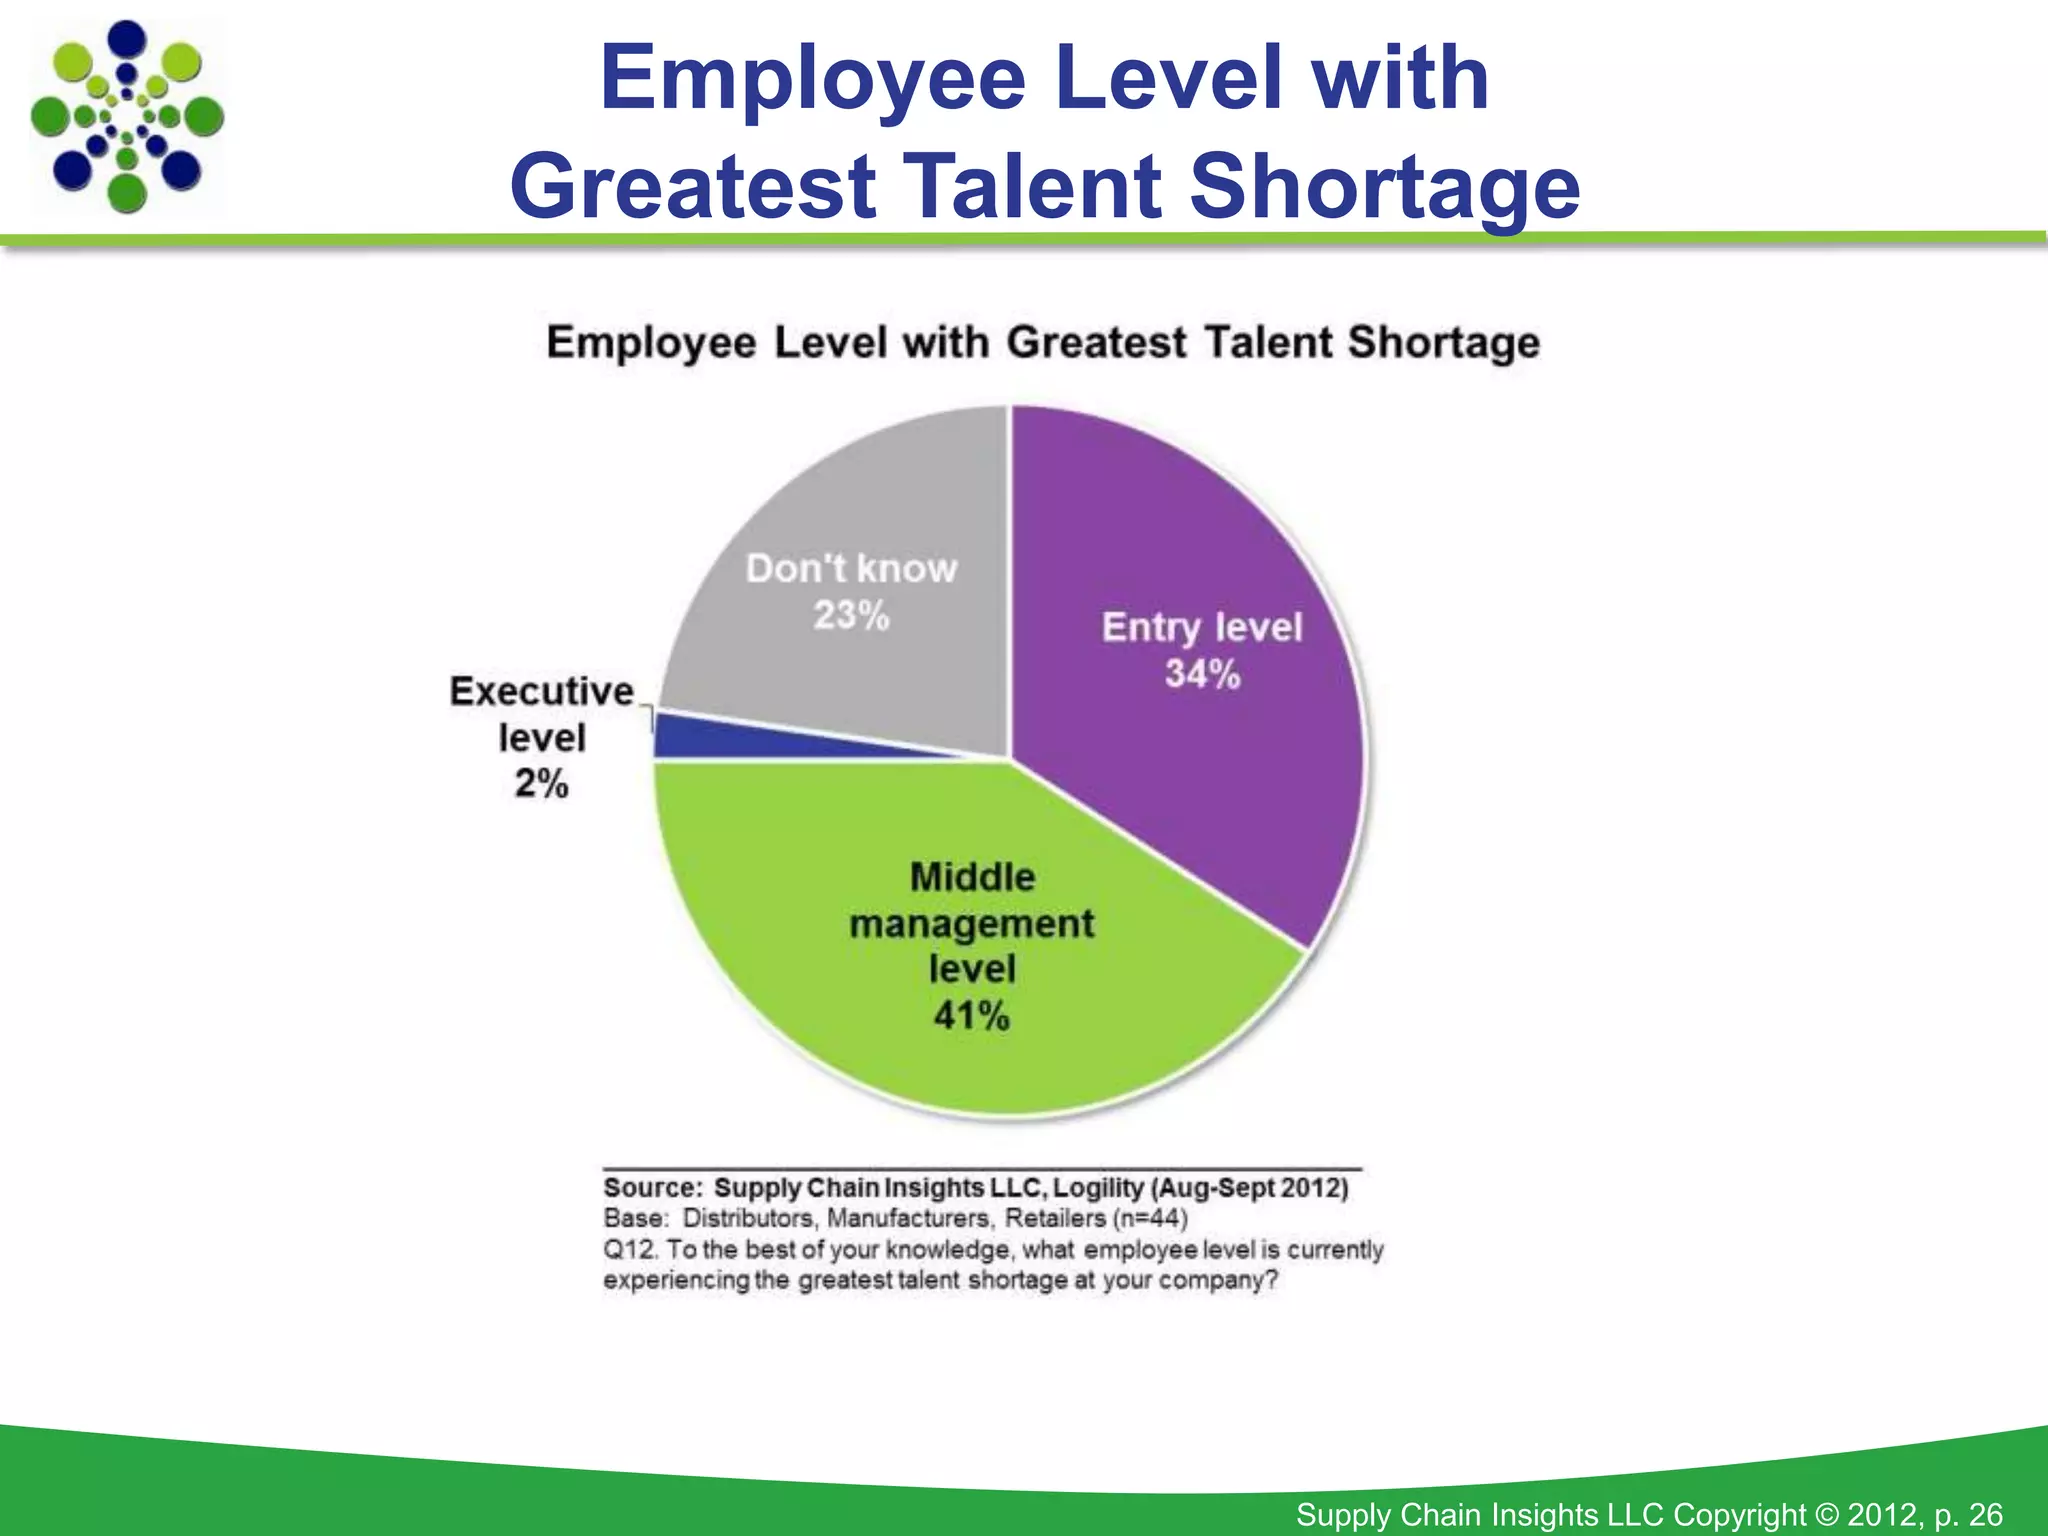
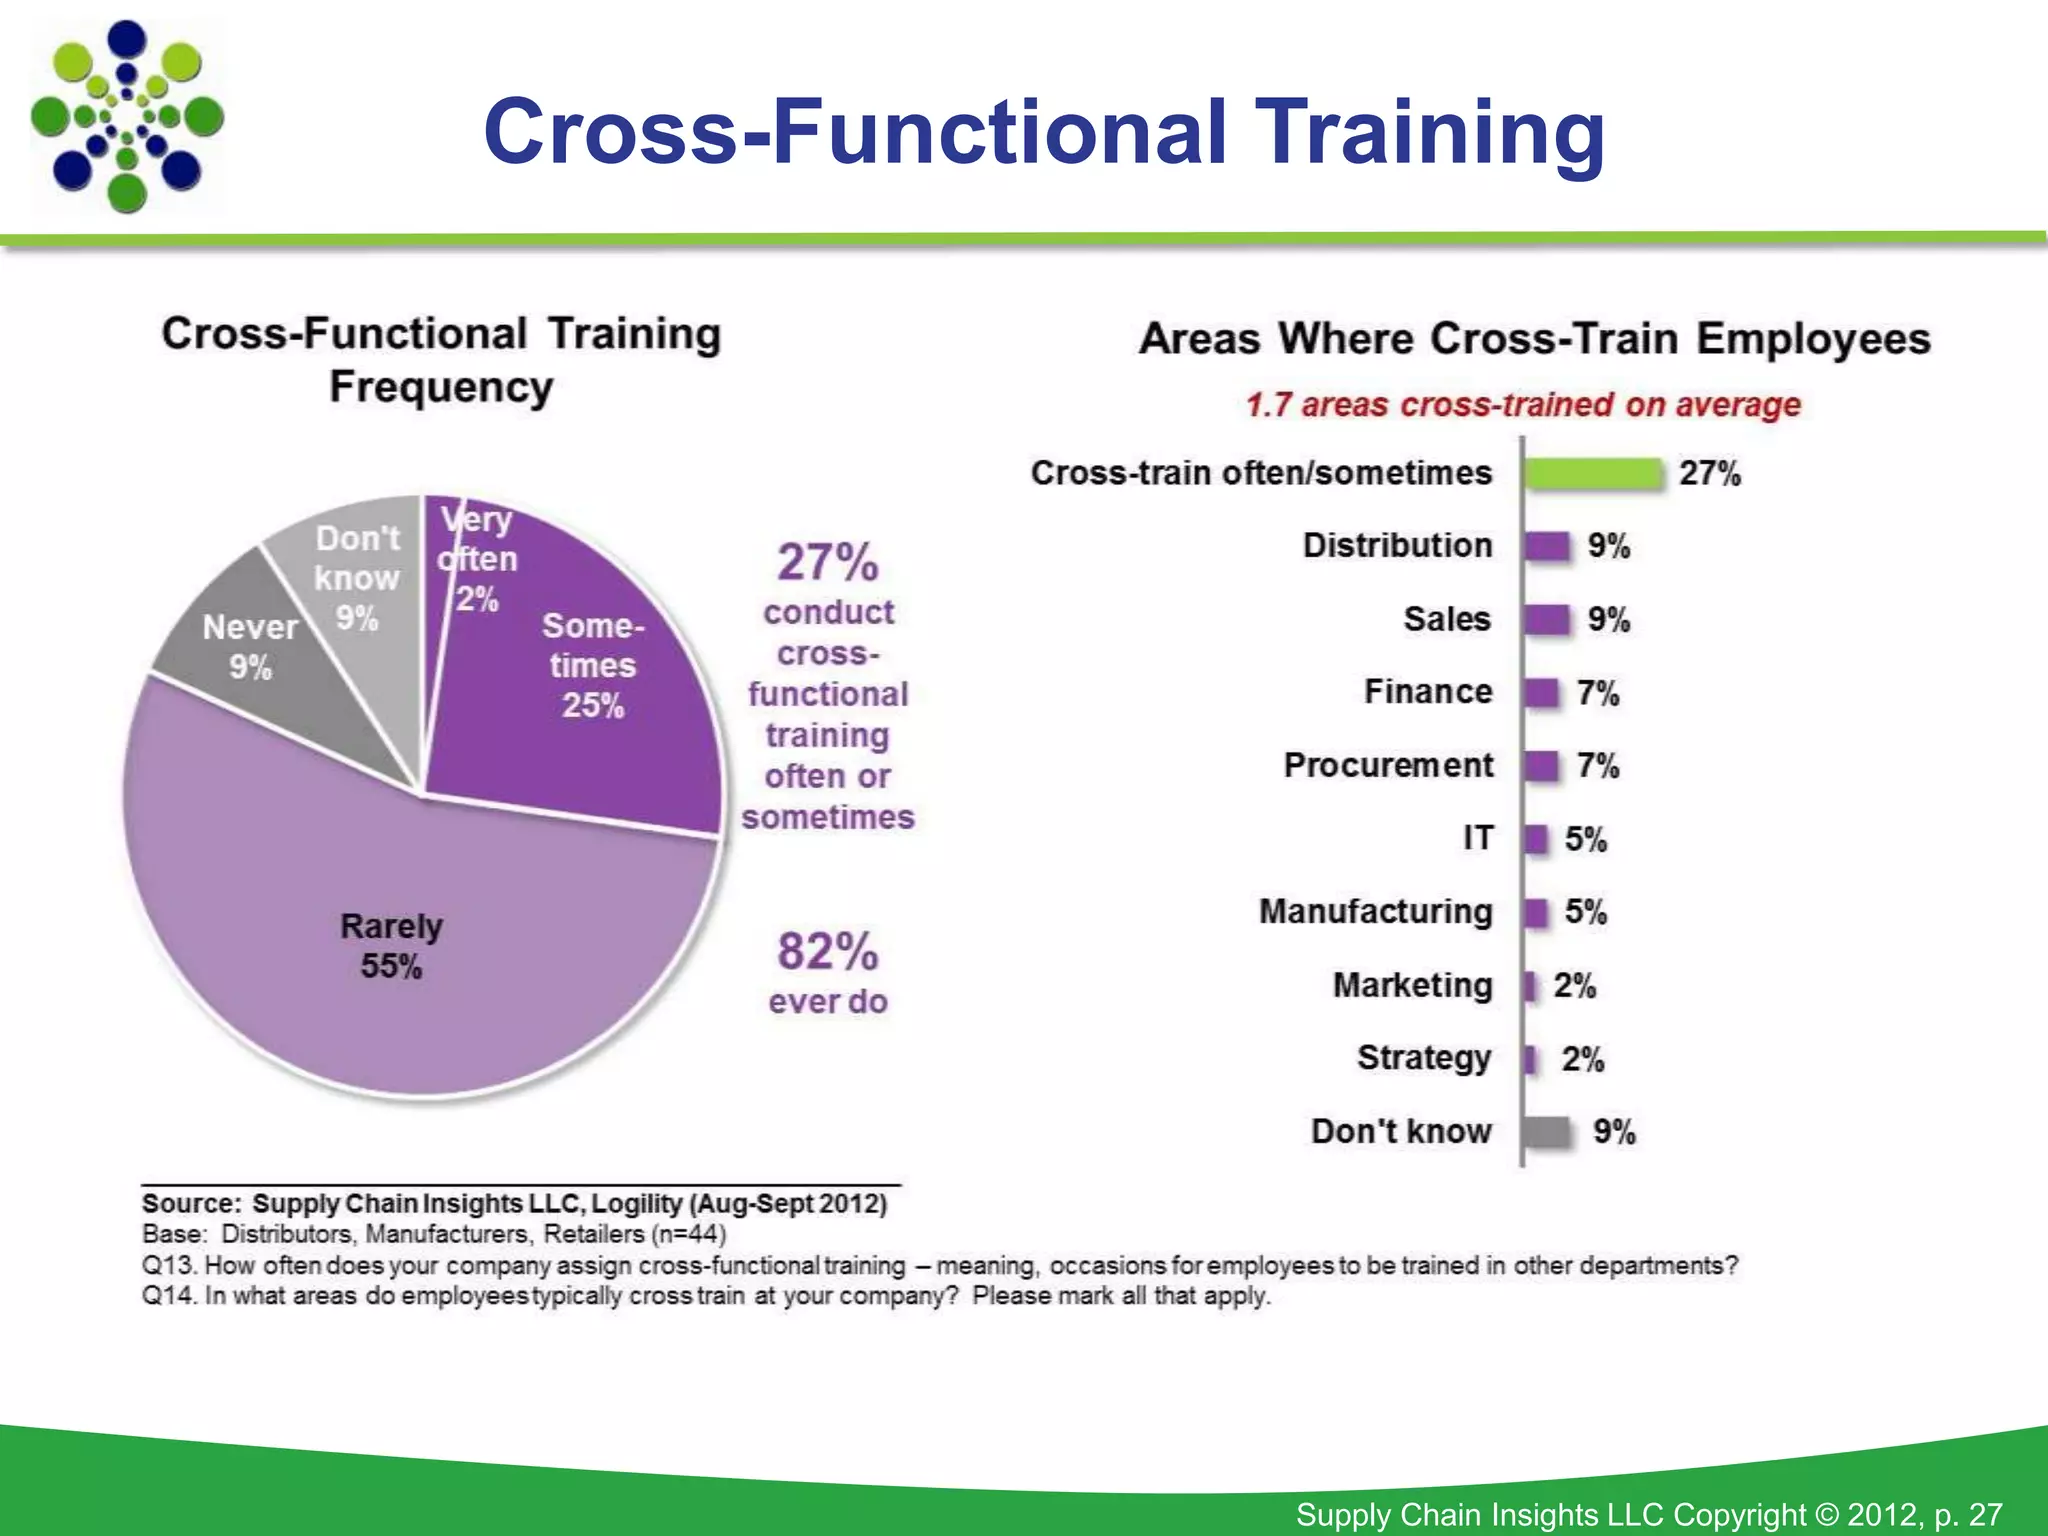
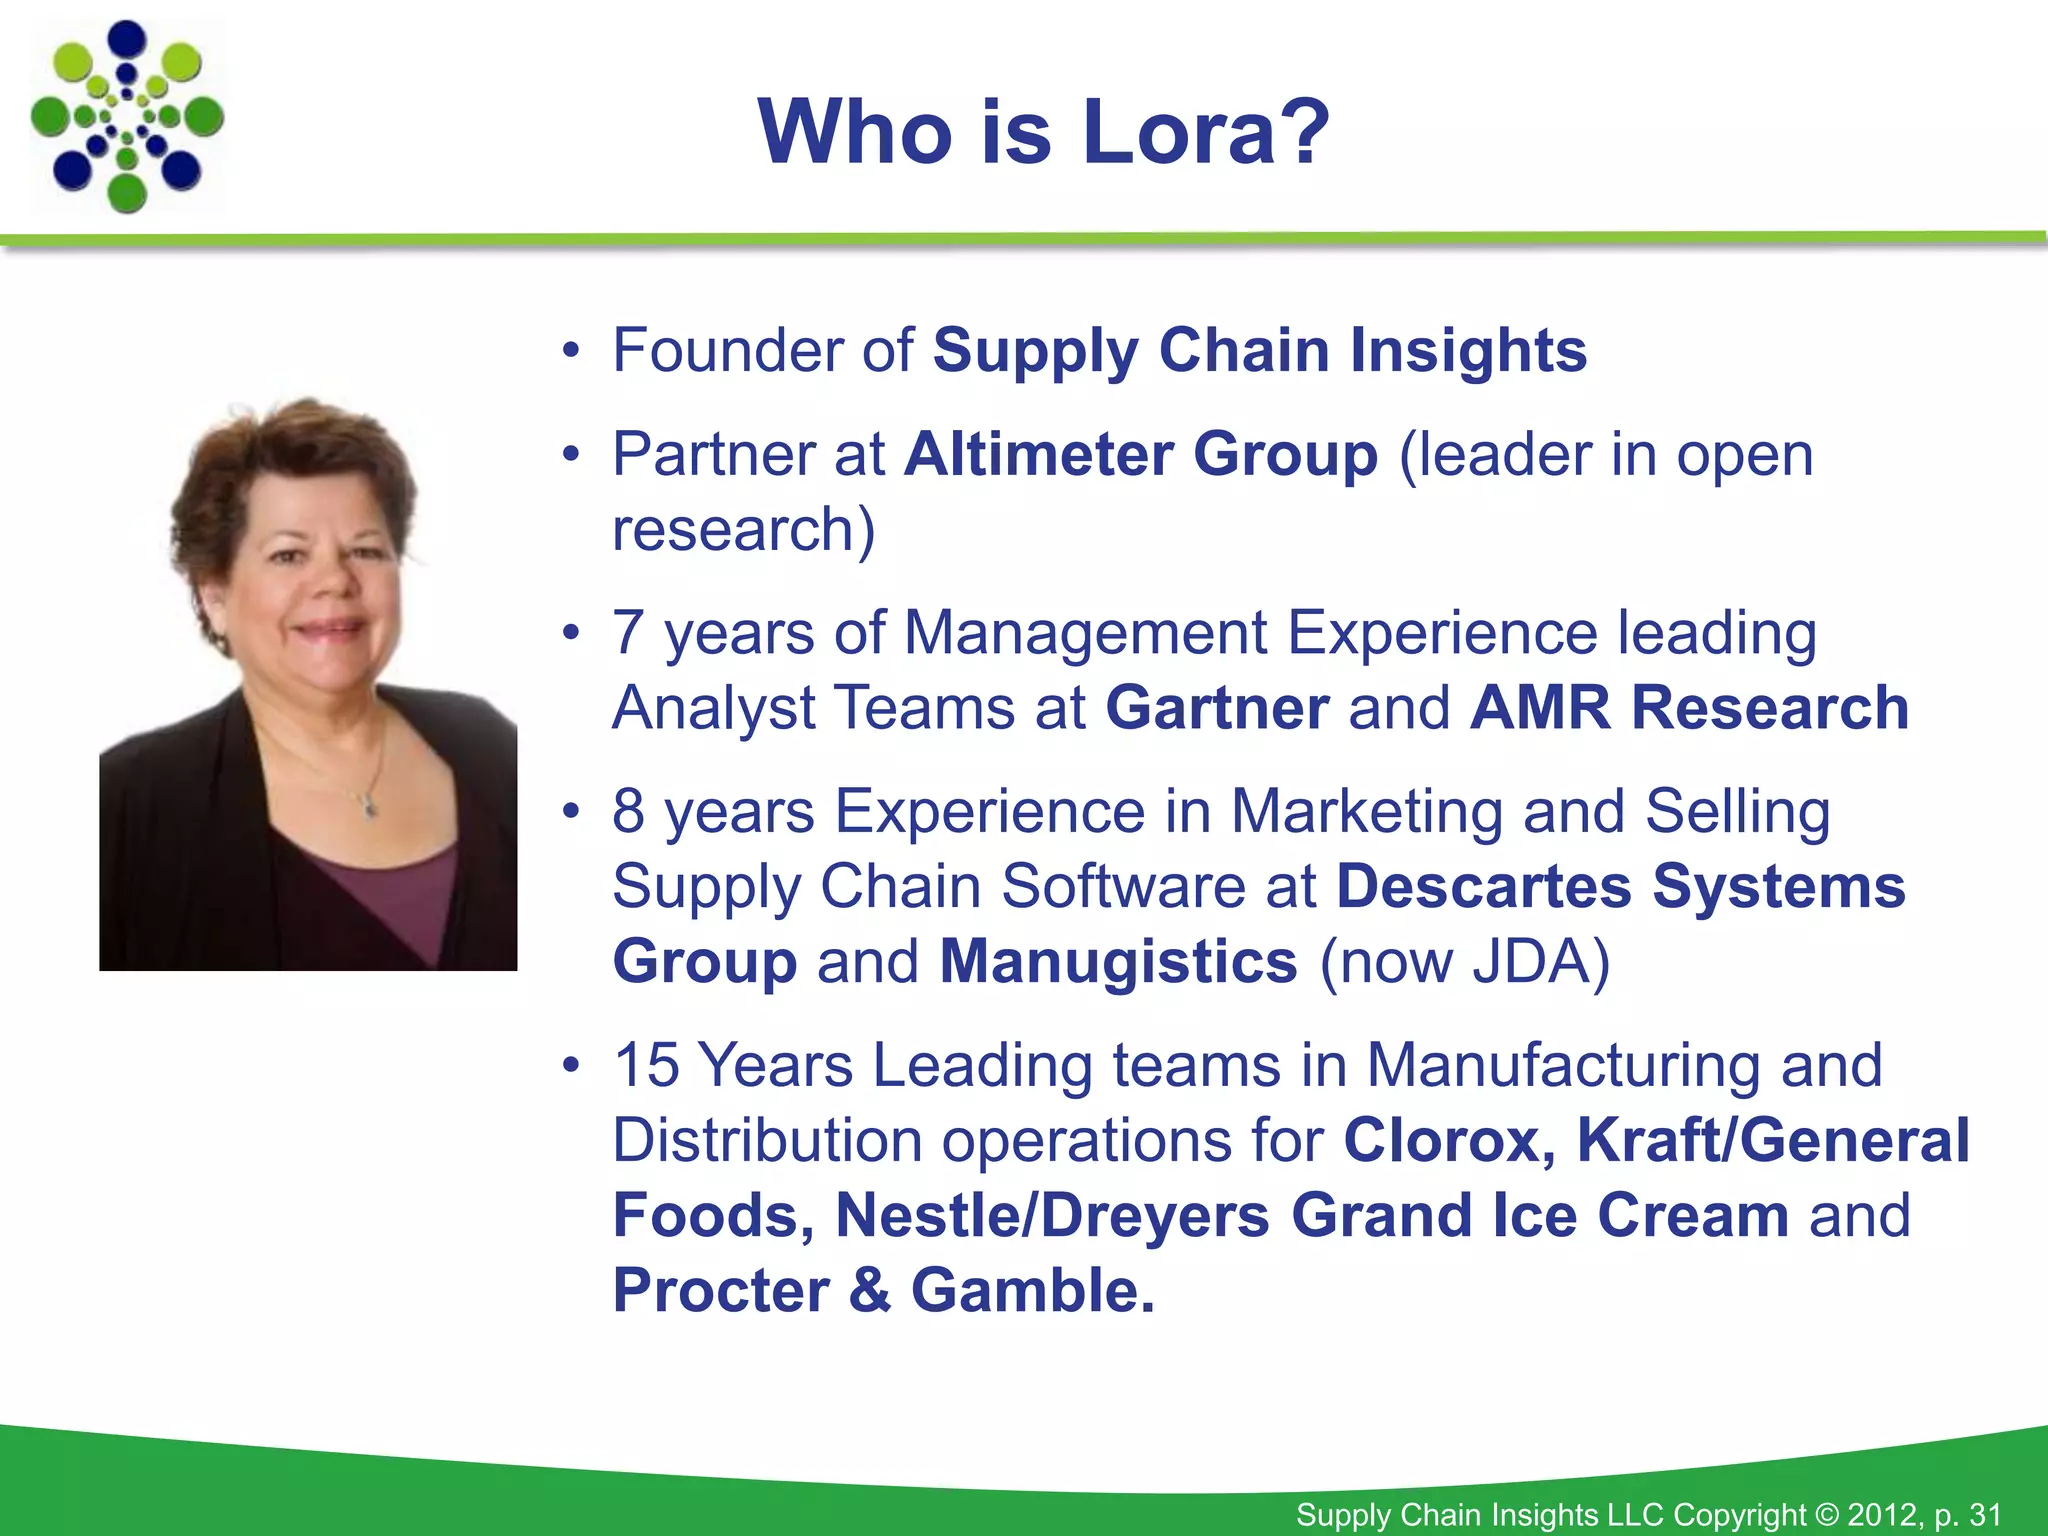
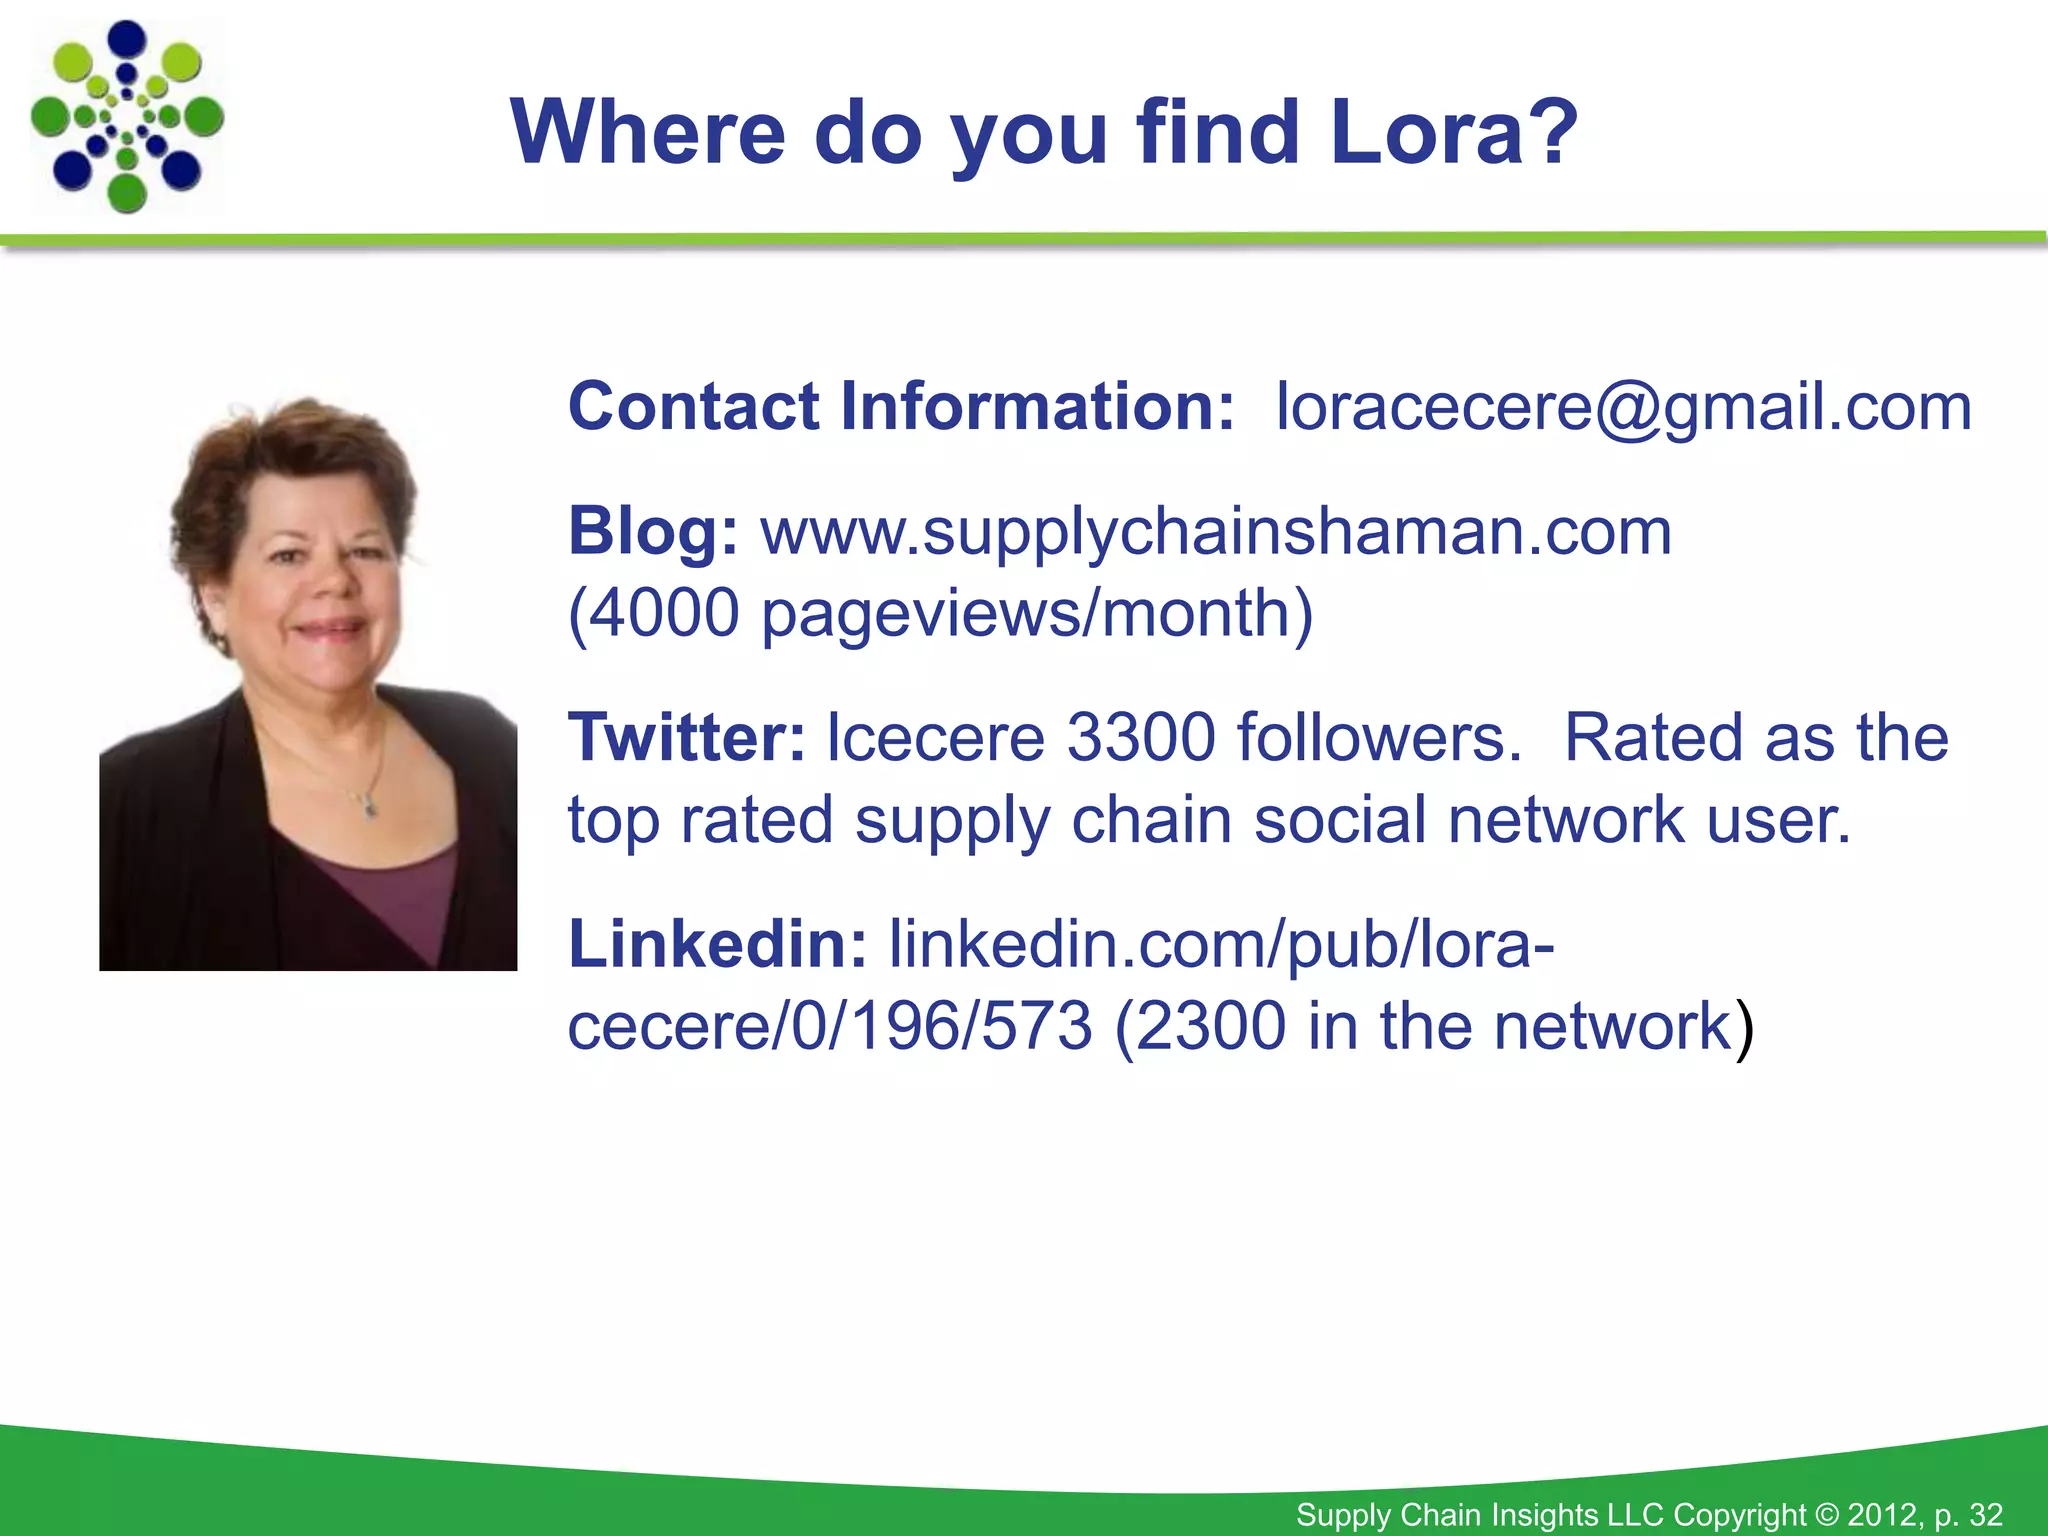
S&OP Panel
            October 2012


Supply
Chain
Insights
Agenda


         Supply Chain Insights LLC Copyright © 2012, p. 2
Supply Chain Management:
Top 3 Elements of Pain for Respondent


                          Supply Chain Insights LLC Copyright © 2012, p. 3
Scenario Planning


              Supply Chain Insights LLC Copyright © 2012, p. 4
Average Days of Inventory by Year

                                     250.0


                                     200.0
Days of Inventory


                                     150.0


                                     100.0


                                      50.0


                                       0.0
                                              2000    2001    2002    2003    2004    2005    2006    2007    2008    2009    2010    2011
                    Consumer Packaged Goods   59.0    57.0    62.0    64.0    67.0    67.0    68.0    70.0    70.0    64.0    64.0    67.0
                    Chemical                  71.5    71.9    78.2    75.1    62.0    70.3    68.1    64.3    64.3    78.6    72.9    72.8
                    Pharma                    122.2   133.7   190.1   171.0   184.3   175.6   167.8   149.8   154.9   198.7   154.3   131.8
                    High Tech                 93.1    57.6    46.5    48.5    35.9    37.3    43.8    36.8    34.6    41.3    34.8    30.4
                    Average                   86.5    80.0    94.2    89.6    87.3    87.5    86.9    80.2    81.0    95.6    81.5    75.5


Source: Supply Chain Insights 2012


                                                                                                Supply Chain Insights LLC Copyright © 2012, p. 5
Average Days of Working Capital by Industry

                                               350.0


                                               300.0


                                               250.0
    Days of Working Capital


                                               200.0


                                               150.0


                                               100.0


                                                50.0


                                                 0.0


                                               -50.0
                                                       2000   2001   2002    2003   2004   2005   2006   2007   2008   2009   2010   2011
                              Consumer Packaged Goods -20.0   -8.0   -12.0   -2.0   -21.0 -23.0   -8.0   -18.0 -11.0 -10.0 -12.0 -13.0
                              Chemical                 37.3   44.7   61.7    71.9   64.8   64.1   63.8   57.0   51.7   74.8   85.6   77.0
                              Pharma                   64.1   56.4   48.4    56.2   71.8   94.1   92.6   88.1   87.1   111.0 116.0 113.2
                              High Tech                231.5 290.3 283.5 243.5 173.5 138.9 109.4 103.0          92.4   131.9 138.9 140.9
                              Average                  78.2   95.9   95.4    92.4   72.3   68.5   64.5   57.5   55.1   76.9   82.1   79.5
                                                        0.0   0.0    0.0     0.0    0.0    0.0    0.0    0.0    0.0     0.0   0.0    0.0

Source: Supply Chain Insights 2012


                                                                                                    Supply Chain Insights LLC Copyright © 2012, p. 6
S&OP Process
Existence, Goals & Processes


                     Supply Chain Insights LLC Copyright © 2012, p. 7
Multiple S&OP Processes


                Regional
                 S&OP
               Processes


             Executive
              S&OP
                           Supply Chain
   S&OP
                             Planning
 Processes
                            Processes
  With Key
                             with Key
 Customers
                            Suppliers
The Need for Balance


               Supply Chain Insights LLC Copyright © 2012, p. 9
S&OP Balance


          Supply Chain Insights LLC Copyright © 2012, p. 10
What is Agility?


             Supply Chain Insights LLC Copyright © 2012, p. 11
Agility Importance vs. Performance


                      Supply Chain Insights LLC Copyright © 2012, p. 12
What-if Analysis


             Supply Chain Insights LLC Copyright © 2012, p. 13
S&OP Evolution
                                                                     Greater Benefit
                           Business-                                 • Growth
Sales Driven
                        planning Driven                              • Resilience
Match Demand
                            Maximize                                 • Efficiency
 with Supply
                           Profitability


                                                                       Market Driven
  Manufacturing-                           Demand Driven
       Driven                                                            Maximize
                                              Maximize
                                                                      Opportunity and
 Deliver a Feasible                          Opportunity
                                                                       Mitigate Risk.
 Plan for Operations                         Sense and
                                                                        Orchestrate
   Match Demand                                Shape
                                                                         Demand
     with Supply                              Demand
                                                                      Market to Market
                                                  Supply Chain Insights LLC Copyright © 2012, p. 14
Benefits Received from S&OP Processes

                              Increasing revenue              ▲ 2%                          59%

                 Improving forecast accuracy                  ▲ 5-7%                    57%

                         Reduction of inventory               ▼ 10-15%                50%

                   Improving asset utilization                ▲ 3-7%            42%

 Determining outsourced manufacturing                                          38%

 Determining procurement requirements                                      36%

              Improving new product launch                    ▲ 3-6%      34%
              Transportation and warehouse
                      management                              ▼ 2-8%     32%

Capital planning and asset management                                    32%

         Improvements in the perfect order                   ▲ 3-6%      30%

Source: Supply Chain Insights, 2012
What benefits have you received from your work with S&OP processes?
Agenda


         Supply Chain Insights LLC Copyright © 2012, p. 16
S&OP Process
 Plan Execution


                  Supply Chain Insights LLC Copyright © 2012, p. 17
S&OP Challenge


           Supply Chain Insights LLC Copyright © 2012, p. 18
Agenda


         Supply Chain Insights LLC Copyright © 2012, p. 19
Center of Excellence


               Supply Chain Insights LLC Copyright © 2012, p. 20
Functions of Center of Excellence


                      Supply Chain Insights LLC Copyright © 2012, p. 21
Center of Excellence
Importance vs. Performance


                    Supply Chain Insights LLC Copyright © 2012, p. 22
Agenda


         Supply Chain Insights LLC Copyright © 2012, p. 23
Supply Chain Talent
 Today vs. In Five Years


                    Supply Chain Insights LLC Copyright © 2012, p. 24
Getting Talent


            Supply Chain Insights LLC Copyright © 2012, p. 25
Employee Level with
Greatest Talent Shortage


                 Supply Chain Insights LLC Copyright © 2012, p. 26
Cross-Functional Training


                  Supply Chain Insights LLC Copyright © 2012, p. 27
Wrap-up


• What one thing would you like people to
  take-away from this conference based on
  this panel?
• What is the most critical thing that you have
  learned that you would like to share with the
  group? (Wisdom)


                               Supply Chain Insights LLC Copyright © 2012, p. 28
Join Us!

www.scicommunity.com


                       Supply Chain Insights LLC Copyright © 2012, p. 29
Who is Supply Chain Insights?


Supply Chain Insights is focused on delivering
actionable advice for supply chain leaders.
A company dedicated to research, turn to us
when you want the latest insights on supply
chain trends, technologies to know and metrics
that matter.


                               Supply Chain Insights LLC Copyright © 2012, p. 30
Who is Lora?

• Founder of Supply Chain Insights
• Partner at Altimeter Group (leader in open
  research)
• 7 years of Management Experience leading
  Analyst Teams at Gartner and AMR Research
• 8 years Experience in Marketing and Selling
  Supply Chain Software at Descartes Systems
  Group and Manugistics (now JDA)
• 15 Years Leading teams in Manufacturing and
  Distribution operations for Clorox, Kraft/General
  Foods, Nestle/Dreyers Grand Ice Cream and
  Procter & Gamble.


                          Supply Chain Insights LLC Copyright © 2012, p. 31
Where do you find Lora?

 Contact Information: loracecere@gmail.com
 Blog: www.supplychainshaman.com
 (4000 pageviews/month)
 Twitter: lcecere 3300 followers. Rated as the
 top rated supply chain social network user.
 Linkedin: linkedin.com/pub/lora-
 cecere/0/196/573 (2300 in the network)


                        Supply Chain Insights LLC Copyright © 2012, p. 32

IBF Panel on Future of S&OP

  • 1.
    S&OP Panel October 2012 Supply Chain Insights
  • 2.
    Agenda Supply Chain Insights LLC Copyright © 2012, p. 2
  • 3.
    Supply Chain Management: Top3 Elements of Pain for Respondent Supply Chain Insights LLC Copyright © 2012, p. 3
  • 4.
    Scenario Planning Supply Chain Insights LLC Copyright © 2012, p. 4
  • 5.
    Average Days ofInventory by Year 250.0 200.0 Days of Inventory 150.0 100.0 50.0 0.0 2000 2001 2002 2003 2004 2005 2006 2007 2008 2009 2010 2011 Consumer Packaged Goods 59.0 57.0 62.0 64.0 67.0 67.0 68.0 70.0 70.0 64.0 64.0 67.0 Chemical 71.5 71.9 78.2 75.1 62.0 70.3 68.1 64.3 64.3 78.6 72.9 72.8 Pharma 122.2 133.7 190.1 171.0 184.3 175.6 167.8 149.8 154.9 198.7 154.3 131.8 High Tech 93.1 57.6 46.5 48.5 35.9 37.3 43.8 36.8 34.6 41.3 34.8 30.4 Average 86.5 80.0 94.2 89.6 87.3 87.5 86.9 80.2 81.0 95.6 81.5 75.5 Source: Supply Chain Insights 2012 Supply Chain Insights LLC Copyright © 2012, p. 5
  • 6.
    Average Days ofWorking Capital by Industry 350.0 300.0 250.0 Days of Working Capital 200.0 150.0 100.0 50.0 0.0 -50.0 2000 2001 2002 2003 2004 2005 2006 2007 2008 2009 2010 2011 Consumer Packaged Goods -20.0 -8.0 -12.0 -2.0 -21.0 -23.0 -8.0 -18.0 -11.0 -10.0 -12.0 -13.0 Chemical 37.3 44.7 61.7 71.9 64.8 64.1 63.8 57.0 51.7 74.8 85.6 77.0 Pharma 64.1 56.4 48.4 56.2 71.8 94.1 92.6 88.1 87.1 111.0 116.0 113.2 High Tech 231.5 290.3 283.5 243.5 173.5 138.9 109.4 103.0 92.4 131.9 138.9 140.9 Average 78.2 95.9 95.4 92.4 72.3 68.5 64.5 57.5 55.1 76.9 82.1 79.5 0.0 0.0 0.0 0.0 0.0 0.0 0.0 0.0 0.0 0.0 0.0 0.0 Source: Supply Chain Insights 2012 Supply Chain Insights LLC Copyright © 2012, p. 6
  • 7.
    S&OP Process Existence, Goals& Processes Supply Chain Insights LLC Copyright © 2012, p. 7
  • 8.
    Multiple S&OP Processes Regional S&OP Processes Executive S&OP Supply Chain S&OP Planning Processes Processes With Key with Key Customers Suppliers
  • 9.
    The Need forBalance Supply Chain Insights LLC Copyright © 2012, p. 9
  • 10.
    S&OP Balance Supply Chain Insights LLC Copyright © 2012, p. 10
  • 11.
    What is Agility? Supply Chain Insights LLC Copyright © 2012, p. 11
  • 12.
    Agility Importance vs.Performance Supply Chain Insights LLC Copyright © 2012, p. 12
  • 13.
    What-if Analysis Supply Chain Insights LLC Copyright © 2012, p. 13
  • 14.
    S&OP Evolution Greater Benefit Business- • Growth Sales Driven planning Driven • Resilience Match Demand Maximize • Efficiency with Supply Profitability Market Driven Manufacturing- Demand Driven Driven Maximize Maximize Opportunity and Deliver a Feasible Opportunity Mitigate Risk. Plan for Operations Sense and Orchestrate Match Demand Shape Demand with Supply Demand Market to Market Supply Chain Insights LLC Copyright © 2012, p. 14
  • 15.
    Benefits Received fromS&OP Processes Increasing revenue ▲ 2% 59% Improving forecast accuracy ▲ 5-7% 57% Reduction of inventory ▼ 10-15% 50% Improving asset utilization ▲ 3-7% 42% Determining outsourced manufacturing 38% Determining procurement requirements 36% Improving new product launch ▲ 3-6% 34% Transportation and warehouse management ▼ 2-8% 32% Capital planning and asset management 32% Improvements in the perfect order ▲ 3-6% 30% Source: Supply Chain Insights, 2012 What benefits have you received from your work with S&OP processes?
  • 16.
    Agenda Supply Chain Insights LLC Copyright © 2012, p. 16
  • 17.
    S&OP Process PlanExecution Supply Chain Insights LLC Copyright © 2012, p. 17
  • 18.
    S&OP Challenge Supply Chain Insights LLC Copyright © 2012, p. 18
  • 19.
    Agenda Supply Chain Insights LLC Copyright © 2012, p. 19
  • 20.
    Center of Excellence Supply Chain Insights LLC Copyright © 2012, p. 20
  • 21.
    Functions of Centerof Excellence Supply Chain Insights LLC Copyright © 2012, p. 21
  • 22.
    Center of Excellence Importancevs. Performance Supply Chain Insights LLC Copyright © 2012, p. 22
  • 23.
    Agenda Supply Chain Insights LLC Copyright © 2012, p. 23
  • 24.
    Supply Chain Talent Today vs. In Five Years Supply Chain Insights LLC Copyright © 2012, p. 24
  • 25.
    Getting Talent Supply Chain Insights LLC Copyright © 2012, p. 25
  • 26.
    Employee Level with GreatestTalent Shortage Supply Chain Insights LLC Copyright © 2012, p. 26
  • 27.
    Cross-Functional Training Supply Chain Insights LLC Copyright © 2012, p. 27
  • 28.
    Wrap-up • What onething would you like people to take-away from this conference based on this panel? • What is the most critical thing that you have learned that you would like to share with the group? (Wisdom) Supply Chain Insights LLC Copyright © 2012, p. 28
  • 29.
    Join Us! www.scicommunity.com Supply Chain Insights LLC Copyright © 2012, p. 29
  • 30.
    Who is SupplyChain Insights? Supply Chain Insights is focused on delivering actionable advice for supply chain leaders. A company dedicated to research, turn to us when you want the latest insights on supply chain trends, technologies to know and metrics that matter. Supply Chain Insights LLC Copyright © 2012, p. 30
  • 31.
    Who is Lora? •Founder of Supply Chain Insights • Partner at Altimeter Group (leader in open research) • 7 years of Management Experience leading Analyst Teams at Gartner and AMR Research • 8 years Experience in Marketing and Selling Supply Chain Software at Descartes Systems Group and Manugistics (now JDA) • 15 Years Leading teams in Manufacturing and Distribution operations for Clorox, Kraft/General Foods, Nestle/Dreyers Grand Ice Cream and Procter & Gamble. Supply Chain Insights LLC Copyright © 2012, p. 31
  • 32.
    Where do youfind Lora? Contact Information: loracecere@gmail.com Blog: www.supplychainshaman.com (4000 pageviews/month) Twitter: lcecere 3300 followers. Rated as the top rated supply chain social network user. Linkedin: linkedin.com/pub/lora- cecere/0/196/573 (2300 in the network) Supply Chain Insights LLC Copyright © 2012, p. 32

Editor's Notes

  • #4 Two largest issues are management understanding and ability to get to data and drive actionable analytics. How does this fit with what you are seeing in your organization?
  • #5 Only 8% of organizations have sufficient what if capabilities do manage the S&OP Process to their satisfaction. How about you?
  • #6 Why have we not been able to make progress on inventory across supply chain industries?
  • #8 How has the proliferation of S&OP Processes changed the complexity of the work? Has this helped or hurt the evolution of supply chain processes?
  • #9 How many of these processes do you have?
  • #10 What is balance? Are you balanced?
  • #11 What is the impact of being balanced?
  • #12 S&OP is one of the largest factors in driving agility. How do you define it?
  • #13 Has S&OP improved agility for you?
  • #14 People speak of IBP and financial analysis. Which of these do you do? What are the issues with the ones that you have to track? Tell us the details that are stumbling blocks.
  • #15 There is a raging debate between S&OP and IBP, but isn’t the greater issue inside-out versus outside-in?
  • #16 These are the initial benefits gathered from S&OP Processes. What do you see? And how do these results compare to what you have seen in your organization?
  • #18 How do you tie planning to execution?
  • #19 What challenges have you seen and how have you overcome them?
  • #21 Do you have a center of excellence?
  • #22 How does this compare to what your center does?
  • #23 Why do you think that there is such a large gap in the supply chain centers of excellence in the facilitation of S&OP?