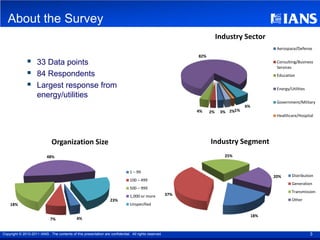
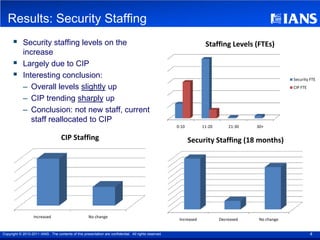
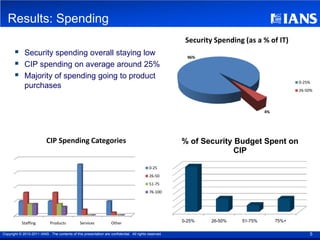
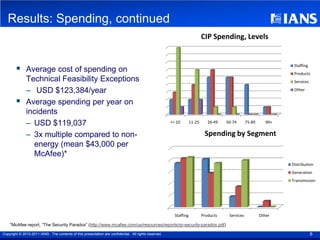
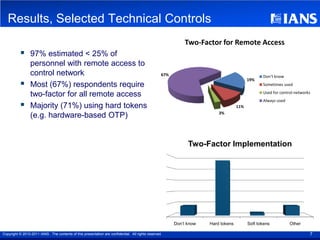
IANS/EnergySec Benchmark Survey:
                Results Overview

                                                                                                         Ed Moyle
                                                                                                IANS Faculty Member


Copyright © 2010-2011 IANS . The contents of this presentation are confidential . All rights reserved.
Agenda

              About the survey
              Results overview
               –Staffing
               –Spending
              Conclusions


Copyright © 2010-2011 IANS . The contents of this presentation are confidential. All rights reserved.   2
About the Survey
                                                                                                                         Industry Sector
                                                                                                                                                Aerospace/Defense
                                                                                                              82%
                    33 Data points                                                                                                             Consulting/Business
                                                                                                                                                Services
                    84 Respondents                                                                                                             Education

                    Largest response from                                                                                                      Energy/Utilities
                     energy/utilities
                                                                                                                                                Government/Military
                                                                                                                                    6%
                                                                                                              4%    2%    3% 2%1%
                                                                                                                                                Healthcare/Hospital


                               Organization Size                                                                    Industry Segment
                           48%                                                                                             25%


                                                                                1 – 99
                                                                                                                                               20%      Distribution
                                                                                100 – 499
                                                                                                                                                        Generation
                                                                                500 – 999
                                                                                                                                                        Transmission
                                                                                1,000 or more           37%
                                                                    23%                                                                                 Other
    18%                                                                         Unspecified

                                                                                                                                         18%
                              7%              4%


Copyright © 2010-2011 IANS . The contents of this presentation are confidential. All rights reserved.                                                              3
Results: Security Staffing
           Security staffing levels on the                                                                           Staffing Levels (FTEs)
            increase
           Largely due to CIP
           Interesting conclusion:                                                                                                                   Security FTE
            – Overall levels slightly up                                                                                                              CIP FTE

            – CIP trending sharply up
            – Conclusion: not new staff, current
               staff reallocated to CIP
                                                                                                        0-10         11-20       21-30   30+

                                     CIP Staffing                                                              Security Staffing (18 months)


                   Increased                          No change
                                                                                                         Increased           Decreased    No change


Copyright © 2010-2011 IANS . The contents of this presentation are confidential. All rights reserved.                                                           4
Results: Spending
                                                                                                         Security Spending (as a % of IT)
            Security spending overall staying low                                                        96%
            CIP spending on average around 25%
            Majority of spending going to product
                                                                                                                                               0-25%
             purchases                                                                                                                         26-50%


                                                                                                                                   4%


                           CIP Spending Categories                                                      % of Security Budget Spent on
                                                                                                                      CIP

                                                                                            0-25
                                                                                            26-50
                                                                                            51-75
                                                                                            76-100


            Staffing          Products           Services           Other                               0-25%    26-50%   51-75%        75%+

Copyright © 2010-2011 IANS . The contents of this presentation are confidential. All rights reserved.                                              5
Results: Spending, continued
                                                                                                                             CIP Spending, Levels


             Average cost of spending on
                                                                                                                                                                      Staffing
                                                                                                                                                                      Products
              Technical Feasibility Exceptions                                                                                                                        Services

              – USD $123,384/year                                                                                                                                     Other


             Average spending per year on
              incidents
              – USD $119,037                                                                            <= 10        11-25      26-49   50-74       75-89      90+


              – 3x multiple compared to non-                                                                                  Spending by Segment
                energy (mean $43,000 per
                McAfee)*
                                                                                                                                                                     Distribution
                                                                                                                                                                     Generation
                                                                                                                                                                     Transmission


                                                                                                          Staffing           Products    Services           Other

    *McAfee report, “The Security Paradox” (http://www.mcafee.com/us/resources/reports/rp-security-paradox.pdf)

Copyright © 2010-2011 IANS . The contents of this presentation are confidential. All rights reserved.                                                                            6
Results, Selected Technical Controls
                                                                                                              Two-Factor for Remote Access
                97% estimated < 25% of
                 personnel with remote access to
                 control network                                                                    67%                                           Don’t know
                                                                                                                                           19%
                Most (67%) respondents require                                                                                                   Sometimes used
                                                                                                                                                  Used for control networks
                 two-factor for all remote access
                                                                                                                                                  Always used
                Majority (71%) using hard tokens                                                                                    11%
                                                                                                                           3%
                 (e.g. hardware-based OTP)


                                                                                                                Two-Factor Implementation


                                                                                                          Don’t know   Hard tokens         Soft tokens          Other

Copyright © 2010-2011 IANS . The contents of this presentation are confidential. All rights reserved.                                                                     7
Some Interesting Conclusions

              Research bears out a few assumptions
                   – Security staff increasing (but slowly)
                   – CIP staff increasing sharply
                   – Suggests conversion vs. hiring
                  Leading CIP spend in staffing and product
                   deployment
                  3x incident spend multiplier vs. non-energy
                   – Suggests higher rate/impact of attack
                  Data suggests control networks with insufficient auth
                   – 97% remote access to control network
                   – 78% know of two factor for that remote access
                   – Potential gap of up to 20%
Copyright © 2010-2011 IANS . The contents of this presentation are confidential. All rights reserved.   8

IANS NESCO Survey

  • 1.
    IANS/EnergySec Benchmark Survey: Results Overview Ed Moyle IANS Faculty Member Copyright © 2010-2011 IANS . The contents of this presentation are confidential . All rights reserved.
  • 2.
    Agenda  About the survey  Results overview –Staffing –Spending  Conclusions Copyright © 2010-2011 IANS . The contents of this presentation are confidential. All rights reserved. 2
  • 3.
    About the Survey Industry Sector Aerospace/Defense 82%  33 Data points Consulting/Business Services  84 Respondents Education  Largest response from Energy/Utilities energy/utilities Government/Military 6% 4% 2% 3% 2%1% Healthcare/Hospital Organization Size Industry Segment 48% 25% 1 – 99 20% Distribution 100 – 499 Generation 500 – 999 Transmission 1,000 or more 37% 23% Other 18% Unspecified 18% 7% 4% Copyright © 2010-2011 IANS . The contents of this presentation are confidential. All rights reserved. 3
  • 4.
    Results: Security Staffing  Security staffing levels on the Staffing Levels (FTEs) increase  Largely due to CIP  Interesting conclusion: Security FTE – Overall levels slightly up CIP FTE – CIP trending sharply up – Conclusion: not new staff, current staff reallocated to CIP 0-10 11-20 21-30 30+ CIP Staffing Security Staffing (18 months) Increased No change Increased Decreased No change Copyright © 2010-2011 IANS . The contents of this presentation are confidential. All rights reserved. 4
  • 5.
    Results: Spending Security Spending (as a % of IT)  Security spending overall staying low 96%  CIP spending on average around 25%  Majority of spending going to product 0-25% purchases 26-50% 4% CIP Spending Categories % of Security Budget Spent on CIP 0-25 26-50 51-75 76-100 Staffing Products Services Other 0-25% 26-50% 51-75% 75%+ Copyright © 2010-2011 IANS . The contents of this presentation are confidential. All rights reserved. 5
  • 6.
    Results: Spending, continued CIP Spending, Levels  Average cost of spending on Staffing Products Technical Feasibility Exceptions Services – USD $123,384/year Other  Average spending per year on incidents – USD $119,037 <= 10 11-25 26-49 50-74 75-89 90+ – 3x multiple compared to non- Spending by Segment energy (mean $43,000 per McAfee)* Distribution Generation Transmission Staffing Products Services Other *McAfee report, “The Security Paradox” (http://www.mcafee.com/us/resources/reports/rp-security-paradox.pdf) Copyright © 2010-2011 IANS . The contents of this presentation are confidential. All rights reserved. 6
  • 7.
    Results, Selected TechnicalControls Two-Factor for Remote Access  97% estimated < 25% of personnel with remote access to control network 67% Don’t know 19%  Most (67%) respondents require Sometimes used Used for control networks two-factor for all remote access Always used  Majority (71%) using hard tokens 11% 3% (e.g. hardware-based OTP) Two-Factor Implementation Don’t know Hard tokens Soft tokens Other Copyright © 2010-2011 IANS . The contents of this presentation are confidential. All rights reserved. 7
  • 8.
    Some Interesting Conclusions  Research bears out a few assumptions – Security staff increasing (but slowly) – CIP staff increasing sharply – Suggests conversion vs. hiring  Leading CIP spend in staffing and product deployment  3x incident spend multiplier vs. non-energy – Suggests higher rate/impact of attack  Data suggests control networks with insufficient auth – 97% remote access to control network – 78% know of two factor for that remote access – Potential gap of up to 20% Copyright © 2010-2011 IANS . The contents of this presentation are confidential. All rights reserved. 8