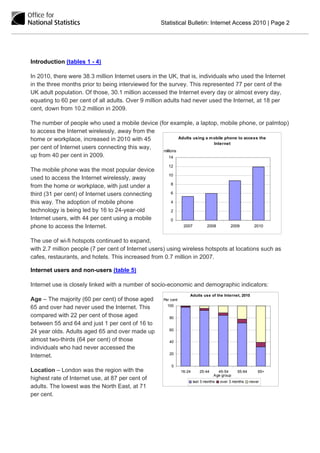
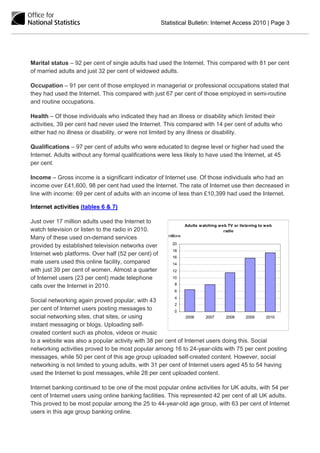
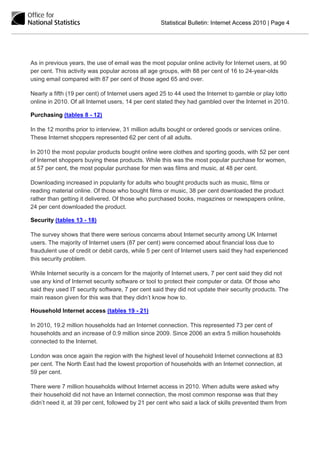
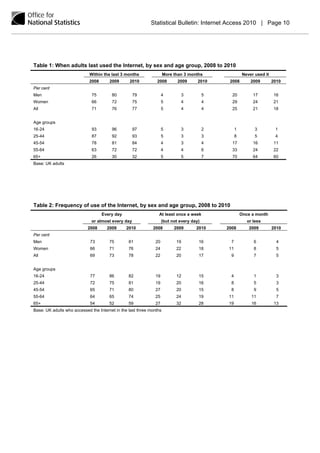
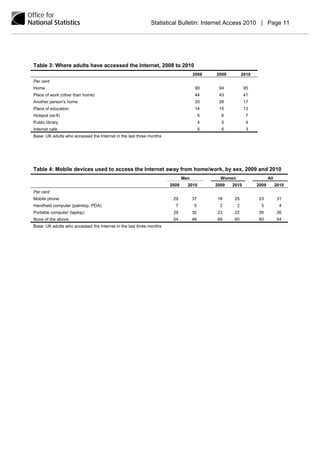
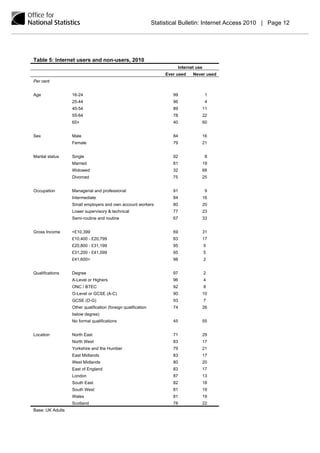
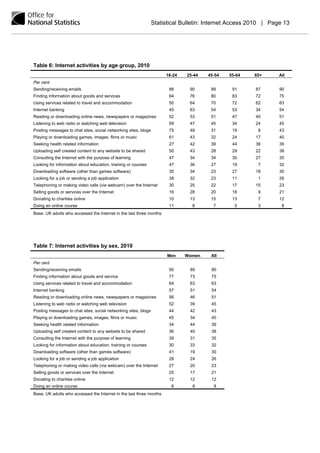
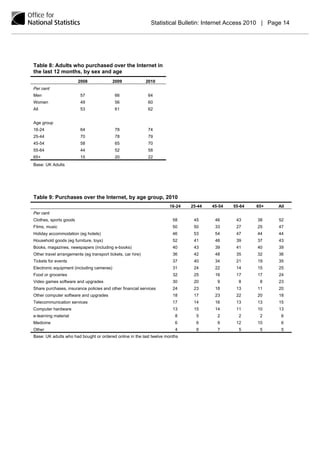
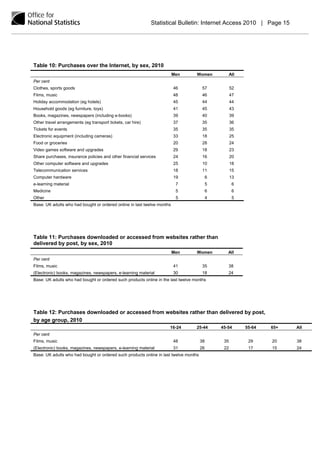
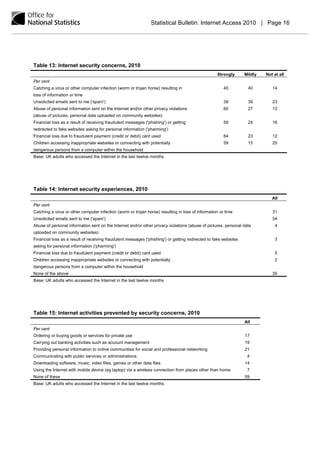
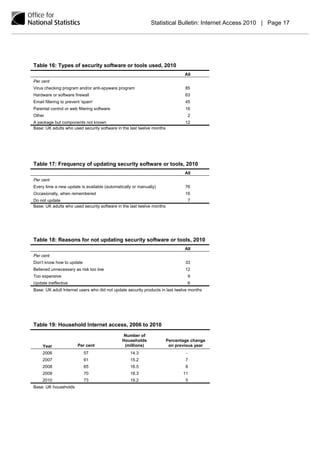
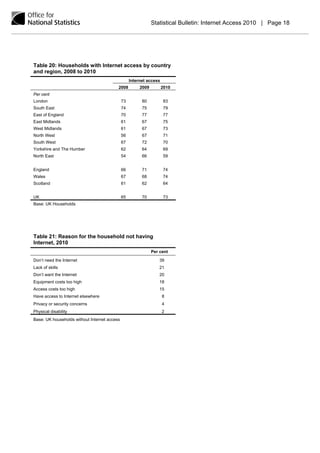
Internet Access 2010
Households and Individuals

Date: 27 August 2010
Coverage: United Kingdom                  Theme: Social & Welfare


The 2010 Internet Access survey of households and individuals measures home access to the
Internet and individuals’ use of the Internet across the UK.

The key findings from the survey show that:

    30.1 million adults used the Internet every
     day or nearly every day, almost double the                                Adults using the Internet every day
                                                             millions
     estimate in 2006
                                                               35

    9.2 million adults had never used the                     30

     Internet                                                  25

                                                               20
    31 per cent of Internet users connected via
                                                               15
     a mobile phone, up from 23 per cent in 2009
                                                               10
    17.4 million adults used the Internet to                    5
     watch television or listen to the radio, an
                                                                 0
     increase from 6.4 million in 2006                                  2006        2007       2008       2009          2010


    73 per cent of households had Internet
     access

    31 million people bought or ordered goods or services online in the last 12 months

Frequency of Internet access by UK adults aged 16 or over
                      Every day                     Weekly                         Monthly or less                             Never
                              adults                      adults                              adults                                adults
    Year        per cent     (millions)      per cent   (millions)             per cent     (millions)               per cent      (millions)


    2006           35          16.5            16          7.6                    13             6.2                   35              16.7
    2007           45          21.2            16          7.6                    12             5.8                   27              13.0
    2008           49          23.5            16          7.4                    11             5.2                   25              11.8
    2009           55          27.3            15          7.5                     9             4.3                   21              10.2
    2010           60          30.1            13          6.5                     8             4.0                   18               9.2
Source: ONS Opinions survey
Statistical Bulletin: Internet Access 2010 | Page 2


Introduction (tables 1 - 4)

In 2010, there were 38.3 million Internet users in the UK, that is, individuals who used the Internet
in the three months prior to being interviewed for the survey. This represented 77 per cent of the
UK adult population. Of those, 30.1 million accessed the Internet every day or almost every day,
equating to 60 per cent of all adults. Over 9 million adults had never used the Internet, at 18 per
cent, down from 10.2 million in 2009.

The number of people who used a mobile device (for example, a laptop, mobile phone, or palmtop)
to access the Internet wirelessly, away from the
home or workplace, increased in 2010 with 45              Adults using a m obile phone to access the
                                                                           Internet
per cent of Internet users connecting this way,
                                                 millions
up from 40 per cent in 2009.                         14

                                                      12
The mobile phone was the most popular device
                                                      10
used to access the Internet wirelessly, away
                                                        8
from the home or workplace, with just under a
third (31 per cent) of Internet users connecting        6

this way. The adoption of mobile phone                  4

technology is being led by 16 to 24-year-old            2
Internet users, with 44 per cent using a mobile         0
phone to access the Internet.                                   2007           2008         2009          2010


The use of wi-fi hotspots continued to expand,
with 2.7 million people (7 per cent of Internet users) using wireless hotspots at locations such as
cafes, restaurants, and hotels. This increased from 0.7 million in 2007.

Internet users and non-users (table 5)

Internet use is closely linked with a number of socio-economic and demographic indicators:
                                                                   Adults use of the Internet, 2010
Age – The majority (60 per cent) of those aged      Per cent
                                                      100
65 and over had never used the Internet. This
compared with 22 per cent of those aged                80
between 55 and 64 and just 1 per cent of 16 to
                                                       60
24 year olds. Adults aged 65 and over made up
almost two-thirds (64 per cent) of those               40
individuals who had never accessed the
                                                       20
Internet.
                                                        0
Location – London was the region with the                      16-24       25-44     45-54      55-64       65+
                                                                                   Age group
highest rate of Internet use, at 87 per cent of                        last 3 months   over 3 months    never
adults. The lowest was the North East, at 71
per cent.
Statistical Bulletin: Internet Access 2010 | Page 3


Marital status – 92 per cent of single adults had used the Internet. This compared with 81 per cent
of married adults and just 32 per cent of widowed adults.

Occupation – 91 per cent of those employed in managerial or professional occupations stated that
they had used the Internet. This compared with just 67 per cent of those employed in semi-routine
and routine occupations.

Health – Of those individuals who indicated they had an illness or disability which limited their
activities, 39 per cent had never used the Internet. This compared with 14 per cent of adults who
either had no illness or disability, or were not limited by any illness or disability.

Qualifications – 97 per cent of adults who were educated to degree level or higher had used the
Internet. Adults without any formal qualifications were less likely to have used the Internet, at 45
per cent.

Income – Gross income is a significant indicator of Internet use. Of those individuals who had an
income over £41,600, 98 per cent had used the Internet. The rate of Internet use then decreased in
line with income: 69 per cent of adults with an income of less than £10,399 had used the Internet.

Internet activities (tables 6 & 7)

Just over 17 million adults used the Internet to
                                                                   Adults w atching w eb TV or listening to w eb
watch television or listen to the radio in 2010.                                       radio
                                                        millions
Many of these used on-demand services
                                                          20
provided by established television networks over
                                                          18
Internet web platforms. Over half (52 per cent) of
                                                          16
male users used this online facility, compared            14
with just 39 per cent of women. Almost a quarter          12
of Internet users (23 per cent) made telephone            10
                                                            8
calls over the Internet in 2010.
                                                            6
                                                            4
Social networking again proved popular, with 43
                                                         2
per cent of Internet users posting messages to           0
social networking sites, chat sites, or using                 2006    2007    2008   2009    2010

instant messaging or blogs. Uploading self-
created content such as photos, videos or music
to a website was also a popular activity with 38 per cent of Internet users doing this. Social
networking activities proved to be most popular among 16 to 24-year-olds with 75 per cent posting
messages, while 50 per cent of this age group uploaded self-created content. However, social
networking is not limited to young adults, with 31 per cent of Internet users aged 45 to 54 having
used the Internet to post messages, while 28 per cent uploaded content.

Internet banking continued to be one of the most popular online activities for UK adults, with 54 per
cent of Internet users using online banking facilities. This represented 42 per cent of all UK adults.
This proved to be most popular among the 25 to 44-year-old age group, with 63 per cent of Internet
users in this age group banking online.
Statistical Bulletin: Internet Access 2010 | Page 4


As in previous years, the use of email was the most popular online activity for Internet users, at 90
per cent. This activity was popular across all age groups, with 88 per cent of 16 to 24-year-olds
using email compared with 87 per cent of those aged 65 and over.

Nearly a fifth (19 per cent) of Internet users aged 25 to 44 used the Internet to gamble or play lotto
online in 2010. Of all Internet users, 14 per cent stated they had gambled over the Internet in 2010.

Purchasing (tables 8 - 12)

In the 12 months prior to interview, 31 million adults bought or ordered goods or services online.
These Internet shoppers represented 62 per cent of all adults.

In 2010 the most popular products bought online were clothes and sporting goods, with 52 per cent
of Internet shoppers buying these products. While this was the most popular purchase for women,
at 57 per cent, the most popular purchase for men was films and music, at 48 per cent.

Downloading increased in popularity for adults who bought products such as music, films or
reading material online. Of those who bought films or music, 38 per cent downloaded the product
rather than getting it delivered. Of those who purchased books, magazines or newspapers online,
24 per cent downloaded the product.

Security (tables 13 - 18)

The survey shows that there were serious concerns about Internet security among UK Internet
users. The majority of Internet users (87 per cent) were concerned about financial loss due to
fraudulent use of credit or debit cards, while 5 per cent of Internet users said they had experienced
this security problem.

While Internet security is a concern for the majority of Internet users, 7 per cent said they did not
use any kind of Internet security software or tool to protect their computer or data. Of those who
said they used IT security software, 7 per cent said they did not update their security products. The
main reason given for this was that they didn’t know how to.

Household Internet access (tables 19 - 21)

In 2010, 19.2 million households had an Internet connection. This represented 73 per cent of
households and an increase of 0.9 million since 2009. Since 2006 an extra 5 million households
connected to the Internet.

London was once again the region with the highest level of household Internet connections at 83
per cent. The North East had the lowest proportion of households with an Internet connection, at
59 per cent.

There were 7 million households without Internet access in 2010. When adults were asked why
their household did not have an Internet connection, the most common response was that they
didn’t need it, at 39 per cent, followed by 21 per cent who said a lack of skills prevented them from
Statistical Bulletin: Internet Access 2010 | Page 5


having the Internet. Equipment costs being too high was the reason given by 18 per cent of adults
as to why their household had no Internet connection.

The housing tenure of a household was a factor in the likelihood of there being an Internet
connection in the home. Of those households where the home was being purchased with a
mortgage or loan, 94 per cent had an Internet connection, compared with 63 per cent that were
rented, and 62 per cent where the home was owned outright.

Where the person completing the survey was under 50, the survey found that the number of
children in a household had little effect on the likelihood of the household having Internet access.
Of the households where there were no dependent children, 84 per cent had Internet access
compared with 92 per cent of households with one or more dependent children.
Statistical Bulletin: Internet Access 2010 | Page 6


     Background Notes
     BASIC QUALITY INFORMATION

1.   Key issues specific to this release

     This statistical bulletin shows information about both households with home access to the Internet and
     about individuals’ use of the Internet. The source of this information is the National Statistics Opinions
     (Omnibus) Survey. Responses were collected in January, February, March and April 2010. This is the
     fifth annual release of these estimates, which replaced the more frequent results produced from smaller
     samples.

     The National Statistics Opinions Survey is a multi-purpose survey developed by the Office for National
     Statistics (ONS) for use by government departments, other public bodies, charities and academics. It
     provides a fast, cost effective and reliable way of obtaining information on topics too brief to warrant
     their own survey. The Opinions Survey is carried out each month on a random sample of about 1,800
     adults, aged 16 and over, living in private households throughout Great Britain. Northern Ireland has
     not been sampled since the 2008 survey, but has been included in the survey estimation for both the
     2009 and 2010 UK results. After accounting for refusals and where no contact can be made,
     approximately 1,200 interviews are conducted each month. For general information on the National
     Statistics Opinions Survey, contact 01633 455810, Opinions@ons.gov.uk

     Before the annual publication began in 2006, Internet access data for households and individuals were
     published periodically on the ONS website at:
     http://www.statistics.gov.uk/statbase/Product.asp?vlnk=5672.These estimates related to Great Britain
     only as Northern Ireland was not covered by the Internet Access survey prior to 2006.

2.   Common pitfalls in interpreting series

     The statistics presented here should not be confused with the e-commerce statistical series that
     contains information about the use made of the Internet and other information and communication
     technologies (ICTs) by businesses.

3.   Relevance to users

     In this release, Internet access estimates relate to households, while Internet usage estimates relate to
     individuals, or adults, who are defined as being aged 16 or over.

     References to 2010 in this release mean data collected between January and April 2010.

     An Internet user is defined as an adult who accessed the Internet in the three months prior to being
     interviewed.

4.   Accuracy

     Revisions to earlier years

     Previously published statistics in this series have not been revised.
Statistical Bulletin: Internet Access 2010 | Page 7


5.   Sampling variability

     The National Statistics Opinions survey is carried out by interviewing a nationally representative sample
     of households in Great Britain. About 1,800 households are sampled each month and estimates are
     subject to sampling variability, as are those from all sample surveys.

     The estimates in the survey relate to the whole of the UK. As in previous years, the Isles of Scilly and
     the Scottish Highlands (North of the Caledonian Canal) and Islands were not sampled. However,
     Northern Ireland has not been sampled since the 2008 survey, but has been included in the estimation
     for both the 2009 and 2010 UK results. No estimates relating to Northern Ireland specifically are
     available for the 2010 survey.

     The following tables show sampling variabilities for estimates relating to frequency of use of the
     Internet, and household Internet connections. These sampling variability ranges represent ‘95
     per cent confidence intervals’ which means that it is expected that in 95 per cent of samples the
     range would contain the true value.


      When adults last used the Internet: 95 per cent confidence intervals, 2010
                                     Lower limit   Survey estimate    Upper limit
      Per cent
      Daily                              58              60               62
      Weekly                             12              13               14
      Monthly or less                     7               8                9
      Never                              17              18               79

      Within the last three months       75              77               79


      Households with Internet Access, by country and region: 95 per cent
      confidence intervals, 2010
                                     Lower limit   Survey estimate    Upper limit
      Per cent
      London                             79              83               88
      South East                         75              79               83
      East of England                    72              77               82
      East Midlands                      70              75               81
      West Midlands                      68              73               79
      North West                         66              71               75
      South West                         64              70               75
      Yorkshire & the Humber             64              69               75
      North East                         51              59               68

      England                            73              74               76
      Wales                              67              74               81
      Scotland                           58              64               69

      UK                                 72              73               75
Statistical Bulletin: Internet Access 2010 | Page 8


  6. Response rates

      The voluntary nature of the survey means that people who do not wish to take part in the survey can
      refuse to do so. The sample is designed to ensure that the results of the survey represent the
      population. The risk of the survey not being representative is likely to increase with every refusal or
      non-contact with a sampled household (survey non-response). One measure of the quality of survey
      results is therefore the response rate.

      A response means a household that has answered all applicable questions.

      A refusal is a household which refuses to respond to the survey.

      A non-contact arises when an address is occupied but where it has not been possible to contact any
      member of the household in the collection period.

      Response rate, 2010
                       Response         Refusal       Non contact

            per cent        59            31               10


7.    Calibration

      Weights are used in the analysis of the Opinions Survey data, for both households and for individuals.
      These weights are derived by calibration, using population estimates for age group by sex and region.
      The weights are used to improve the accuracy of results by compensating for different response rates
      for different groups and by reducing the random variation in estimates. For the household analysis, the
      weights are influenced by the characteristics of all the members of the household.

      As the responses are weighted to population estimates, weighted totals of individuals by age group, sex
      and region from the survey are guaranteed to match the fixed population estimates. However, the
      weighting does not include control totals for the total number of households. Therefore the total number
      of households arrived at, by summing across the categories shown in the tables, is a survey estimate
      and subject to random variation. Over time, this estimate will fluctuate around the true number of
      households in the population, but is not guaranteed to exactly match the true value (or estimates from
      other sources), nor show the same year-on-year change.

8.    Coherence

      ONS’s annual e-commerce survey provides information on business’ use of the Internet and other
      ICTs. Further information is available at www.statistics.gov.uk/statbase/Product.asp?vlnk=6645

9.    Rounding

      Percentages may not sum to 100 or agree with related totals, due to independently rounded
      components.

10.   Publication policy

      Details of the policy governing the release of new data are available from the Media Relations Office.
Statistical Bulletin: Internet Access 2010 | Page 9


11.    National Statistics are produced to high professional standards set out in the Code of Practice for
      Official Statistics. They undergo regular quality assurance reviews to ensure that they meet customer
      needs They are produced free from any political interference. © Crown copyright 2010.


      Next publication: Friday 26 August 2011
      Issued by: Office for National Statistics, Government Buildings, Cardiff Road, Newport NP10 8XG


      Media contact:
      Tel        Media Relations Office    0845 6041858
                 Emergency on-call     07867 906553
      E-mail     press.office@ons.gsi.gov.uk


      Statistical contact:
      Tel        Mark Williams    01633 456728
      E-mail     esociety@ons.gov.uk


      Website:
      www.ons.gov.uk
Statistical Bulletin: Internet Access 2010 | Page 10


Table 1: When adults last used the Internet, by sex and age group, 2008 to 2010
                            Within the last 3 months                 More than 3 months                 Never used it
                            2008       2009      2010          2008        2009      2010     2008          2009        2010
Per cent
Men                           75        80         79              4         3           5     20            17          16
Women                         66        72         75              5         4           4     29            24          21
All                           71        76         77              5         4           4     25            21          18


Age groups
16-24                         93        96         97              5         3           2         1          3          1
25-44                         87        92         93              5         3           3         8          5          4
45-54                         78        81         84              4         3           4     17            16         11
55-64                         63        72         72              4         4           6     33            24         22
65+                           26        30         32              5         5           7     70            64         60
Base: UK adults


Table 2: Frequency of use of the Internet, by sex and age group, 2008 to 2010
                                   Every day                    At least once a week                   Once a month
                             or almost every day                   (but not every day)                    or less
                           2008      2009      2010          2008         2009      2010     2008          2009         2010
Per cent
Men                          73        75        81           20           19        16       7              6            4
Women                        66        71        76           24           22        18      11              8            5
All                          69        73        78           22           20        17       9              7            5


Age groups
16-24                        77        86        82           19           12        15        4             1            3
25-44                        72        75        81           19           20        16        8             5            3
45-54                        65        71        80           27           20        15        8             9            5
55-64                        64        65        74           25           24        19      11             11            7
65+                          54        52        59           27           32        28      19             16           13
Base: UK adults who accessed the Internet in the last three months
Statistical Bulletin: Internet Access 2010 | Page 11


Table 3: Where adults have accessed the Internet, 2008 to 2010
                                                                                  2008     2009          2010
Per cent
Home                                                                               90       94            95
Place of work (other than home)                                                    44       43           41
Another person's home                                                              20       28            17
Place of education                                                                 14       15           13
Hotspot (wi-fi)                                                                        5     6            7
Public library                                                                         4     5             4
Internet cafe                                                                          5     6             3
Base: UK adults who accessed the Internet in the last three months
…………………………………………………………………………………


Table 4: Mobile devices used to access the Internet away from home/work, by sex, 2009 and 2010
                                                                            Men              Women                     All
                                                                     2009     2010         2009   2010          2009         2010
Per cent
Mobile phone                                                          29          37       18     25            23           31
Handheld computer (palmtop, PDA)                                       7           5        2        2            5            4
Portable computer (laptop)                                            29          30       23     22            26           26
None of the above                                                     54          48       66      60            60           54
Base: UK adults who accessed the Internet in the last three months
Statistical Bulletin: Internet Access 2010 | Page 12


Table 5: Internet users and non-users, 2010
                                                                         Internet use
                                                                    Ever used   Never used
Per cent


Age               16-24                                                99               1
                  25-44                                                96               4
                  45-54                                                89           11
                  55-64                                                78           22
                  65+                                                  40           60


Sex               Male                                                 84           16
                  Female                                               79           21


Marital status    Single                                               92               8
                  Married                                              81           19
                  Widowed                                              32           68
                  Divorced                                             75           25


Occupation        Managerial and professional                          91               9
                  Intermediate                                         84           16
                  Small employers and own account workers              80           20
                  Lower supervisory & technical                        77           23
                  Semi-routine and routine                             67           33


Gross Income      <£10,399                                             69           31
                  £10,400 - £20,799                                    83           17
                  £20,800 - £31,199                                    95               5
                  £31,200 - £41,599                                    95               5
                  £41,600>                                             98               2


Qualifications    Degree                                               97               2
                  A-Level or Highers                                   96               4
                  ONC / BTEC                                           92               8
                  O-Level or GCSE (A-C)                                90           10
                  GCSE (D-G)                                           93               7
                  Other qualification (foreign qualification           74           26
                  below degree)
                  No formal qualifications                             45           55


Location          North East                                           71           29
                  North West                                           83           17
                  Yorkshire and the Humber                             79           21
                  East Midlands                                        83           17
                  West Midlands                                        80           20
                  East of England                                      83           17
                  London                                               87           13
                  South East                                           82           18
                  South West                                           81           19
                  Wales                                                81           19
                  Scotland                                             78           22
Base: UK Adults
Statistical Bulletin: Internet Access 2010 | Page 13


Table 6: Internet activities by age group, 2010
                                                                      16-24   25-44   45-54   55-64    65+       All
Per cent
Sending/receiving emails                                               88      90      89      91       87       90
Finding information about goods and services                           64      76      80      83       72       75
Using services related to travel and accommodation                     50      64      70      72       62       63
Internet banking                                                       45      63      54      53       34       54
Reading or downloading online news, newspapers or magazines            52      53      51      47       40       51
Listening to web radio or watching web television                      59      47      45      34       24       45
Posting messages to chat sites, social networking sites, blogs         75      49      31      19        8       43
Playing or downloading games, images, films or music                   61      43      32      24       17       40
Seeking health related information                                     27      42      39      44       36       39
Uploading self created content to any website to be shared             50      43      28      29       22       38
Consulting the Internet with the purpose of learning                   47      34      34      30       27       35
Looking for information about education, training or courses           47      36      27      19        7       32
Downloading software (other than games software)                       35      34      23      27       18       30
Looking for a job or sending a job application                         38      32      23      11        1       26
Telephoning or making video calls (via webcam) over the Internet       30      25      22      17       15       23
Selling goods or services over the Internet                            16      28      20      18        9       21
Donating to charities online                                           10      13      15      13        7       12
Doing an online course                                                 11       8       7       5        3        8
Base: UK adults who accessed the Internet in the last three months


Table 7: Internet activities by sex, 2010
                                                                       Men    Women    All
Per cent
Sending/receiving emails                                               90      89      90
Finding information about goods and service                            77      73      75
Using services related to travel and accommodation                     64      63      63
Internet banking                                                       57      51      54
Reading or downloading online news, newspapers or magazines            56      46      51
Listening to web radio or watching web television                      52      39      45
Posting messages to chat sites, social networking sites, blogs         44      42      43
Playing or downloading games, images, films or music                   45      34      40
Seeking health related information                                     34      44      39
Uploading self created content to any website to be shared             36      40      38
Consulting the Internet with the purpose of learning                   39      31      35
Looking for information about education, training or courses           30      33      32
Downloading software (other than games software)                       41      19      30
Looking for a job or sending a job application                         28      24      26
Telephoning or making video calls (via webcam) over the Internet       27      20      23
Selling goods or services over the Internet                            25      17      21
Donating to charities online                                           12      12      12
Doing an online course                                                  8       8       8
Base: UK adults who accessed the Internet in the last three months
Statistical Bulletin: Internet Access 2010 | Page 14


Table 8: Adults who purchased over the Internet in
the last 12 months, by sex and age
                        2008               2009              2010
Per cent
Men                      57                 66                64
Women                    49                 56               60
All                      53                 61               62


Age group
16-24                    64                 78                74
25-44                    70                 78                79
45-54                    58                 65                70
55-64                    44                 52                58
65+                      15                 20               22
Base: UK Adults


Table 9: Purchases over the Internet, by age group, 2010
                                                                      16-24   25-44   45-54   55-64   65+     All
Per cent
Clothes, sports goods                                                  58      45      46      43      38     52
Films, music                                                           50      50      33      27      25     47
Holiday accommodation (eg hotels)                                      46      53      54      47      44     44
Household goods (eg furniture, toys)                                   52      41      46      39      37     43
Books, magazines, newspapers (including e-books)                       40      43      39      41      40     39
Other travel arrangements (eg transport tickets, car hire)             36      42      48      35      32     36
Tickets for events                                                     37      40      34      21      19     35
Electronic equipment (including cameras)                               31      24      22      14      15     25
Food or groceries                                                      32      25      16      17      17      24
Video games software and upgrades                                      30      20       9       8       8     23
Share purchases, insurance policies and other financial services       24      23      18      13      11     20
Other computer software and upgrades                                   18      17      23      22      20     18
Telecommunication services                                             17      14      16      13      13     15
Computer hardware                                                      13      15      14      11      10      13
e-learning material                                                     8       5       2       2       2      6
Medicine                                                                6       6       9      12      10      6
Other                                                                   4       6       7       5       5       5
Base: UK adults who had bought or ordered online in the last twelve months
Statistical Bulletin: Internet Access 2010 | Page 15


Table 10: Purchases over the Internet, by sex, 2010
                                                                         Men       Women              All
Per cent
Clothes, sports goods                                                    46             57            52
Films, music                                                             48             46            47
Holiday accommodation (eg hotels)                                        45             44            44
Household goods (eg furniture, toys)                                     41             45            43
Books, magazines, newspapers (including e-books)                         39             40            39
Other travel arrangements (eg transport tickets, car hire)               37             35            36
Tickets for events                                                       35             35            35
Electronic equipment (including cameras)                                 33             18            25
Food or groceries                                                        20             28            24
Video games software and upgrades                                        29             18            23
Share purchases, insurance policies and other financial services         24             16            20
Other computer software and upgrades                                     25             10            18
Telecommunication services                                               18             11            15
Computer hardware                                                        19                 6         13
e-learning material                                                       7                 5          6
Medicine                                                                  5                 6          6
Other                                                                     5                 4          5
Base: UK adults who had bought or ordered online in last twelve months


Table 11: Purchases downloaded or accessed from websites rather than
delivered by post, by sex, 2010
                                                                         Men       Women           All
Per cent
Films, music                                                             41             35         38
(Electronic) books, magazines, newspapers, e-learning material           30             18         24
Base: UK adults who had bought or ordered such products online in the last twelve months


Table 12: Purchases downloaded or accessed from websites rather than delivered by post,
by age group, 2010
                                                                     16-24         25-44        45-54       55-64   65+   All
Per cent
Films, music                                                             48            38        35          29     20    38
(Electronic) books, magazines, newspapers, e-learning material           31            26        22          17     15    24
Base: UK adults who had bought or ordered such products online in last twelve months
Statistical Bulletin: Internet Access 2010 | Page 16


Table 13: Internet security concerns, 2010
                                                                                                   Strongly       Mildly   Not at all
Per cent
Catching a virus or other computer infection (worm or trojan horse) resulting in                       45          40         14
loss of information or time
Unsolicited emails sent to me ('spam')                                                                 38          39         23
Abuse of personal information sent on the Internet and/or other privacy violations                     60          27         13
(abuse of pictures, personal data uploaded on community websites)
Financial loss as a result of receiving fraudulent messages ('phishing') or getting                    59          24         16
redirected to fake websites asking for personal information ('pharming')
Financial loss due to fraudulent payment (credit or debit) card used                                   64          23         12
Children accessing inappropriate websites or connecting with potentially                               59          15         25
dangerous persons from a computer within the household
Base: UK adults who accessed the Internet in the last twelve months


Table 14: Internet security experiences, 2010
                                                                                                                              All
Per cent
Catching a virus or other computer infection (worm or trojan horse) resulting in loss of information or time                  31
Unsolicited emails sent to me ('spam')                                                                                        54
Abuse of personal information sent on the Internet and/or other privacy violations (abuse of pictures, personal data           4
uploaded on community websites)
Financial loss as a result of receiving fraudulent messages ('phishing') or getting redirected to fake websites                3
asking for personal information ('pharming')
Financial loss due to fraudulent payment (credit or debit) card used                                                           5
Children accessing inappropriate websites or connecting with potentially                                                       2
dangerous persons from a computer within the household
None of the above                                                                                                             35
Base: UK adults who accessed the Internet in the last twelve months


Table 15: Internet activities prevented by security concerns, 2010
                                                                                                                  All
Per cent
Ordering or buying goods or services for private use                                                              17
Carrying out banking activities such as account management                                                        19
Providing personal information to online communities for social and professional networking                       21
Communicating with public services or administrations                                                              4
Downloading software, music, video files, games or other data files                                               14
Using the Internet with mobile device (eg laptop) via a wireless connection from places other than home            7
None of these                                                                                                     59
Base: UK adults who accessed the Internet in the last twelve months
Statistical Bulletin: Internet Access 2010 | Page 17


Table 16: Types of security software or tools used, 2010
                                                                               All
Per cent
Virus checking program and/or anti-spyware program                             85
Hardware or software firewall                                                  63
Email filtering to prevent 'spam'                                              45
Parental control or web filtering software                                     16
Other                                                                              2
A package but components not known                                             12
Base: UK adults who used security software in the last twelve months


Table 17: Frequency of updating security software or tools, 2010
                                                                               All
Per cent
Every time a new update is available (automatically or manually)               76
Occasionally, when remembered                                                  16
Do not update                                                                      7
Base: UK adults who used security software in the last twelve months


Table 18: Reasons for not updating security software or tools, 2010
                                                                               All
Per cent
Don't know how to update                                                       33
Believed unnecessary as risk too low                                           12
Too expensive                                                                      9
Update ineffective                                                                 6
Base: UK adult Internet users who did not update security products in last twelve months


Table 19: Household Internet access, 2006 to 2010
                                               Number of
                                              Households               Percentage change
     Year               Per cent               (millions)               on previous year
     2006                  57                     14.3                         -
     2007                  61                     15.2                         7
     2008                  65                     16.5                         8
     2009                  70                     18.3                        11
     2010                  73                     19.2                         5
Base: UK households
Statistical Bulletin: Internet Access 2010 | Page 18


Table 20: Households with Internet access by country
and region, 2008 to 2010
                                                   Internet access
                                          2008          2009         2010
Per cent
London                                        73         80          83
South East                                    74         75          79
East of England                               70         77          77
East Midlands                                 61         67          75
West Midlands                                 61         67          73
North West                                    56         67          71
South West                                    67         72          70
Yorkshire and The Humber                      62         64          69
North East                                    54         66          59


England                                       66         71          74
Wales                                         67         68          74
Scotland                                      61         62          64


UK                                            65         70           73
Base: UK Households


Table 21: Reason for the household not having
Internet, 2010
                                                               Per cent
Don’t need the Internet                                            39
Lack of skills                                                     21
Don’t want the Internet                                            20
Equipment costs too high                                           18
Access costs too high                                              15
Have access to Internet elsewhere                                    8
Privacy or security concerns                                         4
Physical disability                                                  2
Base: UK households without Internet access

UK Online Statistics for 2010

  • 1.
    Internet Access 2010 Householdsand Individuals Date: 27 August 2010 Coverage: United Kingdom Theme: Social & Welfare The 2010 Internet Access survey of households and individuals measures home access to the Internet and individuals’ use of the Internet across the UK. The key findings from the survey show that:  30.1 million adults used the Internet every day or nearly every day, almost double the Adults using the Internet every day millions estimate in 2006 35  9.2 million adults had never used the 30 Internet 25 20  31 per cent of Internet users connected via 15 a mobile phone, up from 23 per cent in 2009 10  17.4 million adults used the Internet to 5 watch television or listen to the radio, an 0 increase from 6.4 million in 2006 2006 2007 2008 2009 2010  73 per cent of households had Internet access  31 million people bought or ordered goods or services online in the last 12 months Frequency of Internet access by UK adults aged 16 or over Every day Weekly Monthly or less Never adults adults adults adults Year per cent (millions) per cent (millions) per cent (millions) per cent (millions) 2006 35 16.5 16 7.6 13 6.2 35 16.7 2007 45 21.2 16 7.6 12 5.8 27 13.0 2008 49 23.5 16 7.4 11 5.2 25 11.8 2009 55 27.3 15 7.5 9 4.3 21 10.2 2010 60 30.1 13 6.5 8 4.0 18 9.2 Source: ONS Opinions survey
  • 2.
    Statistical Bulletin: InternetAccess 2010 | Page 2 Introduction (tables 1 - 4) In 2010, there were 38.3 million Internet users in the UK, that is, individuals who used the Internet in the three months prior to being interviewed for the survey. This represented 77 per cent of the UK adult population. Of those, 30.1 million accessed the Internet every day or almost every day, equating to 60 per cent of all adults. Over 9 million adults had never used the Internet, at 18 per cent, down from 10.2 million in 2009. The number of people who used a mobile device (for example, a laptop, mobile phone, or palmtop) to access the Internet wirelessly, away from the home or workplace, increased in 2010 with 45 Adults using a m obile phone to access the Internet per cent of Internet users connecting this way, millions up from 40 per cent in 2009. 14 12 The mobile phone was the most popular device 10 used to access the Internet wirelessly, away 8 from the home or workplace, with just under a third (31 per cent) of Internet users connecting 6 this way. The adoption of mobile phone 4 technology is being led by 16 to 24-year-old 2 Internet users, with 44 per cent using a mobile 0 phone to access the Internet. 2007 2008 2009 2010 The use of wi-fi hotspots continued to expand, with 2.7 million people (7 per cent of Internet users) using wireless hotspots at locations such as cafes, restaurants, and hotels. This increased from 0.7 million in 2007. Internet users and non-users (table 5) Internet use is closely linked with a number of socio-economic and demographic indicators: Adults use of the Internet, 2010 Age – The majority (60 per cent) of those aged Per cent 100 65 and over had never used the Internet. This compared with 22 per cent of those aged 80 between 55 and 64 and just 1 per cent of 16 to 60 24 year olds. Adults aged 65 and over made up almost two-thirds (64 per cent) of those 40 individuals who had never accessed the 20 Internet. 0 Location – London was the region with the 16-24 25-44 45-54 55-64 65+ Age group highest rate of Internet use, at 87 per cent of last 3 months over 3 months never adults. The lowest was the North East, at 71 per cent.
  • 3.
    Statistical Bulletin: InternetAccess 2010 | Page 3 Marital status – 92 per cent of single adults had used the Internet. This compared with 81 per cent of married adults and just 32 per cent of widowed adults. Occupation – 91 per cent of those employed in managerial or professional occupations stated that they had used the Internet. This compared with just 67 per cent of those employed in semi-routine and routine occupations. Health – Of those individuals who indicated they had an illness or disability which limited their activities, 39 per cent had never used the Internet. This compared with 14 per cent of adults who either had no illness or disability, or were not limited by any illness or disability. Qualifications – 97 per cent of adults who were educated to degree level or higher had used the Internet. Adults without any formal qualifications were less likely to have used the Internet, at 45 per cent. Income – Gross income is a significant indicator of Internet use. Of those individuals who had an income over £41,600, 98 per cent had used the Internet. The rate of Internet use then decreased in line with income: 69 per cent of adults with an income of less than £10,399 had used the Internet. Internet activities (tables 6 & 7) Just over 17 million adults used the Internet to Adults w atching w eb TV or listening to w eb watch television or listen to the radio in 2010. radio millions Many of these used on-demand services 20 provided by established television networks over 18 Internet web platforms. Over half (52 per cent) of 16 male users used this online facility, compared 14 with just 39 per cent of women. Almost a quarter 12 of Internet users (23 per cent) made telephone 10 8 calls over the Internet in 2010. 6 4 Social networking again proved popular, with 43 2 per cent of Internet users posting messages to 0 social networking sites, chat sites, or using 2006 2007 2008 2009 2010 instant messaging or blogs. Uploading self- created content such as photos, videos or music to a website was also a popular activity with 38 per cent of Internet users doing this. Social networking activities proved to be most popular among 16 to 24-year-olds with 75 per cent posting messages, while 50 per cent of this age group uploaded self-created content. However, social networking is not limited to young adults, with 31 per cent of Internet users aged 45 to 54 having used the Internet to post messages, while 28 per cent uploaded content. Internet banking continued to be one of the most popular online activities for UK adults, with 54 per cent of Internet users using online banking facilities. This represented 42 per cent of all UK adults. This proved to be most popular among the 25 to 44-year-old age group, with 63 per cent of Internet users in this age group banking online.
  • 4.
    Statistical Bulletin: InternetAccess 2010 | Page 4 As in previous years, the use of email was the most popular online activity for Internet users, at 90 per cent. This activity was popular across all age groups, with 88 per cent of 16 to 24-year-olds using email compared with 87 per cent of those aged 65 and over. Nearly a fifth (19 per cent) of Internet users aged 25 to 44 used the Internet to gamble or play lotto online in 2010. Of all Internet users, 14 per cent stated they had gambled over the Internet in 2010. Purchasing (tables 8 - 12) In the 12 months prior to interview, 31 million adults bought or ordered goods or services online. These Internet shoppers represented 62 per cent of all adults. In 2010 the most popular products bought online were clothes and sporting goods, with 52 per cent of Internet shoppers buying these products. While this was the most popular purchase for women, at 57 per cent, the most popular purchase for men was films and music, at 48 per cent. Downloading increased in popularity for adults who bought products such as music, films or reading material online. Of those who bought films or music, 38 per cent downloaded the product rather than getting it delivered. Of those who purchased books, magazines or newspapers online, 24 per cent downloaded the product. Security (tables 13 - 18) The survey shows that there were serious concerns about Internet security among UK Internet users. The majority of Internet users (87 per cent) were concerned about financial loss due to fraudulent use of credit or debit cards, while 5 per cent of Internet users said they had experienced this security problem. While Internet security is a concern for the majority of Internet users, 7 per cent said they did not use any kind of Internet security software or tool to protect their computer or data. Of those who said they used IT security software, 7 per cent said they did not update their security products. The main reason given for this was that they didn’t know how to. Household Internet access (tables 19 - 21) In 2010, 19.2 million households had an Internet connection. This represented 73 per cent of households and an increase of 0.9 million since 2009. Since 2006 an extra 5 million households connected to the Internet. London was once again the region with the highest level of household Internet connections at 83 per cent. The North East had the lowest proportion of households with an Internet connection, at 59 per cent. There were 7 million households without Internet access in 2010. When adults were asked why their household did not have an Internet connection, the most common response was that they didn’t need it, at 39 per cent, followed by 21 per cent who said a lack of skills prevented them from
  • 5.
    Statistical Bulletin: InternetAccess 2010 | Page 5 having the Internet. Equipment costs being too high was the reason given by 18 per cent of adults as to why their household had no Internet connection. The housing tenure of a household was a factor in the likelihood of there being an Internet connection in the home. Of those households where the home was being purchased with a mortgage or loan, 94 per cent had an Internet connection, compared with 63 per cent that were rented, and 62 per cent where the home was owned outright. Where the person completing the survey was under 50, the survey found that the number of children in a household had little effect on the likelihood of the household having Internet access. Of the households where there were no dependent children, 84 per cent had Internet access compared with 92 per cent of households with one or more dependent children.
  • 6.
    Statistical Bulletin: InternetAccess 2010 | Page 6 Background Notes BASIC QUALITY INFORMATION 1. Key issues specific to this release This statistical bulletin shows information about both households with home access to the Internet and about individuals’ use of the Internet. The source of this information is the National Statistics Opinions (Omnibus) Survey. Responses were collected in January, February, March and April 2010. This is the fifth annual release of these estimates, which replaced the more frequent results produced from smaller samples. The National Statistics Opinions Survey is a multi-purpose survey developed by the Office for National Statistics (ONS) for use by government departments, other public bodies, charities and academics. It provides a fast, cost effective and reliable way of obtaining information on topics too brief to warrant their own survey. The Opinions Survey is carried out each month on a random sample of about 1,800 adults, aged 16 and over, living in private households throughout Great Britain. Northern Ireland has not been sampled since the 2008 survey, but has been included in the survey estimation for both the 2009 and 2010 UK results. After accounting for refusals and where no contact can be made, approximately 1,200 interviews are conducted each month. For general information on the National Statistics Opinions Survey, contact 01633 455810, Opinions@ons.gov.uk Before the annual publication began in 2006, Internet access data for households and individuals were published periodically on the ONS website at: http://www.statistics.gov.uk/statbase/Product.asp?vlnk=5672.These estimates related to Great Britain only as Northern Ireland was not covered by the Internet Access survey prior to 2006. 2. Common pitfalls in interpreting series The statistics presented here should not be confused with the e-commerce statistical series that contains information about the use made of the Internet and other information and communication technologies (ICTs) by businesses. 3. Relevance to users In this release, Internet access estimates relate to households, while Internet usage estimates relate to individuals, or adults, who are defined as being aged 16 or over. References to 2010 in this release mean data collected between January and April 2010. An Internet user is defined as an adult who accessed the Internet in the three months prior to being interviewed. 4. Accuracy Revisions to earlier years Previously published statistics in this series have not been revised.
  • 7.
    Statistical Bulletin: InternetAccess 2010 | Page 7 5. Sampling variability The National Statistics Opinions survey is carried out by interviewing a nationally representative sample of households in Great Britain. About 1,800 households are sampled each month and estimates are subject to sampling variability, as are those from all sample surveys. The estimates in the survey relate to the whole of the UK. As in previous years, the Isles of Scilly and the Scottish Highlands (North of the Caledonian Canal) and Islands were not sampled. However, Northern Ireland has not been sampled since the 2008 survey, but has been included in the estimation for both the 2009 and 2010 UK results. No estimates relating to Northern Ireland specifically are available for the 2010 survey. The following tables show sampling variabilities for estimates relating to frequency of use of the Internet, and household Internet connections. These sampling variability ranges represent ‘95 per cent confidence intervals’ which means that it is expected that in 95 per cent of samples the range would contain the true value. When adults last used the Internet: 95 per cent confidence intervals, 2010 Lower limit Survey estimate Upper limit Per cent Daily 58 60 62 Weekly 12 13 14 Monthly or less 7 8 9 Never 17 18 79 Within the last three months 75 77 79 Households with Internet Access, by country and region: 95 per cent confidence intervals, 2010 Lower limit Survey estimate Upper limit Per cent London 79 83 88 South East 75 79 83 East of England 72 77 82 East Midlands 70 75 81 West Midlands 68 73 79 North West 66 71 75 South West 64 70 75 Yorkshire & the Humber 64 69 75 North East 51 59 68 England 73 74 76 Wales 67 74 81 Scotland 58 64 69 UK 72 73 75
  • 8.
    Statistical Bulletin: InternetAccess 2010 | Page 8 6. Response rates The voluntary nature of the survey means that people who do not wish to take part in the survey can refuse to do so. The sample is designed to ensure that the results of the survey represent the population. The risk of the survey not being representative is likely to increase with every refusal or non-contact with a sampled household (survey non-response). One measure of the quality of survey results is therefore the response rate. A response means a household that has answered all applicable questions. A refusal is a household which refuses to respond to the survey. A non-contact arises when an address is occupied but where it has not been possible to contact any member of the household in the collection period. Response rate, 2010 Response Refusal Non contact per cent 59 31 10 7. Calibration Weights are used in the analysis of the Opinions Survey data, for both households and for individuals. These weights are derived by calibration, using population estimates for age group by sex and region. The weights are used to improve the accuracy of results by compensating for different response rates for different groups and by reducing the random variation in estimates. For the household analysis, the weights are influenced by the characteristics of all the members of the household. As the responses are weighted to population estimates, weighted totals of individuals by age group, sex and region from the survey are guaranteed to match the fixed population estimates. However, the weighting does not include control totals for the total number of households. Therefore the total number of households arrived at, by summing across the categories shown in the tables, is a survey estimate and subject to random variation. Over time, this estimate will fluctuate around the true number of households in the population, but is not guaranteed to exactly match the true value (or estimates from other sources), nor show the same year-on-year change. 8. Coherence ONS’s annual e-commerce survey provides information on business’ use of the Internet and other ICTs. Further information is available at www.statistics.gov.uk/statbase/Product.asp?vlnk=6645 9. Rounding Percentages may not sum to 100 or agree with related totals, due to independently rounded components. 10. Publication policy Details of the policy governing the release of new data are available from the Media Relations Office.
  • 9.
    Statistical Bulletin: InternetAccess 2010 | Page 9 11. National Statistics are produced to high professional standards set out in the Code of Practice for Official Statistics. They undergo regular quality assurance reviews to ensure that they meet customer needs They are produced free from any political interference. © Crown copyright 2010. Next publication: Friday 26 August 2011 Issued by: Office for National Statistics, Government Buildings, Cardiff Road, Newport NP10 8XG Media contact: Tel Media Relations Office 0845 6041858 Emergency on-call 07867 906553 E-mail press.office@ons.gsi.gov.uk Statistical contact: Tel Mark Williams 01633 456728 E-mail esociety@ons.gov.uk Website: www.ons.gov.uk
  • 10.
    Statistical Bulletin: InternetAccess 2010 | Page 10 Table 1: When adults last used the Internet, by sex and age group, 2008 to 2010 Within the last 3 months More than 3 months Never used it 2008 2009 2010 2008 2009 2010 2008 2009 2010 Per cent Men 75 80 79 4 3 5 20 17 16 Women 66 72 75 5 4 4 29 24 21 All 71 76 77 5 4 4 25 21 18 Age groups 16-24 93 96 97 5 3 2 1 3 1 25-44 87 92 93 5 3 3 8 5 4 45-54 78 81 84 4 3 4 17 16 11 55-64 63 72 72 4 4 6 33 24 22 65+ 26 30 32 5 5 7 70 64 60 Base: UK adults Table 2: Frequency of use of the Internet, by sex and age group, 2008 to 2010 Every day At least once a week Once a month or almost every day (but not every day) or less 2008 2009 2010 2008 2009 2010 2008 2009 2010 Per cent Men 73 75 81 20 19 16 7 6 4 Women 66 71 76 24 22 18 11 8 5 All 69 73 78 22 20 17 9 7 5 Age groups 16-24 77 86 82 19 12 15 4 1 3 25-44 72 75 81 19 20 16 8 5 3 45-54 65 71 80 27 20 15 8 9 5 55-64 64 65 74 25 24 19 11 11 7 65+ 54 52 59 27 32 28 19 16 13 Base: UK adults who accessed the Internet in the last three months
  • 11.
    Statistical Bulletin: InternetAccess 2010 | Page 11 Table 3: Where adults have accessed the Internet, 2008 to 2010 2008 2009 2010 Per cent Home 90 94 95 Place of work (other than home) 44 43 41 Another person's home 20 28 17 Place of education 14 15 13 Hotspot (wi-fi) 5 6 7 Public library 4 5 4 Internet cafe 5 6 3 Base: UK adults who accessed the Internet in the last three months ………………………………………………………………………………… Table 4: Mobile devices used to access the Internet away from home/work, by sex, 2009 and 2010 Men Women All 2009 2010 2009 2010 2009 2010 Per cent Mobile phone 29 37 18 25 23 31 Handheld computer (palmtop, PDA) 7 5 2 2 5 4 Portable computer (laptop) 29 30 23 22 26 26 None of the above 54 48 66 60 60 54 Base: UK adults who accessed the Internet in the last three months
  • 12.
    Statistical Bulletin: InternetAccess 2010 | Page 12 Table 5: Internet users and non-users, 2010 Internet use Ever used Never used Per cent Age 16-24 99 1 25-44 96 4 45-54 89 11 55-64 78 22 65+ 40 60 Sex Male 84 16 Female 79 21 Marital status Single 92 8 Married 81 19 Widowed 32 68 Divorced 75 25 Occupation Managerial and professional 91 9 Intermediate 84 16 Small employers and own account workers 80 20 Lower supervisory & technical 77 23 Semi-routine and routine 67 33 Gross Income <£10,399 69 31 £10,400 - £20,799 83 17 £20,800 - £31,199 95 5 £31,200 - £41,599 95 5 £41,600> 98 2 Qualifications Degree 97 2 A-Level or Highers 96 4 ONC / BTEC 92 8 O-Level or GCSE (A-C) 90 10 GCSE (D-G) 93 7 Other qualification (foreign qualification 74 26 below degree) No formal qualifications 45 55 Location North East 71 29 North West 83 17 Yorkshire and the Humber 79 21 East Midlands 83 17 West Midlands 80 20 East of England 83 17 London 87 13 South East 82 18 South West 81 19 Wales 81 19 Scotland 78 22 Base: UK Adults
  • 13.
    Statistical Bulletin: InternetAccess 2010 | Page 13 Table 6: Internet activities by age group, 2010 16-24 25-44 45-54 55-64 65+ All Per cent Sending/receiving emails 88 90 89 91 87 90 Finding information about goods and services 64 76 80 83 72 75 Using services related to travel and accommodation 50 64 70 72 62 63 Internet banking 45 63 54 53 34 54 Reading or downloading online news, newspapers or magazines 52 53 51 47 40 51 Listening to web radio or watching web television 59 47 45 34 24 45 Posting messages to chat sites, social networking sites, blogs 75 49 31 19 8 43 Playing or downloading games, images, films or music 61 43 32 24 17 40 Seeking health related information 27 42 39 44 36 39 Uploading self created content to any website to be shared 50 43 28 29 22 38 Consulting the Internet with the purpose of learning 47 34 34 30 27 35 Looking for information about education, training or courses 47 36 27 19 7 32 Downloading software (other than games software) 35 34 23 27 18 30 Looking for a job or sending a job application 38 32 23 11 1 26 Telephoning or making video calls (via webcam) over the Internet 30 25 22 17 15 23 Selling goods or services over the Internet 16 28 20 18 9 21 Donating to charities online 10 13 15 13 7 12 Doing an online course 11 8 7 5 3 8 Base: UK adults who accessed the Internet in the last three months Table 7: Internet activities by sex, 2010 Men Women All Per cent Sending/receiving emails 90 89 90 Finding information about goods and service 77 73 75 Using services related to travel and accommodation 64 63 63 Internet banking 57 51 54 Reading or downloading online news, newspapers or magazines 56 46 51 Listening to web radio or watching web television 52 39 45 Posting messages to chat sites, social networking sites, blogs 44 42 43 Playing or downloading games, images, films or music 45 34 40 Seeking health related information 34 44 39 Uploading self created content to any website to be shared 36 40 38 Consulting the Internet with the purpose of learning 39 31 35 Looking for information about education, training or courses 30 33 32 Downloading software (other than games software) 41 19 30 Looking for a job or sending a job application 28 24 26 Telephoning or making video calls (via webcam) over the Internet 27 20 23 Selling goods or services over the Internet 25 17 21 Donating to charities online 12 12 12 Doing an online course 8 8 8 Base: UK adults who accessed the Internet in the last three months
  • 14.
    Statistical Bulletin: InternetAccess 2010 | Page 14 Table 8: Adults who purchased over the Internet in the last 12 months, by sex and age 2008 2009 2010 Per cent Men 57 66 64 Women 49 56 60 All 53 61 62 Age group 16-24 64 78 74 25-44 70 78 79 45-54 58 65 70 55-64 44 52 58 65+ 15 20 22 Base: UK Adults Table 9: Purchases over the Internet, by age group, 2010 16-24 25-44 45-54 55-64 65+ All Per cent Clothes, sports goods 58 45 46 43 38 52 Films, music 50 50 33 27 25 47 Holiday accommodation (eg hotels) 46 53 54 47 44 44 Household goods (eg furniture, toys) 52 41 46 39 37 43 Books, magazines, newspapers (including e-books) 40 43 39 41 40 39 Other travel arrangements (eg transport tickets, car hire) 36 42 48 35 32 36 Tickets for events 37 40 34 21 19 35 Electronic equipment (including cameras) 31 24 22 14 15 25 Food or groceries 32 25 16 17 17 24 Video games software and upgrades 30 20 9 8 8 23 Share purchases, insurance policies and other financial services 24 23 18 13 11 20 Other computer software and upgrades 18 17 23 22 20 18 Telecommunication services 17 14 16 13 13 15 Computer hardware 13 15 14 11 10 13 e-learning material 8 5 2 2 2 6 Medicine 6 6 9 12 10 6 Other 4 6 7 5 5 5 Base: UK adults who had bought or ordered online in the last twelve months
  • 15.
    Statistical Bulletin: InternetAccess 2010 | Page 15 Table 10: Purchases over the Internet, by sex, 2010 Men Women All Per cent Clothes, sports goods 46 57 52 Films, music 48 46 47 Holiday accommodation (eg hotels) 45 44 44 Household goods (eg furniture, toys) 41 45 43 Books, magazines, newspapers (including e-books) 39 40 39 Other travel arrangements (eg transport tickets, car hire) 37 35 36 Tickets for events 35 35 35 Electronic equipment (including cameras) 33 18 25 Food or groceries 20 28 24 Video games software and upgrades 29 18 23 Share purchases, insurance policies and other financial services 24 16 20 Other computer software and upgrades 25 10 18 Telecommunication services 18 11 15 Computer hardware 19 6 13 e-learning material 7 5 6 Medicine 5 6 6 Other 5 4 5 Base: UK adults who had bought or ordered online in last twelve months Table 11: Purchases downloaded or accessed from websites rather than delivered by post, by sex, 2010 Men Women All Per cent Films, music 41 35 38 (Electronic) books, magazines, newspapers, e-learning material 30 18 24 Base: UK adults who had bought or ordered such products online in the last twelve months Table 12: Purchases downloaded or accessed from websites rather than delivered by post, by age group, 2010 16-24 25-44 45-54 55-64 65+ All Per cent Films, music 48 38 35 29 20 38 (Electronic) books, magazines, newspapers, e-learning material 31 26 22 17 15 24 Base: UK adults who had bought or ordered such products online in last twelve months
  • 16.
    Statistical Bulletin: InternetAccess 2010 | Page 16 Table 13: Internet security concerns, 2010 Strongly Mildly Not at all Per cent Catching a virus or other computer infection (worm or trojan horse) resulting in 45 40 14 loss of information or time Unsolicited emails sent to me ('spam') 38 39 23 Abuse of personal information sent on the Internet and/or other privacy violations 60 27 13 (abuse of pictures, personal data uploaded on community websites) Financial loss as a result of receiving fraudulent messages ('phishing') or getting 59 24 16 redirected to fake websites asking for personal information ('pharming') Financial loss due to fraudulent payment (credit or debit) card used 64 23 12 Children accessing inappropriate websites or connecting with potentially 59 15 25 dangerous persons from a computer within the household Base: UK adults who accessed the Internet in the last twelve months Table 14: Internet security experiences, 2010 All Per cent Catching a virus or other computer infection (worm or trojan horse) resulting in loss of information or time 31 Unsolicited emails sent to me ('spam') 54 Abuse of personal information sent on the Internet and/or other privacy violations (abuse of pictures, personal data 4 uploaded on community websites) Financial loss as a result of receiving fraudulent messages ('phishing') or getting redirected to fake websites 3 asking for personal information ('pharming') Financial loss due to fraudulent payment (credit or debit) card used 5 Children accessing inappropriate websites or connecting with potentially 2 dangerous persons from a computer within the household None of the above 35 Base: UK adults who accessed the Internet in the last twelve months Table 15: Internet activities prevented by security concerns, 2010 All Per cent Ordering or buying goods or services for private use 17 Carrying out banking activities such as account management 19 Providing personal information to online communities for social and professional networking 21 Communicating with public services or administrations 4 Downloading software, music, video files, games or other data files 14 Using the Internet with mobile device (eg laptop) via a wireless connection from places other than home 7 None of these 59 Base: UK adults who accessed the Internet in the last twelve months
  • 17.
    Statistical Bulletin: InternetAccess 2010 | Page 17 Table 16: Types of security software or tools used, 2010 All Per cent Virus checking program and/or anti-spyware program 85 Hardware or software firewall 63 Email filtering to prevent 'spam' 45 Parental control or web filtering software 16 Other 2 A package but components not known 12 Base: UK adults who used security software in the last twelve months Table 17: Frequency of updating security software or tools, 2010 All Per cent Every time a new update is available (automatically or manually) 76 Occasionally, when remembered 16 Do not update 7 Base: UK adults who used security software in the last twelve months Table 18: Reasons for not updating security software or tools, 2010 All Per cent Don't know how to update 33 Believed unnecessary as risk too low 12 Too expensive 9 Update ineffective 6 Base: UK adult Internet users who did not update security products in last twelve months Table 19: Household Internet access, 2006 to 2010 Number of Households Percentage change Year Per cent (millions) on previous year 2006 57 14.3 - 2007 61 15.2 7 2008 65 16.5 8 2009 70 18.3 11 2010 73 19.2 5 Base: UK households
  • 18.
    Statistical Bulletin: InternetAccess 2010 | Page 18 Table 20: Households with Internet access by country and region, 2008 to 2010 Internet access 2008 2009 2010 Per cent London 73 80 83 South East 74 75 79 East of England 70 77 77 East Midlands 61 67 75 West Midlands 61 67 73 North West 56 67 71 South West 67 72 70 Yorkshire and The Humber 62 64 69 North East 54 66 59 England 66 71 74 Wales 67 68 74 Scotland 61 62 64 UK 65 70 73 Base: UK Households Table 21: Reason for the household not having Internet, 2010 Per cent Don’t need the Internet 39 Lack of skills 21 Don’t want the Internet 20 Equipment costs too high 18 Access costs too high 15 Have access to Internet elsewhere 8 Privacy or security concerns 4 Physical disability 2 Base: UK households without Internet access