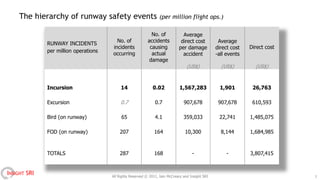
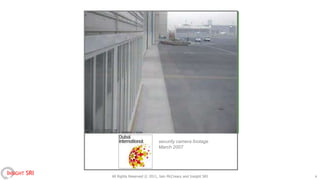
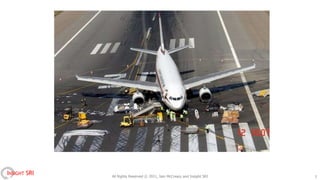
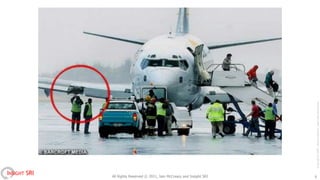
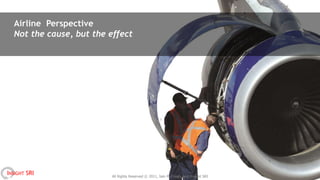
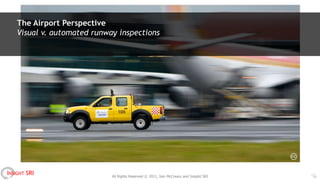
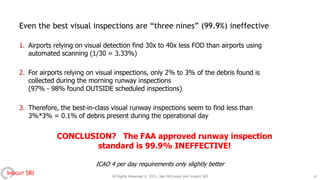
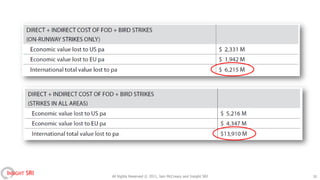
i n s i g h t   s t r a t e g y          r e s e a r c h              i m a g i n a t i on


              United States
              No 560, 2020 Pennsylvania Ave NW Washington, DC, 20006
              iain@insightsri.com +1 520 205 1045 www.insightsri.com


                                                                       Runway Safety:
                                                                       The surprising dominance of FOD and bird strikes
                                                                       Iain McCreary
INSIGHT SRI


                                                                       12 September 2011

                                                                       SWIFT Conference
                                                                       Montreal, CANADA


INSIGHT SRI                                                                              All Rights Reserved © 2011, Iain McCreary and Insight SRI                  1
Why me?


 available online www.runway-safety.com
 US $1,200; PDF


INSIGHT SRI                         All Rights Reserved © 2011, Iain McCreary and Insight SRI   2
The hierarchy of runway safety events                          (per million flight ops.)

                                                              No. of            Average
                                         No. of             accidents          direct cost          Average
              RUNWAY INCIDENTS
                                       incidents             causing          per damage           direct cost   Direct cost
              per million operations
                                       occurring              actual            accident           -all events
                                                             damage
                                                                                   (US$)             (US$)         (US$)


              Incursion                     14                 0.02            1,567,283             1,901        26,763

              Excursion                     0.7                 0.7              907,678            907,678       610,593

              Bird (on runway)              65                  4.1              359,033            22,741       1,485,075

              FOD (on runway)              207                  164               10,300             8,144       1,684,985


              TOTALS                       287                  168                   -                 -        3,807,415


INSIGHT SRI                            All Rights Reserved © 2011, Iain McCreary and Insight SRI                               3
security camera footage
                                         March 2007


INSIGHT SRI   All Rights Reserved © 2011, Iain McCreary and Insight SRI   4
INSIGHT SRI   All Rights Reserved © 2011, Iain McCreary and Insight SRI   5
Copyright © 2007, Barcroft Media. Used with permission
INSIGHT SRI   All Rights Reserved © 2011, Iain McCreary and Insight SRI   6
Airline Perspective
  Not the cause, but the effect


INSIGHT SRI              All Rights Reserved © 2011, Iain McCreary and Insight SRI   7
Image courtesy of Dr. Ing. T. Valenta, ETN Aviation
INSIGHT SRI   All Rights Reserved © 2011, Iain McCreary and Insight SRI               8
courtesy of Rolls Royce, used with permission, ©2010 Rolls-Royce PLC
INSIGHT SRI   All Rights Reserved © 2011, Iain McCreary and Insight SRI      9
Despite what their own numbers and reporting tell them,
       airlines have a hard time believing that FOD and bird strikes are worth as much as a merger


INSIGHT SRI                         All Rights Reserved © 2011, Iain McCreary and Insight SRI        10
The Airport Perspective
    Visual v. automated runway inspections


INSIGHT SRI                  All Rights Reserved © 2011, Iain McCreary and Insight SRI   11
A typical runway inspection
                   Feb 2008, LAX 25R


                                Source: http://www.youtube.com/watch?v=dFFr50wWKOY


INSIGHT SRI     All Rights Reserved © 2011, Iain McCreary and Insight SRI            12
The „rules of thumb‟ for FOD...


                 Visual/manual FOD inspections at Large Airports


                 Rule :     1 pcs of FOD on the runway every 2 months


INSIGHT SRI                    All Rights Reserved © 2011, Iain McCreary and Insight SRI   13
FOD collected at Atlanta, airport wide (2008-09)
    (this pattern is typical for most large airports)


INSIGHT SRI                   All Rights Reserved © 2011, Iain McCreary and Insight SRI   14
FOD collected at Atlanta plus 3 other US airports, airport wide
    (this pattern is typical for most large airports)


INSIGHT SRI                   All Rights Reserved © 2011, Iain McCreary and Insight SRI   15
FOD retrieval by time of day at ATL, runway only (2008-09)

                                        Scheduled daily
                                        inspections                                Majority of FOD
                                                                                   collected


INSIGHT SRI                  All Rights Reserved © 2011, Iain McCreary and Insight SRI               16
YVR – Operational FOD finds for the North runway
    (n.b. This is a map! NOT a chart)


              latitude


                                                       longitude


INSIGHT SRI                 All Rights Reserved © 2011, Iain McCreary and Insight SRI   17
The „rules of thumb‟ for FOD...


                 Visual/manual FOD inspections at Large Airports


                 Rule :     1 pcs of FOD on the runway every 2 months


                 Automated runway scanning at Large Airports

                 Rule :      1 pc of FOD every 2 days on the runway


INSIGHT SRI                    All Rights Reserved © 2011, Iain McCreary and Insight SRI   18
Even the best visual inspections are “three nines” (99.9%) ineffective

    1. Airports relying on visual detection find 30x to 40x less FOD than airports using
       automated scanning (1/30 = 3.33%)

    2. For airports relying on visual inspections, only 2% to 3% of the debris found is
       collected during the morning runway inspections
       (97% - 98% found OUTSIDE scheduled inspections)

    3. Therefore, the best-in-class visual runway inspections seem to find less than
       3%*3% = 0.1% of debris present during the operational day


                 CONCLUSION? The FAA approved runway inspection
                         standard is 99.9% INEFFECTIVE!

                              ICAO 4 per day requirements only slightly better
INSIGHT SRI                         All Rights Reserved © 2011, Iain McCreary and Insight SRI   19
INSIGHT SRI   All Rights Reserved © 2011, Iain McCreary and Insight SRI   20
Iain McCreary
        Runway Safety: FOD, Birds, and the                                                   Managing Director, Insight SRI
          Case for Automated Scanning
                                                                                                          No 560
                                                                                                 2020 Pennsylvania Ave NW
                                                                                                 Washington DC, 2006 USA
                   for sale online                                                                   +1 520 205 1045
              www.runway-safety.com                                                                 iain@insightsri.com


INSIGHT SRI                          All Rights Reserved © 2011, Iain McCreary and Insight SRI                                21

Runway Safety: the surprising dominance of FOD and bird strikesI Mc C Pres To Swift Sept2011

  • 1.
    i n si g h t s t r a t e g y r e s e a r c h i m a g i n a t i on United States No 560, 2020 Pennsylvania Ave NW Washington, DC, 20006 iain@insightsri.com +1 520 205 1045 www.insightsri.com Runway Safety: The surprising dominance of FOD and bird strikes Iain McCreary INSIGHT SRI 12 September 2011 SWIFT Conference Montreal, CANADA INSIGHT SRI All Rights Reserved © 2011, Iain McCreary and Insight SRI 1
  • 2.
    Why me? availableonline www.runway-safety.com US $1,200; PDF INSIGHT SRI All Rights Reserved © 2011, Iain McCreary and Insight SRI 2
  • 3.
    The hierarchy ofrunway safety events (per million flight ops.) No. of Average No. of accidents direct cost Average RUNWAY INCIDENTS incidents causing per damage direct cost Direct cost per million operations occurring actual accident -all events damage (US$) (US$) (US$) Incursion 14 0.02 1,567,283 1,901 26,763 Excursion 0.7 0.7 907,678 907,678 610,593 Bird (on runway) 65 4.1 359,033 22,741 1,485,075 FOD (on runway) 207 164 10,300 8,144 1,684,985 TOTALS 287 168 - - 3,807,415 INSIGHT SRI All Rights Reserved © 2011, Iain McCreary and Insight SRI 3
  • 4.
    security camera footage March 2007 INSIGHT SRI All Rights Reserved © 2011, Iain McCreary and Insight SRI 4
  • 5.
    INSIGHT SRI All Rights Reserved © 2011, Iain McCreary and Insight SRI 5
  • 6.
    Copyright © 2007,Barcroft Media. Used with permission INSIGHT SRI All Rights Reserved © 2011, Iain McCreary and Insight SRI 6
  • 7.
    Airline Perspective Not the cause, but the effect INSIGHT SRI All Rights Reserved © 2011, Iain McCreary and Insight SRI 7
  • 8.
    Image courtesy ofDr. Ing. T. Valenta, ETN Aviation INSIGHT SRI All Rights Reserved © 2011, Iain McCreary and Insight SRI 8
  • 9.
    courtesy of RollsRoyce, used with permission, ©2010 Rolls-Royce PLC INSIGHT SRI All Rights Reserved © 2011, Iain McCreary and Insight SRI 9
  • 10.
    Despite what theirown numbers and reporting tell them, airlines have a hard time believing that FOD and bird strikes are worth as much as a merger INSIGHT SRI All Rights Reserved © 2011, Iain McCreary and Insight SRI 10
  • 11.
    The Airport Perspective Visual v. automated runway inspections INSIGHT SRI All Rights Reserved © 2011, Iain McCreary and Insight SRI 11
  • 12.
    A typical runwayinspection Feb 2008, LAX 25R Source: http://www.youtube.com/watch?v=dFFr50wWKOY INSIGHT SRI All Rights Reserved © 2011, Iain McCreary and Insight SRI 12
  • 13.
    The „rules ofthumb‟ for FOD... Visual/manual FOD inspections at Large Airports Rule : 1 pcs of FOD on the runway every 2 months INSIGHT SRI All Rights Reserved © 2011, Iain McCreary and Insight SRI 13
  • 14.
    FOD collected atAtlanta, airport wide (2008-09) (this pattern is typical for most large airports) INSIGHT SRI All Rights Reserved © 2011, Iain McCreary and Insight SRI 14
  • 15.
    FOD collected atAtlanta plus 3 other US airports, airport wide (this pattern is typical for most large airports) INSIGHT SRI All Rights Reserved © 2011, Iain McCreary and Insight SRI 15
  • 16.
    FOD retrieval bytime of day at ATL, runway only (2008-09) Scheduled daily inspections Majority of FOD collected INSIGHT SRI All Rights Reserved © 2011, Iain McCreary and Insight SRI 16
  • 17.
    YVR – OperationalFOD finds for the North runway (n.b. This is a map! NOT a chart) latitude longitude INSIGHT SRI All Rights Reserved © 2011, Iain McCreary and Insight SRI 17
  • 18.
    The „rules ofthumb‟ for FOD... Visual/manual FOD inspections at Large Airports Rule : 1 pcs of FOD on the runway every 2 months Automated runway scanning at Large Airports Rule : 1 pc of FOD every 2 days on the runway INSIGHT SRI All Rights Reserved © 2011, Iain McCreary and Insight SRI 18
  • 19.
    Even the bestvisual inspections are “three nines” (99.9%) ineffective 1. Airports relying on visual detection find 30x to 40x less FOD than airports using automated scanning (1/30 = 3.33%) 2. For airports relying on visual inspections, only 2% to 3% of the debris found is collected during the morning runway inspections (97% - 98% found OUTSIDE scheduled inspections) 3. Therefore, the best-in-class visual runway inspections seem to find less than 3%*3% = 0.1% of debris present during the operational day CONCLUSION? The FAA approved runway inspection standard is 99.9% INEFFECTIVE! ICAO 4 per day requirements only slightly better INSIGHT SRI All Rights Reserved © 2011, Iain McCreary and Insight SRI 19
  • 20.
    INSIGHT SRI All Rights Reserved © 2011, Iain McCreary and Insight SRI 20
  • 21.
    Iain McCreary Runway Safety: FOD, Birds, and the Managing Director, Insight SRI Case for Automated Scanning No 560 2020 Pennsylvania Ave NW Washington DC, 2006 USA for sale online +1 520 205 1045 www.runway-safety.com iain@insightsri.com INSIGHT SRI All Rights Reserved © 2011, Iain McCreary and Insight SRI 21

Editor's Notes

  • #2 LAYOUT NOTES FOR IT / PROJECTOR :Sound for video on slide #13 onlyPAGE SIZE: if not letterbox, set to... width 33.87 cm height 19.05 cm orientation landscapeNo transitions/animations
  • #9 Spalling is buckling or cracking of the blade surface, and occurs as part of normal engine wear and tear. Spalling can drive fuel efficiency losses (thrust specific fuel consumption or TSFC reductions) of 1.8% with an accompanying drop in engine gas temperature of 20°C (36°F).
  • #10 The net loss from operating with a high fraction of blended blades is estimated at 0.5%-1.0% depending on engine type, thrust condition, and the stage of damageOver a long flight, this begins to affect fuel predictions, loaded weight, and other flight fundamentals.A 1.5% change to fuel efficiency in one engine can mean an extra 108 gallons consumed, coming to roughly $300 per flightEven if the efficiency losses from a given strike were extraordinarily small at 0.1%, then a typical Boeing 737 operating 3 flightsper day will cost the airline an additional $29K per year per aircraft. At a discount rate of 6% over five years, this incrementalincrease in fuel inefficiency has a present value of $110K. An efficiency loss of a full 1.5% would be ten times that amount,with a present value of almost $1.5 million (for the five years) per aircraft damaged. Yet despite this, FOD driven fuel inefficienciesare rarely discussed.
  • #11 “Runway Safety is about cost” SAY IT WITH ME. “Runway Safety is about cost”And how much money is on the table? Answer: $6Bn paAnd you needn’t even refer to my numbers to get there. This comes from the airline’s own estimates!United: arguably the best and most conscientious airline the world when it comes to reporting bird strikesUS’s own MD ground safety says UA spends 113M pa on FOD and bird strikes...2.3M on blended/replaced blades, 85M on engines pulled. 17.5m on cowl damage, 4.3M in FOD damage to tires (above cycle index contract), aircraft spent 110 days out of service...Reports ~823 bird strikes per year, of which 46% of strikes occur on the ground 93% of the on-ground strikes cause no damage4% cause minor damage3% cause substantial damageUnited’s own published data (A. Orosz) prices a strike at $38K, with indirect costs at 11x direct cost. My numbers (FAA averages ) give a cost of $22K and indirect at 10x.By my value for per strike, UA spends $4.7 to meet the direct cost of the on-runway strikes that the airline itself reports – and a total of $52M once indirect costs are included.... add FOD for United; add birds and FOD for Continental...... the merged airline will spend ~$200M pa.Let’s compare this to fuel price hedging. In 2007 and 2008, UA’s fuel bill was roughly $5Bn pa, and they saved $83M and $110M respectively through hedging. Southwest has done quite a bit better, saving an average of almost $300M pa in their hedge positions. But whether the value for any particular airline is higher or lower, one thing is clear. FOD and bird strikes are the largest financial opportunity for the aviation industry outside of fuel price hedging! Yet, no one is taking action. This lack of action is almost, quite literally criminal.
  • #15 63% of FOD collected between 1600 and 2000 hrs