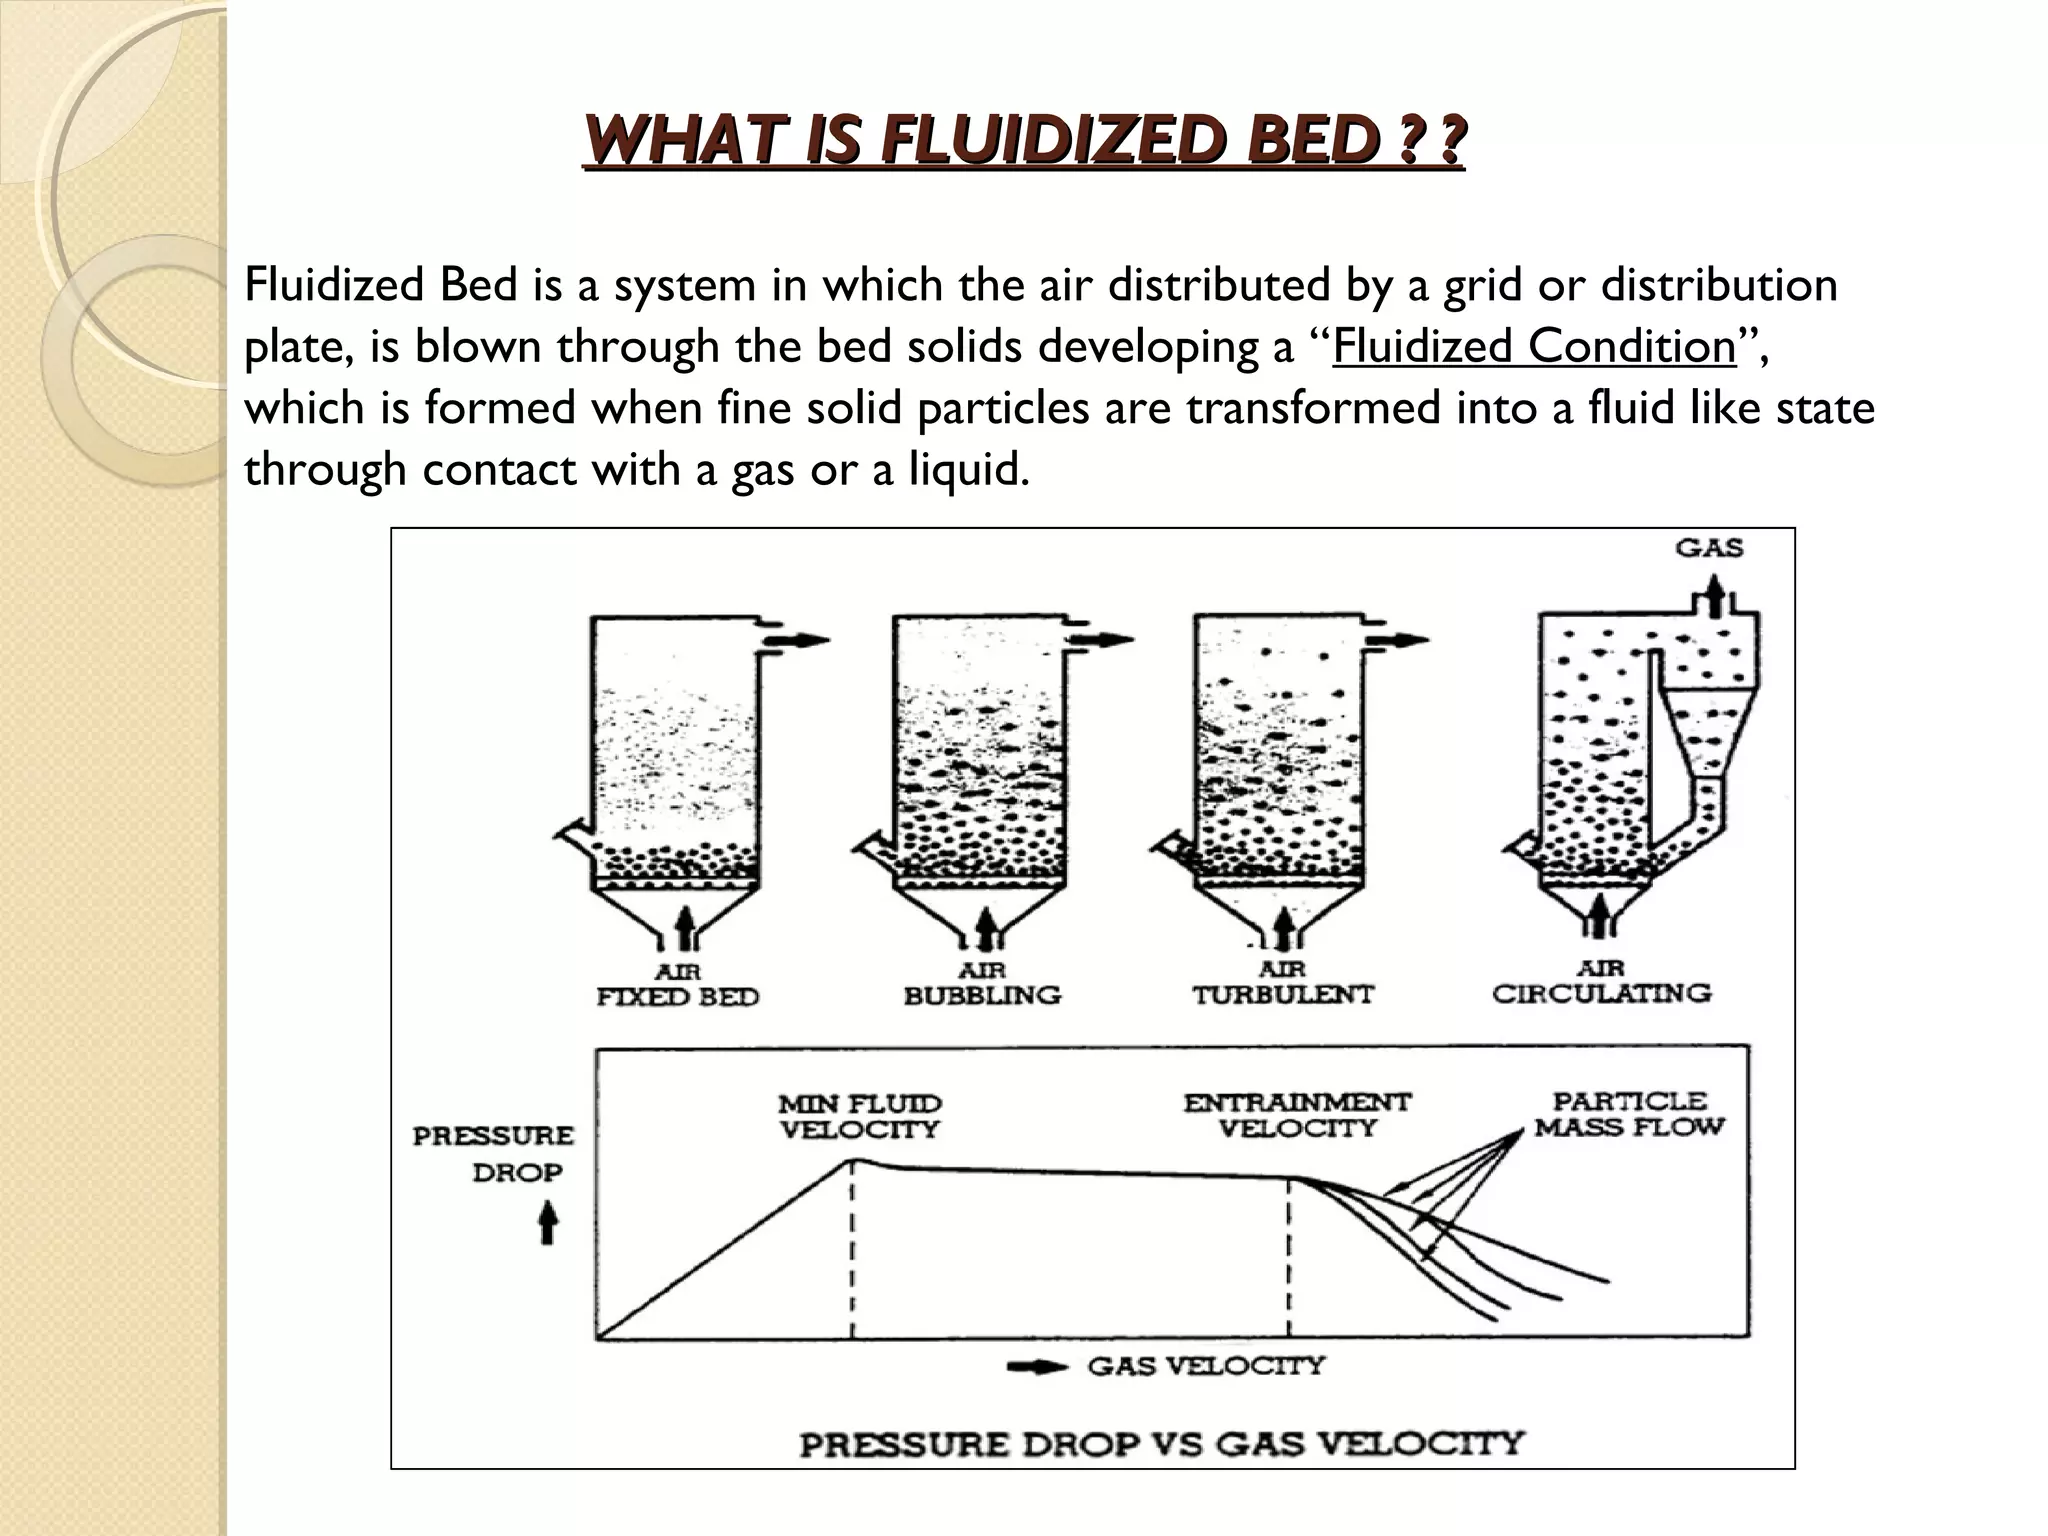
This document summarizes a study on the hydrodynamic behavior of a cold model bubbling fluidized bed system using bubble caps. Key findings include:
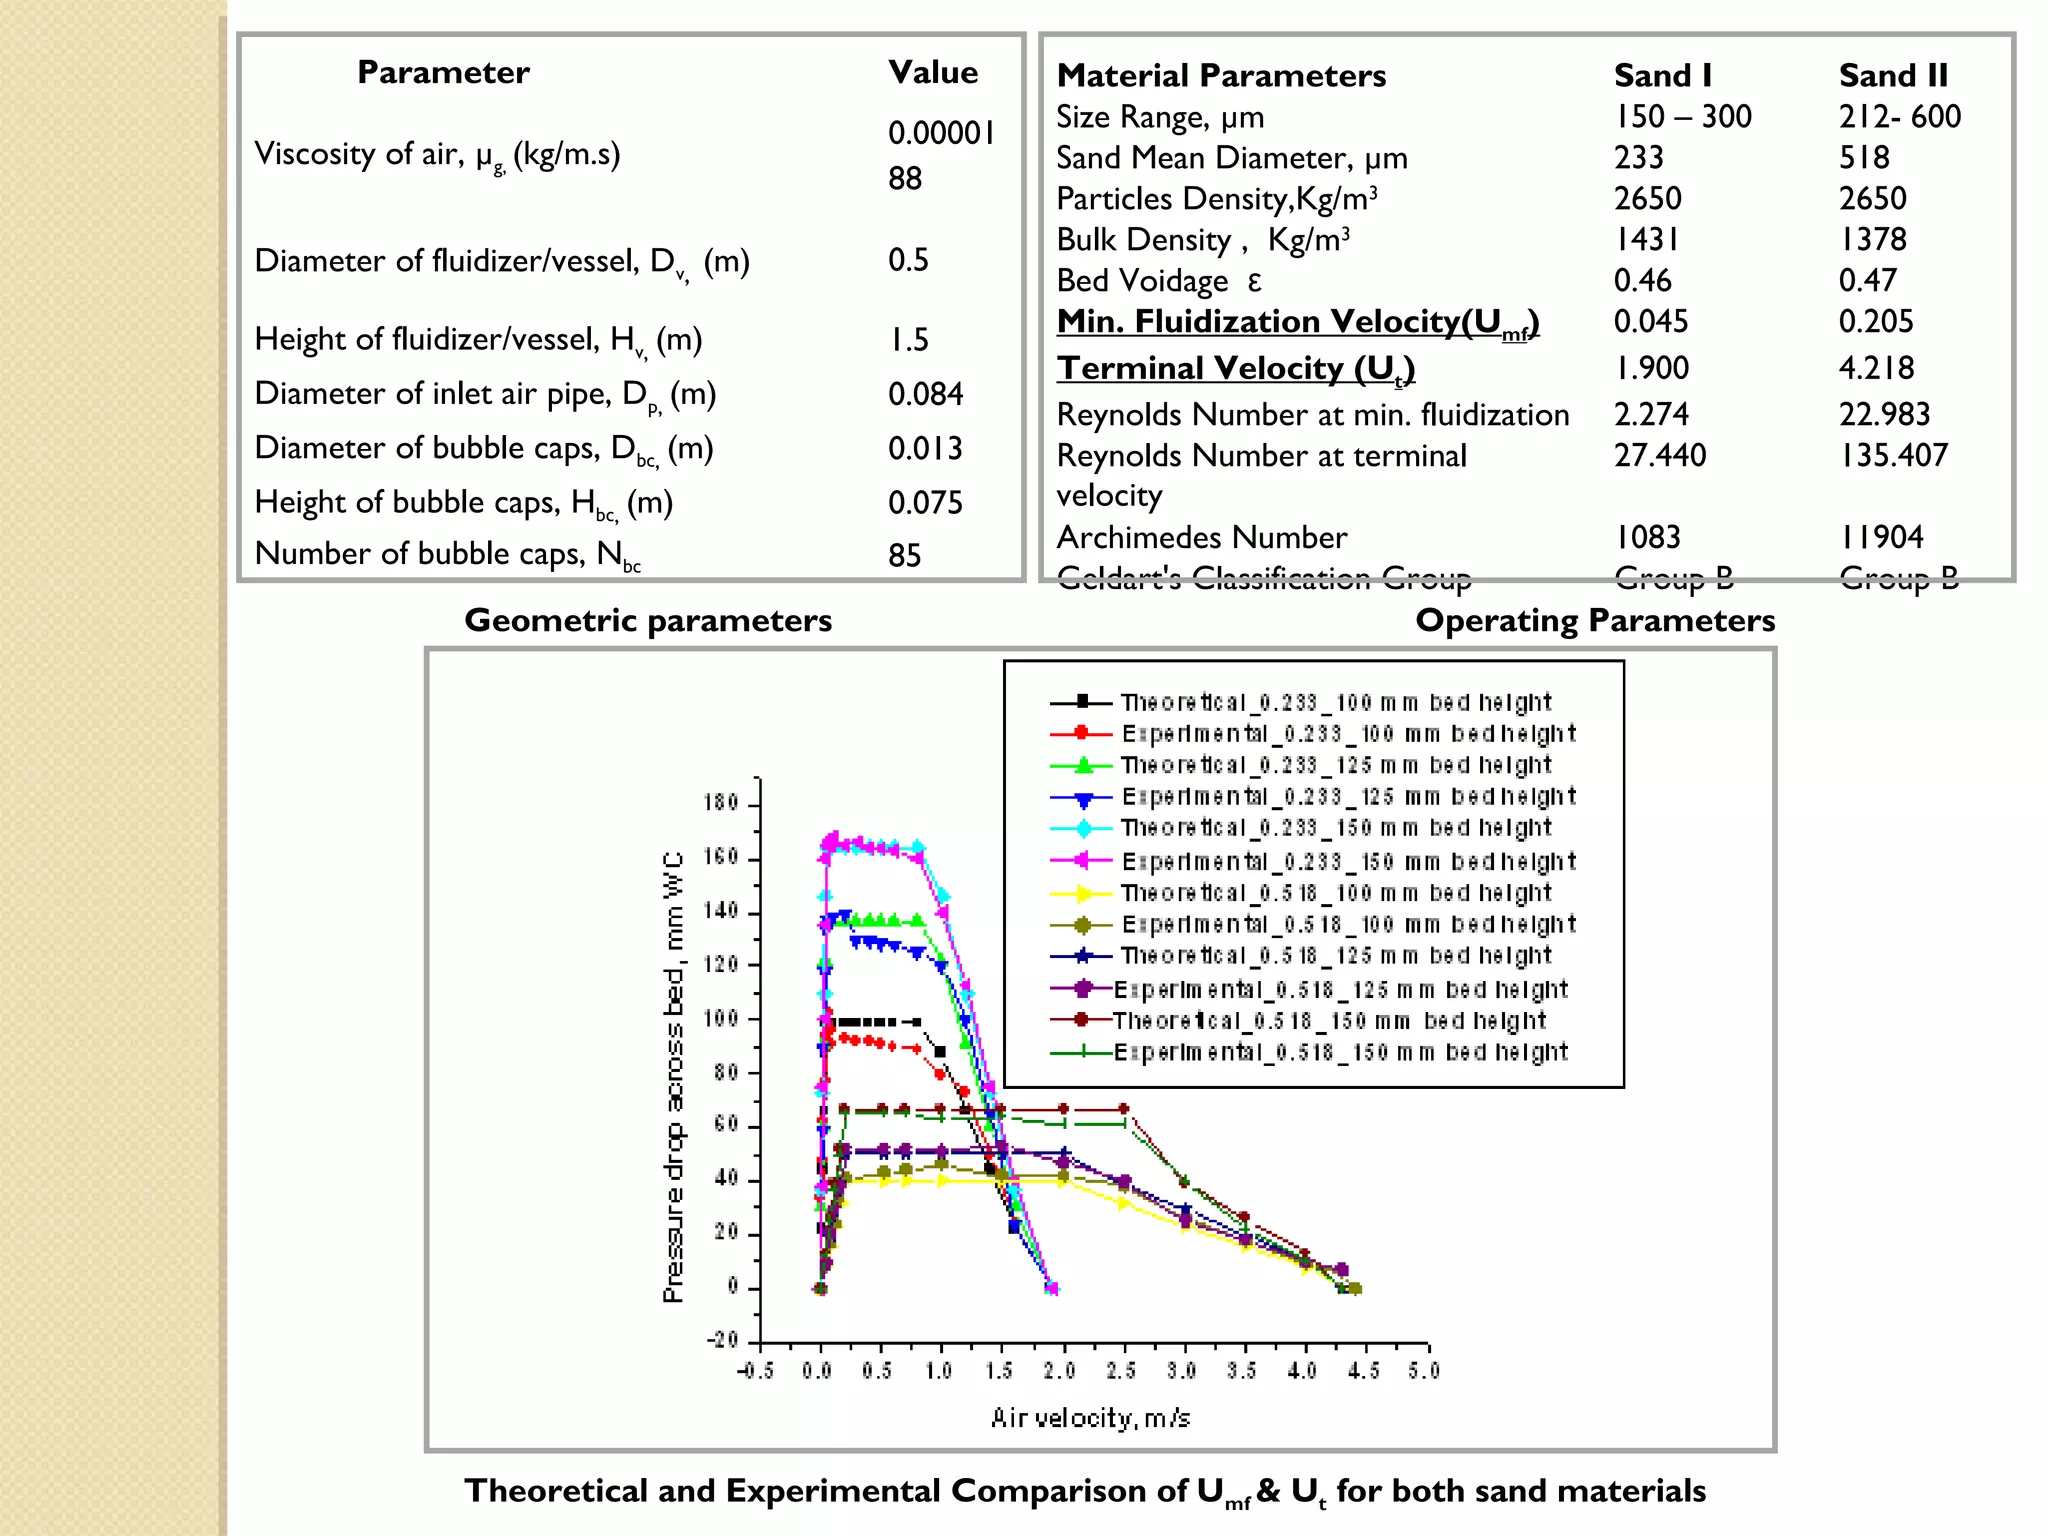
1) Experiments were conducted on a laboratory scale cold model fluidized bed system to study hydrodynamic parameters like minimum fluidization velocity (Umf) and terminal velocity (Ut) that are difficult to measure under actual high temperature/pressure conditions.
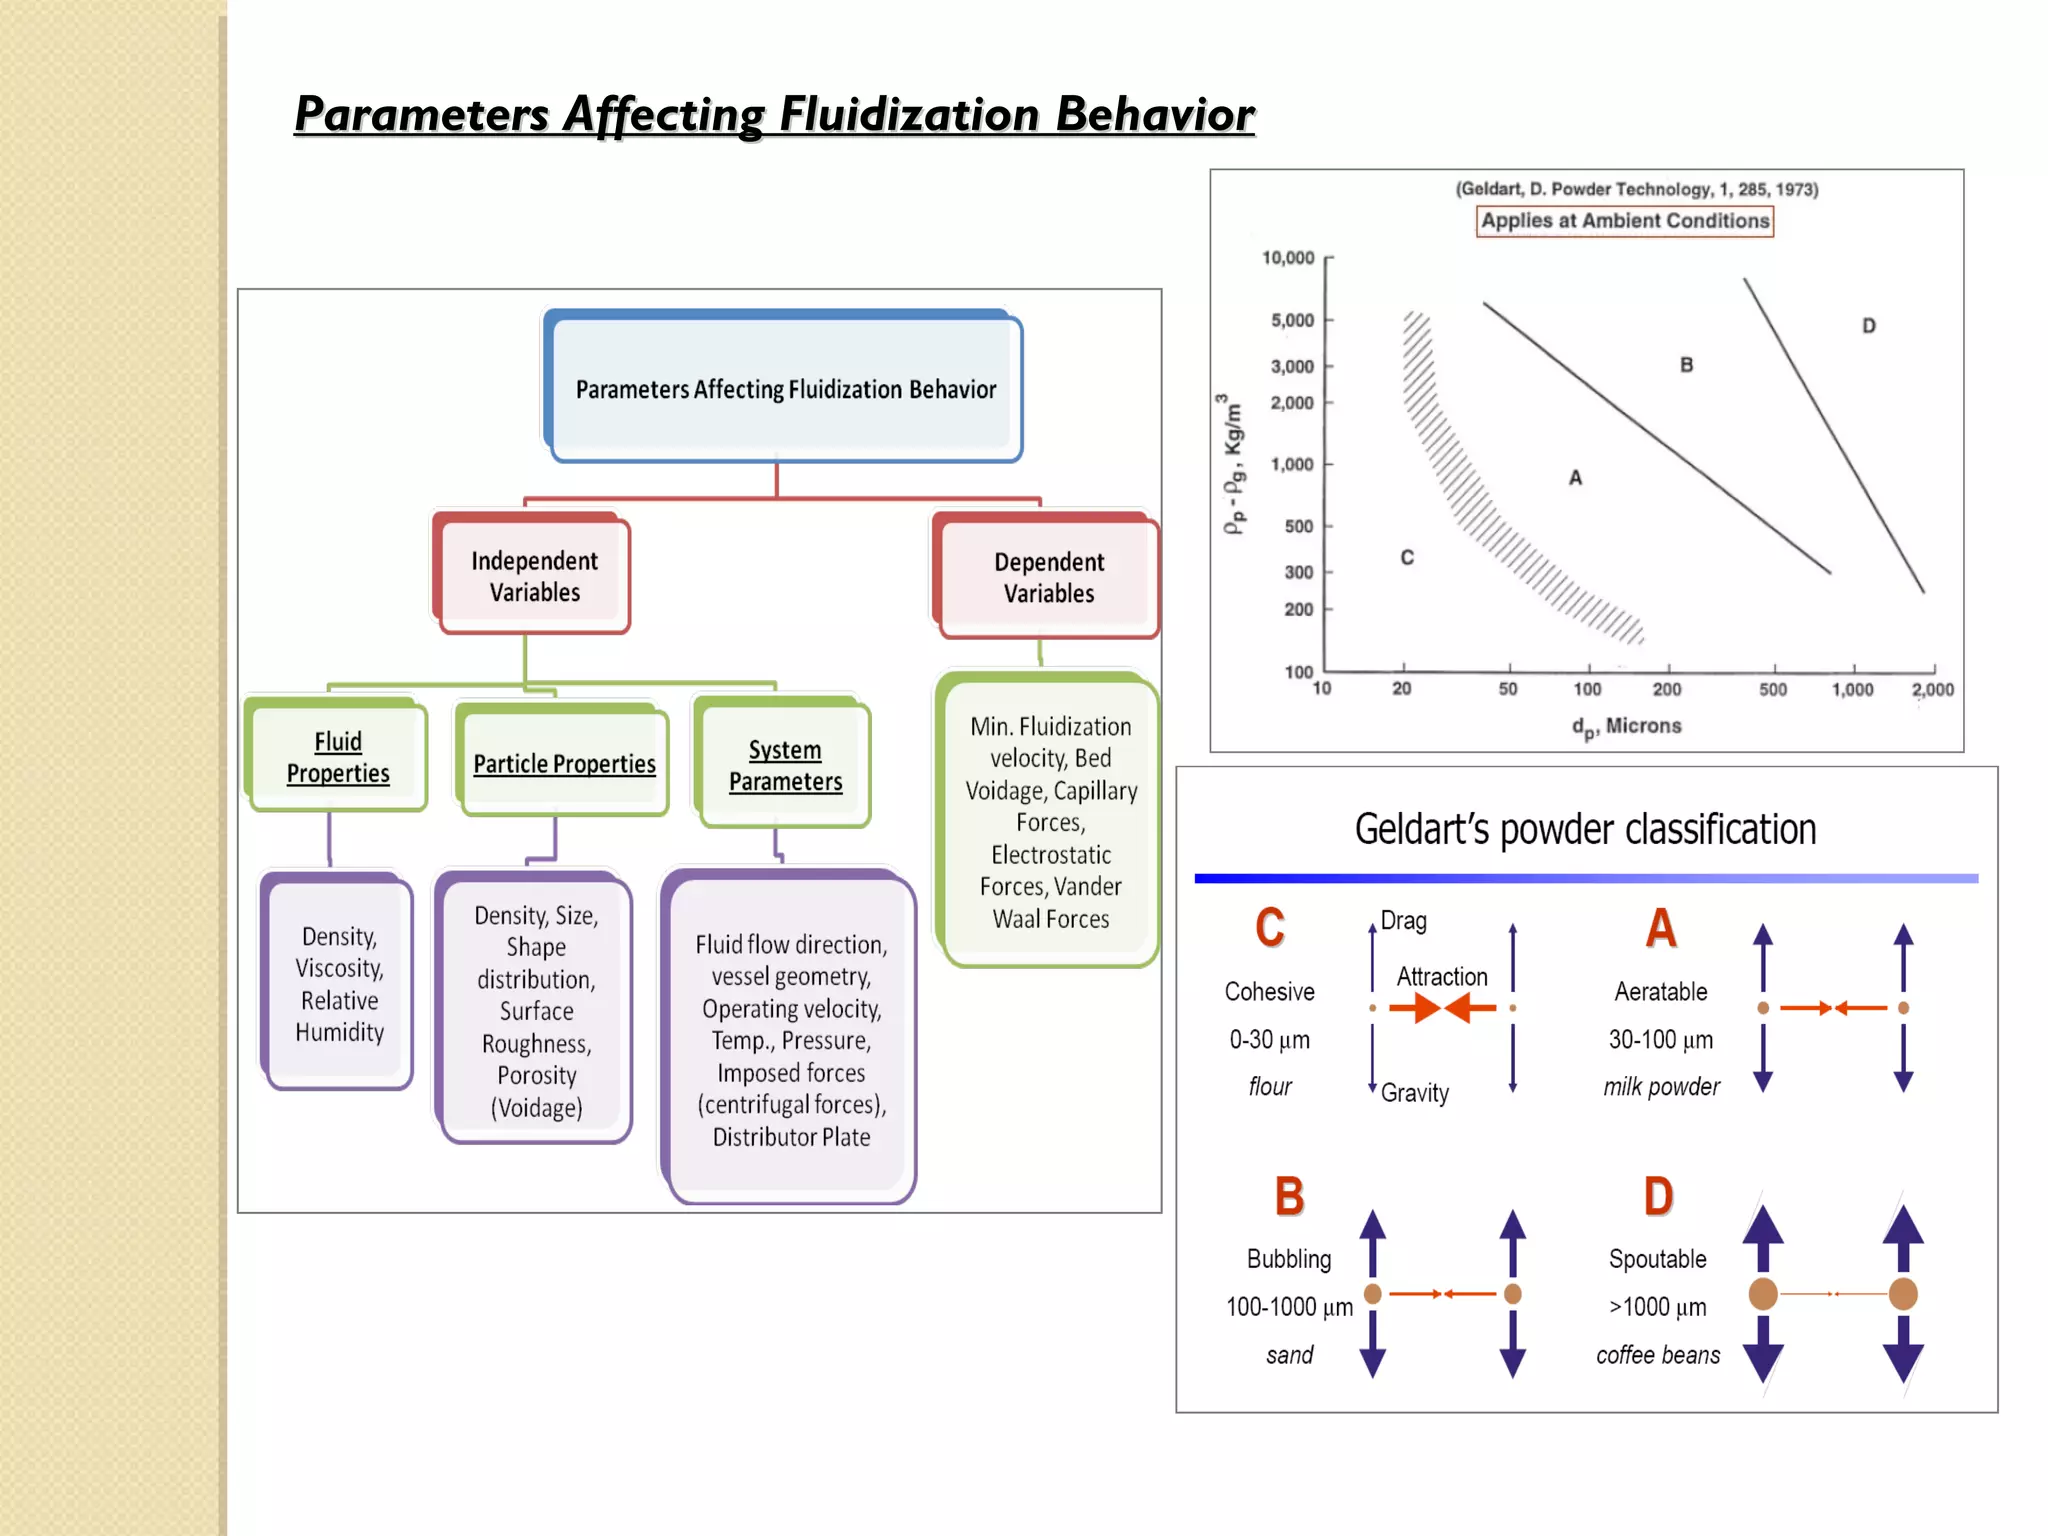
2) Parameters measured included Umf, Ut, and bubble behavior for two types of sand (Sand I and Sand II) used as bed material. Theoretical predictions of Umf and Ut using established equations were also compared to experimental values.
3) Results provide insights into the fundamental hydrodynamics of


![Min. Fluidization Velocity
The pressure drop through fixed beds of has been correlated by Ergun[13] using the
equation: 2
∆P (1 − ε m ) 2 µ g uo 1 − ε m ρ g uo
g c = 150 + 1.75 3 ………………….. (1)
L 3
εm (φ s d p )
2
εm φsd p
The minimum fluidization occurs when
(drag force by upward moving gas ) = (weight of particles)
or (∆P bed) (Area bed) = (Volume bed) (Fraction of solids) (specific weight of solids)
g
or ∆P. Abed = ( Abed Lmf )(1 − ε mf ) ( ρ s − ρ g ) ………………….. (2)
gc
Umf , the superficial velocity of gas at minimum fluidization conditions, is found by
combining eqn. (1) and eqn.(2):
1.75 d p umf ρ g 150(1 − ε mf ) d p umf ρ g d p ρ g ( ρ s − ρ g ) g
2 3
3
+ = ..........................(3)
φsε mf µg φs ε mf
2 3 µ µg
2
g
The equation (3) can also be written as:
1
d p u mf ρ g d p ρg (ρs − ρg )g
3 2
= ( 33.7 ) + 0.0408
2
Re mf = − 33.7 …………………..(4)
µg
µg
2
](https://image.slidesharecdn.com/hydrodynamicstudybfbieeebangalore-121029160303-phpapp01/75/Hydrodynamic-study-bfb-ieee_bangalore-9-2048.jpg)
![Terminal Velocity of Sand Particles
The gas flow rate through a fluidized bed is limited on one hand by u mf and on the other by entrainment of
solids by the gas. When entrainment occurs these solids must be recycled or replaced by fresh material to
maintain steady-state operations. This upper limit to the gas flow rate is approximated by the terminal or
free-fall velocity of the particles [14], which can be estimated from fluid mechanics by:
4 gd p ( ρs − ρg ) 2
1
ut = …..…(5)
3ρg C d
Where Cd is the experimentally determined drag coefficient.
10
C d , spherical = 12
, 0.4<Rep<500 …..…(6)
Re p
The expression for terminal velocity [14] is also given as
below:
( )
1
4 ρ s − ρ g 2 d p2 2
U t , spherical = d , 0.4<Rep<500 …..…(7)
225 ρ gµ g p
Terminal velocity(non-spherical),Ut’=Kt .Ut (spherical) ……... (8)
The correlation factor Kt is obtained by [15] :
ϕ
K t = 0.843 log 10 For Re <0.2, …... (9)
0.065
4( ρp − ρg ) gd v
0. 5
Kt = For Re<1000, …... (10)
3ρg ( 5.31 −4.88 ϕ)
Experimentally, terminal velocity of type sand I and sand II is find out by visual observations i.e. when the inlet air
flow rate is increased beyond the flow rate at which entrainment of sand particles is started, the pressure drop across
the bed is decreasing and at certain stage this pressure drop almost tend to zero when there is almost negligible sand
material in the bed. At this stage, terminal velocity for both sand materials is obtained.](https://image.slidesharecdn.com/hydrodynamicstudybfbieeebangalore-121029160303-phpapp01/75/Hydrodynamic-study-bfb-ieee_bangalore-10-2048.jpg)
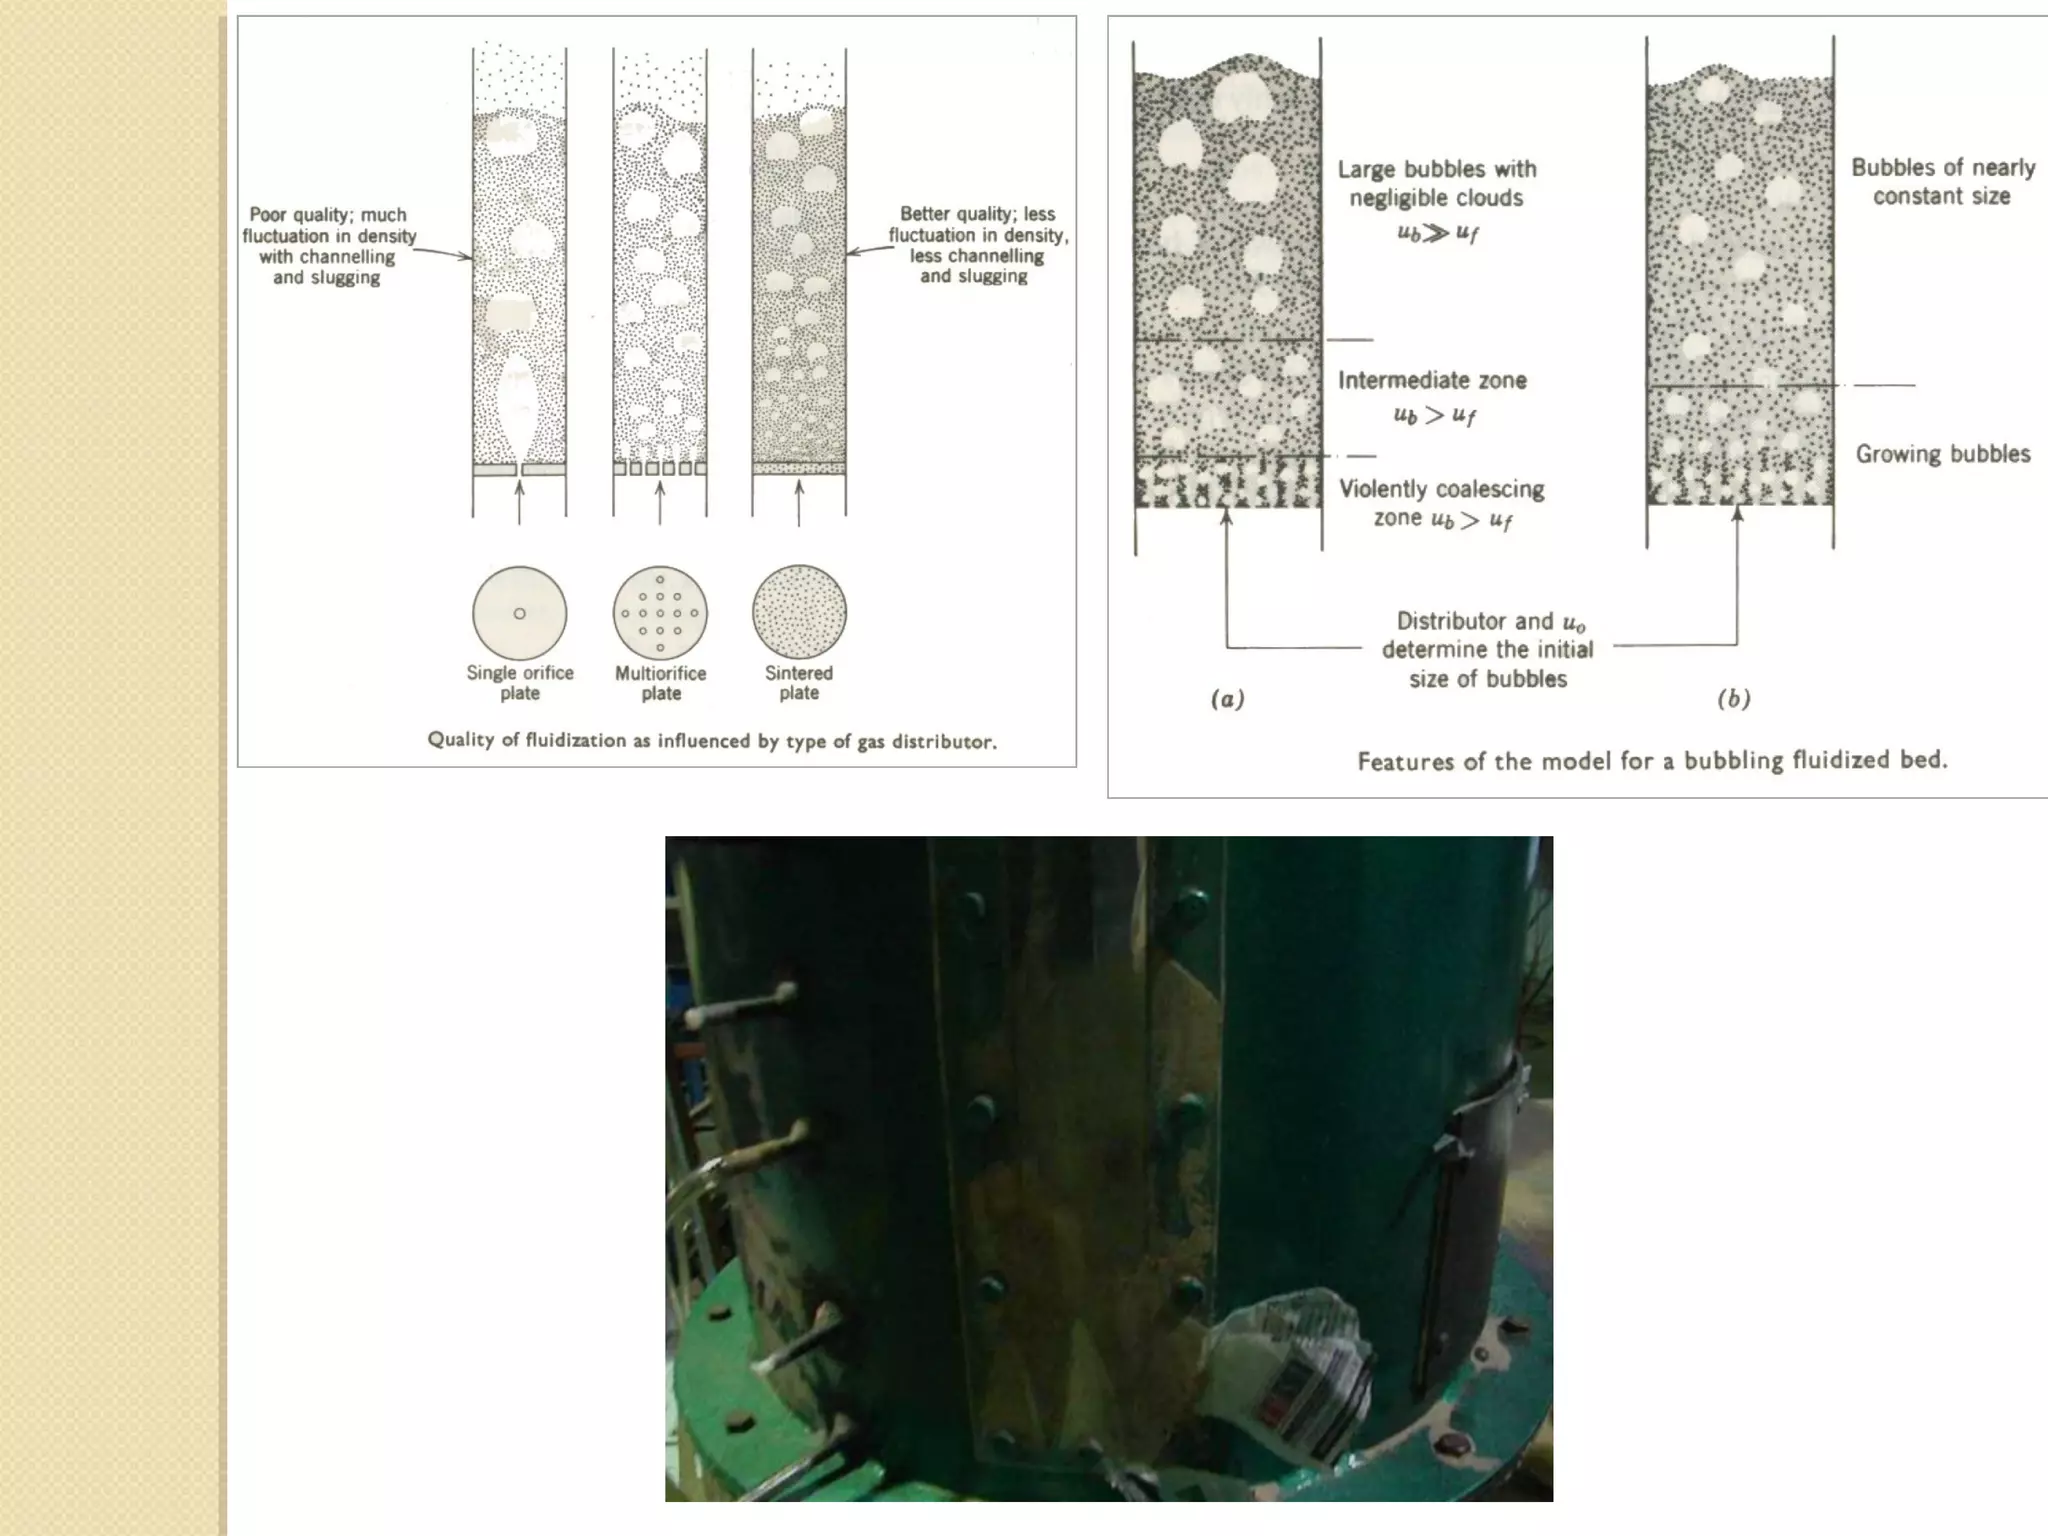
![Bubble Behavior
A. Minimum Bubbling Velocity (Umb):
Fluidized systems with a small density difference between fluid and particles expand uniformly, while those
with a large density difference are generally unstable and produce bubbling. The lowest gas velocity at which
bubbling occurs is called the minimum bubbling velocity. There are two correlations are presented to find u mb:
1) The correlation to find umb is given by Broadhurst and Becker [16] :
d pU mb ρ g Ar
Re mb = = …………… (11)
µg 0.22
9.8 × 10⁴ Ar − 0.82 ρ s + 35.4
ρ
g
2) Geldart[17] suggested a correlation for minimum bubbling velocity as:
U mb = K mb ×d p …………… (12)
Where Kmb is a constant whose value is 100 in cgs system. Davison & Harrison observed that the interval
between minimum bubbling velocity and minimum fluidization velocity represents the stable uniform
fluidization, which shrinks rapidly as the size of the particles increases.
B. Bubble size
There are several methods of observing bubbles in gas-solid fluidized beds:
1) Simple methods like visual observation if vessel is transparent,
2) still or cine photography,
3) using probes,
4) using two dimensional beds,
5) X-ray observation,
6) observation of particle movement,
7) observation of single isolated bubble.](https://image.slidesharecdn.com/hydrodynamicstudybfbieeebangalore-121029160303-phpapp01/75/Hydrodynamic-study-bfb-ieee_bangalore-12-2048.jpg)
![The major advance in the study of fluid beds came with the investigations of single, isolated bubbles. The
Davison model remains useful as a first approximation. An isolated bubble in a fluid bed takes the form of an
indented sphere. The leading spherical surface is called the roof and the apex is the nose. The solids filling the
indentation are transported with the bubble for natural sand from 100 to 600 µm the wake fraction was from
0.22 to 0.28. The rise in velocity of an isolated bubble [18] depends on its size, given as:
1
U b = 0.79 gVb 2 = 0.711 gDb …………… (13)
C. Bubble growth and coalescence
After detachment from the distributor, bubbles interact as they rise in the bed. The coalescence of a pair of
bubbles has been investigated by Clift and Grace [19,20] and by Toei and Matsuno[21]. There are several
characteristics of the coalescence process. The leading bubble spreads horizontally as the trailing bubble
elongates and accelerates into the wake of the leader. The volume of two bubbles increases by 20-30%
during coalescence, followed by a 10% decrease during consolidation after wake entry, giving a net volume
increase of 10-20%. There is increased gas flow through the emulsion phase between the bubbles. The
following relation finds the maximum size:
( )
0. 4
Dbed 2 U 0 − U mf
D b∞ = 2.35 …………… (14)
g
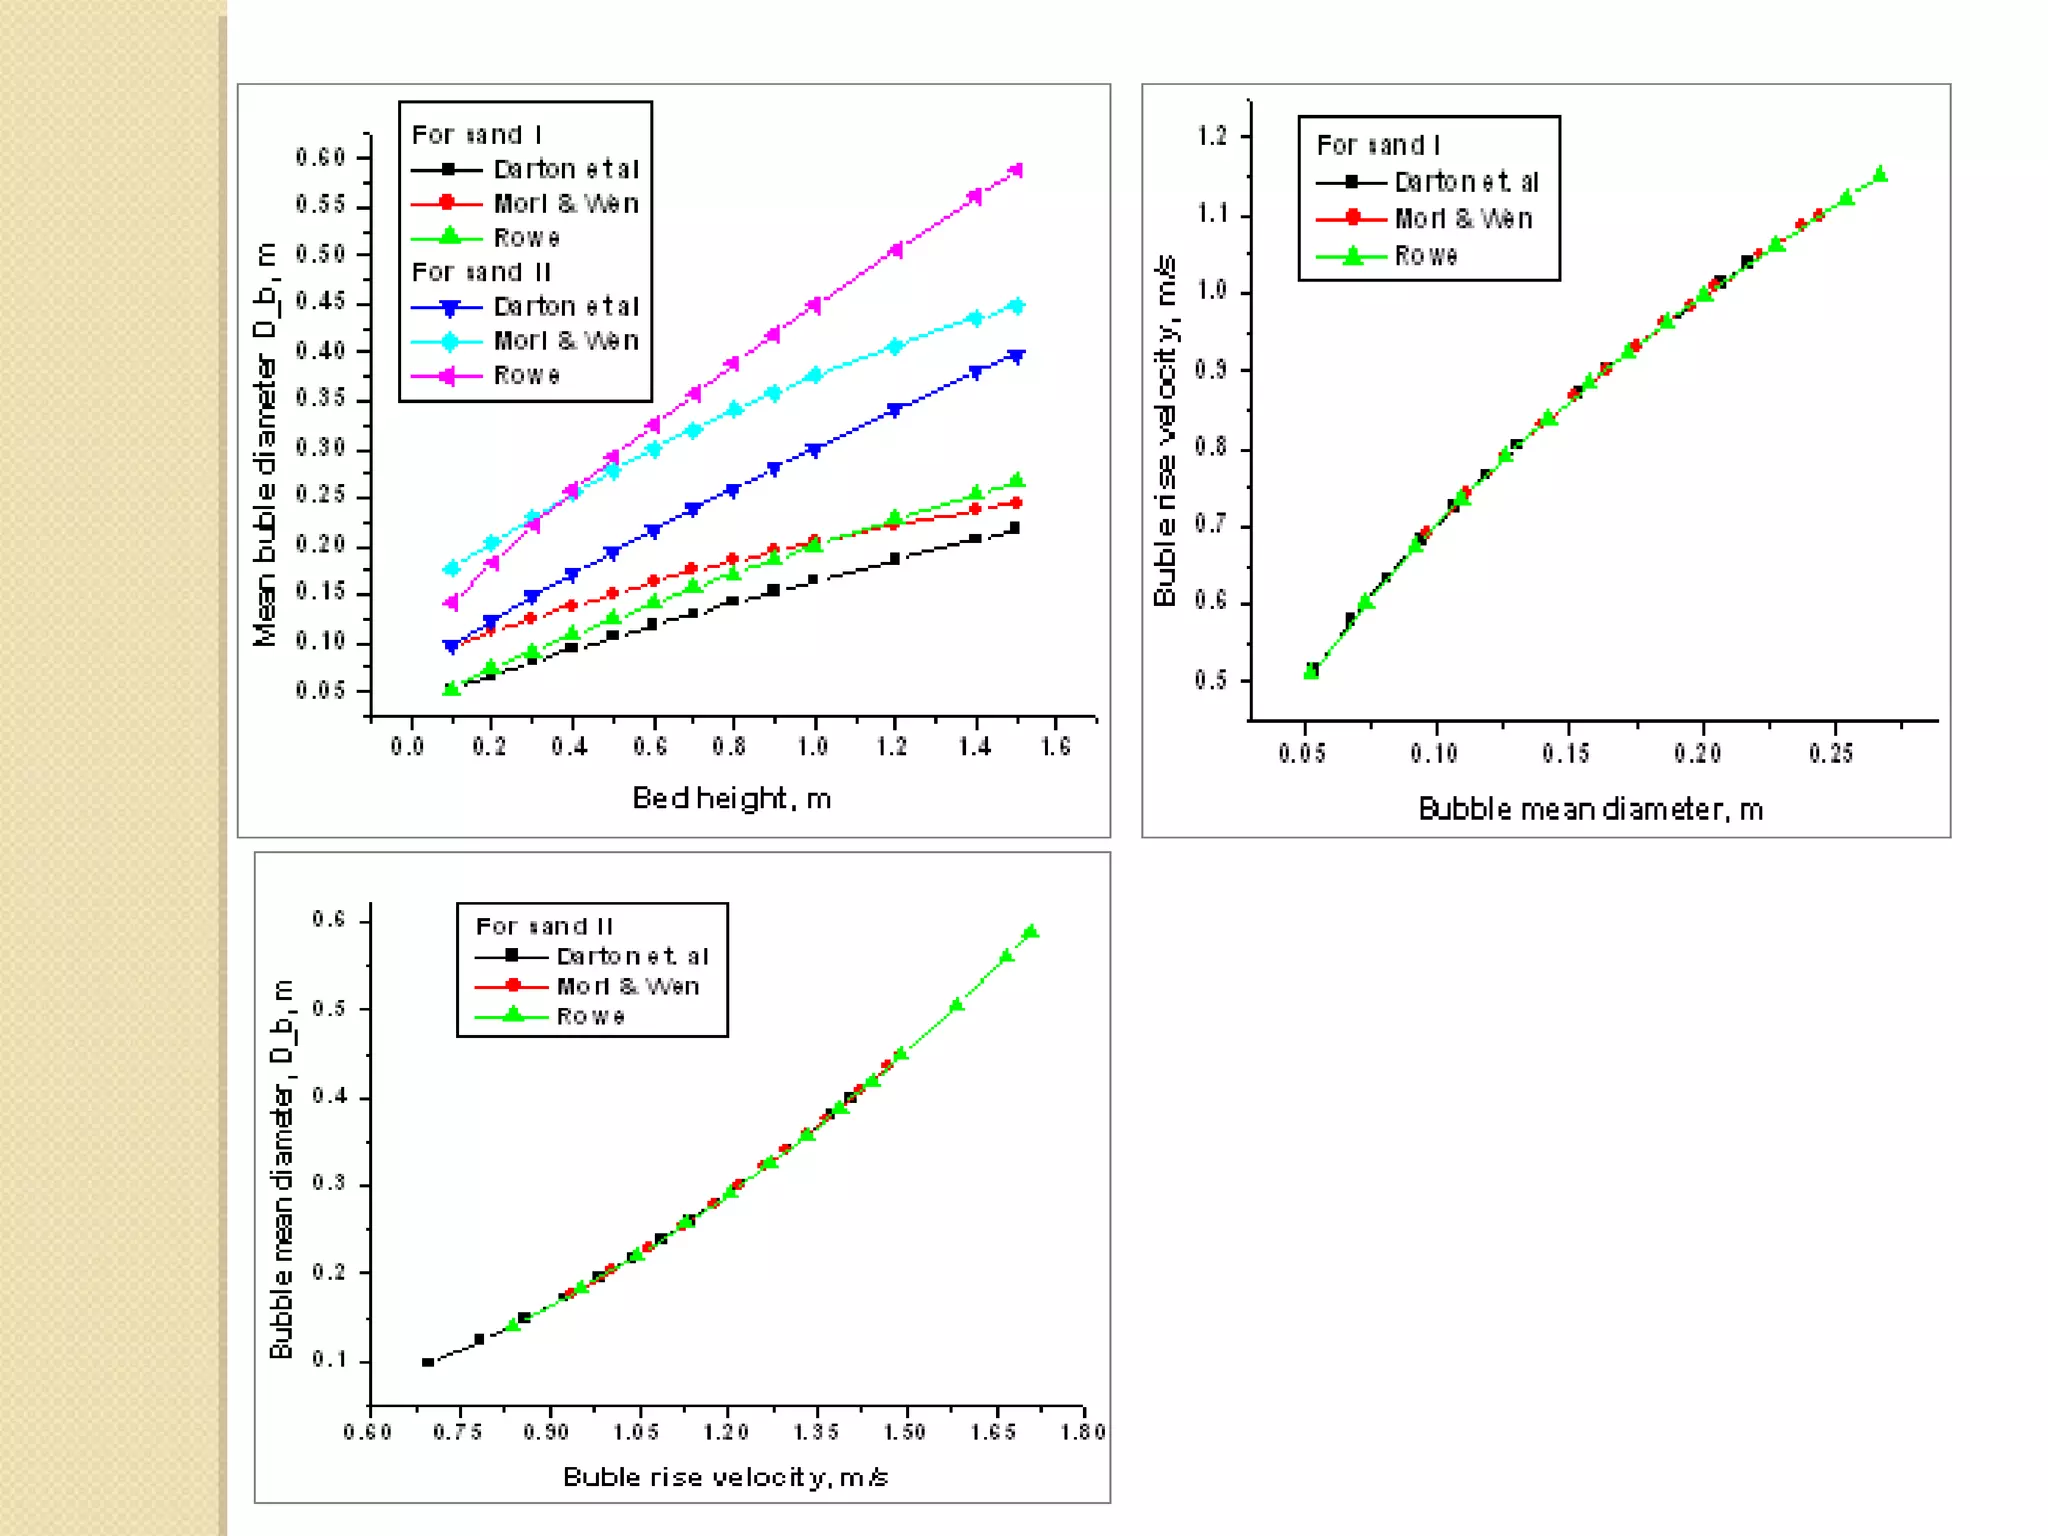
Bubble growth and splitting lead to a distribution of bubble size in the bed. Agarwal used a population balance to calculate the
bubble distribution. Three correlations have been found to be reliable for mean bubble size.
1) Mori & Wen [22] use the initial and maximum bubble sizes with first order growth rate (as it is the
most popular equation for calculation). With distributor plate having Bubble cap,
Db ( H ) = Db∞ − ( Db∞ − Db 0 ) exp − 0.3H
.............(15)
Dbed
](https://image.slidesharecdn.com/hydrodynamicstudybfbieeebangalore-121029160303-phpapp01/75/Hydrodynamic-study-bfb-ieee_bangalore-13-2048.jpg)
![2) Darton [23] has suggested another correlation for bubble size and the same is represented as:
0 .8
0.54(u −u mf ) Abed
0 .4
H + 4
N or
Db ( H ) = …………….. (16)
0 .2
g
3) Rowe [24] proposed a correlation to predict bubble size in a gas-solid fluidized bed (when size is
not
restricted by the column dimension) as:
(U 0 −U mf ) 12 ( H + H 0 ) 3 4
Db ( H ) = 1
…………….. (17)
g 4
Table . Comparisons between bubble size for both sand materials:
Ref. Darton [23] Mori [22] Rowe [24]
Sand I Sand II Sand I Sand II Sand I Sand II
Uo 0.158 0.718 - - 0.158 0.718
Umf 0.045 0.205 0.045 0.205 0.045 0.205
H 0.1-1.5 0.1-1.5 0.1-1.5 0.1-1.5 0.1-1.5 0.1-1.5
Dbed 0.5 0.5 0.5 0.5 0.5 0.5
Abed 0.196 0.196 0.196 0.196 0.196 0.196
Nor 85 85 85 85 85 85
Dmax. 0.357 0.654 0.357 0.654 0.357 0.654
Dmin. 0.080 0.147 0.080 0.147 0.080 0.147
Db 0.053-0.217 0.098-0.399 0.096-0.244 0.176-0.448 0.052-0.267 0.142-0.588
Ub 0.514-1.038 0.697-1.406 0.691-1.101 0.936-1.491 0.509-1.151 0.838-1.708](https://image.slidesharecdn.com/hydrodynamicstudybfbieeebangalore-121029160303-phpapp01/75/Hydrodynamic-study-bfb-ieee_bangalore-14-2048.jpg)


![CHEE_220_Lecture_Fluidization_2021[1].pptx](https://cdn.slidesharecdn.com/ss_thumbnails/chee220lecturefluidization20211-230329153950-84712558-thumbnail.jpg?width=640&height=640&fit=bounds)


![Coded Agents – with UiPath SDK + LangGraph [Virtual Hands-on Workshop]](https://cdn.slidesharecdn.com/ss_thumbnails/codedagentsdeck-251215155422-5497c599-thumbnail.jpg?width=640&height=640&fit=bounds)


