Assessment of heavy metal concentrations in surface water sources
Assessment of Groundwater Pollution in Ranipet, Tamilnadu
1. The International Journal of Engineering And Science (IJES)
||Volume|| 2 ||Issue|| 01 ||Pages|| 263-268 ||2013||
ISSN: 2319 – 1813 ISBN: 2319 – 1805
Assessment of Groundwater Pollution Potential in and Around Ranipet
Area, Vellore District, Tamilnadu
1
K.Ambiga, 2Dr. R. AnnaDurai
1
M.E., Asst.Professor (S-II), SCSVMV University, Enathur, Kanchipuram. Tamil Nadu, India
2
Ph.D, Professor and Head, Department of Civil Engineering, SRM University, Kattakalathur TamilNadu India
--------------------------------------------------------Abstract--------------------------------------------------------
Drinking water is contaminated through the pipe distribution system or directly through groundwater due to
addition of waste water discharged from domestic, industrial and agricultural sources. The present study deals
with the physic-chemical characteristics of subsurface water quality in Ranipet area. Such a water samples
were collected from different identified bore wells and dug wells for the purpose of studying the quality of
groundwater during July 2012. The bore wells from which the samples were collected are extensively used for
drinking purpose. It has been proved from the present investigation findings that value of few parameters are
TDS, Total hardness, Calcium, Magnesium, Sulphate, Chloride, Fluoride and Nitrate fall out of the permissible
range with reference to BIS. Drinking standards. Hence, suggested to take proper care to avoid contamination
of groundwater pollution through periodic monitoring of the water quality.
Keyword: Groundwater, Physico – chemical parameter, Heavy metals
----------------------------------------------------------------------------------------------------------------------------------------
Date of Submission: 4th January, 2012 Date of Publication: Date 20th January 2013
------------------------------------------------------------------------------------------------ ----------------------------------------
I. Introduction:
Water pollution is a major problem related to the economic/industrial growth of any country. The
number of industries in India, during the last decade, has grown more than ten times and accordingly the
problems related to environmental degradation have increased many folds. There is a need for sustainable
development of economic growth and industries. Some of the industries release their effluents either on the open
land or in surrounding surface water bodies contaminating the soil, surface water and ultimately groundwater.
Governments of India are aware of these problems and have started looking into the remedial measures to clean
some of the highly contaminated surface water bodies. Involvement of very high costs of remediation will make
this process slow and therefore, it is essential that the contamination of water bodies is controlled rather than
remediation. Leather production is a major industry in India, which makes significant contribution to the
country’s foreign exchange earnings and provides employment opportunities to about three million people.
Dissolved chromium reaches concentration levels of some g/kg−1 due to anthropogenic pollution from tanneries,
which is generally linked to the use of Cr (VI) compounds in several industries applications such as plating,
metallurgy, pigments, and leather tanning (I. Nanda Balan et al., 2012). During the process of leather
manufacturing, several chemicals like Cr (SO4)3, NaCl, Ca (OH) 2, H2SO4 etc. are extensively used. Therefore,
the resultant effluent is enriched with chromium and sodium salts (NaCl and SO4). The tannery waste is
characterized by its strong color (reddish dull-brown), high BOD, high pH, and high total dissolved solids
(S.Srinivasa Gowd.Pradip K.Govil, 2008). Tannery effluents, being voluminous and highly puerile, when
discharged untreated, damage the normal life of the receiving water bodies; and if allowed to percolate into the
ground for a prolonged period, will pollute the groundwater permanently and make it unfit for drinking,
irrigation, and domestic consumption. Groundwater is the main source of water supply for domestic use and
drinking purpose in rural areas. It is established that a single tannery can cause the pollution of groundwater
around the radius of 7–8 km (X.Rosario Arun Kumar et al., 2012). Chromium present in effluent is primarily in
the less toxic trivalent form Cr (III) but when this effluent is discharged into the soil, due to varying
environmental conditions, Cr (III) is oxidized to toxic hexavalent form, which seldom remains as Cr (VI)
(P.N.Palanisamy et al., 2007, I. Nanda Balan et al., 2012). The relation between pollution and health problems is
now well documented and reasonably well known by the general public (Charmaine Jerome and Anitha Plus,
2011). In Tamilnadu state, where more than 60% of India’s economically important tanning industry is located,
tannery waste containing chromium and sodium compounds has, over many years, contaminated 55,000 ha of
agricultural land. Thousands of farmers lost their farms, or part of their earning capacity because of this
contamination. Incidence of respiratory diseases among workers exposed to occupational and environmental
risks of tannery industry at Ranipet industrial area is reported (A.Moharir et al., 2002). In many areas of Tamil
Nadu, groundwater is not suitable for domestic use, forcing villagers to travel 4–5 km for water. Much of the
groundwater is unsuitable for irrigation, and hundreds of wells in the region can no longer be used
www.theijes.com The IJES Page 263
2. Assessment of Groundwater Pollution Potential in and Around Ranipet Area, Vellore District…
(H.Manjunatha et al., 2011; I. Nanda Balan et al., 2012; J. Maheswari and K. Sankar, 2011). This is also one of
the contaminated sites identified by Central pollution control board, India. The primary objective of the present
study was to assess the heavy metal contamination and their distribution in groundwater.
II. Materials And Methods:
Study Area:
In the study area bounded between Latitude N 12°52′30’’ – 12°57′30’’ and Longitude E 79°15’00’’–
79°25′00’’ is located in North of TamilNadu in India (Fig 1). The area is enclosed in toposheet No.57 P/5 SE –
SW of Survey of India. The study are extends over an area of 154.52 Sq.Km. The drainage of the study area is
mainly Palar River and Ponnai River. It includes Ranipet, Walajapet, Arcot and Melvishram. The Ranipet area
is a chronic polluted area and one of the biggest exporting centers of tanned leather. Many small-scale tanneries
are processing leather in the study area and discharging their effluents on the open land and surrounding water
bodies (S.Srinivasa Gowd.Pradip K.Govil, 2008). The total numbers of tannery industrial units located in and
around this town are 240 besides other industries like ceramic, refractory, boiler auxiliaries plant, and chromium
chemicals. Industries located in Ranipet are discharging effluents into Puliathengal, Vanapadi, and Thandalam
lakes and it is a matter of increasing concern, as these industries are located in Palar river basin. Studies of
groundwater also indicated the high concentrations of chromium in Palar river basin, which is much more than
the permissible limit in drinking water. These tanneries are polluting the Palar River, causing ecological
degradation and health hazards (Maheswari. J. and K. Sankar, 2011). Geologically the study area is covered by
crystalline rocks of Archaean age consisting of Granites and some basic intrusive bodies. The alluvium
consisting of fine to coarse sand and clay occurring in the area is of a fluviatile origin and restricted to the
course of Palar river and major streams (Gautam. D.K. and M.R. Sharma, 2011).
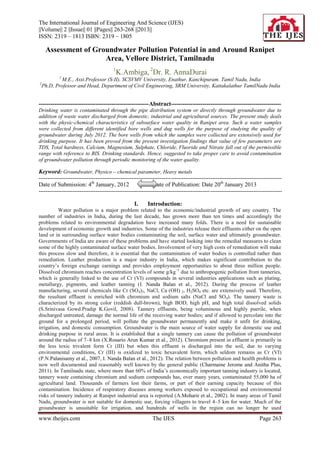
Fig. 1: Location of the Study area
Fig. 2: Location of the well sampling stations
III. Methodology:
Sample Collection And Processing:
Standard method of collection, preservation and analysis were adopted (APHA, 2002). The sampling
was done from different stations Fig 2. For the assessment of groundwater quality, 35 water samples were
collected from bore wells and open wells in the study area during July 2012 and were analyzes for the major
physico – chemical parameters (Table 1). The physical parameters such as pH, Turbidity, Electrical
conductivity, TDS were determined, the chemical characteristics including heavy metals for examination of
water (APHA, 2002). The results obtained were evaluated in accordance with the standards prescribed under
‘Indian standard drinking water specification IS 10500: 1992’ of Bureau of Indian Standards.
www.theijes.com The IJES Page 264
3. Assessment of Groundwater Pollution Potential in and Around Ranipet Area, Vellore District…
RESULT AND DISCUSSION:
The present study areas of the turbidity of sample stations are within the permissible limit (10 NTU).
High concentration of dissolved solids about 3000 mg/l may also produce distress in livestock. The values of EC
ranged from 516 and 6046 (ds m -1). The pH value varied between 7 and 7.4 (Table 1). All the samples were
within the permissible limits of IS: 10500 standards for drinking water. The values of alkalinity at stations were
found in the range of 108 – 472 mg/l. Total hardness values ranged from 212 to 1299 mg/l values of all type of
hardness were quiet high with their prescribed standards. The well stations No. 3, 4, 17, 26, 29 is within the
permissible limits (Table 1). The higher value is mainly found owing to abundant availability of limestone rocks
in the surrounding area consequently more solubility of Ca++ and Mg++ salts under anaerobic conditions
(P.N.Palanisamy et al ., 2007).
Calcium hardness values ranged from 48 to 320 mg/l. The maximum permissible limit of calcium
hardness is 75 mg/l. The well station No. 3,4,5,11,13,17,21,26,29,32,33 is within the permissible limits.
Melvishram (320 mg/l) and Arcot Bus stand (216 mg/l) of well stations No. 17 and 24 are extend the
permissible limit of 200 mg/l (Fig 3). Calcium is a major constituent of various types of rock. Calcium is a cause
for hardness in water and incrustation in boilers. Magnesium hardness values ranged from 22 to 96 mg/l (Fig 3).
Fig 3 : Variation of Physico – chemical characteristics of groundwater sources
www.theijes.com The IJES Page 265
4. Assessment of Groundwater Pollution Potential in and Around Ranipet Area, Vellore District…
Table 1 : Physico - Chemical Analyses of Groundwater Samples of the study Area
Wel W Villag Tur TDS EC pH To TH Ca M Na K Iro Free Nitr Ni Cl F So4 Pho Chro
l No ell e bidi mg/l , tal mg/ m g m m n Am ite tra m mg/ mg/l sph mium
Ty ty mic Al l g/l m g/l g m moni mg/ te g/l l ate PPM
pe NT ro kal g/l /l g/l a l m mg/
U mh ini mg/l g/l l
os y
1 D Anant 4.6 1386 198 7.2 11 340 76 36 28 1 0.2 0.03 0.1 17 49 0.56 240 0.03 0.000
W halai 0 1 2 2 8 9 0 8
2 B Pudhu 2.4 1932 276 7.2 18 580 12 62 35 2 0.2 0.03 0.01 33 72 0.73 320 0.09 0.002
W Pettai 2 9 8 8 0 0 1 3
3 B Ammu 3.3 362 516 7.2 14 212 48 22 28 4 0.3 0.07 0 20 42 0.82 29 0.04 0
W r 8 4 2
4 B Maant 5.2 1250 178 7.0 10 280 64 29 25 1 0.1 0.12 0.33 8 44 0.48 213 0.13 0.001
W hangl 6 6 8 2 2 8 5
5 B Naval 1.9 1562 223 7.1 29 330 72 36 28 1 0.1 0.04 0.29 46 38 0.61 126 0.06 0.002
W pur 2 4 6 0 4 1 1
6 B Thand 1.8 3922 560 7.3 39 820 20 77 79 5 0.2 0.02 0.43 18 14 0.86 356 0.12 0
W alam 2 2 6 0 0 0 6 15
7 B Settith 2.6 3118 445 7.2 41 760 16 82 66 4 0.3 0.03 0.14 22 10 0.79 294 0.11 0.000
W angal 4 9 2 8 0 0 1 10 8
8 D Vanap 3.1 2796 399 7.1 44 720 19 55 55 3 0.2 0.03 0.07 33 52 0.68 246 0.06 0.001
W adi 2 8 0 6 0 0 6 8
9 B Ranip 0.8 2908 415 7.2 45 740 20 58 59 3 0.1 0.92 0 11 54 0.69 224 0.07 0
W et 6 4 6 0 0 0 9 0
Agrav
aram
10 B Sipcot 0.6 1466 209 7.1 35 340 80 34 28 2 0.1 1.09 0.2 11 30 0.71 176 0.03 0.000
W -I 4 9 6 0 0 6 2 4
11 B Pulian 1.9 1206 172 7.2 28 330 72 29 25 1 0.3 1.57 0 7 26 0.39 158 0.02 0.002
W thanga 2 3 4 0 8 2 2
l
12 B Maniy 0.8 1566 223 7.2 24 350 76 38 35 3 0.1 1.15 1.11 9 37 0.48 182 0.06 0.000
W ampatt 6 8 4 2 0 4 6 8
u -1
13 B Theng 1.8 1390 198 7.3 31 320 72 34 28 2 0.2 1.18 1.38 44 24 0.43 149 0.07 0.001
W al 4 1 6 0 0 1 7
14 B Pulia 2.6 1400 201 7.2 11 350 76 38 28 2 0.2 4.29 0.06 70 42 0.34 182 0.2 0.000
W mkann 2 6 2 0 0 6 6 8
u
15 B Palar 3.2 2666 380 7.1 44 710 19 55 54 3 0.2 6.18 2.09 31 62 0.41 382 0.34 0.002
W River 8 1 0 2 0 0 9 4
16 B Veppu 2.6 4232 604 7.2 31 120 32 96 76 5 0.3 0.15 0.46 27 16 0.73 452 0.04 0
W r 6 8 2 0 0 0 0 9 09
17 B Melvis 0.9 886 126 7.1 29 256 56 28 16 1 0.1 0.15 0.02 37 14 0.62 93 0.07 0.004
W haram 4 9 6 0 2 8 8
18 B Kathia 3.1 2006 286 7.0 26 610 16 48 36 2 0.2 0.14 0.06 69 59 0.59 286 0.23 0.001
W vadi 2 4 8 8 8 4 2 4
19 B Masap 4.2 3196 456 7.0 39 820 20 77 66 4 0.2 0.06 0.08 38 94 0.42 486 0.06 0.000
W pettai 4 2 2 0 0 0 9 0 8
20 B Arcot 5.3 2336 333 7.2 21 660 16 58 46 3 0.3 0.08 1.38 70 80 0.29 340 0.00 0
W Main - 6 9 6 8 0 0 1 2 8
Town
21 B Uppup 5.2 1262 180 7.1 29 320 72 34 26 1 0.4 0.15 0 22 28 0.62 168 0.12 0.000
W ettai 2 6 2 0 6 1 7 8
22 D Krishn 3.6 2088 298 7.2 21 620 16 48 36 3 0.3 0.05 0 8 72 0.64 352 0.1 0.000
W avara 2 9 2 8 0 0 8 4
m
23 B Kuram 4.2 1772 253 7.3 39 520 13 46 34 2 0.3 0.05 0.08 29 39 0.58 224 0.04 0.000
W padi 2 1 2 2 0 0 6 6 4
24 B Arcot 8.6 3056 436 7.3 47 730 21 48 64 4 0.4 0.45 0.25 67 89 0.71 238 1.29 0.000
W Bus 4 9 2 6 0 0 6 1 8
Stand
www.theijes.com The IJES Page 266
5. Assessment of Groundwater Pollution Potential in and Around Ranipet Area, Vellore District…
25 B V.C.M 3.1 1422 203 7.0 24 350 76 28 32 3 0.2 0.23 0 35 37 0.63 192 0.41 0.001
W ottur -1 2 9 0 0 0 9 6
26 B V.C.M 4.6 1138 162 7.1 21 270 56 31 25 2 0.4 0.3 0.22 3 29 0.49 182 0.1 0.0008
W ottur - 6 2 2 0 0 2 5
2
27 B Vanniy 2.9 1788 255 7.2 39 400 88 43 36 4 0.3 0.07 2.57 46 39 0.56 189 0.02 0.0008
W avedu 6 2 0 0 1 6
28 B Walaja 3.2 1096 156 7.1 20 386 84 42 18 1 0.3 0.22 2.05 60 24 0.45 124 0 0.002
W pettai 4 9 8 2 2 4 7
29 B Chenna 0.9 636 906 7.0 10 260 56 29 94 8 0.1 0.07 0 15 15 0.38 92 0.03 0.001
W samuda 1 8 6 8
ram
30 B Pulitha 1.8 1674 239 7.2 35 410 88 46 36 4 0.2 0.43 0.2 46 39 0.48 196 0.4 0.0008
W ngal 2 3 6 0 0 2 1
31 B Ranipet 2.8 1076 153 7.2 18 360 76 41 18 2 0.1 0.07 0 3 28 0.38 130 0.11 0.001
W Sipcot 6 8 8 0 0 9 2
- II
32 B Ranipet 1.6 1089 155 7.1 19 350 72 41 18 2 0.1 0.12 0 3 32 0.39 136 0.03 0.0008
W Sipcot 6 9 2 6 2 2
- III
33 B Ranipet 3.4 1062 151 7.2 19 340 72 38 17 1 0.1 0.02 0.02 2 29 0.38 129 0.04 0.0004
W Sipcot 8 2 6 8 8 4 2
- IV
34 B Maniya 4.2 2328 332 7.1 44 640 16 58 46 5 0.1 0.09 0.09 60 55 0.45 244 0.01 0.0008
W mpattu 4 9 0 0 0 0 3 9
-2
35 B Mudiy 5.5 1290 184 7.1 34 390 80 46 22 1 0.2 0.14 0.14 10 23 0.39 152 0.02 0.001
W or 2 6 4 0 8 2 8
Illam
maximum permissible limit of calcium hardness is 30 mg/l. The well station No. 3, 4, 17, 25, 29 is within the
permissible limits. Chemical softening, reverse osmosis, electro dialysis, or ion exchange reduces the
magnesium and associated hardness to acceptable levels. The concentrations of sodium in the study are ranges
between 28 to 790 mg/l in all the samples (Table 1). Person afflicted with certain diseases requires low sodium
concentration.Potassium ranks seventh among the elements in order of abundance yet its concentration in most
drinking waters seldom reaches 20 mg/l. However, the concentrations of potassium were analyzed from 4 to 50
mg/l for all the samples. Iron content from sample stations is found to be in the range of 0.1 – 0.46 mg/l (Table
1). The well station No. 3, 7, 11, 16, 20, 21, 23, 24, 26, 27, 28 is more than the permissible limits. High levels
of iron are attributed to the dominating literatic soil. The nitrite concentration in the study area of ground water
in the range of 0 to 2.09 mg/l. The normally permissible limit of nitrite is 0 – 0.1 mg/l. In the palar river (well
station No. 14) is highly nitrite concentration (2.09 mg/l) in the water (Table 1). The nitrite concentration in
groundwater in normally low but can reach high levels as a result of leaching or runoff from agricultural land
and contamination from human or animal wastes as consequence of the oxidation of ammonia and similar
sources. Anaerobic conditions may result in the formation and persistence of nitrite. The nitrate concentration in
the study area ranges from 7 – 70 mg/l. The permissible limit of nitrate is 45 mg/l. The well station No. 5, 14,
18, 20, 24, 27, 28, 30, 34 are more than the permissible limits (Fig3). Nitrates generally occur in trace quantities
in surface waters but may attain high levels in some ground waters. It can be toxic to certain aquatic organisms
even at concentration of 100 mg/l. In excessive limits, it contributes to the illness known as methenoglobinemia
in infants. The Chloride concentration in the study area ranges from 42 – 1609 mg/l. The permissible limit of
chloride is 250 mg/l. The well station No. 3,13,17,29 is within the permissible limits. But the well station No. 6,
7, 16 are extend the limit of above 1000 mg/l (Fig 3). High chloride content may harm metallic pipes and
structures as well as growing plants. Chlorides in excess imparts the salty taste to water and people are not
accustomed to high chloride are subjected to laxative effect (H.Manjunatha et al., 2011).
The fluoride concentrations were found to be in the range of 0.26 to 0.86 mg/l. In groundwater, fluoride
concentrations vary with the type of rock that the water flows through but do not usually exceed 10 mg/l (V.
Ashwini et al., 2010). Presence of large amounts of fluoride is associated with dental and skeletal fluorosis (1.5
mg/l) and inadequate amounts with dental caries (< 1 mg/l). The sulphate concentrations were found to be in the
range of 29 to 486 mg/l. The well stations No. 3, 6, 13, 17, 28, 29, 31, 32, 33 is within the permissible limit
(Table 1). The major physiological effects resulting from the ingestion of large quantities of sulfate are
catharsis, dehydration, and gastrointestinal irritation. Sulfate may also contribute to the corrosion of distribution
systems.The levels of phosphate in groundwater from all parts of the sample stations are found to be in the range
of 0.1 – 1.29 mg/l(Table 1). High concentration of phosphate might be due to use of detergents for washing of
clothes and utensil activities by the villagers around most of the dug wells. The chromium concentration in the
www.theijes.com The IJES Page 267
6. Assessment of Groundwater Pollution Potential in and Around Ranipet Area, Vellore District…
study area ranges from 0-0.008 mg/l (Table 1). Tannery effluents are mostly characterized by high salinity, high
organic loading, and specific pollutants, such as chromium (M.Ibrahim Bathusha et al., 2006).
Conclusion:
Groundwater quality in and around Ranipet area shows high mineral contents in terms of total dissolved solids,
total hardness, calcium, magnesium, nitrate, chloride, fluoride, iron and sulphate and rated as ‘poor to very poor’. The reason
for higher values of physico-chemical parameters at certain sampling locations may be due the unsciencitific disposal of
solid wastes, the depth of the wells and nature of the geological materials with which the groundwater comes in contact may
influence the quality of the water. So from this research study, it can be concluded that groundwater of the study area in
some locations are not suitable for drinking purposes.
Acknowledgment:
The author wish to record deep sense of gratitude to Vice-Chancellor, Director (E &T), Dean (E &T) and other
dignitaries of Faculty of Civil Engineering , SRM University, Chennai, Tamil Nadu. The authors also wish to
sincere thanks to Mr.N.SeshadriSekhar, HOD, Mrs. R.Sumathi, Asst.Professor – II and Mr.M.SureshKumar,
Asst.Professor, Department of Civil & Structural Engineering, SCSVMV University, Kanchipuram, TamilNadu.
Reference:
[1]. APHA, 2002. Standard methods for the examination of water and wastewater. American Public Health Association,
Washington D.C.
[2]. BIS, 1992. Indian standard for drinking water specification – 10500. Bureau of Indian Standards, New Delhi.
[3]. Moharir.A, D.S.Ramteka, C.A.Moghe, S.R. Wate and R.Sarin, 2002. Surface and Groundwater Quality Assessment
in Bina Region. Indian J.Env.Prot., 22(9): 961- 969.
[4]. Joshi.V.A., U.Manivel, R.Ravindar Rao and P.S.Kelkar, 2002. Water Quality Assessment in Ramanathapuram
District. Indian J.Env.Prot., 22(9): 970- 977.
[5]. Ibrahim Bathusha.M and M.K. Saseetharan, 2006. Statistical study on Physico – Chemical Characteristics of
groundwater of Coimbatore South zone. Indian J.Env.Prot., 26(6): 508 – 515. June 2006.
[6]. Palanisamy.P.N, a. Geetha, M. Sujatha, P. Sivakumar and K.Karunakaran, 2007. Assessment of Ground Water
Quality in and around Gobichettipalayam Town Erode District, Tamilnadu. E-Journal of Chemistry., 4(3): 434-439.
[7]. Srinivasa Gowd.S Pradip K.Govil, 2008. Distribution of heavy metals in surface water of Ranipet industrial area in
Tamil Nadu, India. Environ Monit Assess., 136: 197 - 207.
[8]. Ashwini.V.Chandekar and R.K.Kamble, 2010. Groundwater Fluoride in Rajura Tehsil in Chandrapur District,
Maharashtra. Indian J.Env.Prot., 30(10): 823 - 831.
[9]. Mamadou Samake (Corrsponding author), Zhonghua Tang, Win Hlaing, Innocent M’Bue & Kanyamanda Kasereka,
2010. Assessment of Groundwater Pollution Potential of the Datong Basin, Northern China. Journal of Sustainable
Development., 3(2) : 140 – 152.
[10]. Manjunatha .H, H.B. Arvinda. And E.T. Puttaih, 2011. Subsurface water quality of Challakera Taluk, Kartnataka.
Indian J.Env.Prot., 31(6) : 511 – 513.
[11]. Gautam. D.K. and M.R. Sharma, 2011. Water Quality Modeling and Management of Seer stream in lower
Himalayas. Indian J.Env.Prot., 1,(1): 73 - 83.
[12]. Charmaine Jerome and Anitha Plus, 2011. Evalution of Groundwater Quality in an industrial; Area in Bangalore,
Karnataka. Indian J.Env.Prot., 31(3): 203 – 216.
[13]. Tiwari.R.N, 2011. Assessment of groundwater quality and pollution potential of Jawa Block, Rewa District, Madhya
Pradesh, India. Proceedings of the International Academy of Ecology and Environmental Sciences., 1(3-4): 202-212.
[14]. Maheswari. J. and K. Sankar, 2011. Groundwater Quality Assessment in Vaippar River Basin Tamilnadu (India).
International Journal of Current Research., 3(12):149-152.
[15]. Rosario Arun Kumar.X, L. Giridharan, J. Shyamala, P.M. Velmurugan and M. Jayaprakash, 2012. Geochemical
Assessment of Ground Water Quality in Cuddalore, Tamil Nadu, Sea Coast of India. World Applied Sciences
Journal., 17 (8) : 1033-1039.
[16]. Nanda Balan.I, M.Shivakumar, P.D. Madan Kumar, 2012. An assessment of groundwater quality using water quality
index in Chennai, TamilNadu, India. Chronicles of young Scientists., 3(2): 146 – 150.
Biographies:
K.Ambiga, B.E., M.E (Environmental Engineering), working as Assistant Professor - II, in Dept. of Civil &
Structural Engg., SCSVMV University, Kanchipuram, TamilNadu. She is doing research in Environmental
Engineering and GIS in SRM University Under the guidance of Dr.R.AnnaDurai.
Dr.R.AnnaDurai Ph.D., Professor and Head, Department of Civil Engineering, SRM University,
Kattankulathur campus, Chennai.
www.theijes.com The IJES Page 268