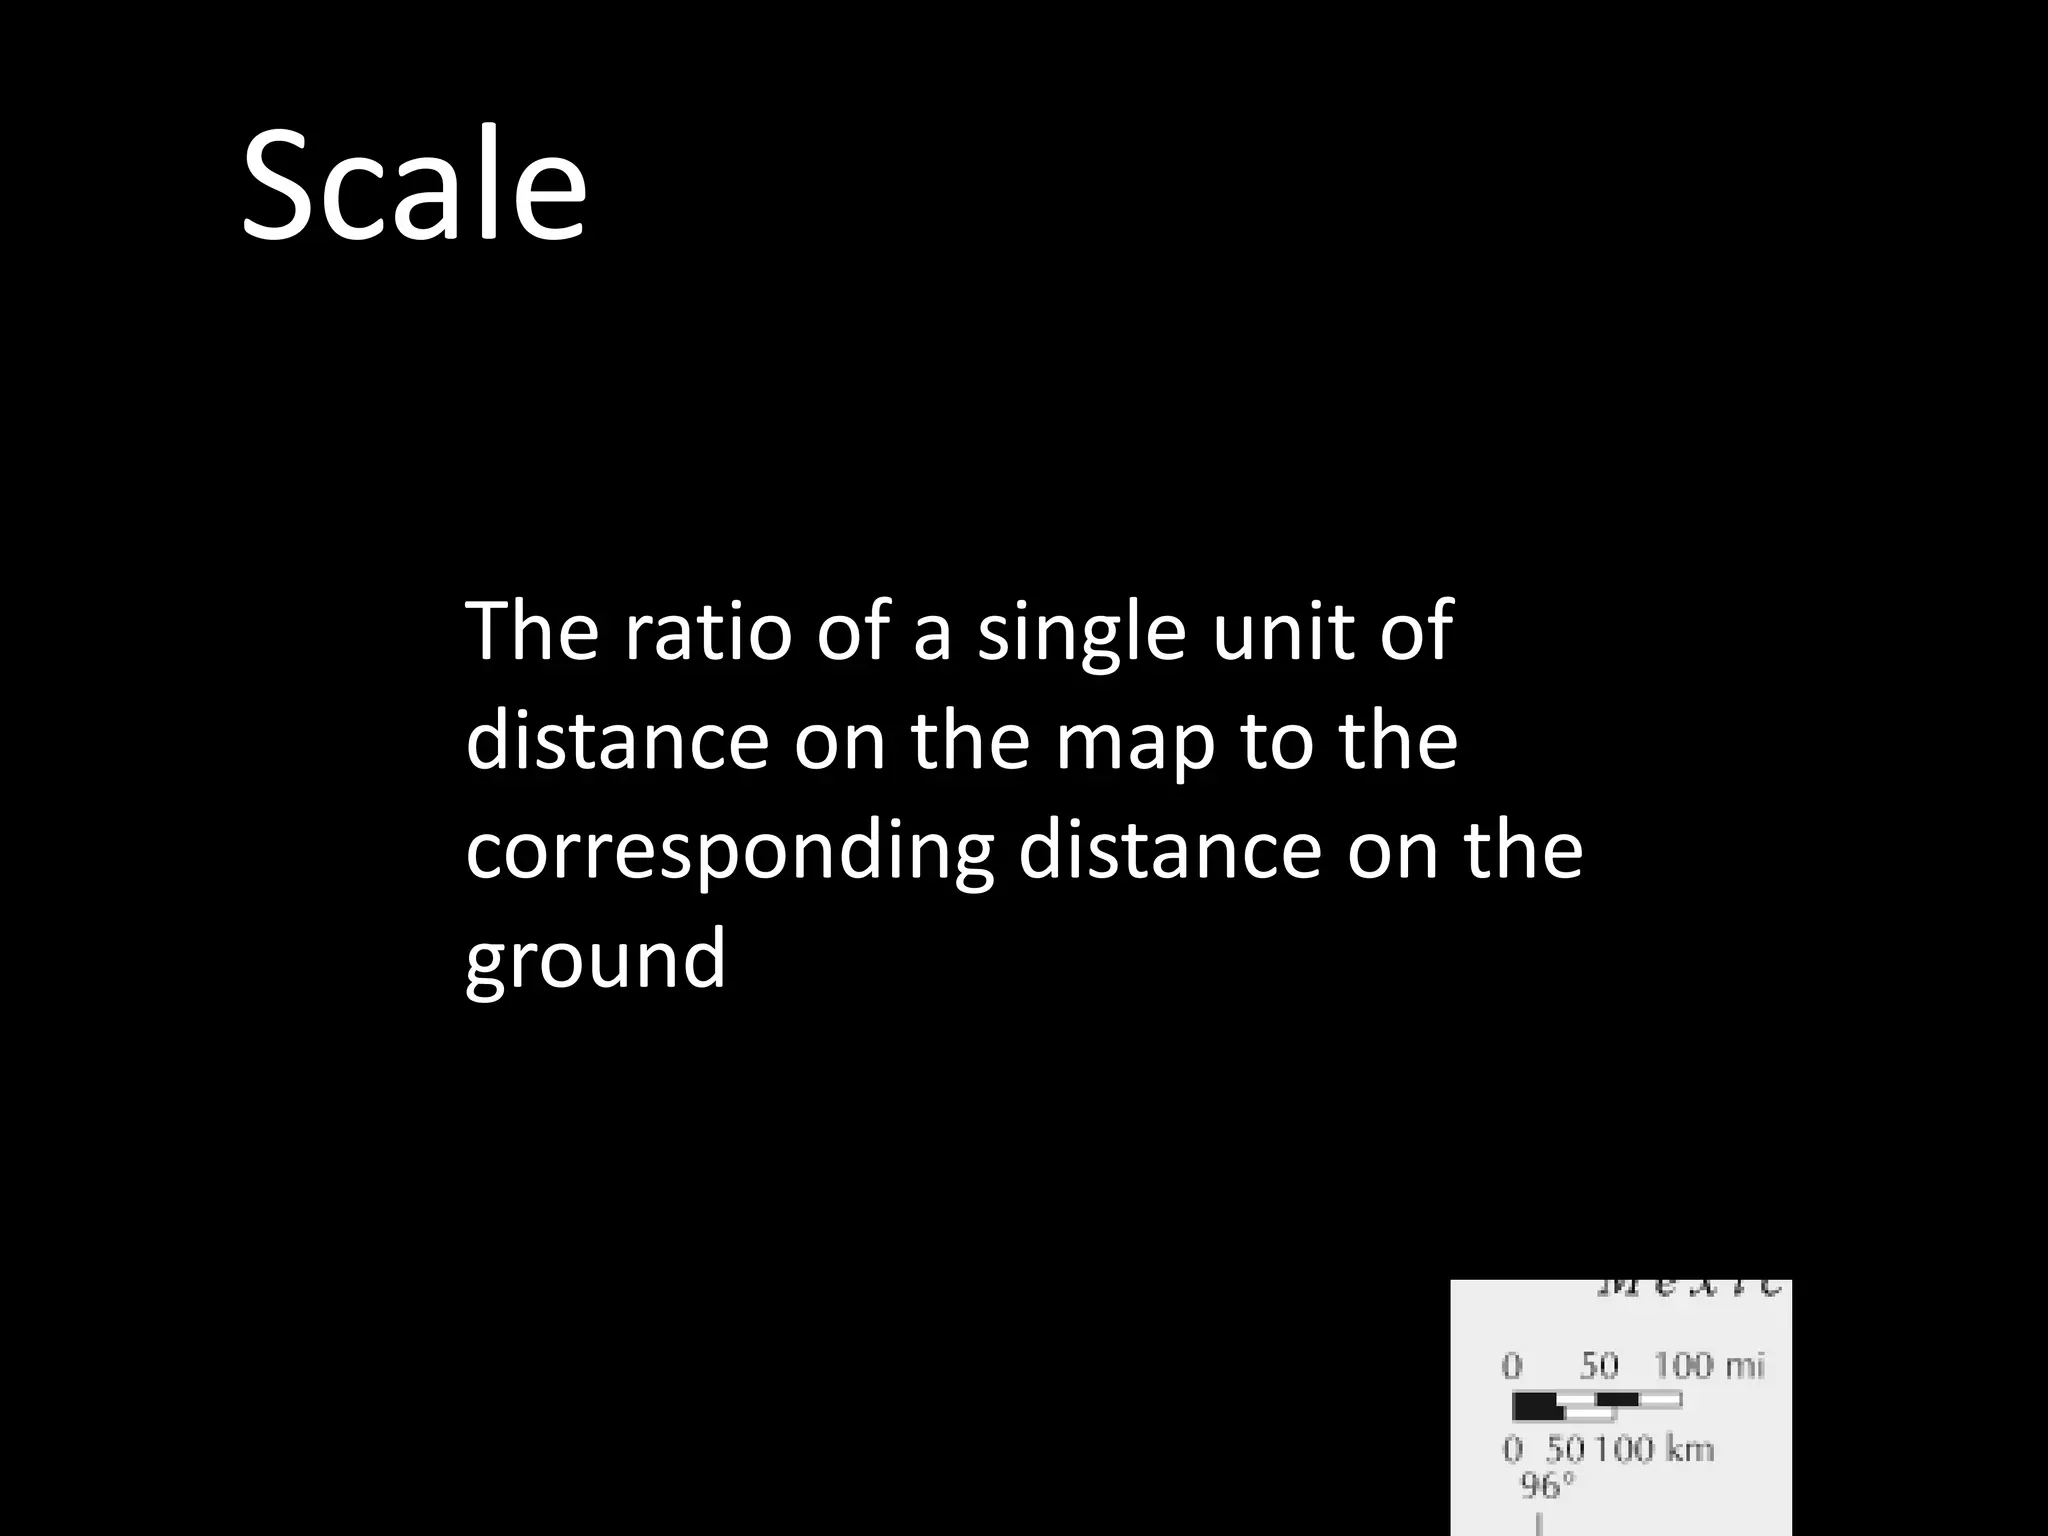
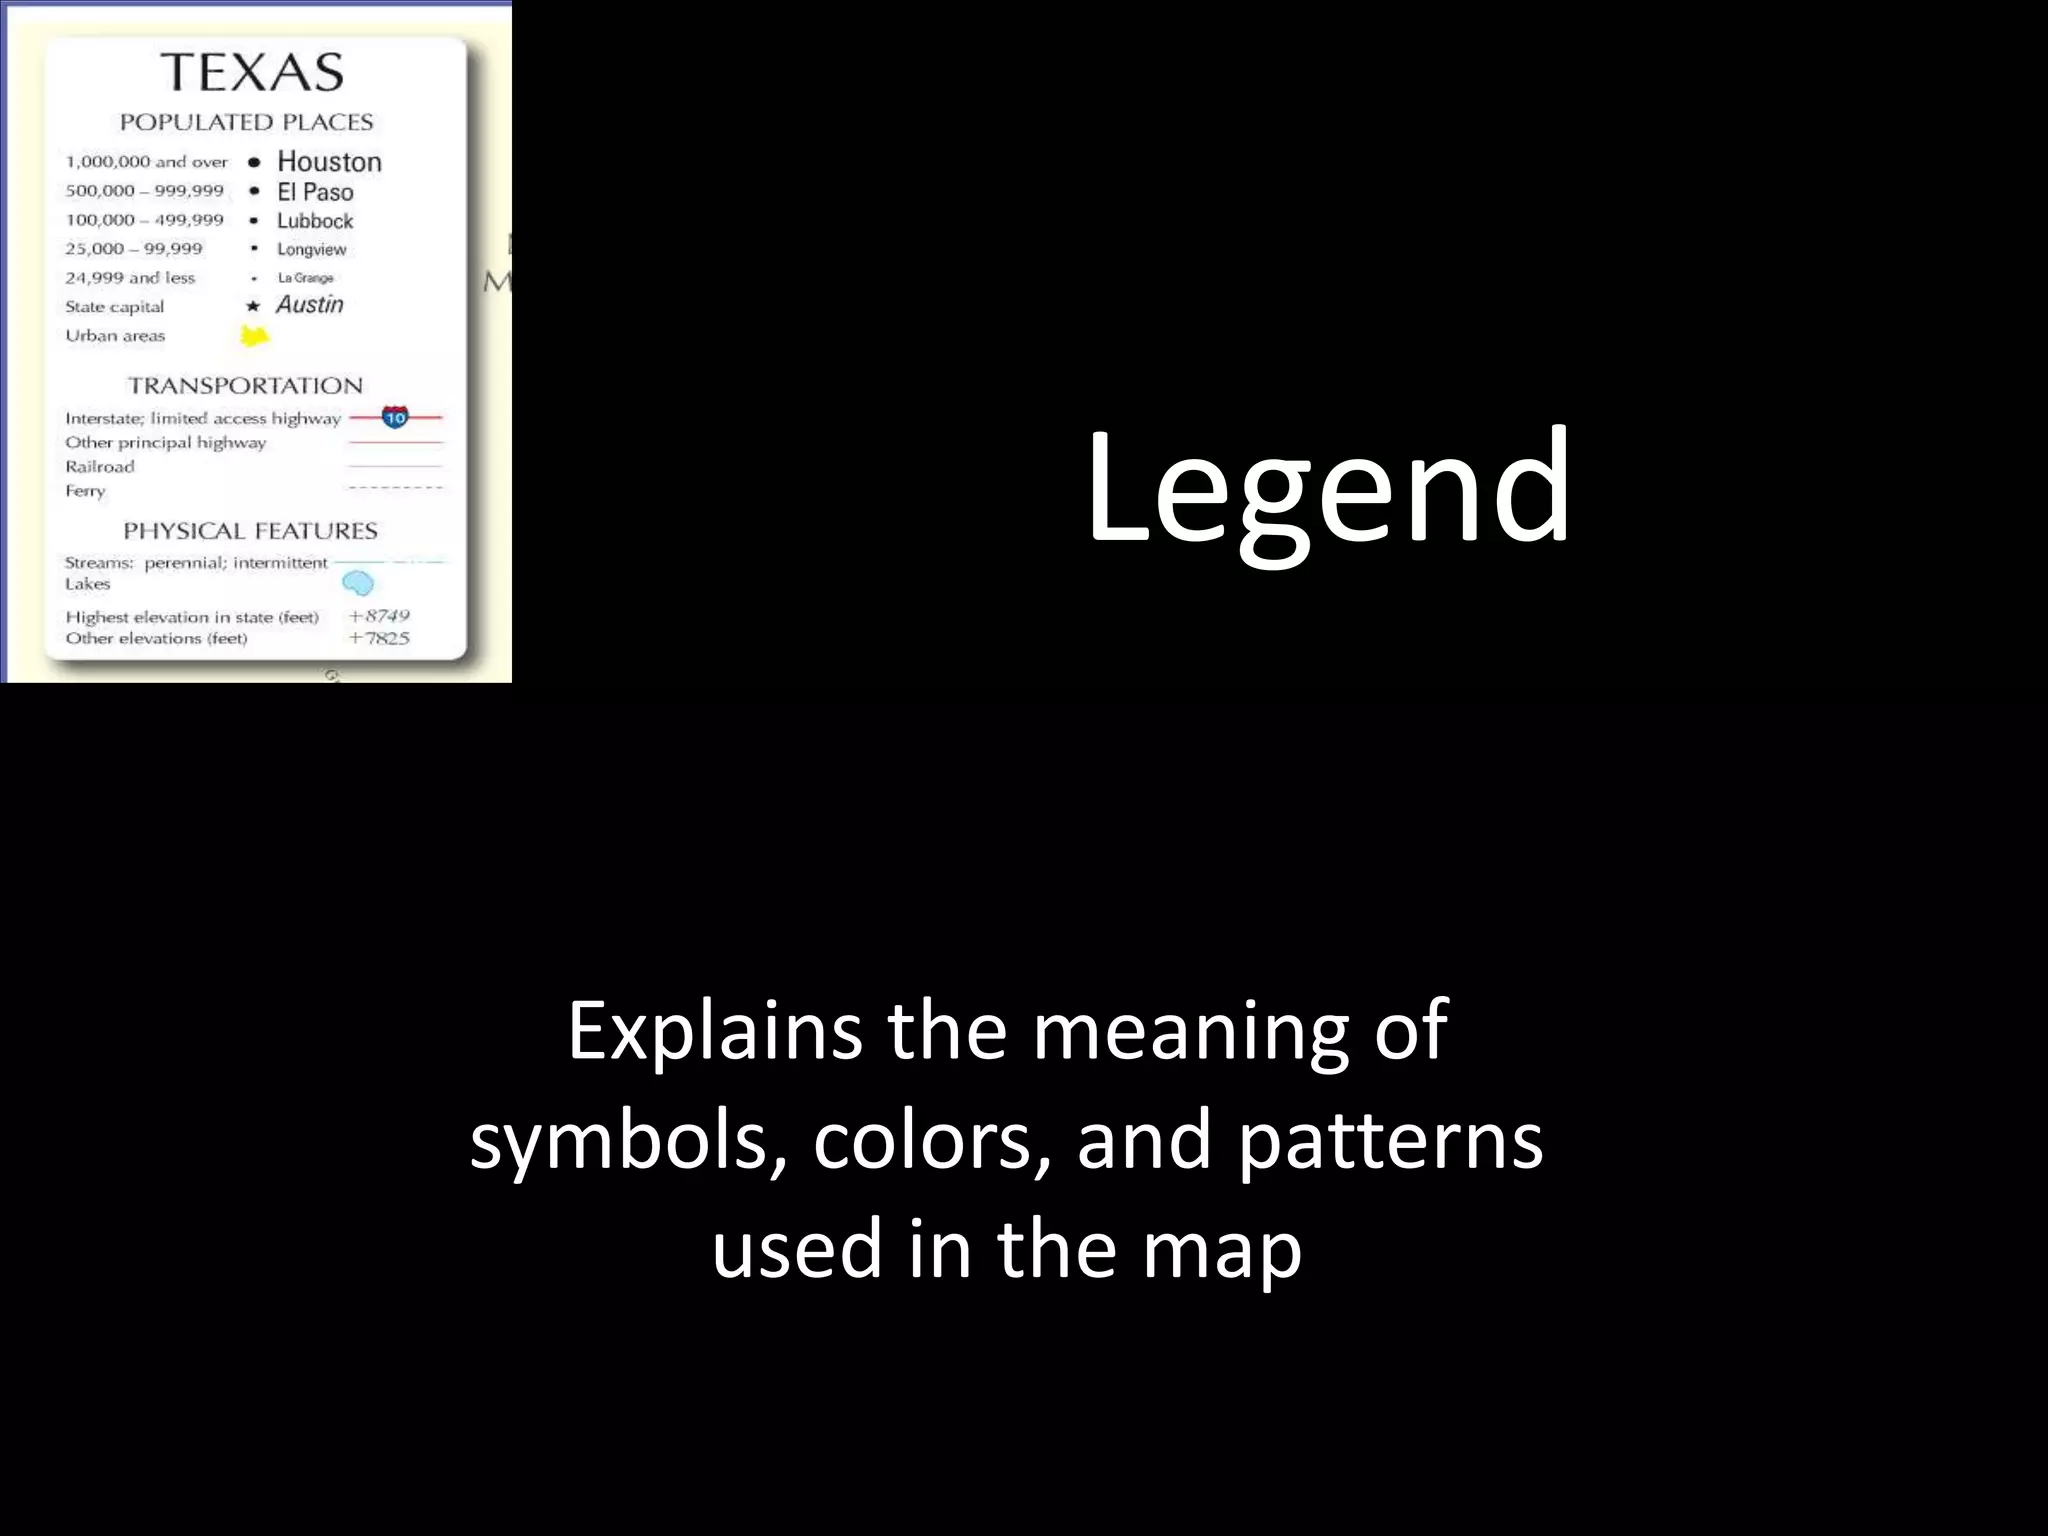
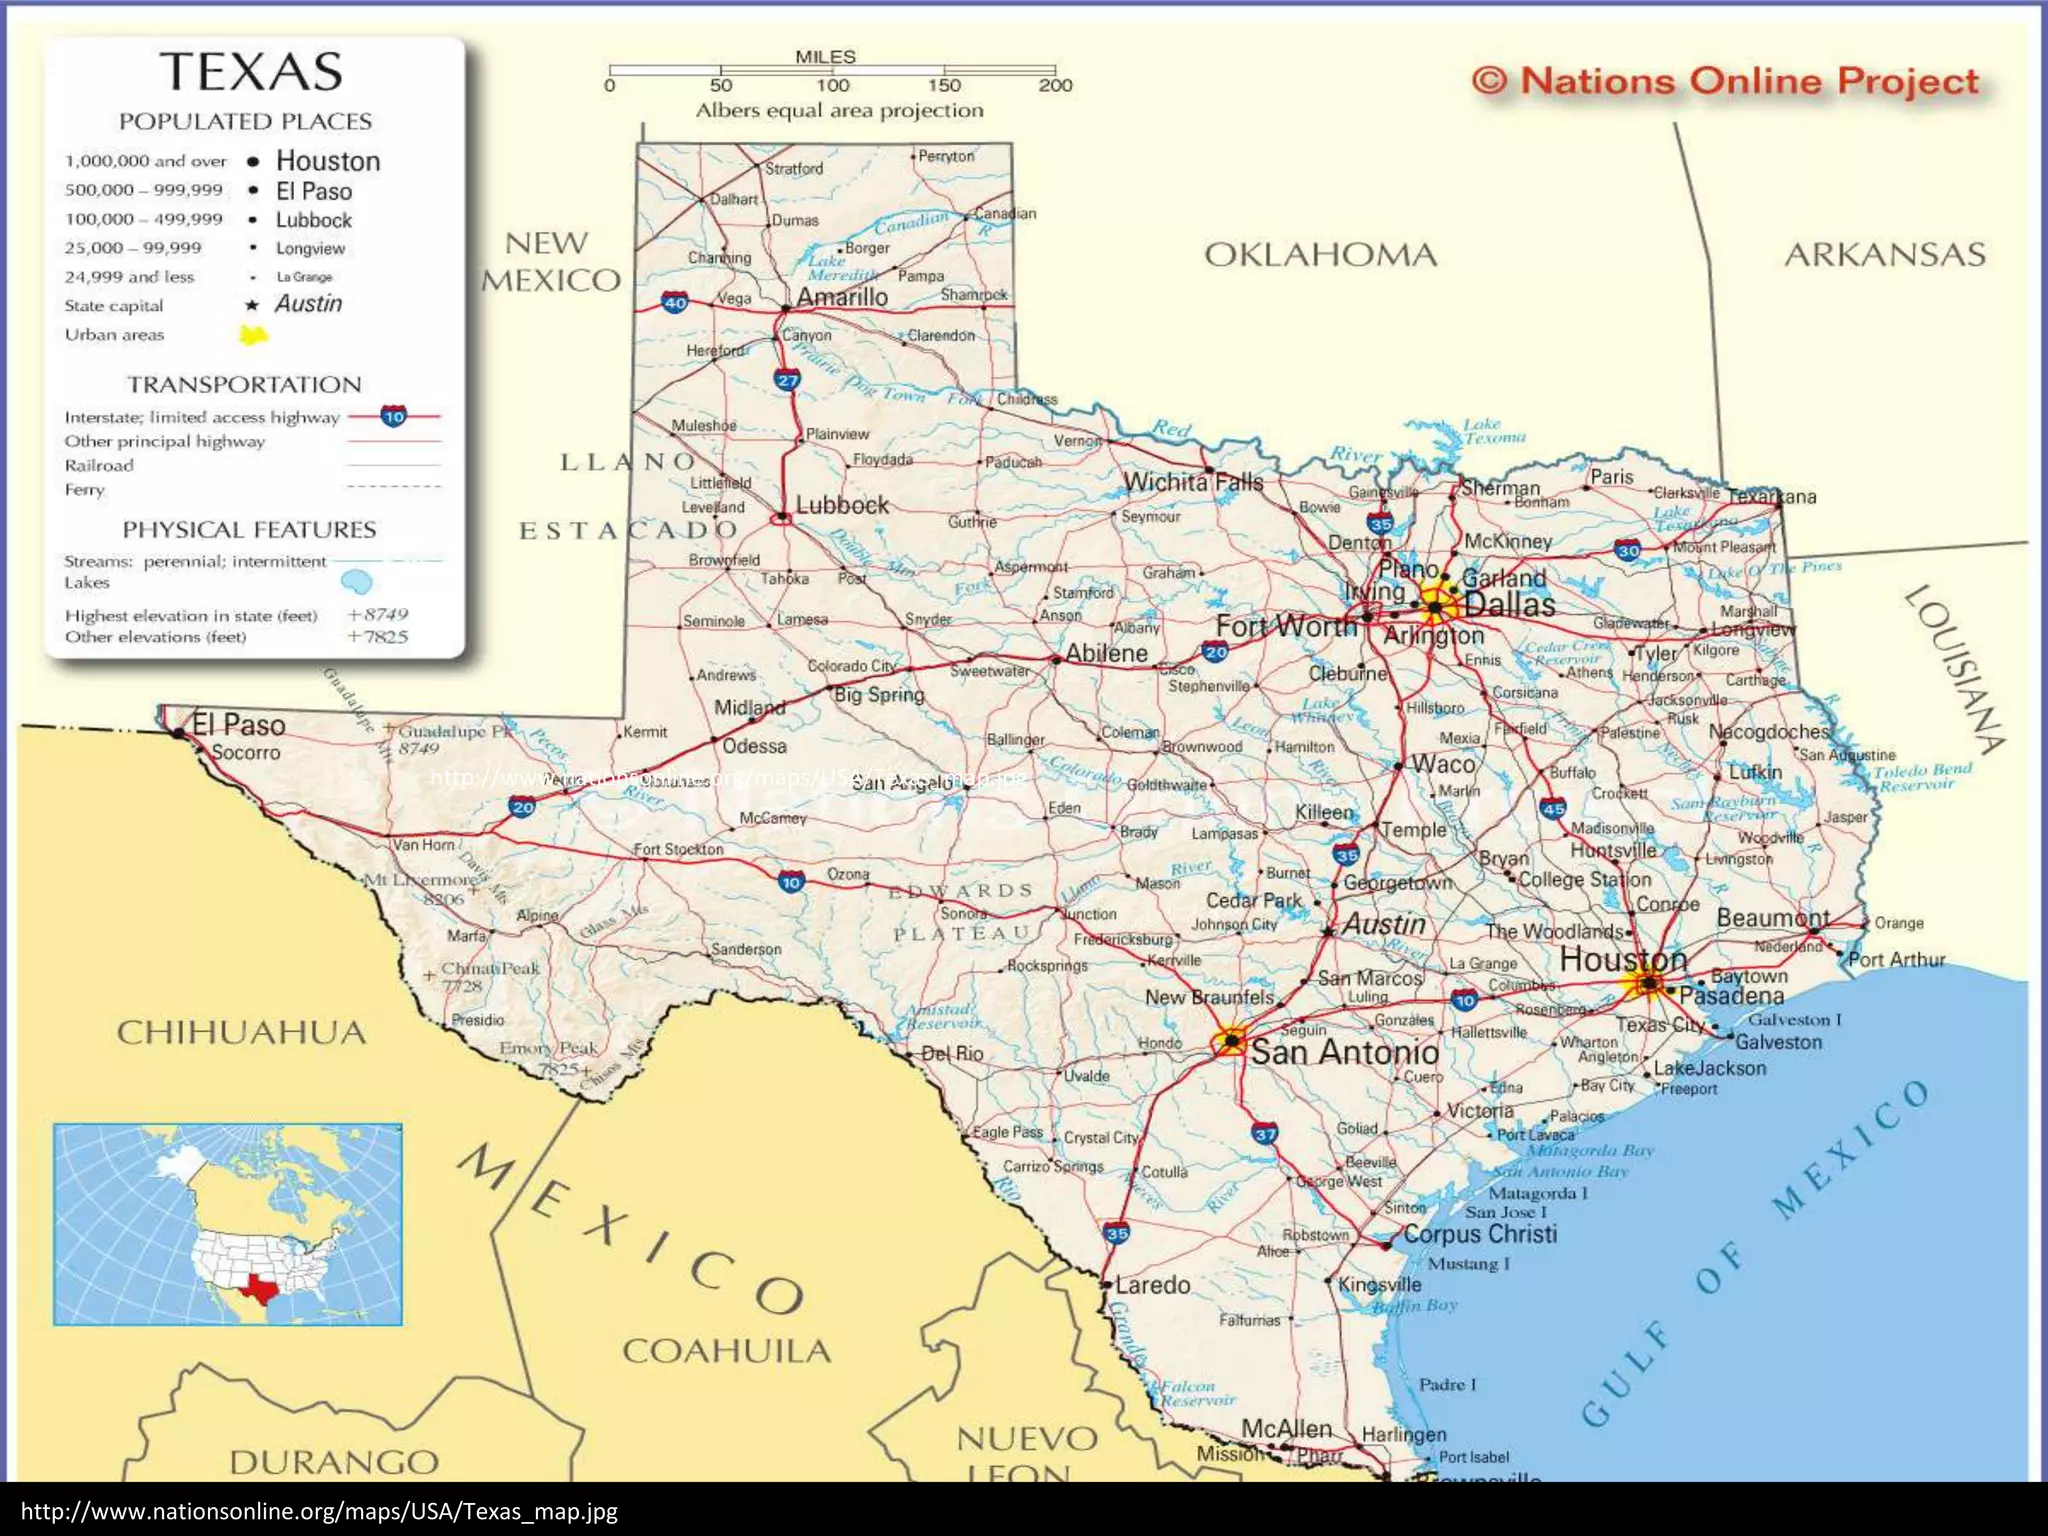
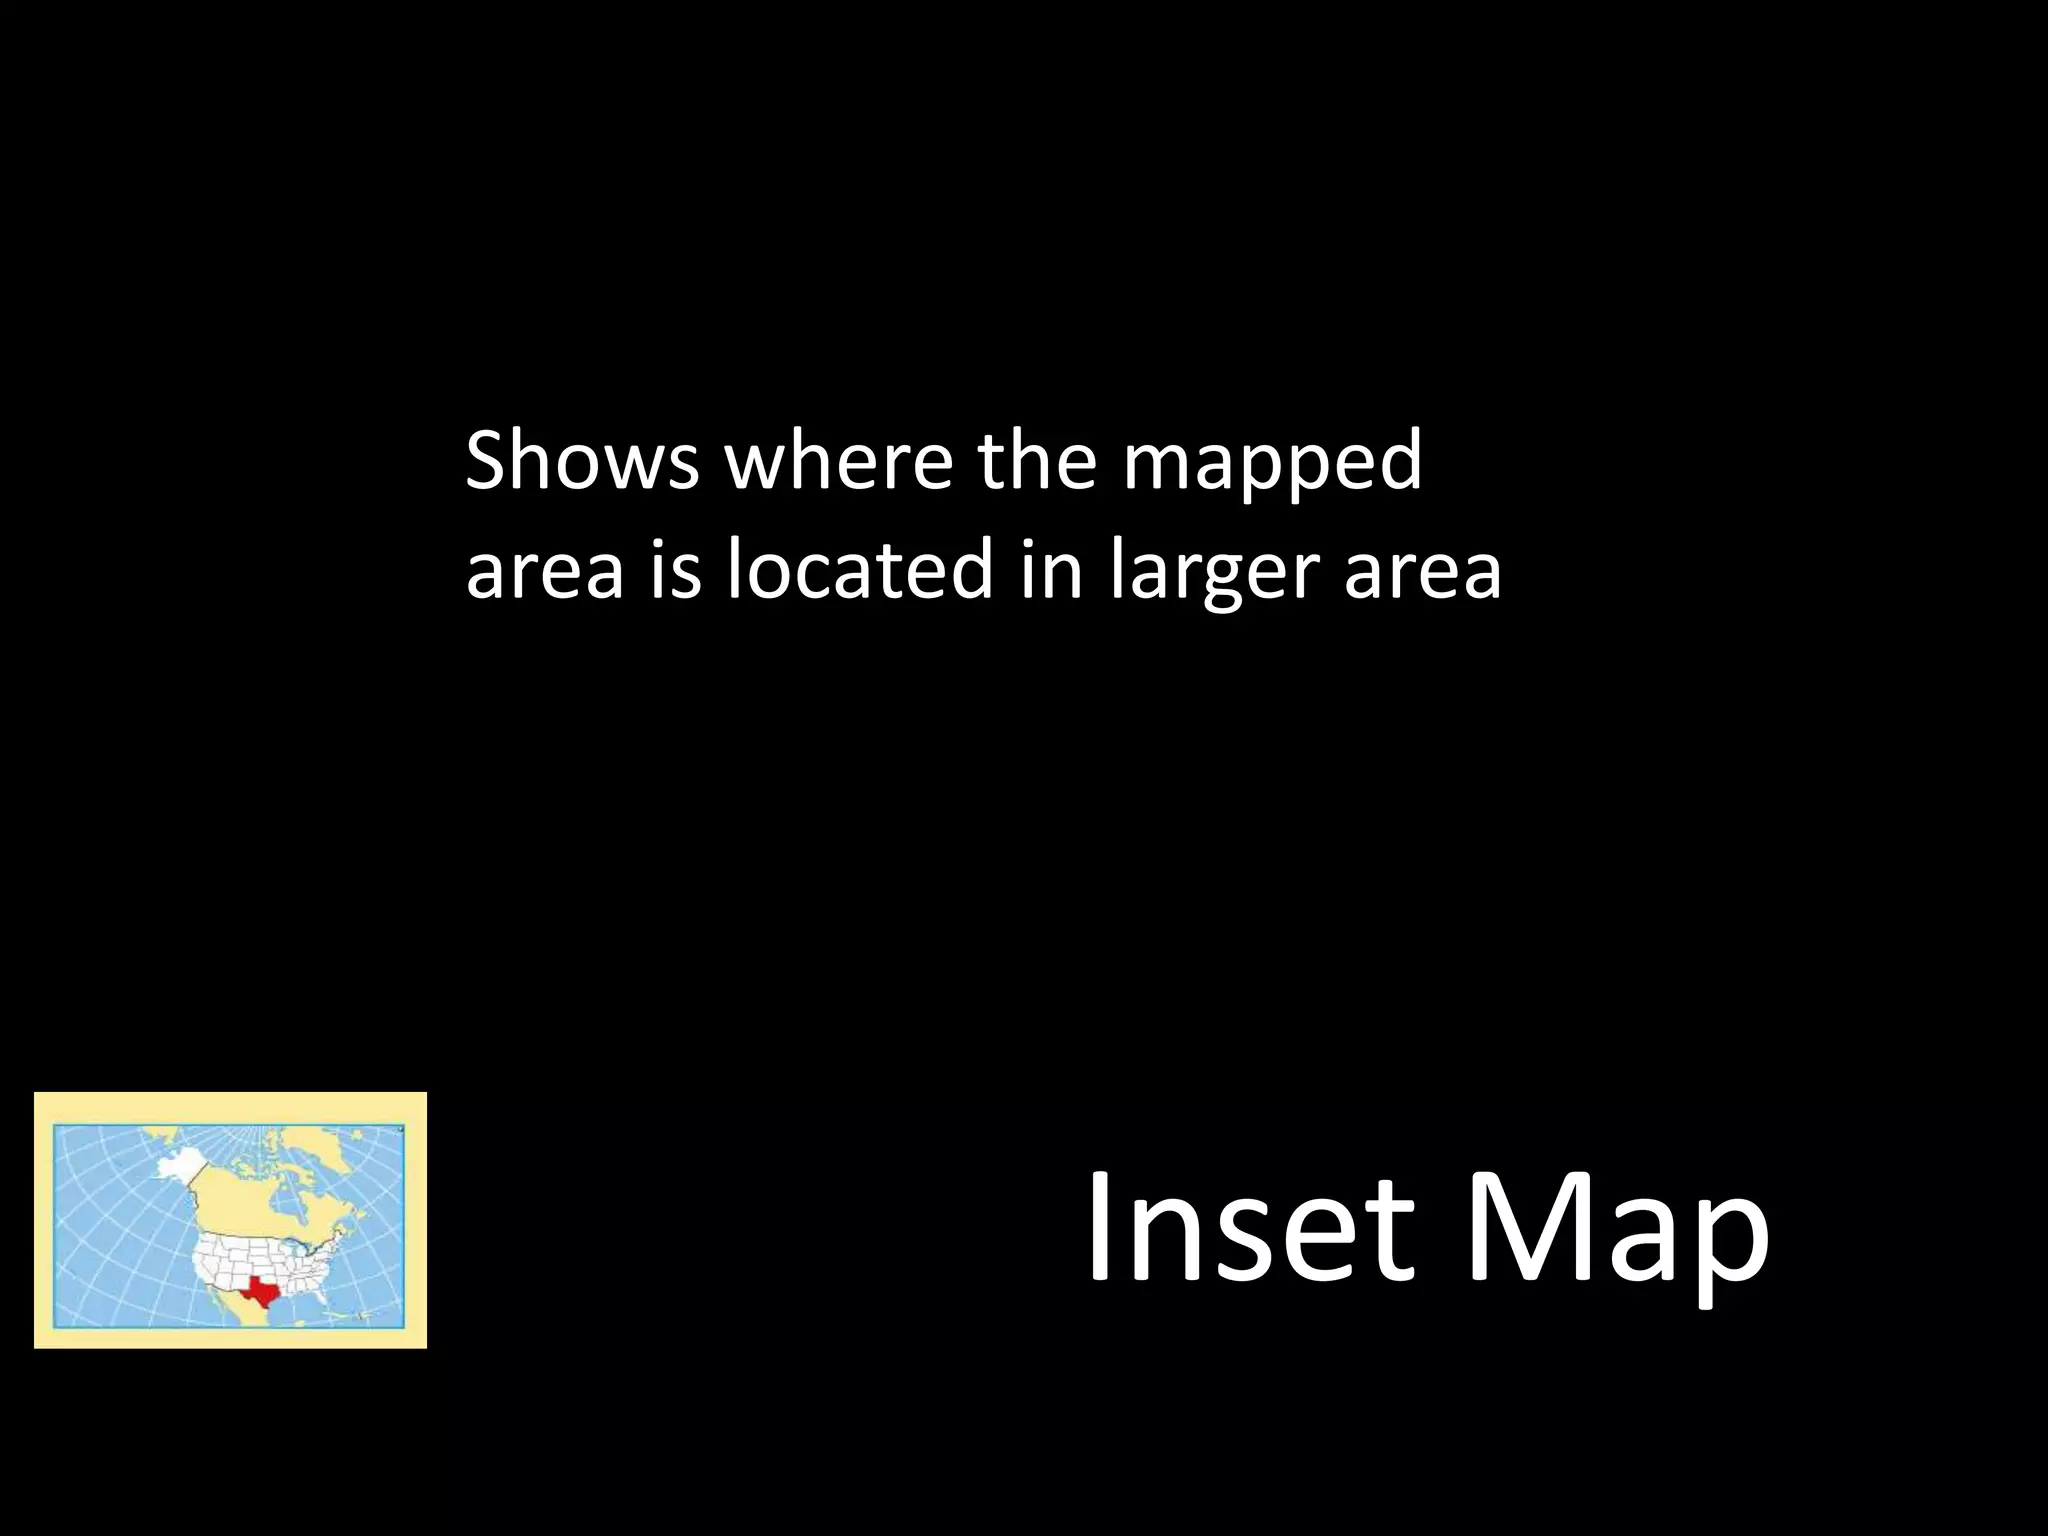
Paper presented in the research methodology workshop. The error if any is regretted and suggestions most welcome. Good for students and researchers alike, enjoy.
This is a presentation for a staff luncheon. The topic is on geographic resources located in our library. This is to help inform staff of what materials are available to them and to library users.
There are many different types of maps that serve various purposes and represent different features. The document discusses 8 main types of maps: political maps show boundaries, physical maps depict terrain, topographic maps use contour lines for elevation, climatic maps illustrate climate zones, economic maps represent natural resources and industry, road maps are for navigation, maps use latitude and longitude grids to locate places precisely on Earth, and the "best map" leads directly to one's home. Maps are tailored according to their objectives and allow people to visualize and understand spaces in various meaningful ways.
The Map, Map Reading and Principles of Geography - World TourismCris dela Peña
Maps are the basic tools of the travel professional. Without them, it is next to impossible to locate cities or countries one may have never heard about. Bienvenido G. Claravall.
Message me if you want to have a copy of this presentation. Thanks.
This presentation will help our young geographers who are on the verge of understanding geographical skills and how do different maps help them to understand different features of the Earth and the area where they live.
Maps help describe and understand relative location by showing where things are in relation to each other. Key features of maps include scales, which show distance relationships; keys or legends, which explain symbols; compass roses, which indicate cardinal directions; and symbols, which represent actual places. Understanding these components helps one interpret maps and use them to navigate between locations.
Presentation suitable for Year 9 Geography, first lesson of map skills: definition of the maps, types of maps, political map, physical map, weather map, aerial map, resources map, road map, climatic map and topographic map. Examples from New Zealand.
There are several types of maps that illustrate different information. Political maps show state and national boundaries as well as capital and major cities. Physical maps depict physical features like mountains, rivers, and lakes using colors to represent elevation. Resource maps indicate the natural resources or economic activities that dominate an area using symbols. Climate maps provide general climate and precipitation information using colors to represent zones. Topographic maps use contour lines to show land elevation and slope with closer lines indicating steeper slopes. Thematic maps focus on a specific subject like population, languages, or income through the use of data.
A thematic map is a type of map that focuses on displaying information about a single theme or topic within a geographic area. Thematic maps emphasize specific distributions of phenomena, such as climate, population density, or other social, economic, or agricultural aspects. They show variations and relationships of geographic elements by using symbols instead of focusing on base map details. The purpose is to tell a story about places by mapping spatial patterns rather than just showing where locations are.
This document provides an overview of different types of geographical reference sources and tools. It defines gazetteers as dictionaries of geographic names that include location information. Free online gazetteers from the US and world Census are described. Guidebooks are defined as handbooks providing travel information for specific locations. Atlases are collections of maps with indexes, and examples of print versus online atlases are discussed. The document also covers map reading skills, resources for teaching those skills, and using GPS technology for geocaching activities.
Geographical sources include maps, atlases, globes, gazetteers, and travel guides. They provide location information about places, their physical features, and distances. Librarians use geographical sources to answer questions on current events, recreation, business, and history. They are useful resources for ready reference, research, and location finding. Common types of geographical sources are general maps, thematic maps, road atlases, general atlases, subject atlases, globes, locational gazetteers, and descriptive gazetteers.
This document defines and describes several types of maps, including political maps that show boundaries between states and countries, physical maps that highlight natural features like mountains and rivers, relief maps that use shading to show elevation differences, elevation maps that use colors to indicate ranges of elevation, road maps that display routes and transportation information, and historical maps that illustrate how places appeared in the past or changed over time.
This document describes six different types of maps: physical maps, political maps, climate maps, economic/resource maps, road maps, and topographic maps. Physical maps show terrain features, political maps boundaries and cities, climate maps show climate zones, economic maps show natural resources and industries, road maps include major transportation routes, and topographic maps use lines to indicate land elevations. Examples of each map type are also provided.
What is a map- Introduction to Map Skills Presentationesample458
This document discusses different types of maps and their purposes. It explains that globes show the Earth as seen from space, with continents and oceans, while maps show the Earth on a flat surface so they can be carried. Maps contain elements like titles, legends, compass roses and scales. The document describes political, physical and other types of maps, and how grid systems of latitude and longitude allow precise locations to be identified using coordinates.
This document discusses maps and their key components. It defines maps as two-dimensional representations of areas drawn to scale. Globes are defined as sphere shaped models of the Earth. Continents are the seven large land masses, including countries, that make up the Earth. Oceans are large bodies of water like the Pacific. The document provides tasks for labeling a blank map of the world with continents and oceans, and completing a physical map of China by shading and labeling upland areas, seas, rivers, and bordering countries.
This document provides an overview of different types of geographic reference sources including gazetteers, atlases, guidebooks, and online mapping resources. It discusses what gazetteers and atlases are and provides examples of free and paid online gazetteers and atlases. It also covers map reading skills and how GPS technologies can be used for educational activities like geocaching.
This document discusses the key elements of maps, including latitude and longitude, hemispheres, directions, scale, and legends. It explains that latitude lines run east-west and longitude lines run north-south. The equator is the 0 degree latitude line and the prime meridian is the 0 degree longitude line. Maps use these lines to divide the world into four hemispheres and show cardinal and intermediate directions. Scale relates measurements on a map to actual distances. Time zones correspond to longitude, and legends provide keys to symbols on maps.
The document defines maps and their key components. It discusses the main types of maps, including political, physical, weather, road, and climatic maps. It explains that the Earth is divided into lines of latitude and longitude that are used to locate positions. Latitude lines run east to west and are parallel, while longitude lines run north to south and converge at the poles. The main features of maps, such as the equator, hemispheres, prime meridian, parallels, and meridians are outlined.
This document provides an overview of common map types and key map elements:
1) It describes several common types of maps including general reference maps, projection maps, charting maps, topical maps, and cartograms. It also highlights topographic maps, which show elevation and physical features.
2) It explains basic geographic elements including hemispheres defined by the equator and prime meridian, as well as cardinal directions shown on compasses.
3) It notes that maps use scales to relate distances on maps to actual distances, and that legends provide keys to symbols and colors used on maps.
There are several types of map projections that are used to represent the spherical Earth on a flat surface. All map projections involve some degree of distortion of shapes, sizes, or distances. The Mercator projection increasingly distorts distances the farther one moves from the equator, while the Robinson and Goode's interrupted projections aim to minimize distortion of landmasses. Other map features discussed include hemispheres, latitude and longitude grid systems, directions, scales, and different types of thematic maps.
This document outlines the nine essential elements that make up a good map: title, orientation, date, author, legend, scale, index, grid system, and surrounding area. It explains that a title identifies what the map depicts, orientation indicates directions, the date shows when the map was made, the author is the creator, the legend decodes symbols, scale conveys distances, an index lists features, a grid system locates places, and surrounding area provides context.
Maps are diagrams that represent physical features and locations on land or sea. They have certain standard elements like a title, legend, scale, and grid system that provide important interpretive information. These elements allow the reader to understand what is being shown and how to measure or locate items on the map.
Topographic maps and satellite views are used to interpret landforms and predict how erosion may change them over time. Cartographers create topographic maps using data from aerial photos and satellites, which photograph the Earth's surface. Topographic maps model the three-dimensional landscape using contour lines that connect points of equal elevation, with closer lines indicating steeper slopes. Contour lines never cross and show the shape and elevation of an area.
This document discusses how maps help us understand the world and what information they can convey. It explains that maps show geographic and political features, and can include additional details like roads, structures, landforms and more. It also outlines some key elements of maps, such as the grid system used to locate places, the legend that provides the map's symbols, and other reference points like the equator, prime meridian and compass rose that help orient the map. Physical maps depict geographic features while political maps show borders and boundaries.
Maps are useful tools for plotting locations of places and objects. They can mark roads, subways, parks, crops, weather reports, wind direction, and rainfall. Maps ease the process of viewing the entire world on paper. Since ancient times, maps have been useful for depicting boundaries of land, water, and other natural resources on Earth. Asia map powerpoint provides a view of the most populous continent, Asia, which comprises 30% of the world's land area and 60% of the human population. It illustrates geographical, topographical, climatic, and historical details about Asia in an effective way. The map includes details that can be useful for disaster management and understanding racial diversity.
Geography map skill (all you need to know)jamesadam2001
This document provides an overview of key map skills, including compass directions, scale, grid references, contour lines, symbols, and measuring distance. It explains that a map shows features of a place and uses lines of longitude and latitude to form a grid reference system. Contour lines are used to represent height or elevation since maps cannot display three-dimensional terrain. Symbols simplify features and a map scale allows measurement of real-world distances based on the scale ratio. Measuring distance involves using a scale to determine real-world lengths between two points on a map.
The document defines key vocabulary terms used in map and globe skills, including the equator, prime meridian, hemispheres, tropics of cancer and capricorn, absolute and relative location, latitude and longitude, parallels and meridians, types of maps, compass rose, cardinal and intermediate directions, and map scale.
GEOGRAPHIC SKILLS: FLOW-LINE MAPS.
Flow maps typically use lines to show the movement of people and goods between various locations. The lines are varied in width to represent the quantity of flow.
This presentation was provided by Rebecca Benner, Ph.D., of the American Society of Anesthesiologists, for the second session of NISO's 2024 Training Series "DEIA in the Scholarly Landscape." Session Two: 'Expanding Pathways to Publishing Careers,' was held June 13, 2024.
This document provides an overview of wound healing, its functions, stages, mechanisms, factors affecting it, and complications.
A wound is a break in the integrity of the skin or tissues, which may be associated with disruption of the structure and function.
Healing is the body’s response to injury in an attempt to restore normal structure and functions.
Healing can occur in two ways: Regeneration and Repair
There are 4 phases of wound healing: hemostasis, inflammation, proliferation, and remodeling. This document also describes the mechanism of wound healing. Factors that affect healing include infection, uncontrolled diabetes, poor nutrition, age, anemia, the presence of foreign bodies, etc.
Complications of wound healing like infection, hyperpigmentation of scar, contractures, and keloid formation.
🔥🔥🔥🔥🔥🔥🔥🔥🔥
إضغ بين إيديكم من أقوى الملازم التي صممتها
ملزمة تشريح الجهاز الهيكلي (نظري 3)
💀💀💀💀💀💀💀💀💀💀
تتميز هذهِ الملزمة بعِدة مُميزات :
1- مُترجمة ترجمة تُناسب جميع المستويات
2- تحتوي على 78 رسم توضيحي لكل كلمة موجودة بالملزمة (لكل كلمة !!!!)
#فهم_ماكو_درخ
3- دقة الكتابة والصور عالية جداً جداً جداً
4- هُنالك بعض المعلومات تم توضيحها بشكل تفصيلي جداً (تُعتبر لدى الطالب أو الطالبة بإنها معلومات مُبهمة ومع ذلك تم توضيح هذهِ المعلومات المُبهمة بشكل تفصيلي جداً
5- الملزمة تشرح نفسها ب نفسها بس تكلك تعال اقراني
6- تحتوي الملزمة في اول سلايد على خارطة تتضمن جميع تفرُعات معلومات الجهاز الهيكلي المذكورة في هذهِ الملزمة
واخيراً هذهِ الملزمة حلالٌ عليكم وإتمنى منكم إن تدعولي بالخير والصحة والعافية فقط
كل التوفيق زملائي وزميلاتي ، زميلكم محمد الذهبي 💊💊
🔥🔥🔥🔥🔥🔥🔥🔥🔥
Elevate Your Nonprofit's Online Presence_ A Guide to Effective SEO Strategies...TechSoup
Whether you're new to SEO or looking to refine your existing strategies, this webinar will provide you with actionable insights and practical tips to elevate your nonprofit's online presence.
Temple of Asclepius in Thrace. Excavation resultsKrassimira Luka
The temple and the sanctuary around were dedicated to Asklepios Zmidrenus. This name has been known since 1875 when an inscription dedicated to him was discovered in Rome. The inscription is dated in 227 AD and was left by soldiers originating from the city of Philippopolis (modern Plovdiv).