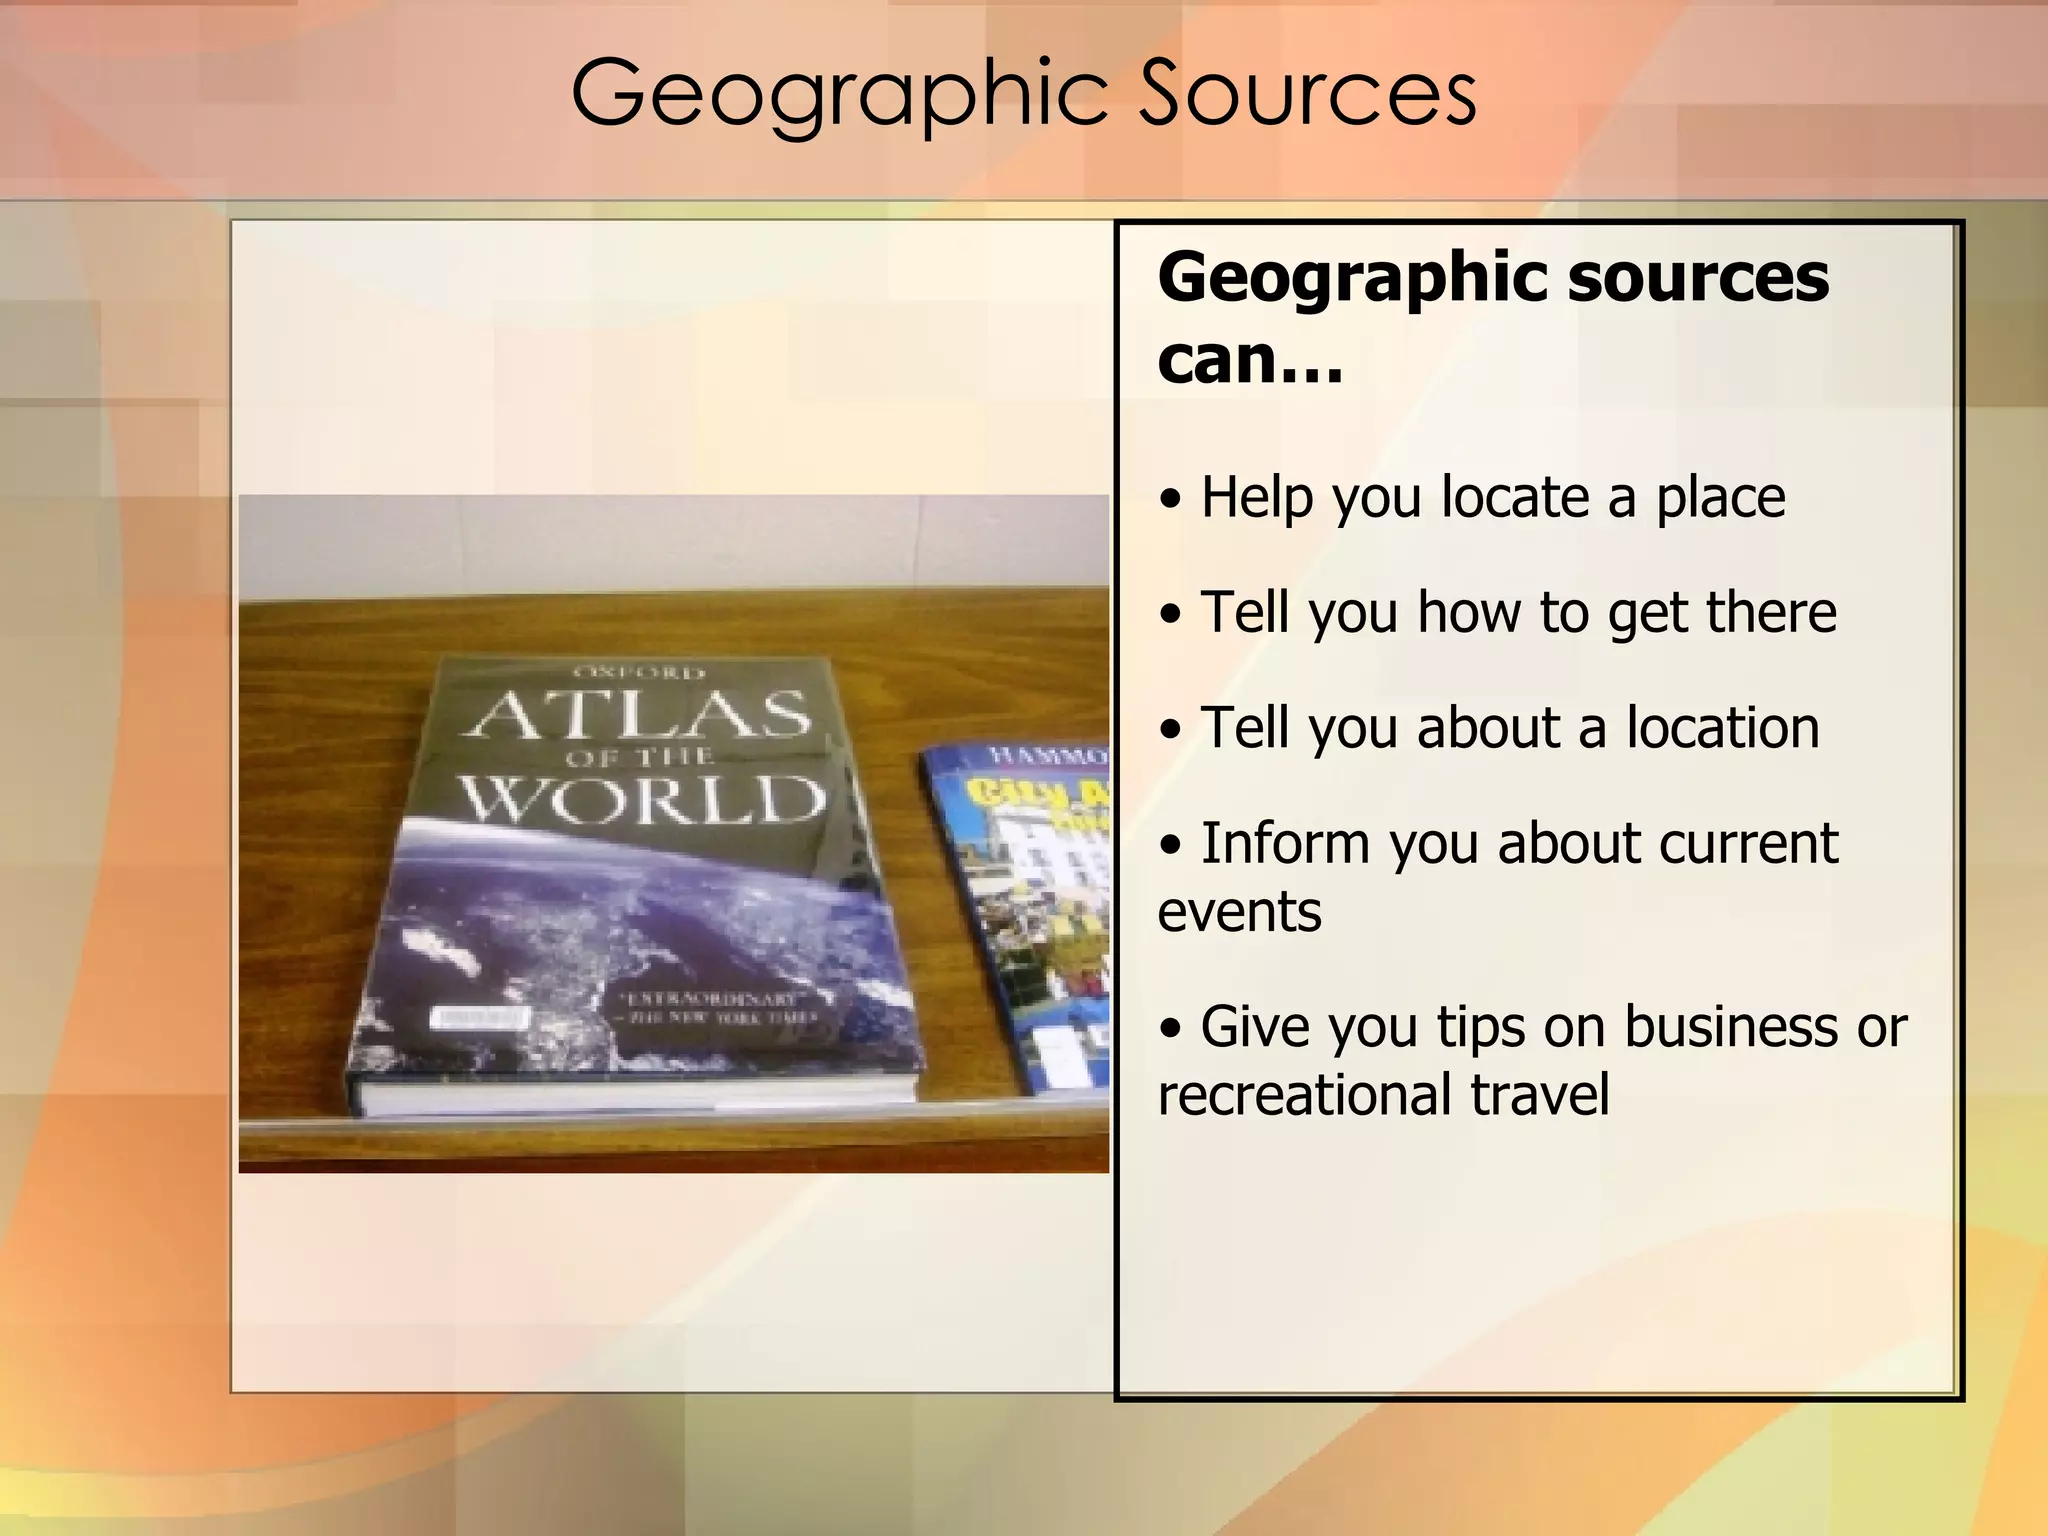
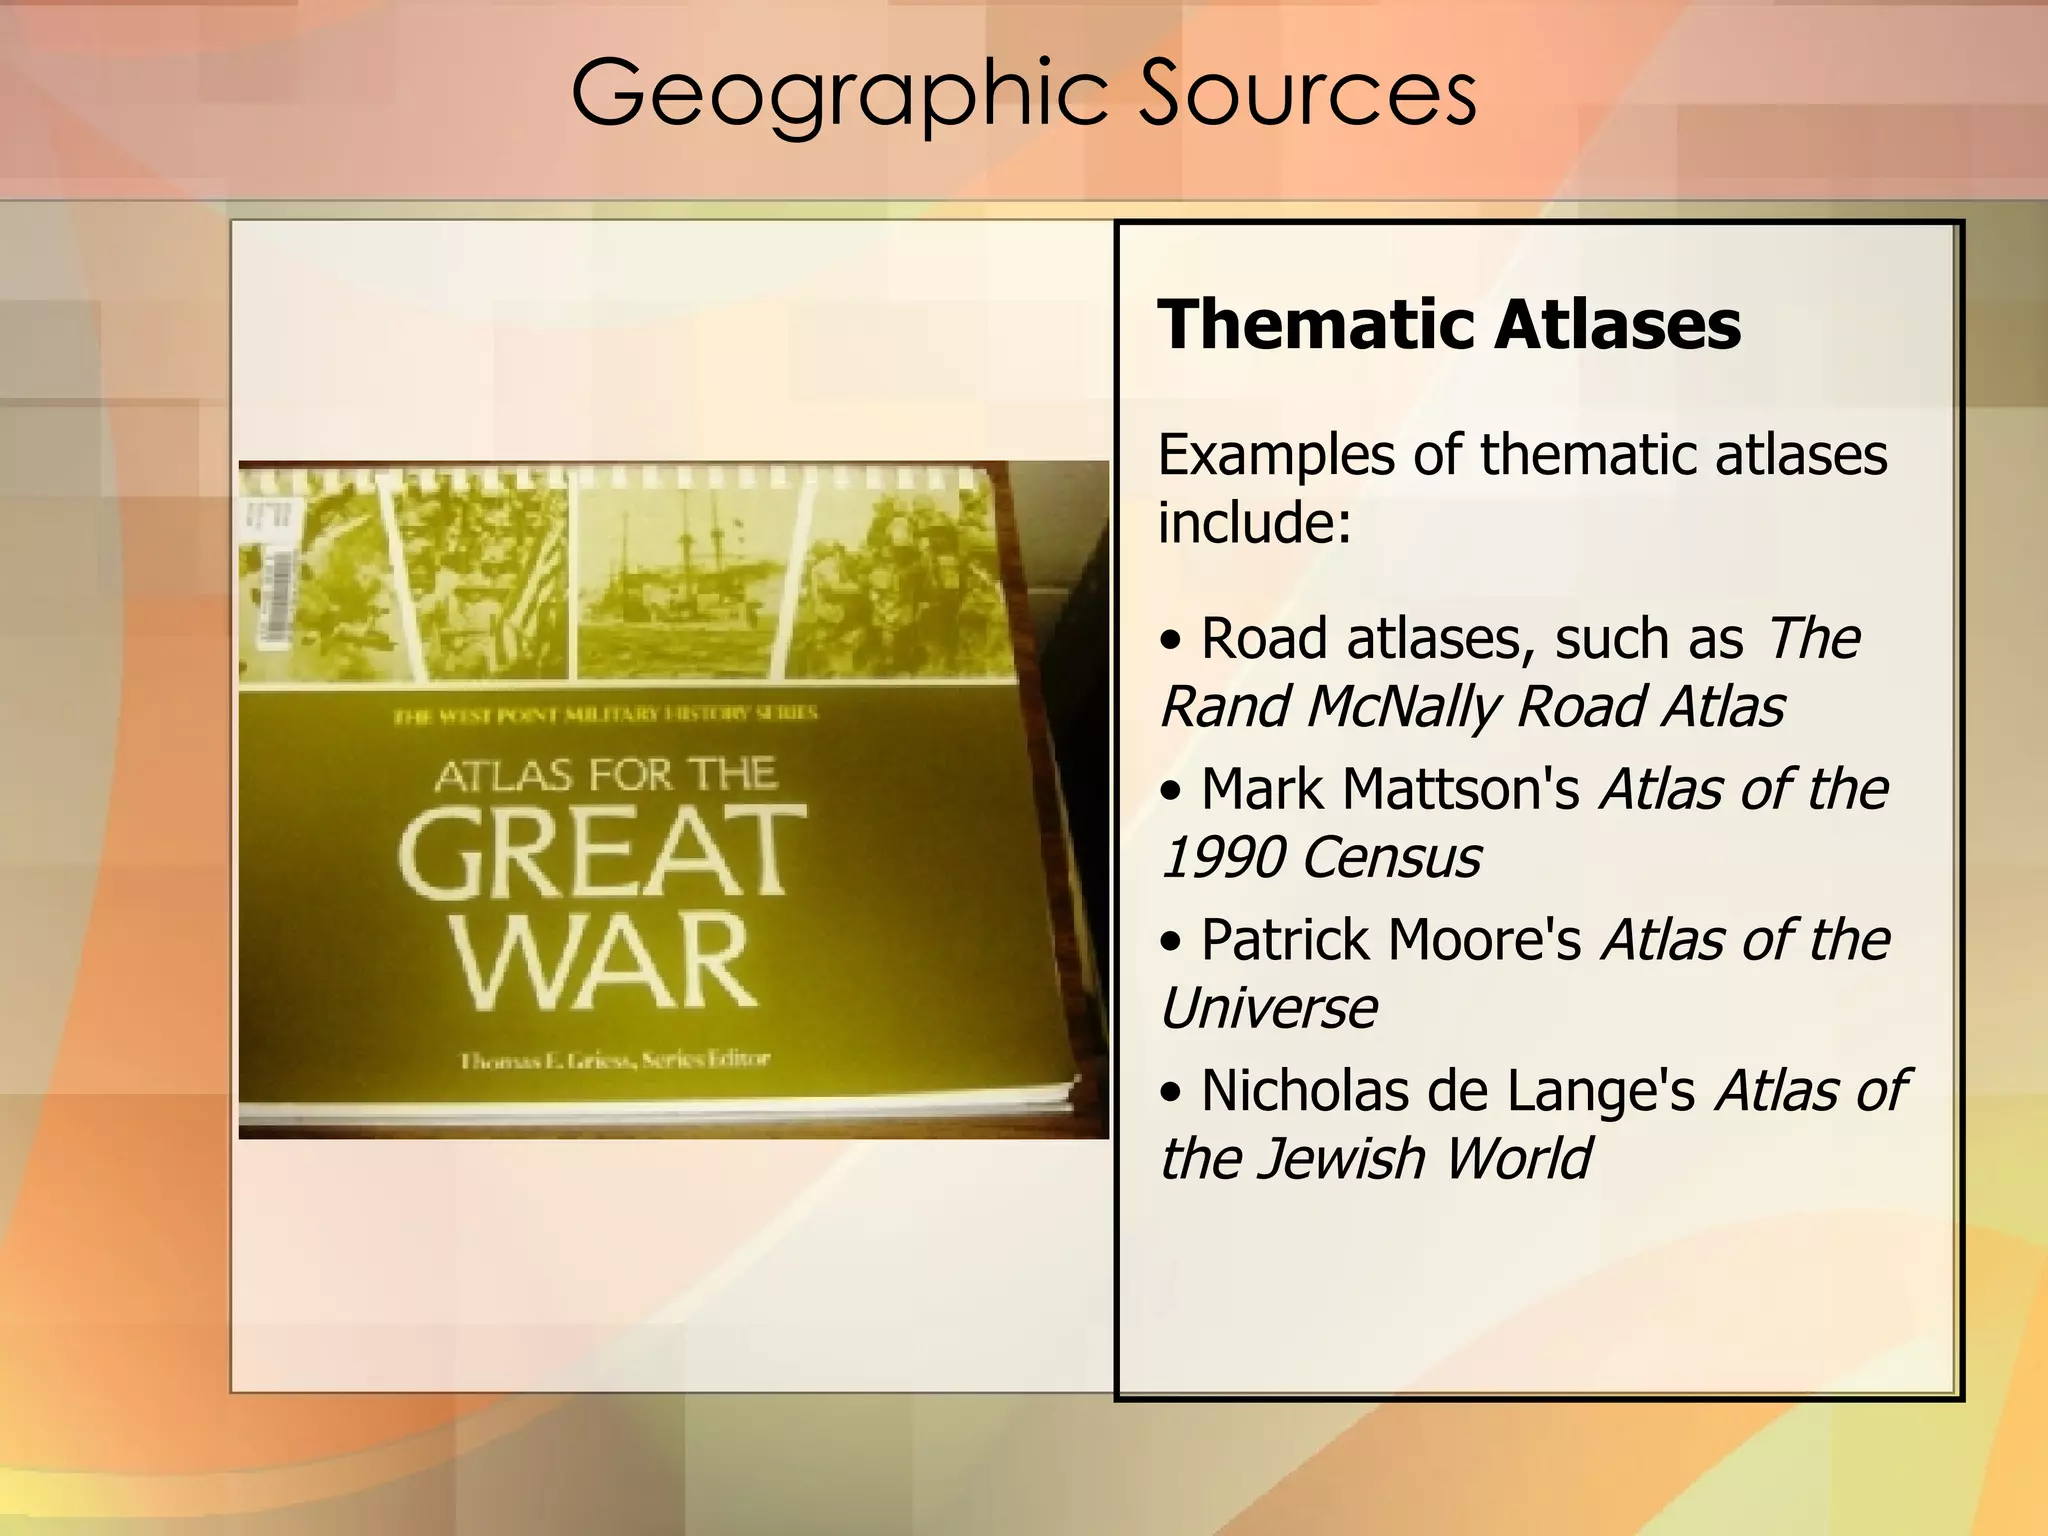
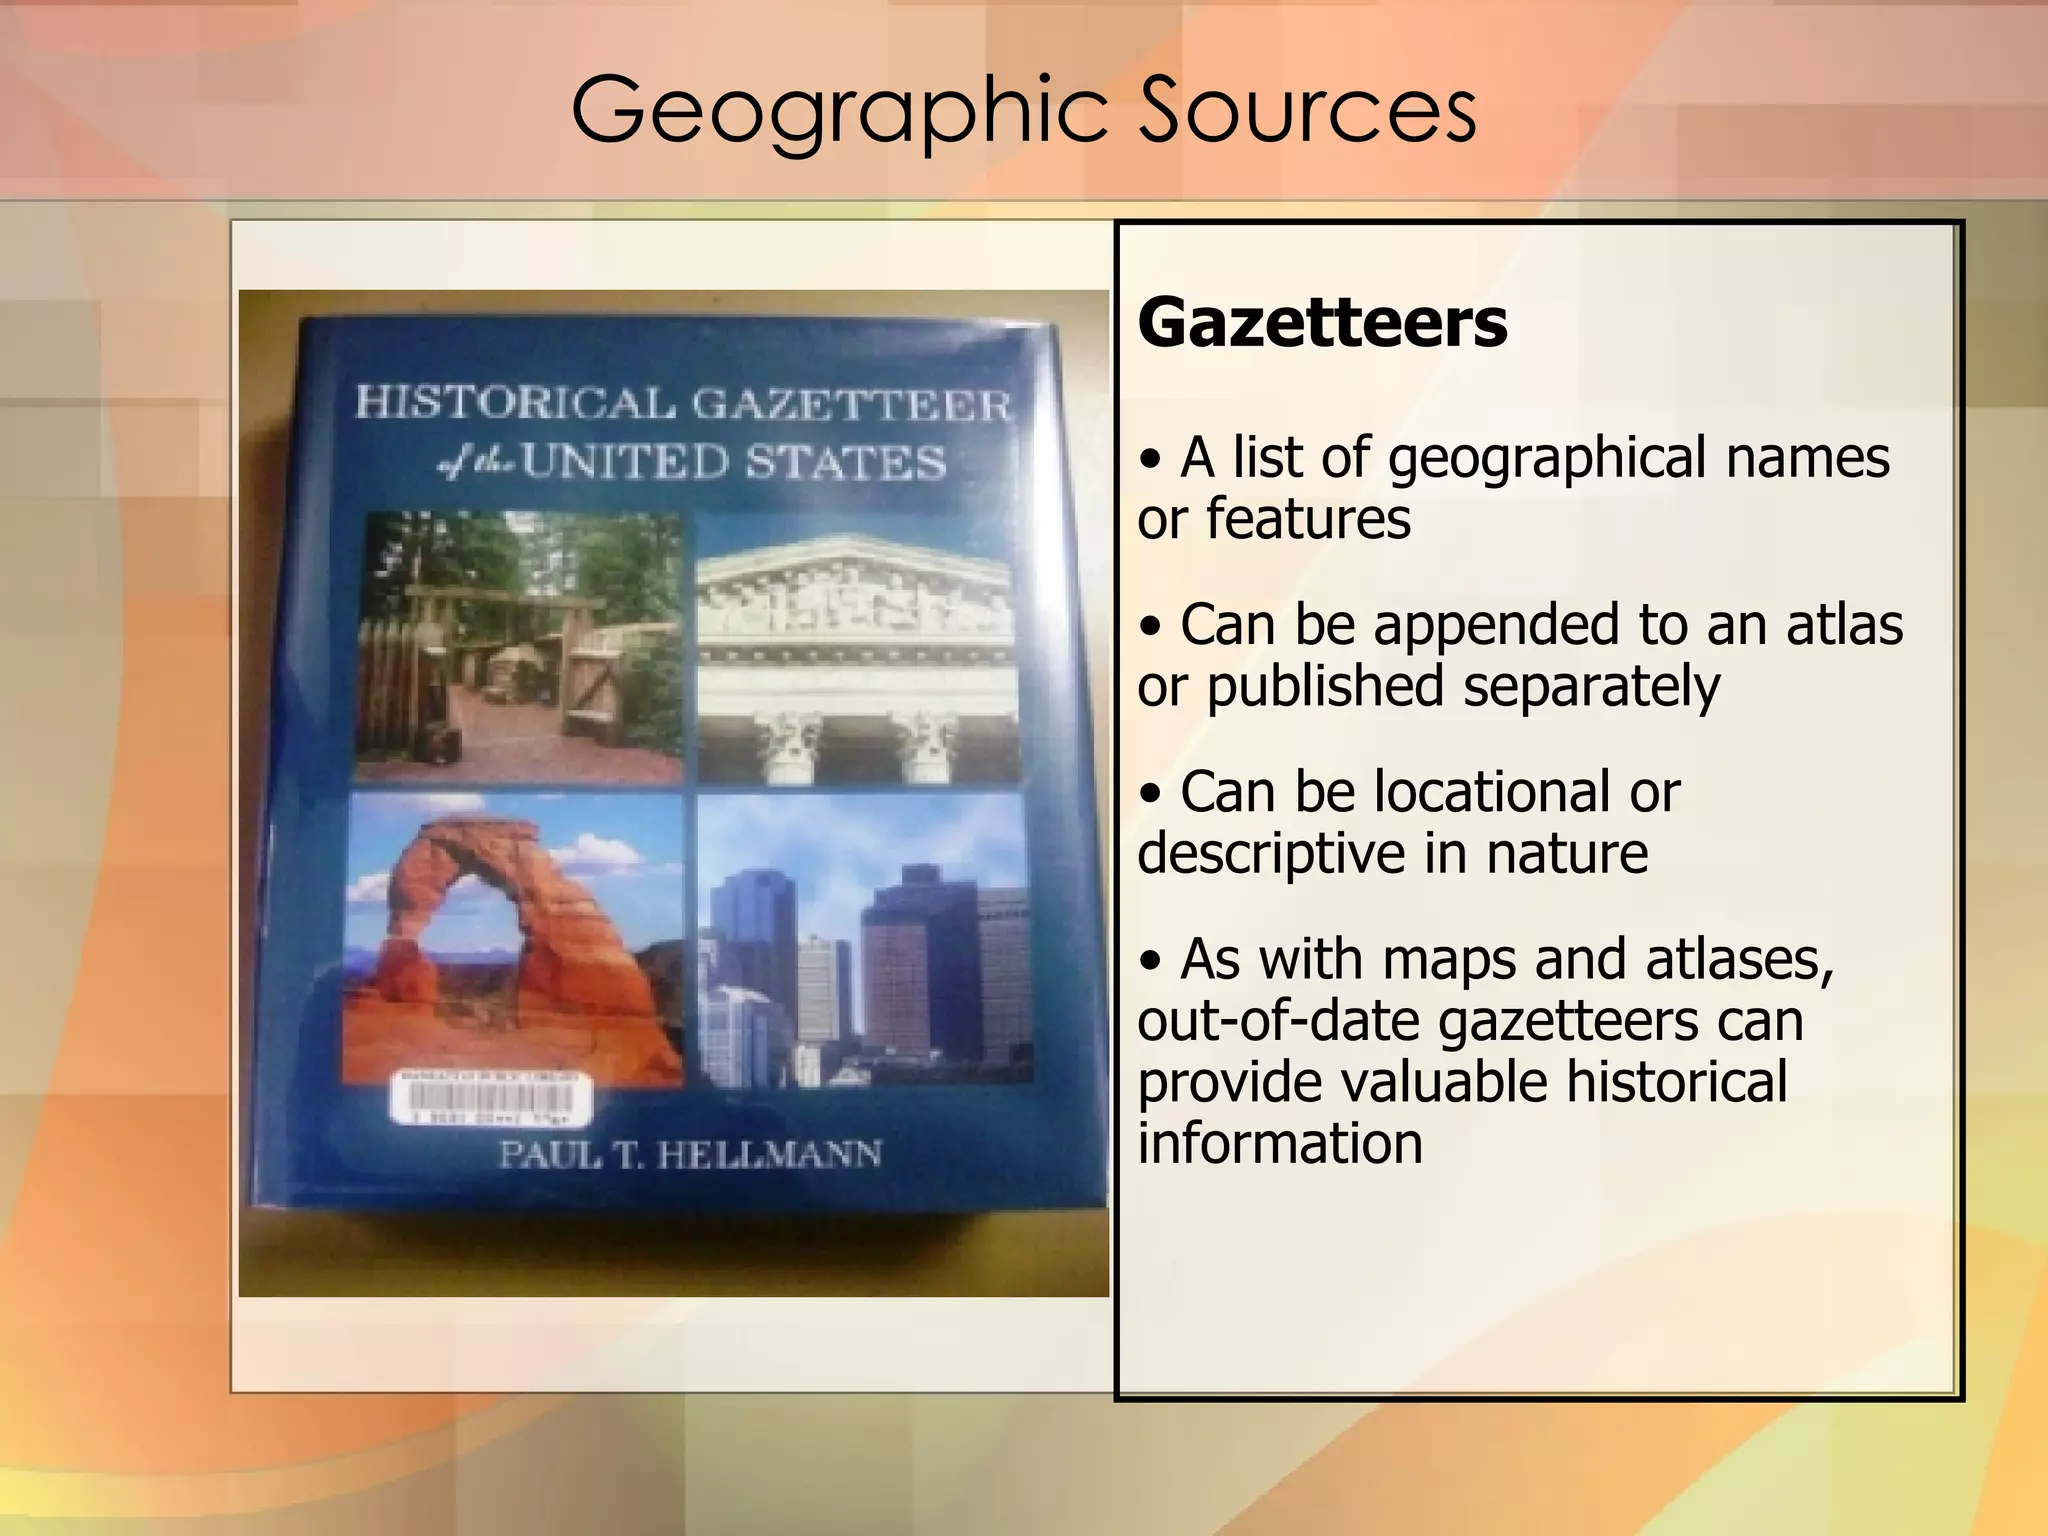
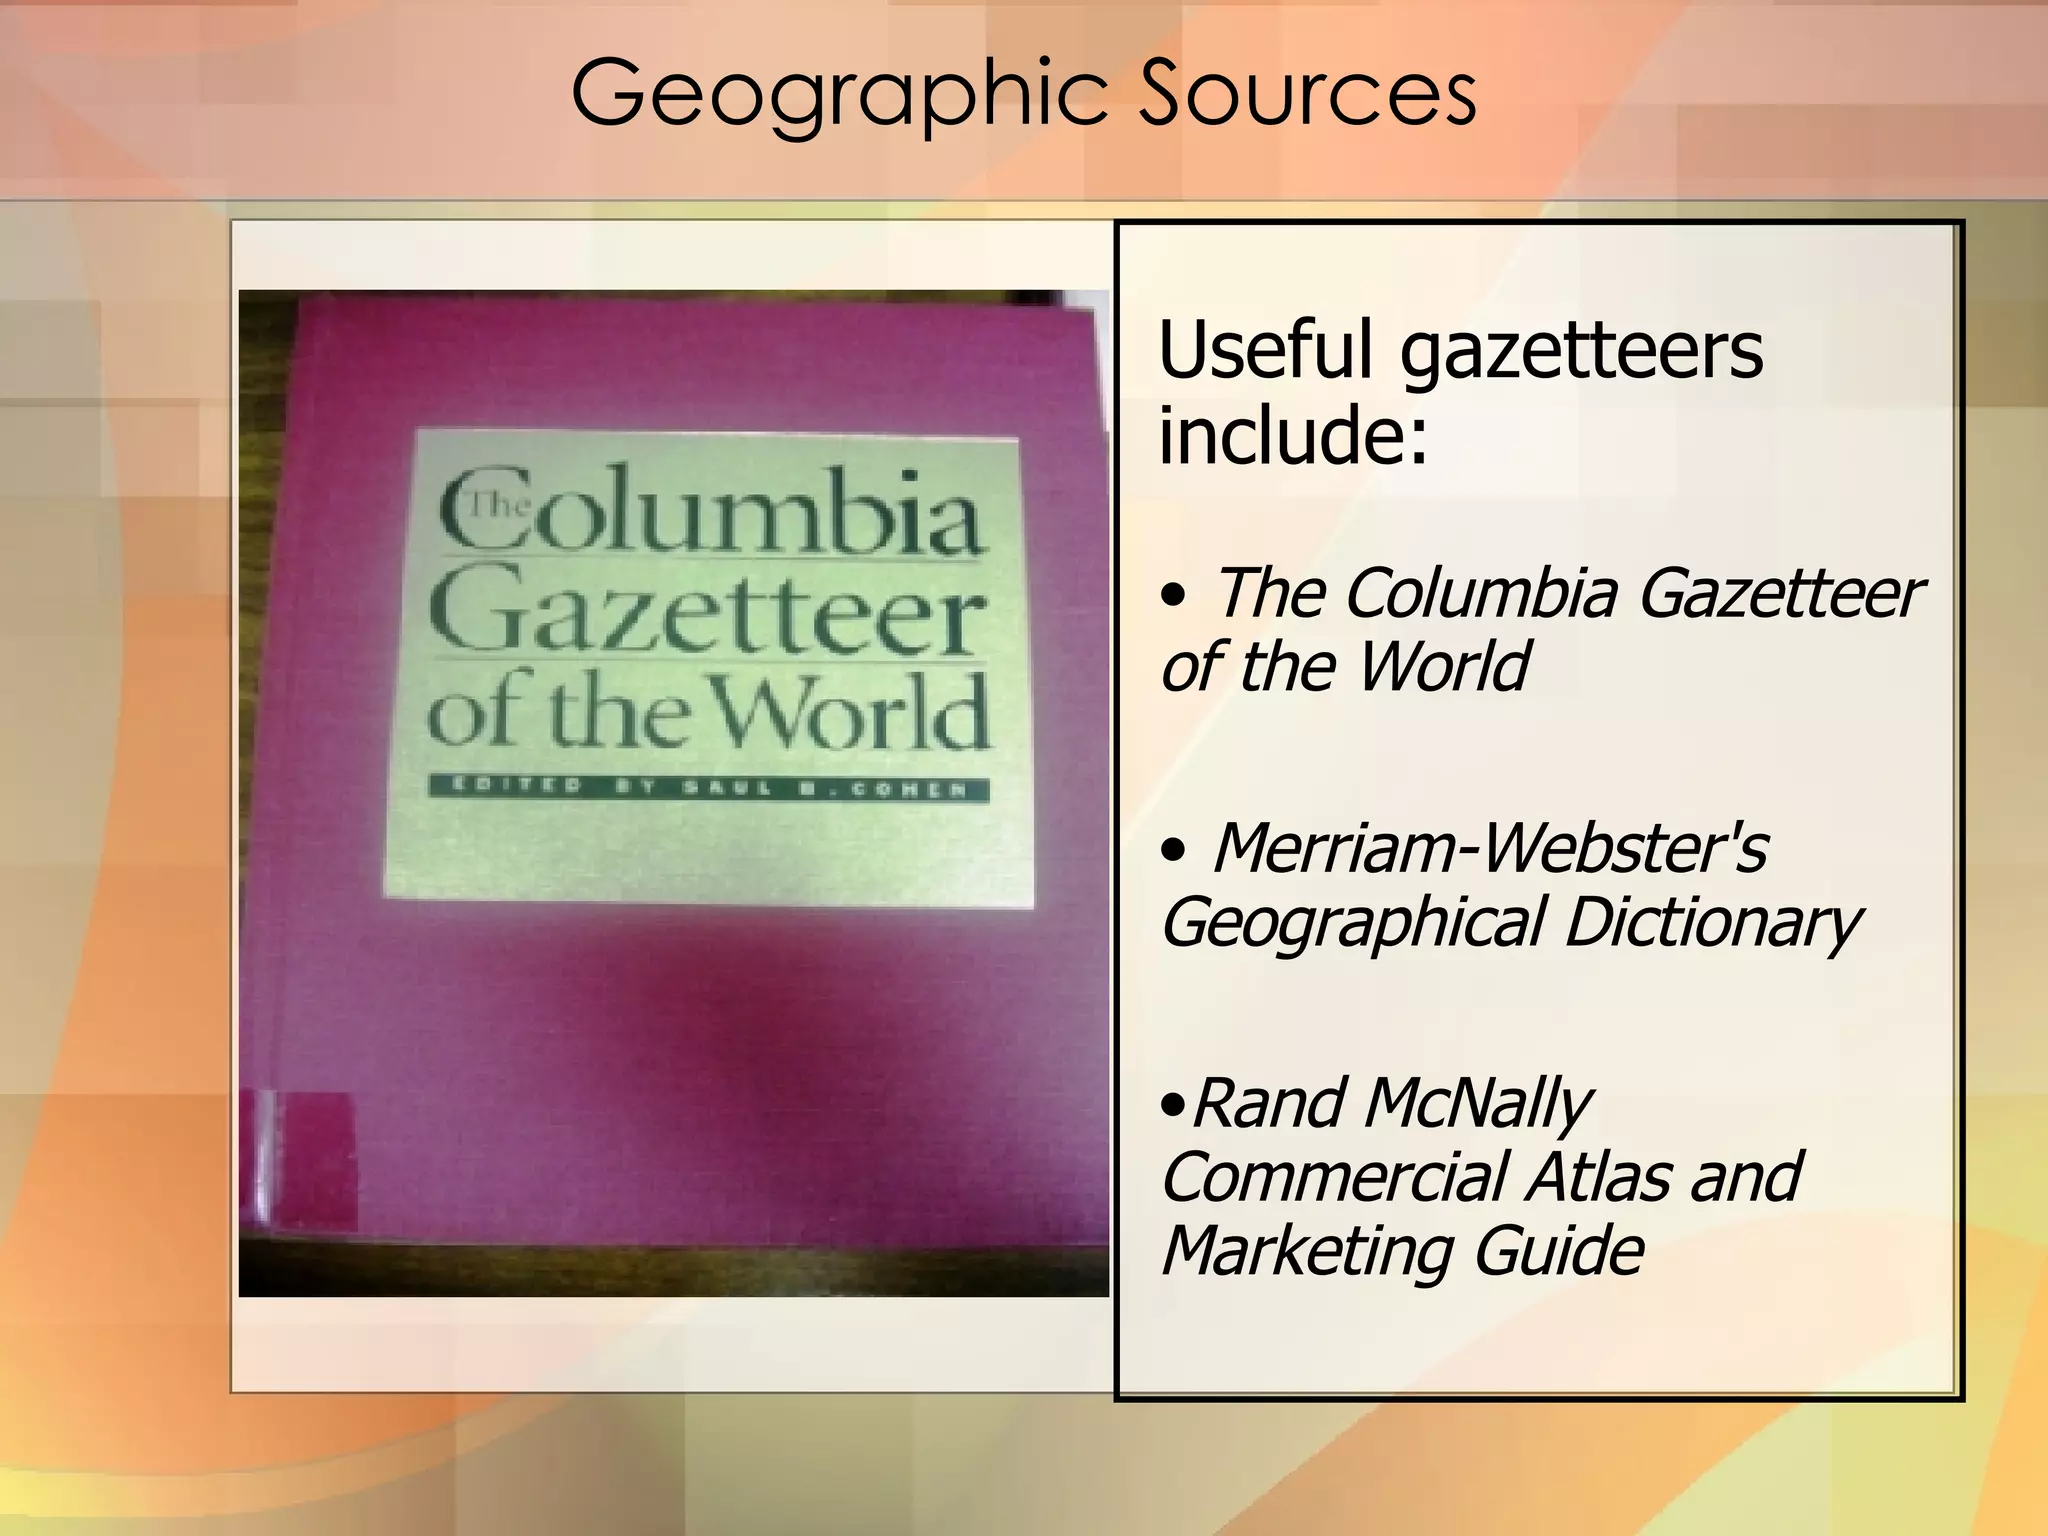
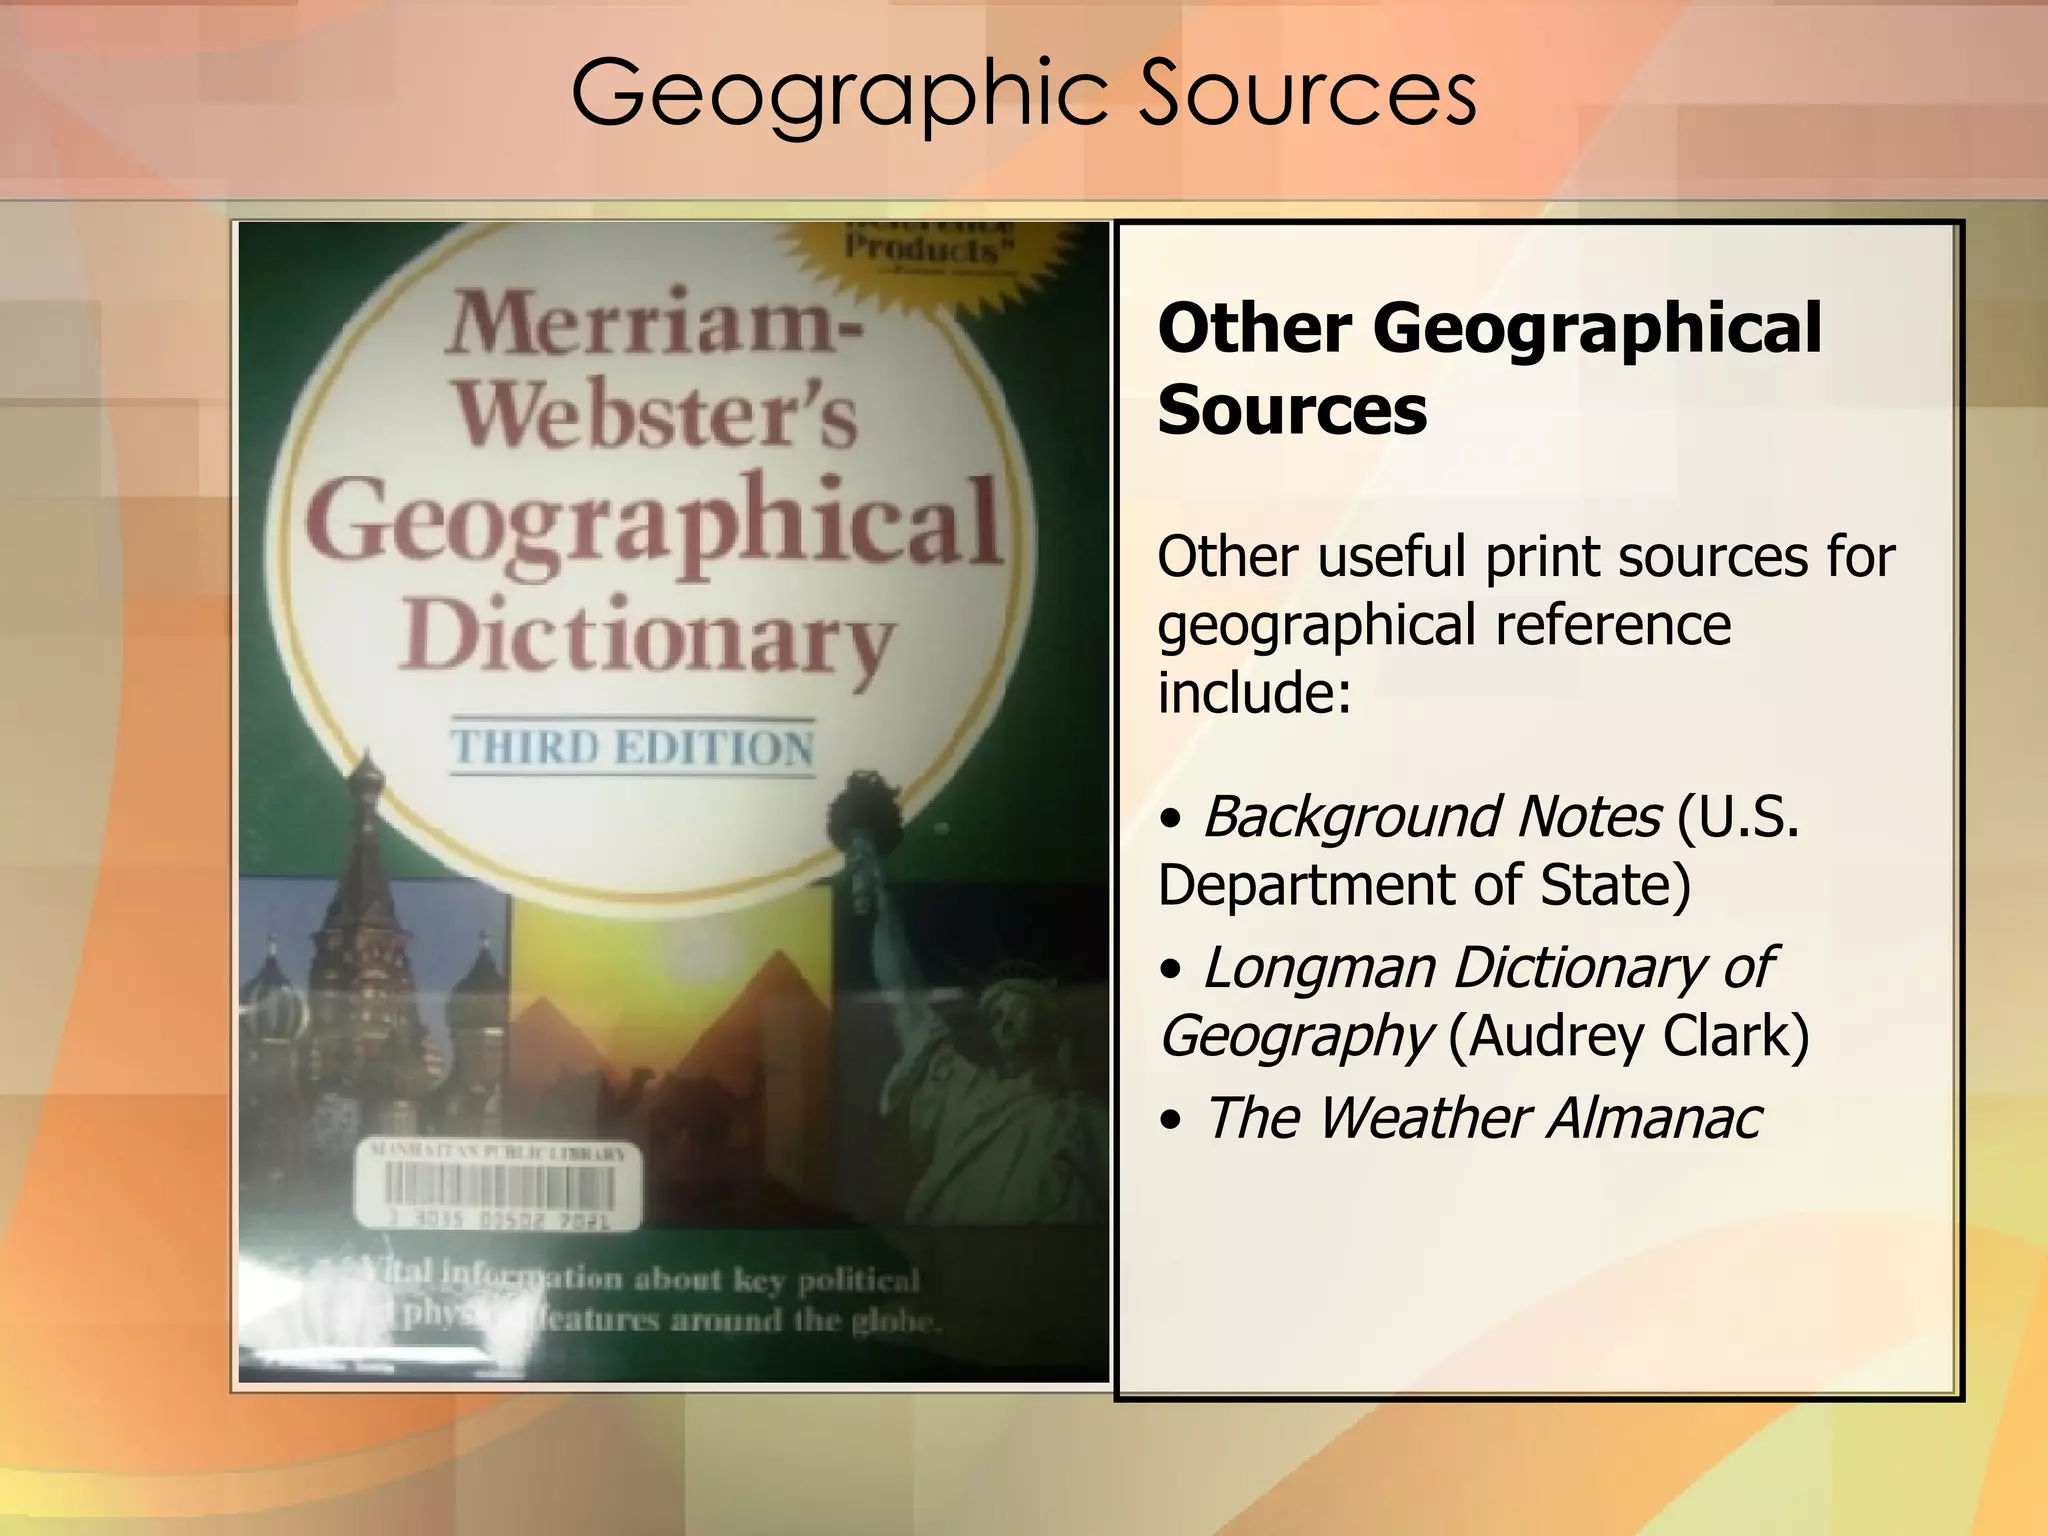
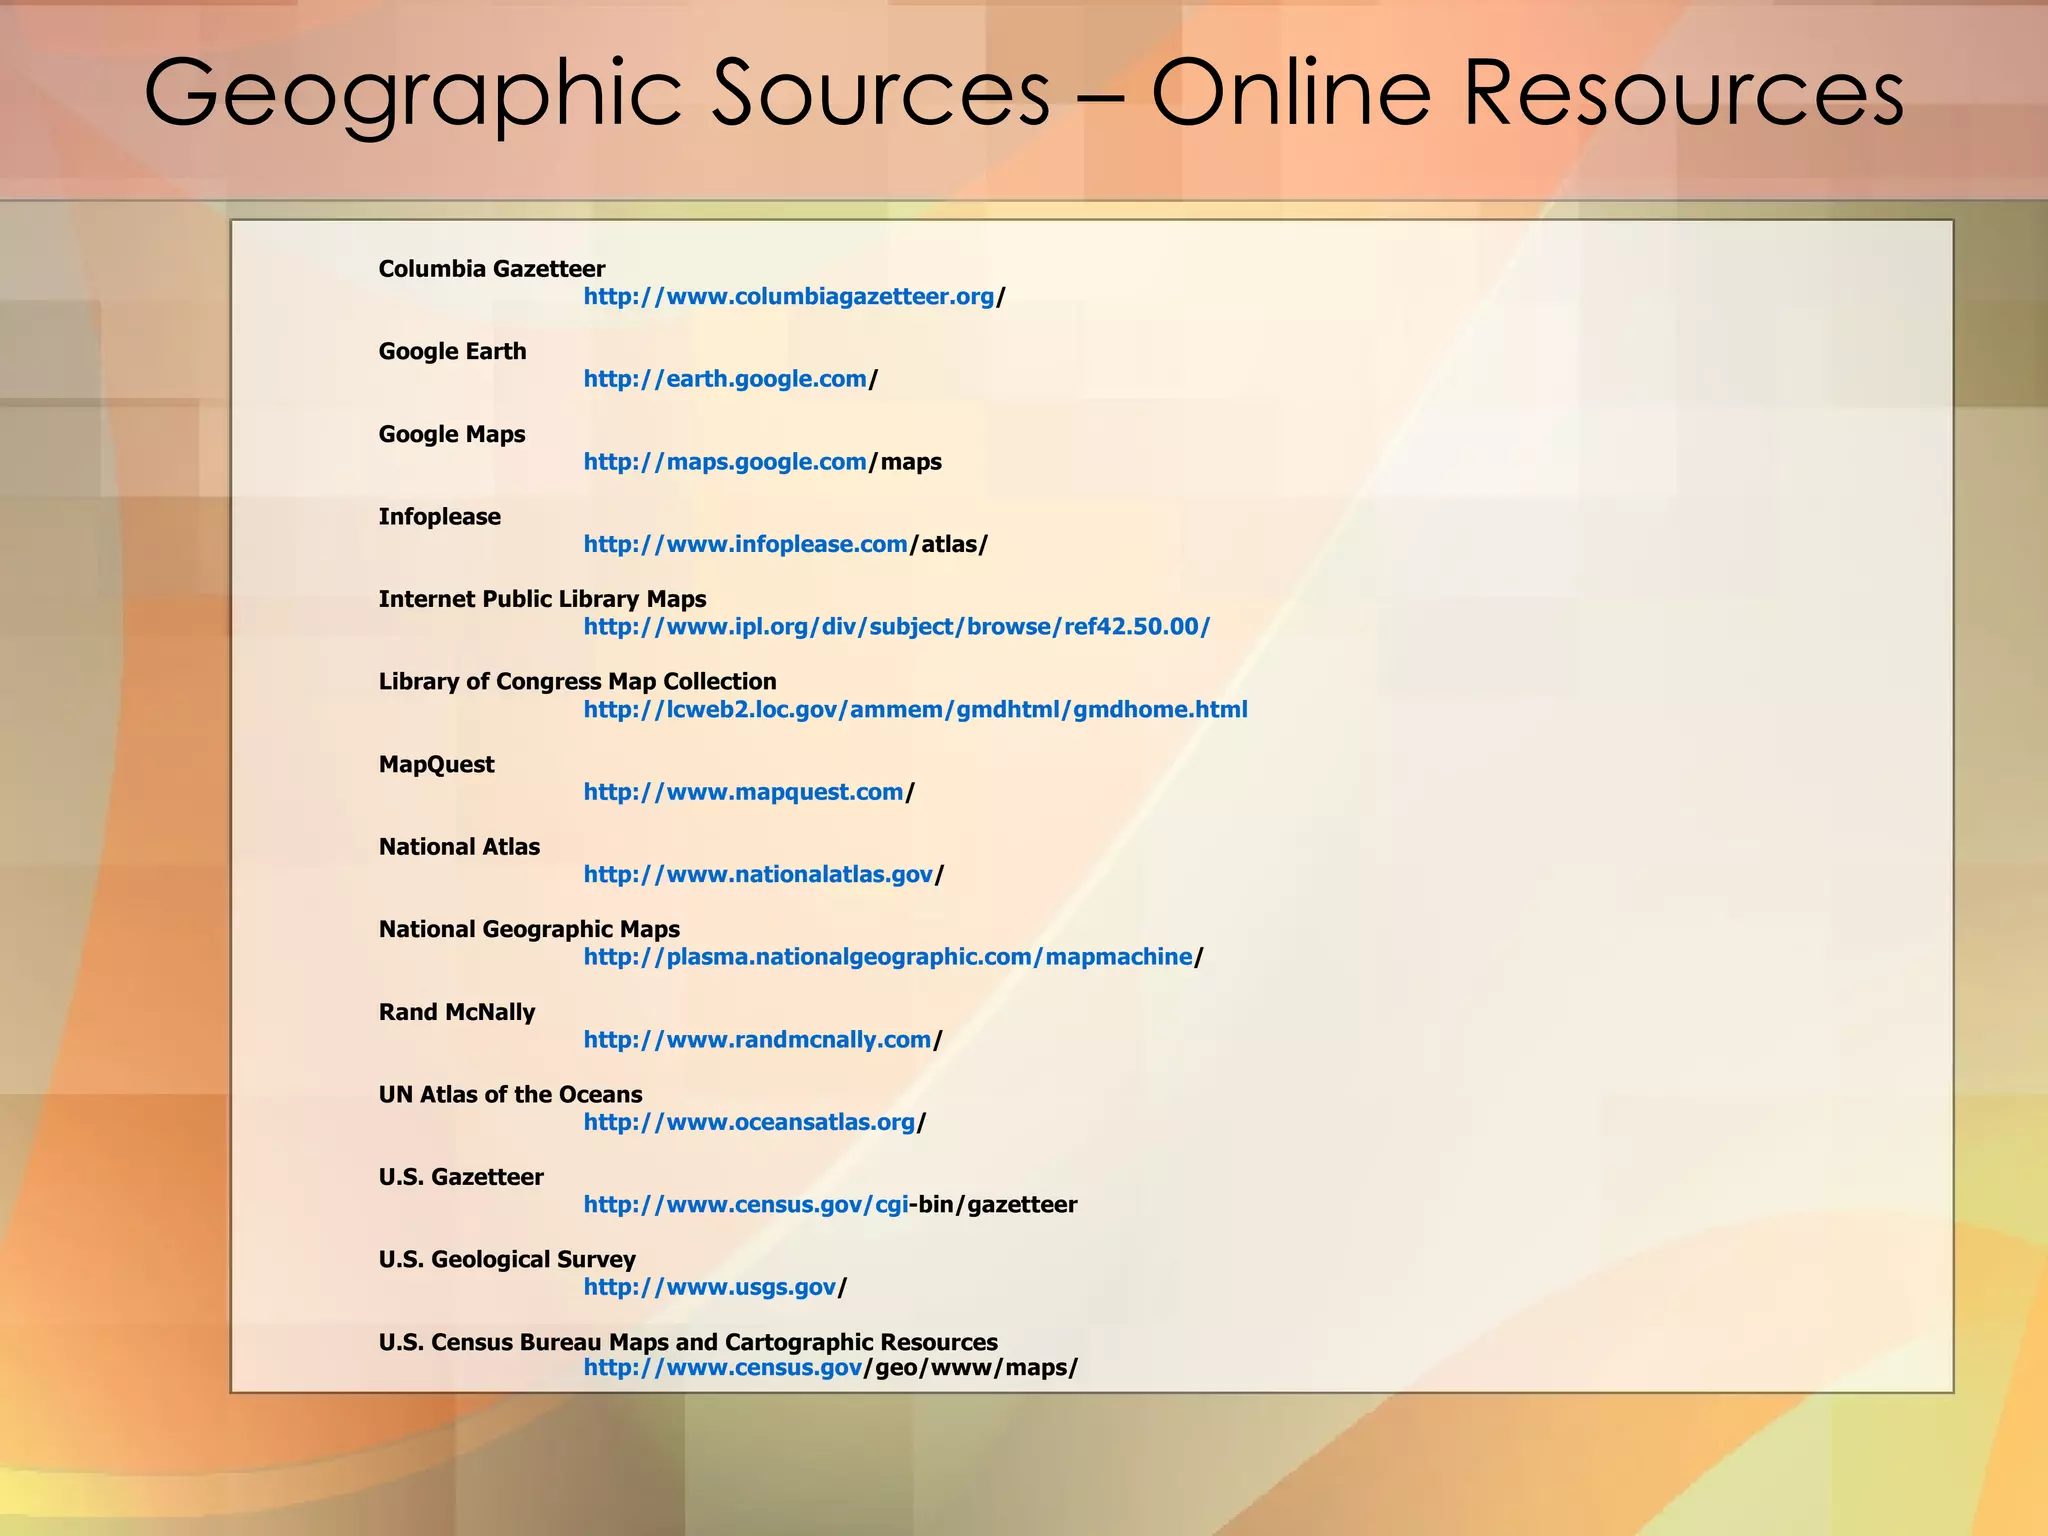
This is a presentation for a staff luncheon. The topic is on geographic resources located in our library. This is to help inform staff of what materials are available to them and to library users.
This document provides an overview of different types of geographical reference sources and tools. It defines gazetteers as dictionaries of geographic names that include location information. Free online gazetteers from the US and world Census are described. Guidebooks are defined as handbooks providing travel information for specific locations. Atlases are collections of maps with indexes, and examples of print versus online atlases are discussed. The document also covers map reading skills, resources for teaching those skills, and using GPS technology for geocaching activities.
Geographical sources include maps, atlases, globes, gazetteers, and travel guides. They provide location information about places, their physical features, and distances. Librarians use geographical sources to answer questions on current events, recreation, business, and history. They are useful resources for ready reference, research, and location finding. Common types of geographical sources are general maps, thematic maps, road atlases, general atlases, subject atlases, globes, locational gazetteers, and descriptive gazetteers.
This document provides an overview of different types of geographic reference sources including gazetteers, atlases, guidebooks, and online mapping resources. It discusses what gazetteers and atlases are and provides examples of free and paid online gazetteers and atlases. It also covers map reading skills and how GPS technologies can be used for educational activities like geocaching.
This document discusses geographical reference tools that are important for reference libraries. It divides geographical information sources into two categories: general reference sources that include geography as well as other topics, and specialized geographical reference sources. The specialized sources are further divided into maps, atlases, globes, gazetteers, travel guides, and Google Maps. Examples of each type are provided along with details about their purpose and coverage. The document aims to help evaluate geographical reference sources for teaching, research, and general use.
The document discusses various types of geographical sources used for reference work, including maps, atlases, gazetteers, and guide books. It provides information on evaluating, selecting, and organizing these resources. Specifically, it outlines factors to consider when purchasing atlases, such as scope, currency, publisher reputation, and index quality. It also describes how local maps and gazetteers can complement atlas collections.
Reference sources presentation geographical and biographical sources finalShaunaKY
ย
Group Two's Presentation
There are many different types of reference sources. Our presentation will focus on two: Geographical and Biographical Sources.
Maps are visual representations of spatial relationships and characteristics of an area. There are several key elements that should be included in every map: the data frame, legend, title, north arrow, scale, and citation. There are seven main types of maps: political maps, physical maps, topographic maps, climate maps, economic/resource maps, road maps, and thematic maps. Each type of map serves a different purpose in visualizing and representing different kinds of geographic and statistical information.
This document discusses different types of maps including political, physical, landform, resource, population, transportation, distribution, and grid maps. It provides examples and descriptions of each type. Political maps show human impacts and boundaries and change frequently. Physical maps highlight natural features and do not include human elements. Landform maps specifically show elevations and terrain. Resource maps indicate natural resources and agriculture. Population maps illustrate changes in population distribution.
This chapter introduces the concepts of maps, including their purposes and how they can be manipulated. It discusses the five themes of geography: location, place, region, movement, and human-environmental interaction. It also explains how maps are simplified, scaled, aggregated, and projected in different types like reference, choropleth, proportional symbol, isoline, and dot maps. The chapter aims to illustrate how changing a map's properties can change its message.
Maps provide visual representations of geographic information and come in many types for different purposes. They combine elements of art, science, and technology. Atlases collect related maps focused on a geographic or thematic subject. Assessing maps considers their scale, projection, currency, and usability. While physical maps can be expensive, many free online maps are available from commercial and organizational sources. Geographic information systems now process digital data to create interactive maps.
Maps provide visual representations of geographic information and come in many types for different purposes. They combine elements of art, science, and technology. Atlases collect related maps focused on a subject. Assessing maps considers their scale, projection, currency, and usability. While physical maps are expensive, many free digital maps are available online from commercial and organizational sources. Geographic information systems now process digital data to create interactive maps.
This document discusses different types of maps and their purposes. It describes physical maps, political maps, and special purpose maps. Physical maps show landscape features like mountains and rivers, political maps show national and local boundaries, and special purpose maps focus on specific topics like climate, resources, or history. The document also identifies common parts of maps, including the title, compass rose, legend, scale, and locator map. It provides examples of each to explain how to read and understand maps.
Thematic maps focus on a specific theme and can show physical, political, or cultural features using colors and symbols. Physical maps depict geographical characteristics of the land like mountains, rivers, and lakes using varying shades. Political maps outline governmental boundaries between countries, states, and counties, and may also include major cities and bodies of water, differentiated with colors.
The document discusses different types of maps and their components. It explains that maps have grid systems using lines of latitude and longitude to determine absolute location. Key parts of maps include a compass rose to identify directions, a scale to convey distances on the map compared to real-world distances, and a legend to explain any symbols used. Common types of maps are reference maps, thematic maps, and those using different map projections.
There are several major types of maps, including climate maps, political maps, economic or resource maps, physical maps, street maps, road maps, topographic maps, and thematic maps. Climate maps portray climate conditions, political maps show state and natural boundaries as well as city locations, and economic maps denote natural resources and economic activities through colors and symbols. Physical maps portray landscape features such as mountains, lakes, and rivers using colors to represent elevations. Street maps and road maps indicate highways with different colors. Topographic maps use contour lines to show terrain elevations. Thematic maps focus on a particular theme rather than natural features.
This document provides an overview of different types of maps, including road maps, topographical maps, physical maps, political maps, and climate maps. It describes some key features of each type of map, such as showing major and minor highways on road maps and using contour lines to show landscape changes on topographical maps. It prompts the reader to scan QR codes for more information on each map type and complete questions or activities.
There are three main types of maps: political maps, topographic maps, and thematic maps. Political maps show country borders and major cities. Topographic maps display physical features of land. Thematic maps focus on a specific topic like climate, natural resources, or population. Maps can sometimes combine map types, such as political and topographic maps.
Statistical techniques in geographical analysisakida mbugi
ย
The document discusses several statistical techniques used in geographical analysis, including probability, hypothesis testing, data selection, and statistical inference. Probability allows analysts to make predictions when hard data is lacking. Hypothesis testing allows meaningful comparisons of data. Data selection involves choosing representative, unbiased samples. Statistical inference permits analysts to generalize conclusions beyond the immediate sample area. Strong statistical methods are crucial to performing meaningful analyses in geographical analysis.
Topics:
1. Mapping Concepts
2. Analysis with paper based Maps
3. Limitations of Paper based Maps
4. Computer Aided Cartography History and Development
5. GIS Definition
6. Advantage of Digital Maps
Maps are useful tools for plotting locations of places and objects. They can mark roads, subways, parks, crops, weather reports, wind direction, and rainfall. Maps ease the process of viewing the entire world on paper. Since ancient times, maps have been useful for depicting boundaries of land, water, and other natural resources on Earth. Asia map powerpoint provides a view of the most populous continent, Asia, which comprises 30% of the world's land area and 60% of the human population. It illustrates geographical, topographical, climatic, and historical details about Asia in an effective way. The map includes details that can be useful for disaster management and understanding racial diversity.
This document discusses the importance of considering spatial and geographic factors in social science research and analysis. It argues that location and context are important for understanding human behavior and social processes. Spatial analysis techniques can provide insights by examining how variables are distributed across space and relate to nearby locations. The document advocates for more integrated and multidisciplinary research that considers both social and physical geographic factors. It also introduces the concept of spatial data analysis and how maps can help analyze relationships by preserving spatial context unlike tables.
Thesis - Automating ID of Roads and Trails Under Canopy Using LIDARFrank Harmon
ย
The document describes research to automatically extract roads and trails from LiDAR data collected over the Swanton Pacific Ranch in California. LiDAR point cloud data was used to create a digital surface model, from which topographic features were derived and analyzed using classification and image processing techniques in ENVI software. The goal was to identify roads and trails under thick forest canopy using only LiDAR data and compare the results to ground truth collected in 2011.
There are several types of maps that display different information. A political map outlines state and national boundaries without topographic features. A physical map depicts topography like rivers, mountains, and forests using colors. A topographic map similarly shows elevation changes through contour lines rather than colors. A climatic map illustrates rainfall and climate patterns. An economic map outlines resources and industry through symbols. A road map provides transportation details for navigation purposes. A thematic map focuses on a single theme. Blank and location maps contain only boundaries for learning purposes.
The document discusses different types of maps and map scale. It explains that there are two main types of maps: reference maps, which show locations of features, and thematic maps, which emphasize a particular theme. It also defines scale as the ratio of distance on a map compared to actual distance. There are three types of scale: graphic, verbal, and representative fraction. The document provides examples of different scales and types of maps, including topographic, choropleth, dot, and cartogram maps.
The document discusses different types of maps, including physical maps which show natural features and cultural maps which show man-made features, and how maps are classified based on their scale and function. It also covers how to read maps, including understanding scale using statement of scale, representative fraction, and linear scale, as well as using cardinal directions and signs/symbols.
The document provides an introduction to geospatial web technologies and geographic information systems (GIS). It discusses how GIS allows users to store, manage, analyze and display geographic data. Key geospatial web technologies described include GML and KML for describing geographic data in XML formats, and WMS and WFS for sharing maps and geographic features as web services. The document also briefly mentions technologies for geotagging web resources with location data.
This document discusses the challenges involved in cataloging maps for library collections. It notes that maps can present many problems that do not exist for books, such as unclear authorship, multiple titles, undated publications, and varying scales. It provides examples of issues like determining the main title and entry for maps from different time periods or corporate authors. The document emphasizes that understanding user needs and providing access to maps by location, subject, and other elements is important for cataloging these resources.
Exploring our geographic world by tessie calimag bb.Tessie Calimag
ย
Geography is the study of the Earth's physical features and human activities. It involves understanding locations, places, regions, and human-environment interactions. Some key tools used in geography are maps, atlases, geospatial technologies like GIS, and fieldwork. Maps show physical and political features and use symbols, scales, legends and other elements to convey spatial information. Different types of maps exist for various purposes. Geography helps us understand the world, our own country, and how humans and the environment impact one another in different places and regions.
Exploring our geographic world by tessie calimag bb.Tessie Calimag
ย
Geography is the study of the Earth's physical features and human activities. It helps us understand the world and our own country. Geography uses tools like maps to represent information about locations, physical characteristics, political boundaries, and other themes. Cartographers create maps using data from systems like GIS and satellites. Atlases contain collections of maps, graphs, and charts used as geographic resources. Regions, interactions between humans and the environment, and the movement of people also help define geography.
This document provides teaching guides for transparency images related to geography concepts. It discusses choropleth maps and guidelines for their effective use, including using them only for ratio data, carefully choosing category boundaries, and using a logical color sequence. It also discusses topographic maps at different scales and what types of information are visible at each scale. Finally, it discusses the importance of iron and steel mills in the late 1800s and factors to consider when locating steel mills such as proximity to raw material sources and transportation routes.
This document provides an overview of cartography. It begins with definitions of cartography and discusses the importance and history of maps. The history section outlines some of the earliest maps from ancient civilizations like Babylonia, Egypt, and Greece. It also describes important contributions from figures like Ptolemy, including his world map and map projections. The document emphasizes that cartography has progressed from early conceptual maps to more accurate representations incorporating scientific principles.
A map is a representation of a geographic area, usually showing terrain, political boundaries, or other features. Maps can be printed, computer-generated, or other forms. They all share common elements like projections that translate the spherical Earth onto a flat surface, scales to relate distances on the map to real-world distances, and coordinate systems like latitude and longitude to specify locations. Effective use of maps requires understanding these elements and being aware that maps have limitations due to human and technological factors.
GIS: Bringing Geography to the World & the World to GeographyBarry Wellar
ย
GIS Day is a special occasion, whereby we express what we are thinking and doing in our GIS research, education, training, and applications activities. And, it is also is a time to set forth what we wish others would think about and do, such as providing answers to the question: โWhat contribution is Geography making to support and encourage the development and use of GIS technology and GIScience methods, techniques, and operations by governments, NGOs, business, researchers, academe, the media, and interest groups?โ The impending Research Colloquium on Using the Retrospective Approach to Mine for GIS Nuggets is one such contribution by Geography to GIS. This GIS Day 2014 presentation includes a selection of figures and tables from several Colloquium papers which illustrate how Geography can contribute to both parts of the title, that is, GIS: Bringing Geography to the World and, GIS: Bringing the World to Geography.
Daniel Shakespeare (Freelance programmer, DE): Interactive Genealogy Explorer. Visualization of migration of ancestors and relatives
co:op-READ-Convention Marburg
Technology meets Scholarship, or how Handwritten Text Recognition will Revolutionize Access to Archival Collections.
With a special focus on biographical data in archives
Hessian State Archives Marburg Friedrichsplatz 15, D - 35037 Marburg
19-21 January 2016
This document discusses incorporating geographic concepts into elementary classroom instruction. It provides examples of key geographic concepts and terms that could be addressed, such as place, climate, maps, and human-environment interaction. Suggestions are given for using maps and other representations to teach relationships between location and environmental characteristics. The document also discusses how literacy instruction can highlight the significance of place by identifying geographic concepts in texts and asking text-dependent questions. Additional resources are shared for using primary sources and digital maps to support student inquiry into claims about different regions of the United States. Teachers are encouraged to think about how these strategies and resources could strengthen spatial thinking in their own teaching.
The Social Lives Of Maps: Interaction Design and Mapsweatherpattern
ย
Presented at IxDA New York, June 7 2012
The Social Lives of Maps
Peopleโs use of maps to research and navigate has been radically altered by the development and adoption of digital maps. Maps are no longer static print images. Instead, they are now dynamic and collaborative, as they have evolved in lockstep with the evolution of the Internet, from Mapquestโs launch in 1996 to the Web 2.0 enhanced Google Maps to the user content filled maps of Yelp.โจโจ
Understanding how maps can be utilized as tools, interfaces, and content is fast becoming part of the standard โtool kitโ of interaction designers. A static image or a link out to a map service may or may not be good enough due to raising expectations of the designerโs clients, employers, and people their designs serve. The new possibilities must also be balanced with the issues about privacy and security.โจโจ
This presentation explores how peopleโs behaviors with digital mappings intersect with the current developments in location-based services, crowdsourcing, open government, and the mobile web. For the practitioner, basic off-the-shelf mapping tools, APIs, and services are discussed.
The document provides an overview of the Collins World in Maps atlas scheme, which is designed to teach geography concepts through thematic atlas pages, activities, and links to other subject areas like history, citizenship, and mathematics. Key features of the atlas include descriptions of places around the world, how places are interconnected, issues of global citizenship and environmental problems, and incorporating historical perspectives. The themes, activities, and approach aim to help students develop knowledge of the world based on the national curriculum.
This document discusses geographic concepts related to maps, space, place, and scale. It defines key terms like space, place, and scale. It explains how geographers use maps to identify patterns, compare patterns, and provide information on locations. It also discusses cognitive maps, reference maps, thematic maps, and geographic information systems (GIS). GIS is described as a tool that enables the capture, storage, manipulation, retrieval, analysis and display of spatial data. Examples are given of how GIS is used in different fields.
A thematic map is a type of map that focuses on displaying information about a single theme or topic within a geographic area. Thematic maps emphasize specific distributions of phenomena, such as climate, population density, or other social, economic, or agricultural aspects. They show variations and relationships of geographic elements by using symbols instead of focusing on base map details. The purpose is to tell a story about places by mapping spatial patterns rather than just showing where locations are.
๊ณต๊ณต์ฐธ์ฌํGIS: ์น๊ณผ์ฑ์ ํ์ฉํ๊ธฐWansoo Im
ย
The document discusses how non-profits, schools, and NGOs use location-based information and GIS technology. It provides examples of environmental groups using interactive maps to involve communities and collect data. It also discusses suggestions from teachers to apply interactive maps to the social studies curriculum to help students learn geography.
The National Geography Standards document outlines 18 standards covering key concepts in geography. The standards cover topics such as:
- Using maps and geospatial data to understand locations and spatial relationships.
- Developing and using mental maps to organize spatial information.
- Understanding spatial patterns and relationships between physical and human characteristics of places and regions.
- Recognizing that people can perceive places and regions differently depending on their experiences.
- Learning that physical systems like climate and landforms help define and characterize regions around the world.
This document discusses various types of geographical resources and how to evaluate them. It covers gazetteers and dictionaries, maps, atlases, and travel guides. It provides details on popular sources for each type, such as the Columbia Gazetteer of North America, Merriam-Webster's Geographical Dictionary, the National Geographic Atlas of the World, and Rand McNally road atlases. It also discusses how to judge the quality of different map and atlas resources based on factors like scale, projection, color/symbols, publisher authority, indexing, and currency.
The document provides an overview of geographic information systems (GIS). It discusses how GIS is used in multiple disciplines like agriculture, natural resource management, and urban planning. It also covers key GIS concepts like location-allocation analysis, which involves finding optimal locations to serve demand while minimizing costs. Additionally, the document defines common map elements such as point, line, and area features and the typical components of maps like titles, legends, scales, grids, and compass roses.
โGIS: Unifying Theory/Methodology for Journalism and the Social Sciences?โ J T "Tom" Johnson
ย
The document discusses how geographic information systems (GIS) can be used across various aspects of journalism and social sciences. GIS is presented as a tool for analyzing data, communicating findings, and making new knowledge in many disciplines. Examples are given of how GIS has been used historically and in current journalism practices like weather reporting, census analysis, and crime mapping. Key benefits of GIS include making invisible patterns visible, facilitating data-driven decision making, and allowing journalists to better understand and show stories to readers.
This document discusses various types of geographical resources and how to evaluate them. It covers gazetteers and dictionaries, maps, atlases, and travel guides. It provides details on popular sources for each type, such as the Columbia Gazetteer of North America, Merriam-Webster's Geographical Dictionary, the National Geographic Atlas of the World, and Rand McNally road atlases. It also discusses how to judge the quality of different map and atlas resources based on factors like scale, projection, color/symbols, publisher authority, indexing, and currency.
The document discusses using maps and timelines for visualization. It provides four ways that maps and timelines can be used: 1) Plotting precise spatial and/or temporal coordinates, 2) Drawing artistic overlays, 3) Appropriating maps and timelines as metaphors for abstract dimensions, 4) Combinations of these approaches with layers. The functions of these visualizations include telling stories or starting conversations at the border between narrative and data. Historical examples like Minard's map of Napoleon's march are discussed.
The document discusses spatial data and spatial databases. It defines spatial data as data related to space, including location, shape, size and orientation of objects. It discusses the types of spatial data like points, lines, polygons and pixels. It also discusses non-spatial data and how spatial data is organized using coordinates. The key properties of spatial data are geometry, distribution of objects in space, temporal changes and data volume. Spatial databases allow for efficient storage and querying of spatial data through the use of spatial data types and indexes.
Using Music to Enhance Library Instructionroycekitts
ย
This presentation showcases a few assignments that you can use in the classroom to make information literacy instruction more exciting for students. Featured are some clips from M.I.A., The Clash, Vanilla Ice, Queen, David Bowie, Ice T, T.I., and the television show Portlandia
The document provides guidance on using online resources for research. It recommends checking the ERIC database for education articles, NASA.gov to check for asteroid tracking information, the Federal Trade Commission website to check the status of the American financial system, and the Library of Congress website for primary source materials. It also suggests visiting the National Park Service website to check for updates on Rocky Mountain National Park before planning a vacation.
Royce Kitts is a library science graduate student at Emporia State University who is originally from Dallas but now lives in Kansas. He has been working as a librarian for 7 years and enjoys helping patrons and incorporating technology into the library. His future goals are to become a public library director and eventually teach library science by sharing his technology and user experience knowledge.
The document summarizes a community technology workshop on Web 2.0 held at the Manhattan Public Library. The workshop defined Web 2.0 as referring to web-based communities and hosted services that facilitate collaboration and sharing between users. It discussed fostering community learning about Web 2.0 technologies. Attendees were instructed to create a Yahoo email account to access Web 2.0 technologies, and the workshop focused on the photo sharing site Flickr, explaining how it can be used to share, view, search and comment on photos.
The document discusses Library of Congress Subject Headings (LCSH), including what they are, their history and development, how they are structured and used, and their pros and cons. Specifically, LCSH are the standard system for subject cataloging in US libraries, providing controlled vocabulary for subject indexing. They have evolved over time with contributions from Thomas Jefferson, Charles Cutter, and others, and are constantly updated. LCSH utilize hierarchical, equivalence, and associative relationships between terms. However, their syntax can be difficult for librarians and patrons to understand, and they do not always accurately represent subject matter.
Office of the Director of National Intelligenceroycekitts
ย
The document provides an organizational study of the Office of the Director of National Intelligence (ODNI). It describes the ODNI's mission to centralize fragmented US intelligence sources. It discusses the ODNI's core competencies, principles/values, social structure as a large organization, and issues around centralization and formalization. Factors influencing the organization like culture, bureaucracy, and problems in the environment are also examined.
High-Quality IPTV Monthly Subscription for $15advik4387
ย
Experience high-quality entertainment with our IPTV monthly subscription for just $15. Access a vast array of live TV channels, movies, and on-demand shows with crystal-clear streaming. Our reliable service ensures smooth, uninterrupted viewing at an unbeatable price. Perfect for those seeking premium content without breaking the bank. Start streaming today!
https://rb.gy/f409dk
๐๐ง๐ฏ๐๐ข๐ฅ ๐ญ๐ก๐ ๐ ๐ฎ๐ญ๐ฎ๐ซ๐ ๐จ๐ ๐๐ง๐๐ซ๐ ๐ฒ ๐๐๐๐ข๐๐ข๐๐ง๐๐ฒ ๐ฐ๐ข๐ญ๐ก ๐๐๐๐๐๐๐๐โ๐ฌ ๐๐๐ญ๐๐ฌ๐ญ ๐๐๐๐๐ซ๐ข๐ง๐ ๐ฌ
Explore the details in our newly released product manual, which showcases NEWNTIDE's advanced heat pump technologies. Delve into our energy-efficient and eco-friendly solutions tailored for diverse global markets.
Best Competitive Marble Pricing in Dubai - โ 9928909666Stone Art Hub
ย
Stone Art Hub offers the best competitive Marble Pricing in Dubai, ensuring affordability without compromising quality. With a wide range of exquisite marble options to choose from, you can enhance your spaces with elegance and sophistication. For inquiries or orders, contact us at โ 9928909666. Experience luxury at unbeatable prices.
The Most Inspiring Entrepreneurs to Follow in 2024.pdfthesiliconleaders
ย
In a world where the potential of youth innovation remains vastly untouched, there emerges a guiding light in the form of Norm Goldstein, the Founder and CEO of EduNetwork Partners. His dedication to this cause has earned him recognition as a Congressional Leadership Award recipient.
Enhancing Adoption of AI in Agri-food: IntroductionCor Verdouw
ย
Introduction to the Panel on: Pathways and Challenges: AI-Driven Technology in Agri-Food, AI4Food, University of Guelph
โEnhancing Adoption of AI in Agri-food: a Path Forwardโ, 18 June 2024
Adani Group's Active Interest In Increasing Its Presence in the Cement Manufa...Adani case
ย
Time and again, the business group has taken up new business ventures, each of which has allowed it to expand its horizons further and reach new heights. Even amidst the Adani CBI Investigation, the firm has always focused on improving its cement business.
SATTA MATKA DPBOSS KALYAN MATKA RESULTS KALYAN CHART KALYAN MATKA MATKA RESULT KALYAN MATKA TIPS SATTA MATKA MATKA COM MATKA PANA JODI TODAY BATTA SATKA MATKA PATTI JODI NUMBER MATKA RESULTS MATKA CHART MATKA JODI SATTA COM INDIA SATTA MATKA MATKA TIPS MATKA WAPKA ALL MATKA RESULT LIVE ONLINE MATKA RESULT KALYAN MATKA RESULT DPBOSS MATKA 143 MAIN MATKA KALYAN MATKA RESULTS KALYAN CHART
The report *State of D2C in India: A Logistics Update* talks about the evolving dynamics of the d2C landscape with a particular focus on how brands navigate the complexities of logistics. Third Party Logistics enablers emerge indispensable partners in facilitating the growth journey of D2C brands, offering cost-effective solutions tailored to their specific needs. As D2C brands continue to expand, they encounter heightened operational complexities with logistics standing out as a significant challenge. Logistics not only represents a substantial cost component for the brands but also directly influences the customer experience. Establishing efficient logistics operations while keeping costs low is therefore a crucial objective for brands. The report highlights how 3PLs are meeting the rising demands of D2C brands, supporting their expansion both online and offline, and paving the way for sustainable, scalable growth in this fast-paced market.
SATTA MATKA DPBOSS KALYAN MATKA RESULTS KALYAN CHART KALYAN MATKA MATKA RESULT KALYAN MATKA TIPS SATTA MATKA MATKA COM MATKA PANA JODI TODAY BATTA SATKA MATKA PATTI JODI NUMBER MATKA RESULTS MATKA CHART MATKA JODI SATTA COM INDIA SATTA MATKA MATKA TIPS MATKA WAPKA ALL MATKA RESULT LIVE ONLINE MATKA RESULT KALYAN MATKA RESULT DPBOSS MATKA 143 MAIN MATKA KALYAN MATKA RESULTS KALYAN CHART
The Role of White Label Bookkeeping Services in Supporting the Growth and Sca...YourLegal Accounting
ย
Effective financial management is important for expansion and scalability in the ever-changing US business environment. White Label Bookkeeping services is an innovative solution that is becoming more and more popular among businesses. These services provide a special method for managing financial duties effectively, freeing up companies to concentrate on their main operations and growth plans. Weโll look at how White Label Bookkeeping can help US firms expand and develop in this blog.
Discover the Beauty and Functionality of The Expert Remodeling Serviceobriengroupinc04
ย
Unlock your kitchen's true potential with expert remodeling services from O'Brien Group Inc. Transform your space into a functional, modern, and luxurious haven with their experienced professionals. From layout reconfiguration to high-end upgrades, they deliver stunning results tailored to your style and needs. Visit obriengroupinc.com to elevate your kitchen's beauty and functionality today.