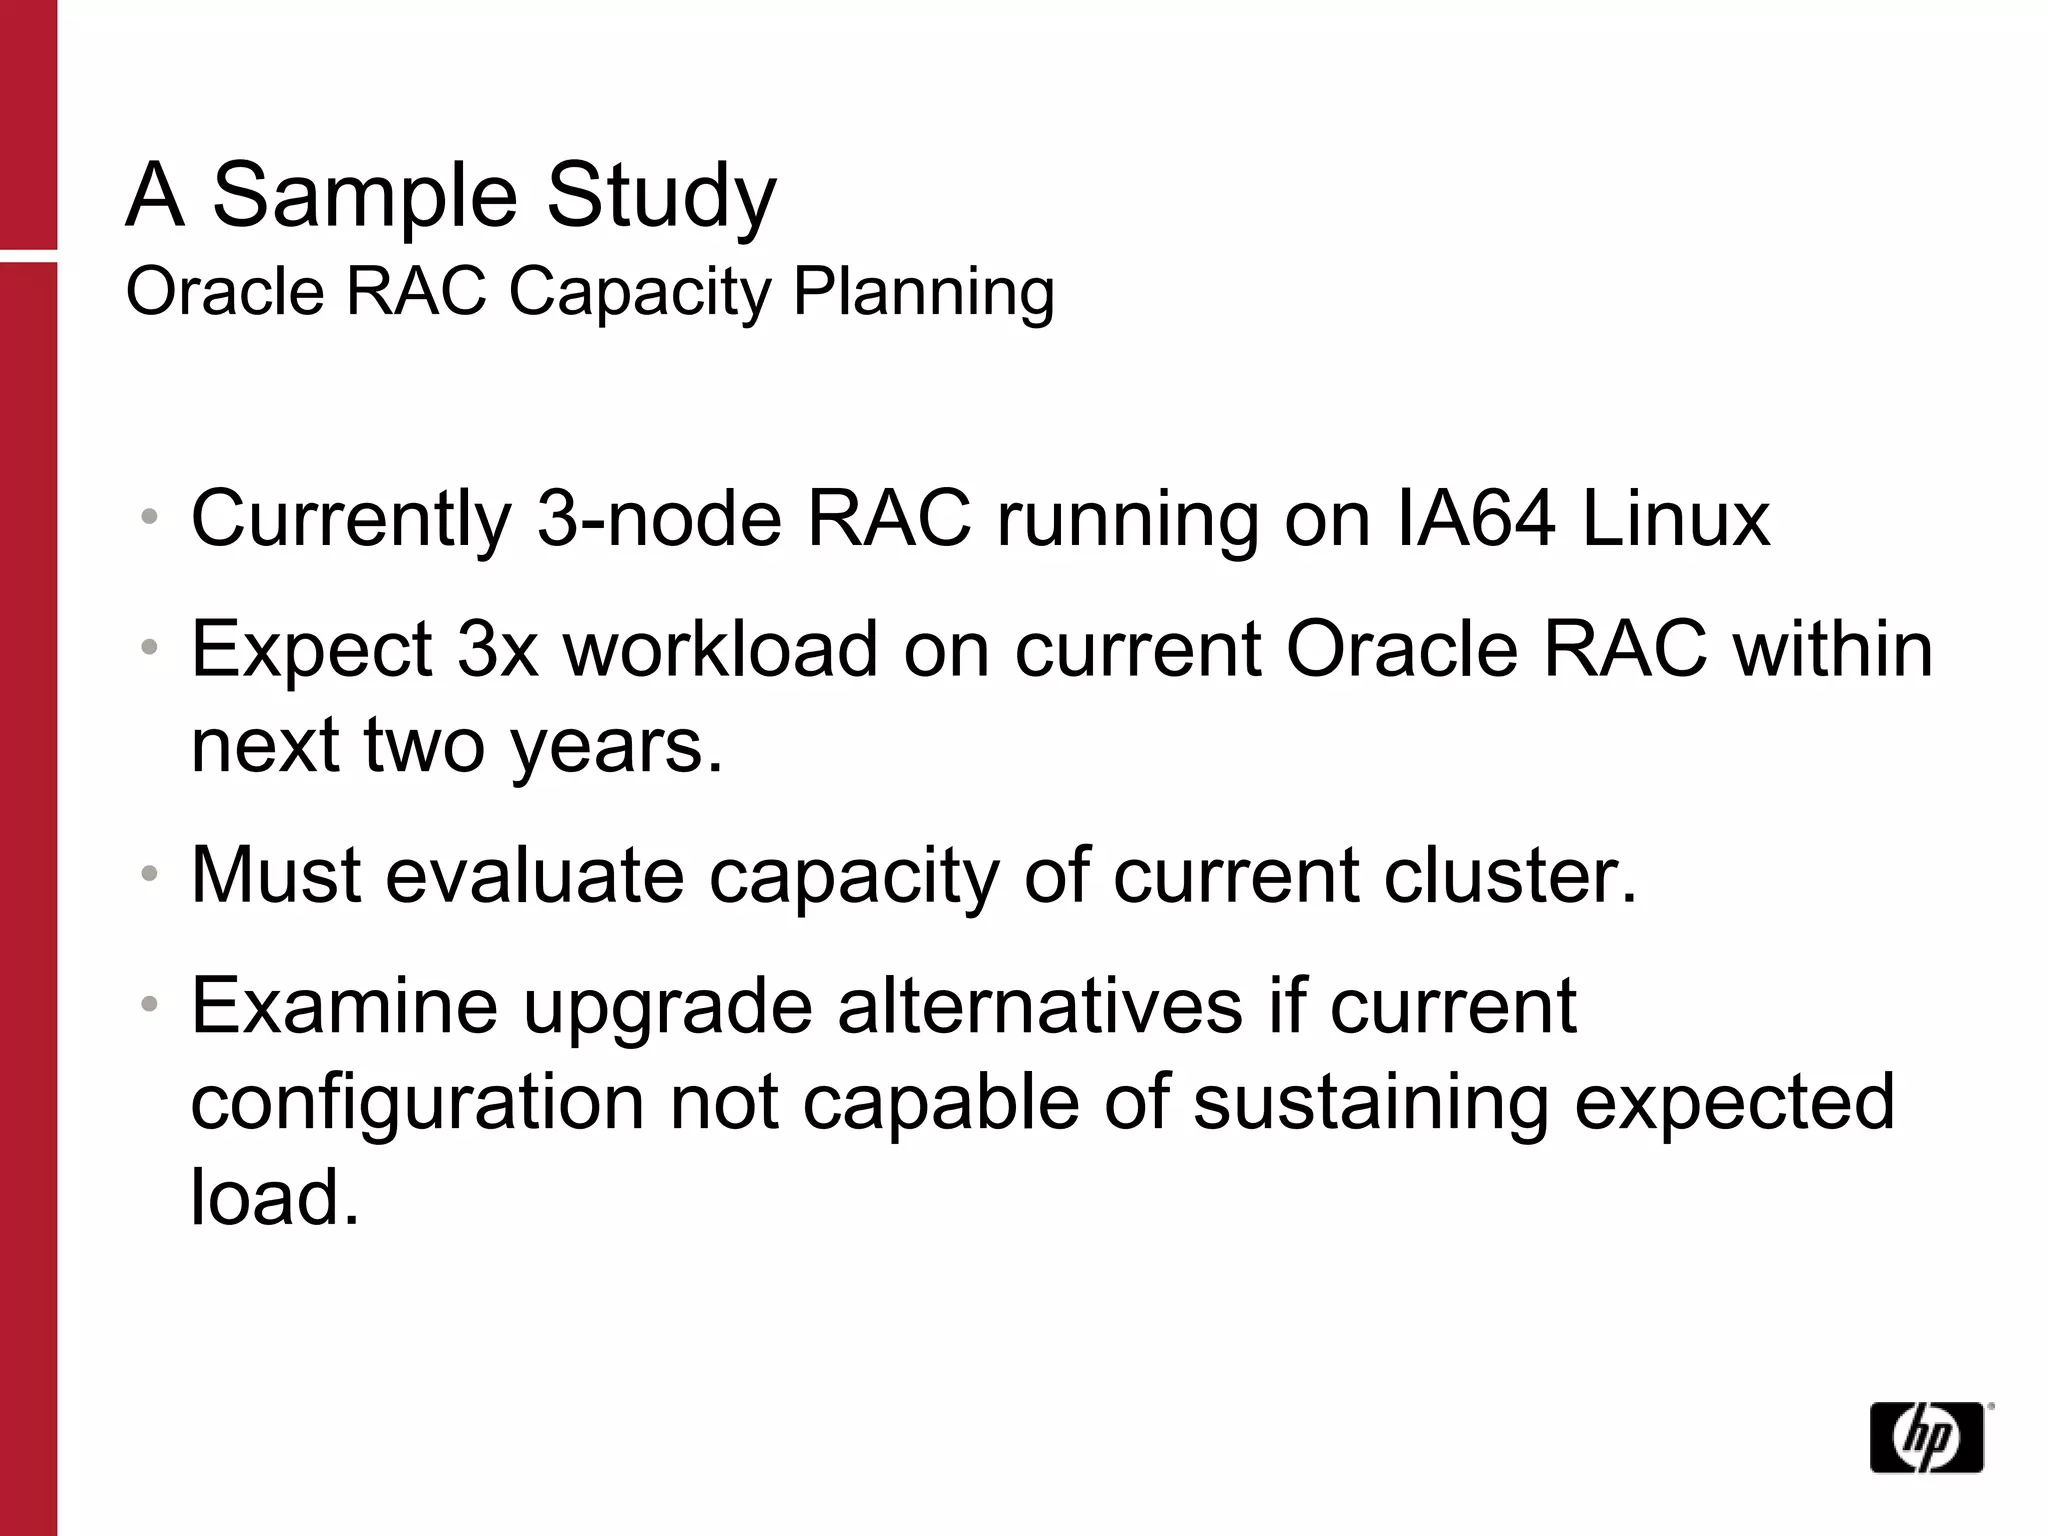
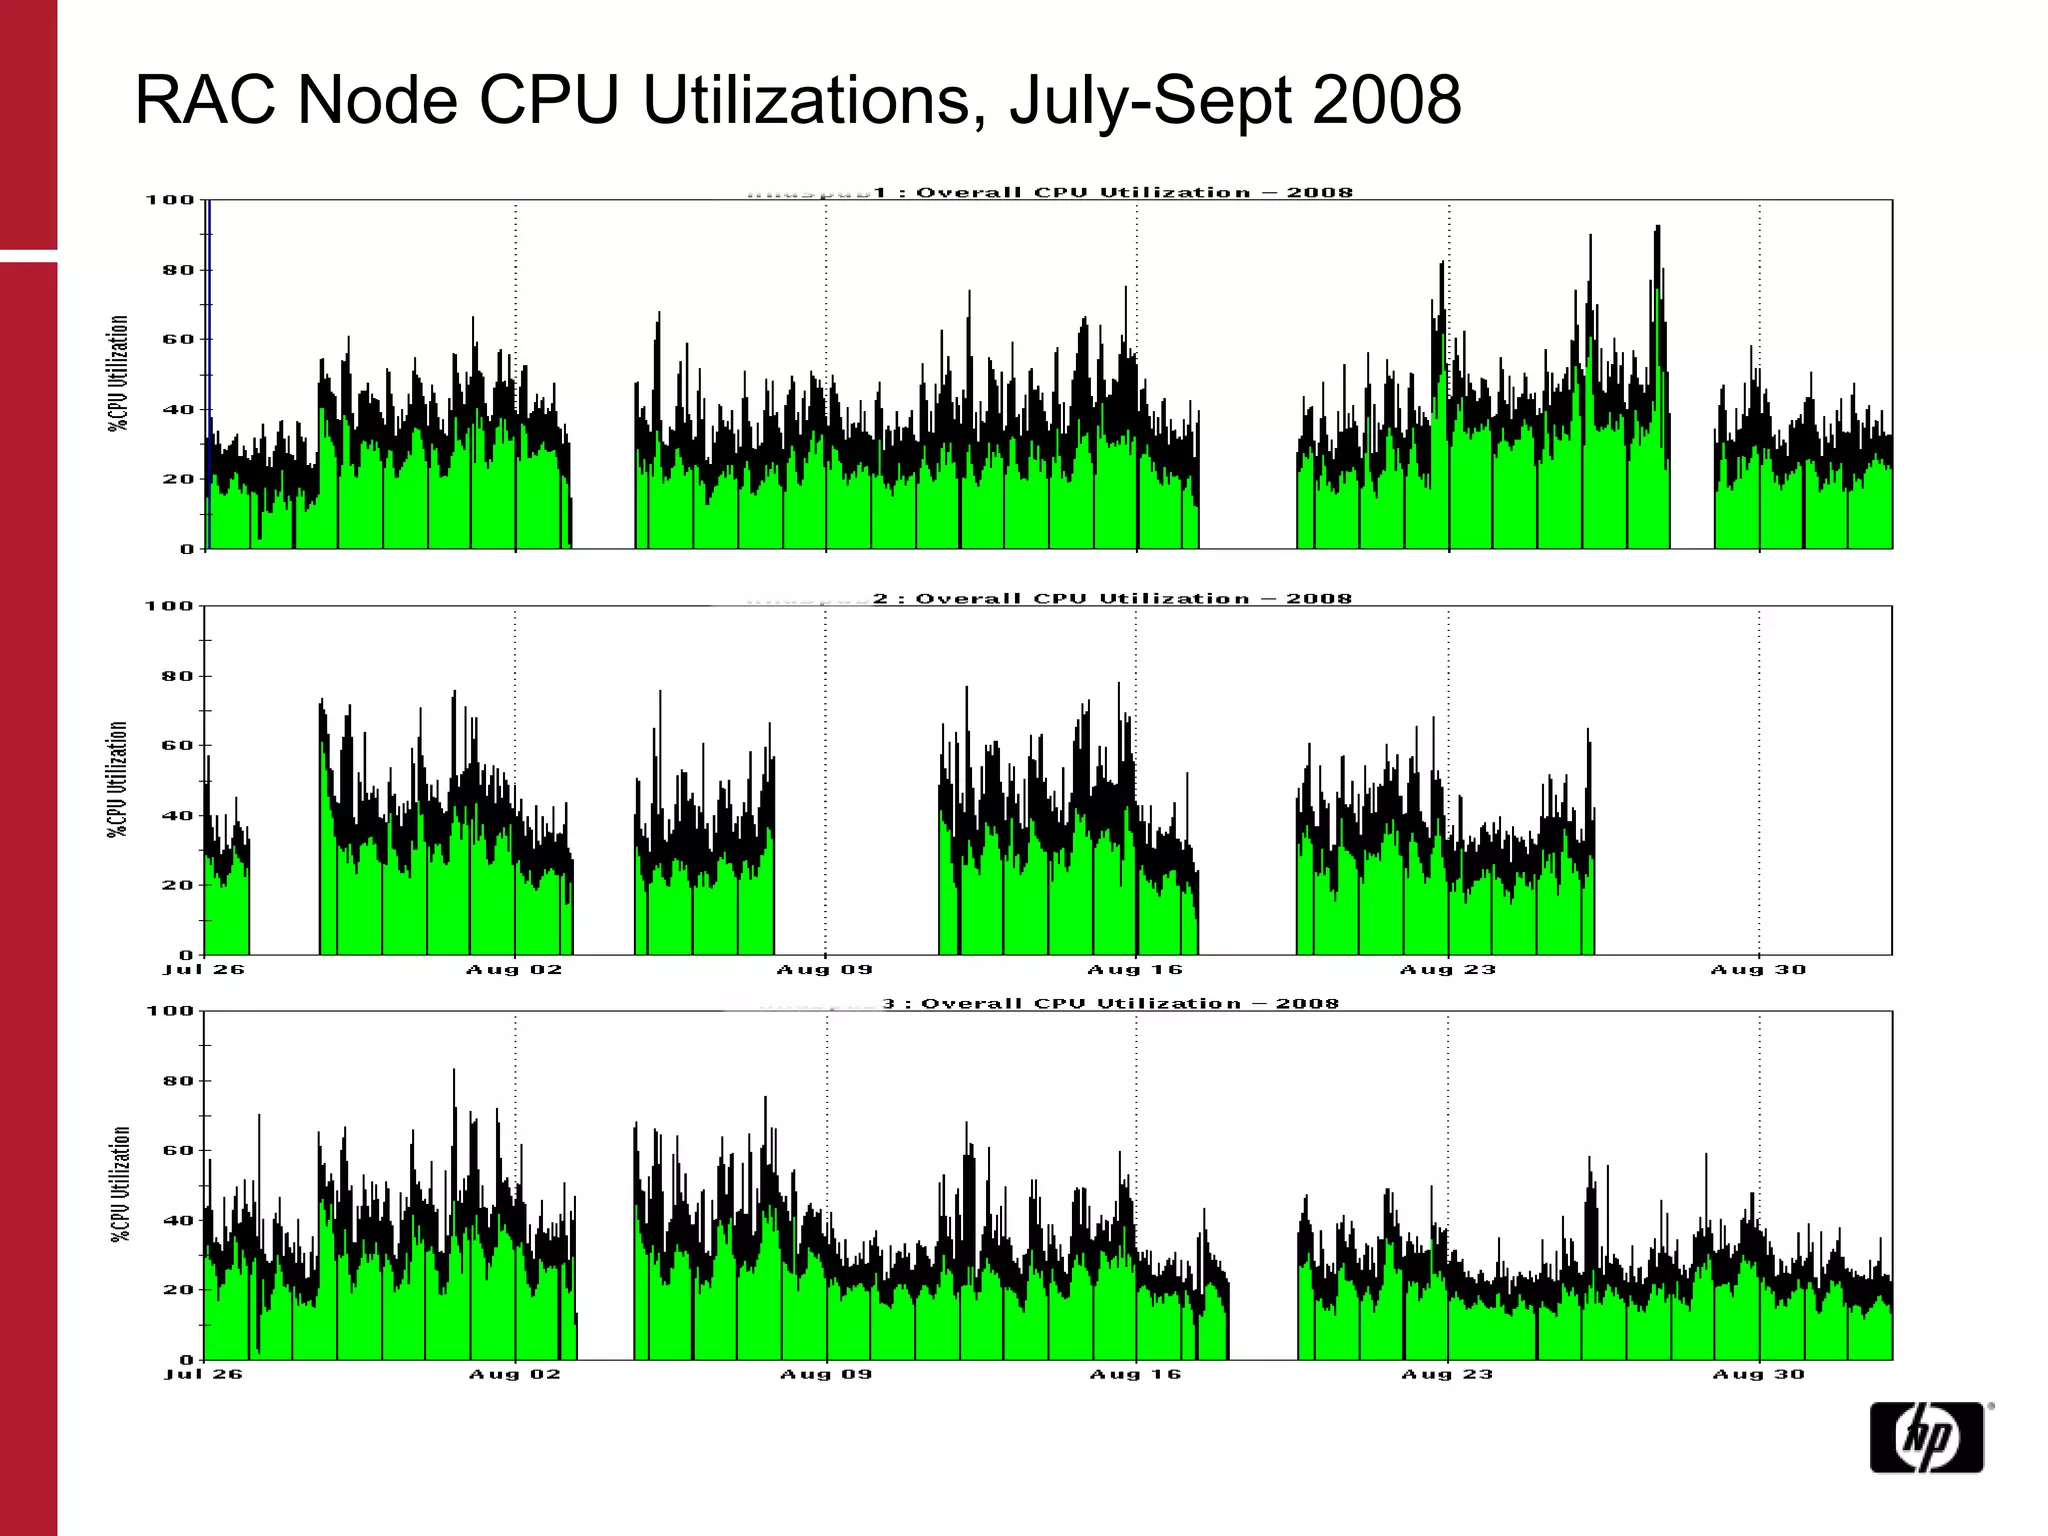
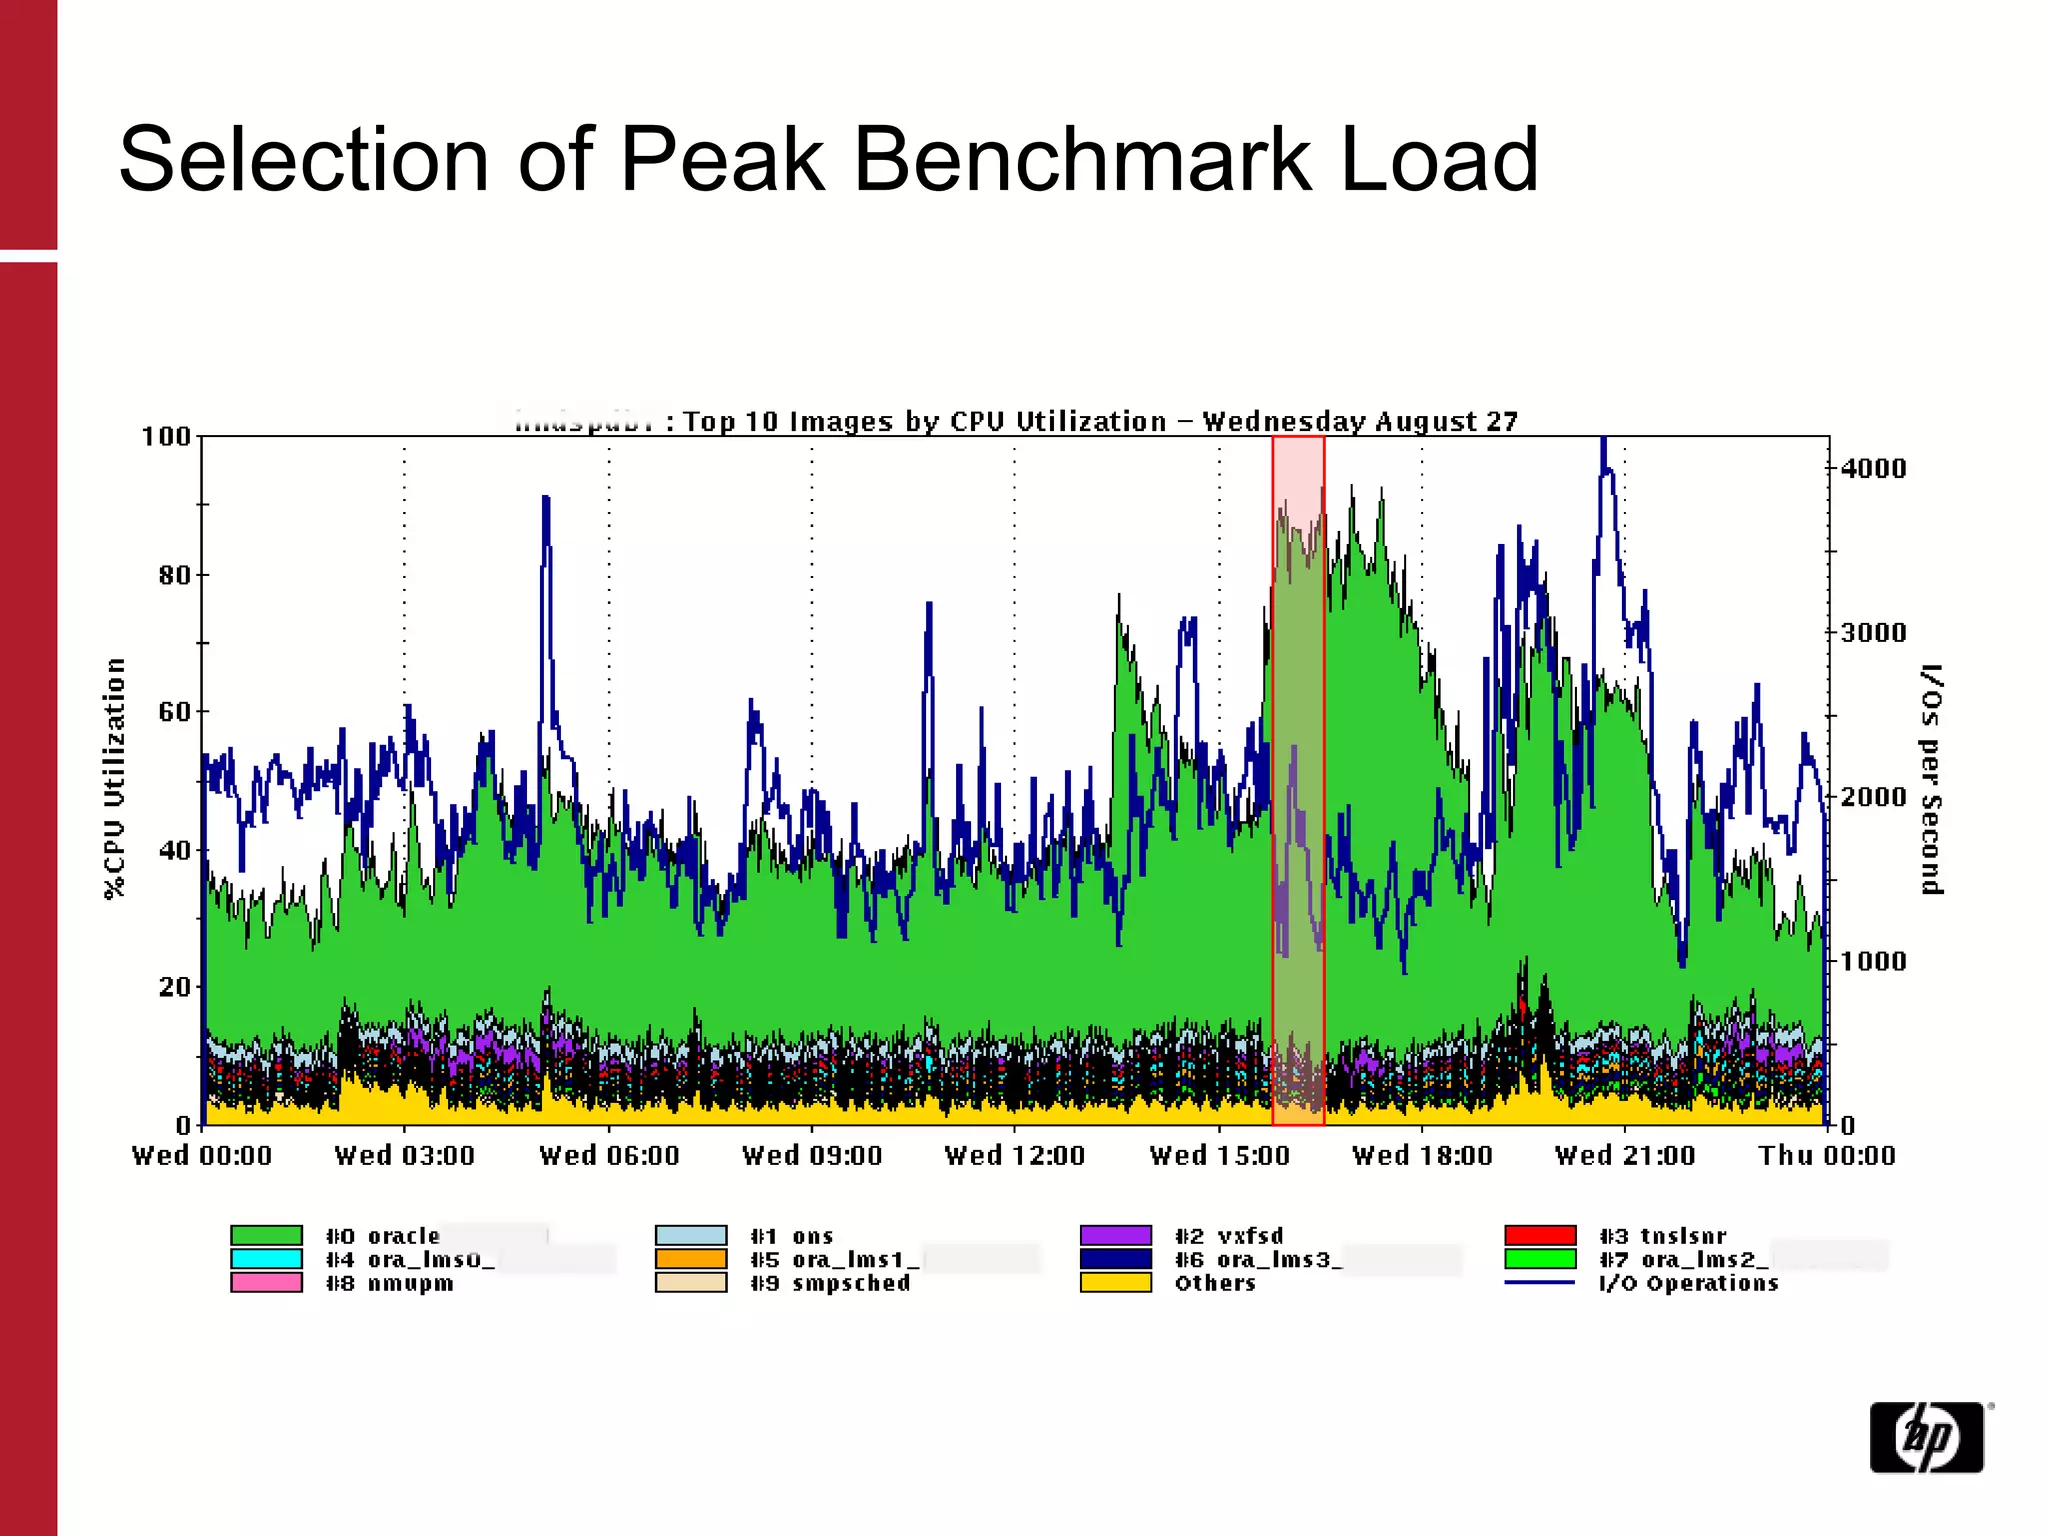
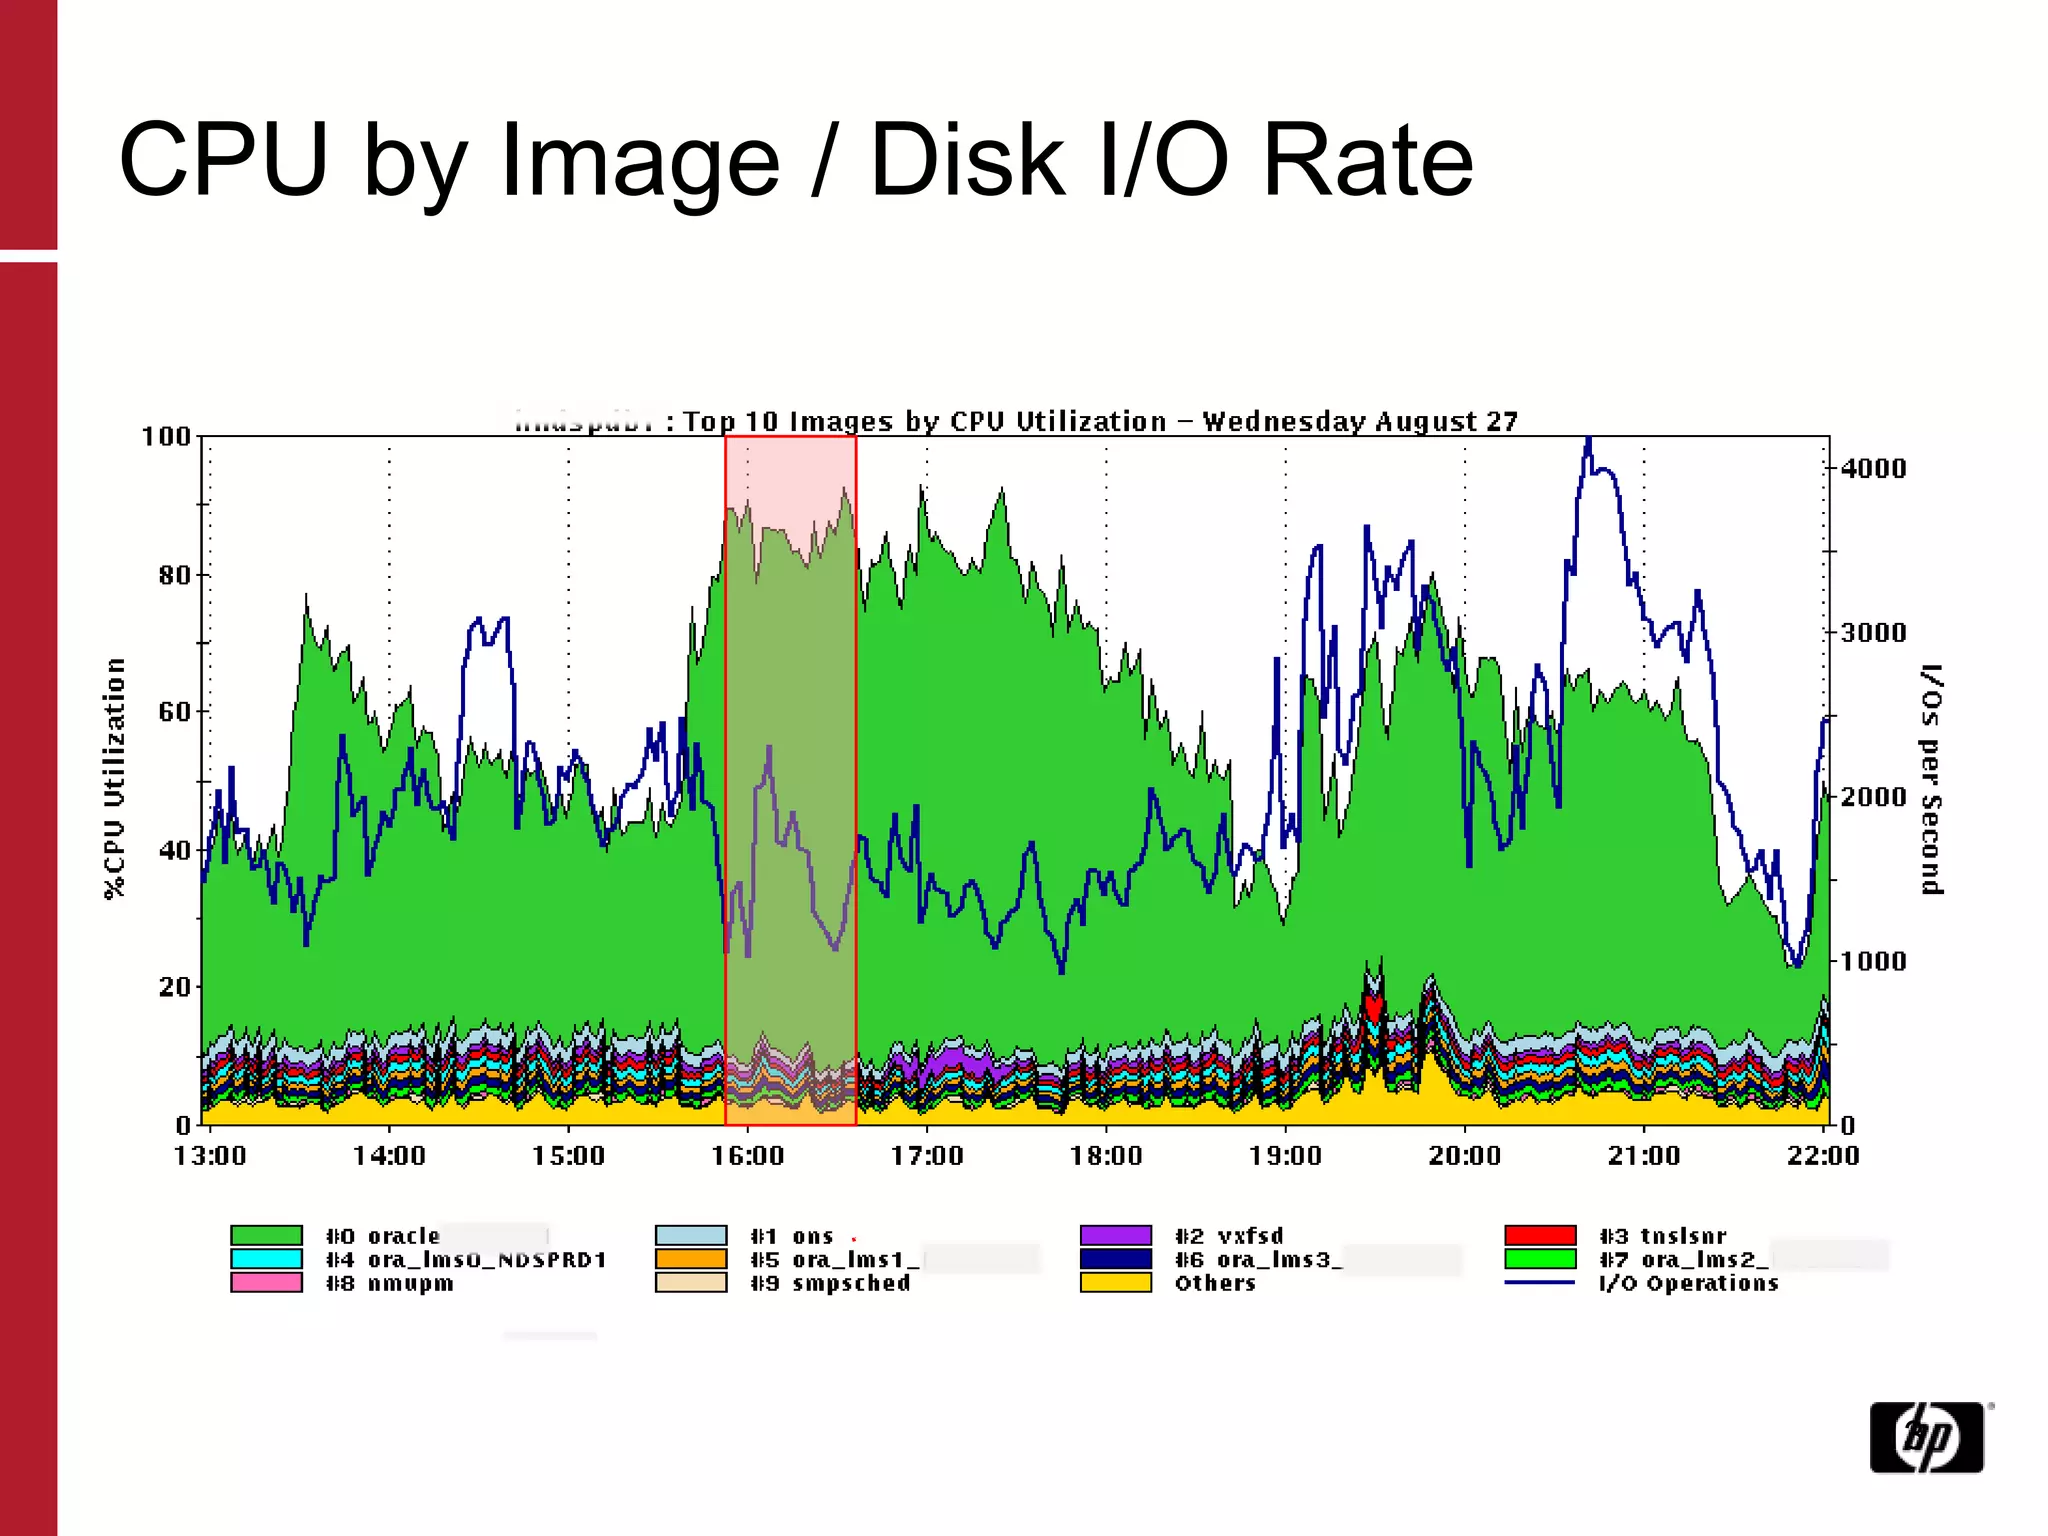
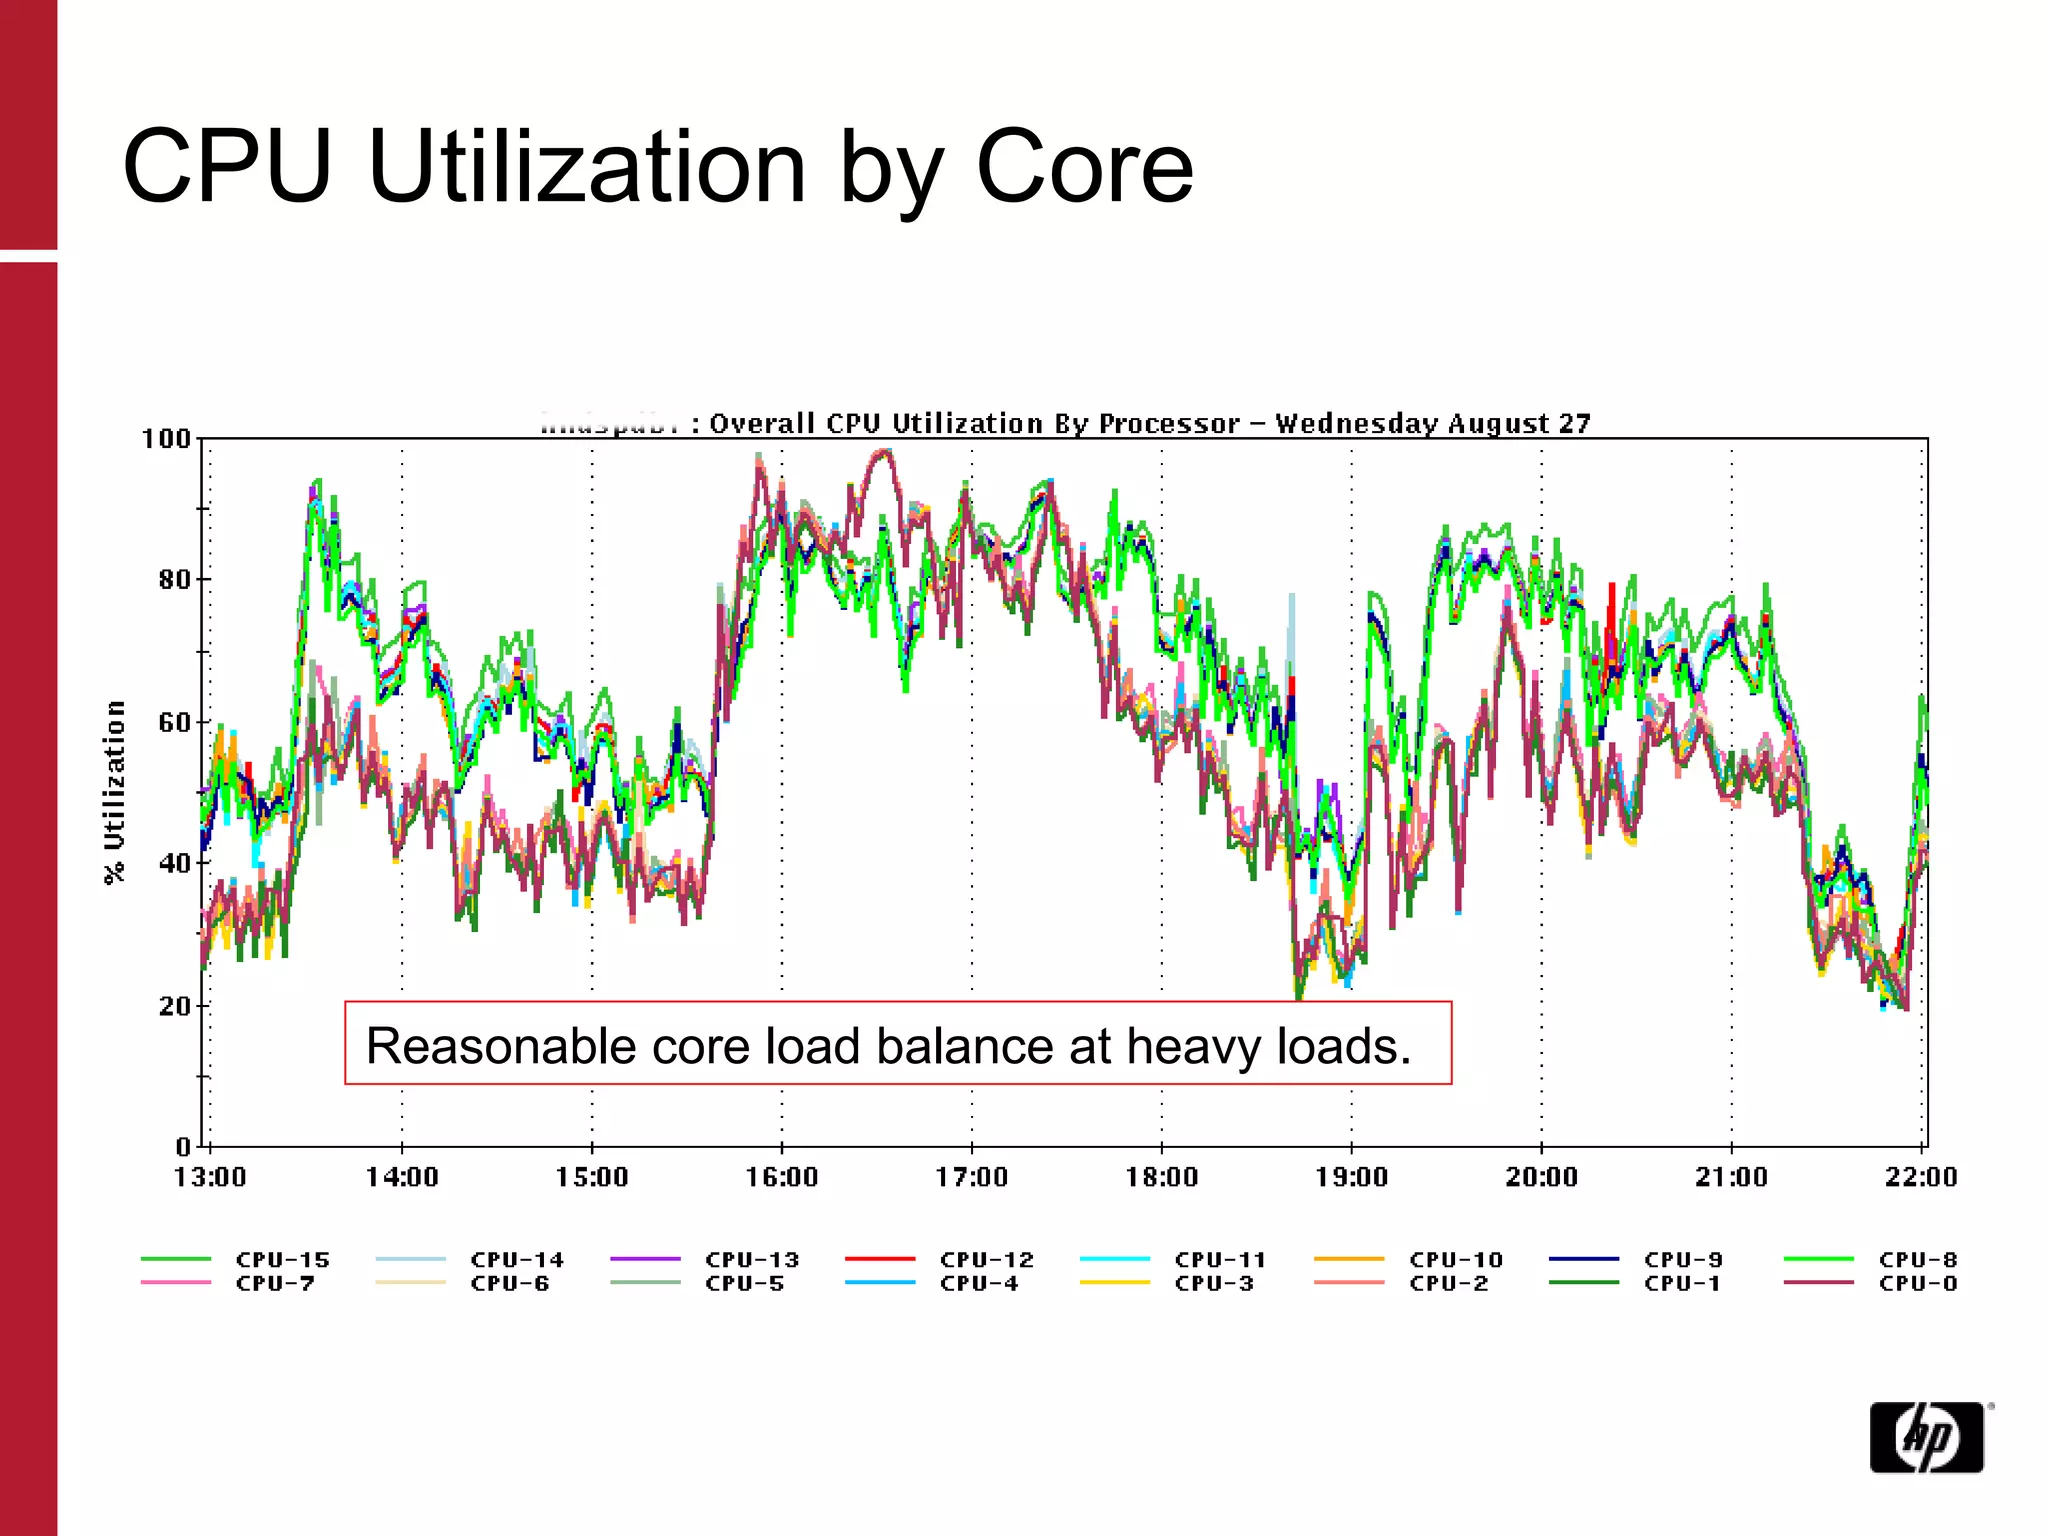
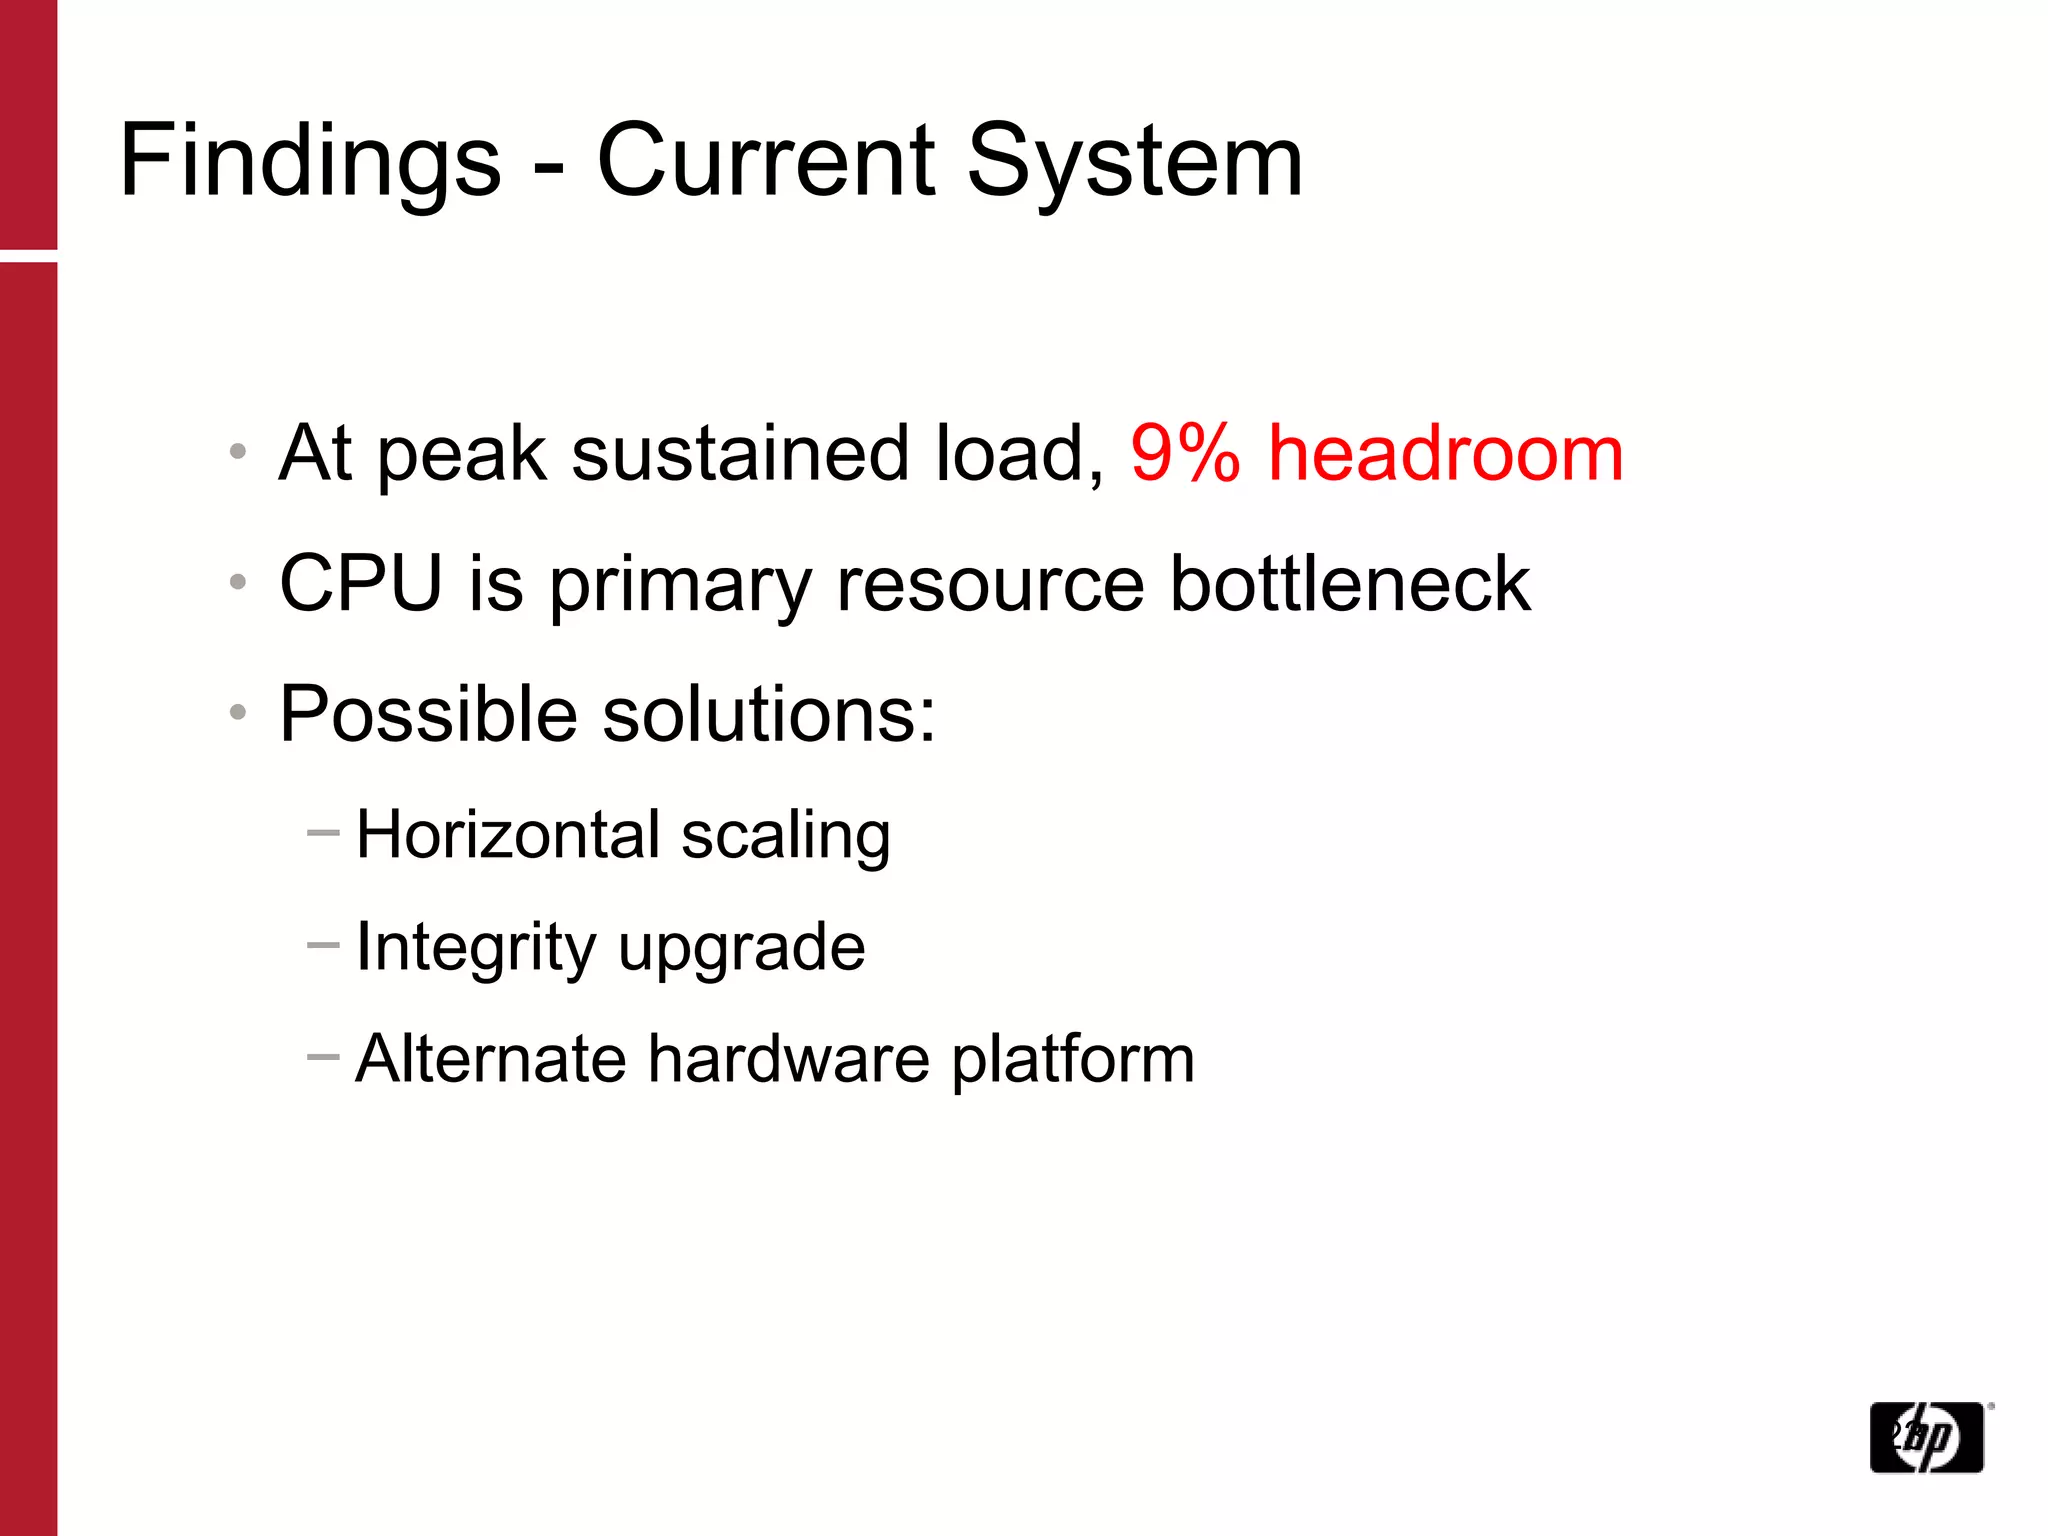
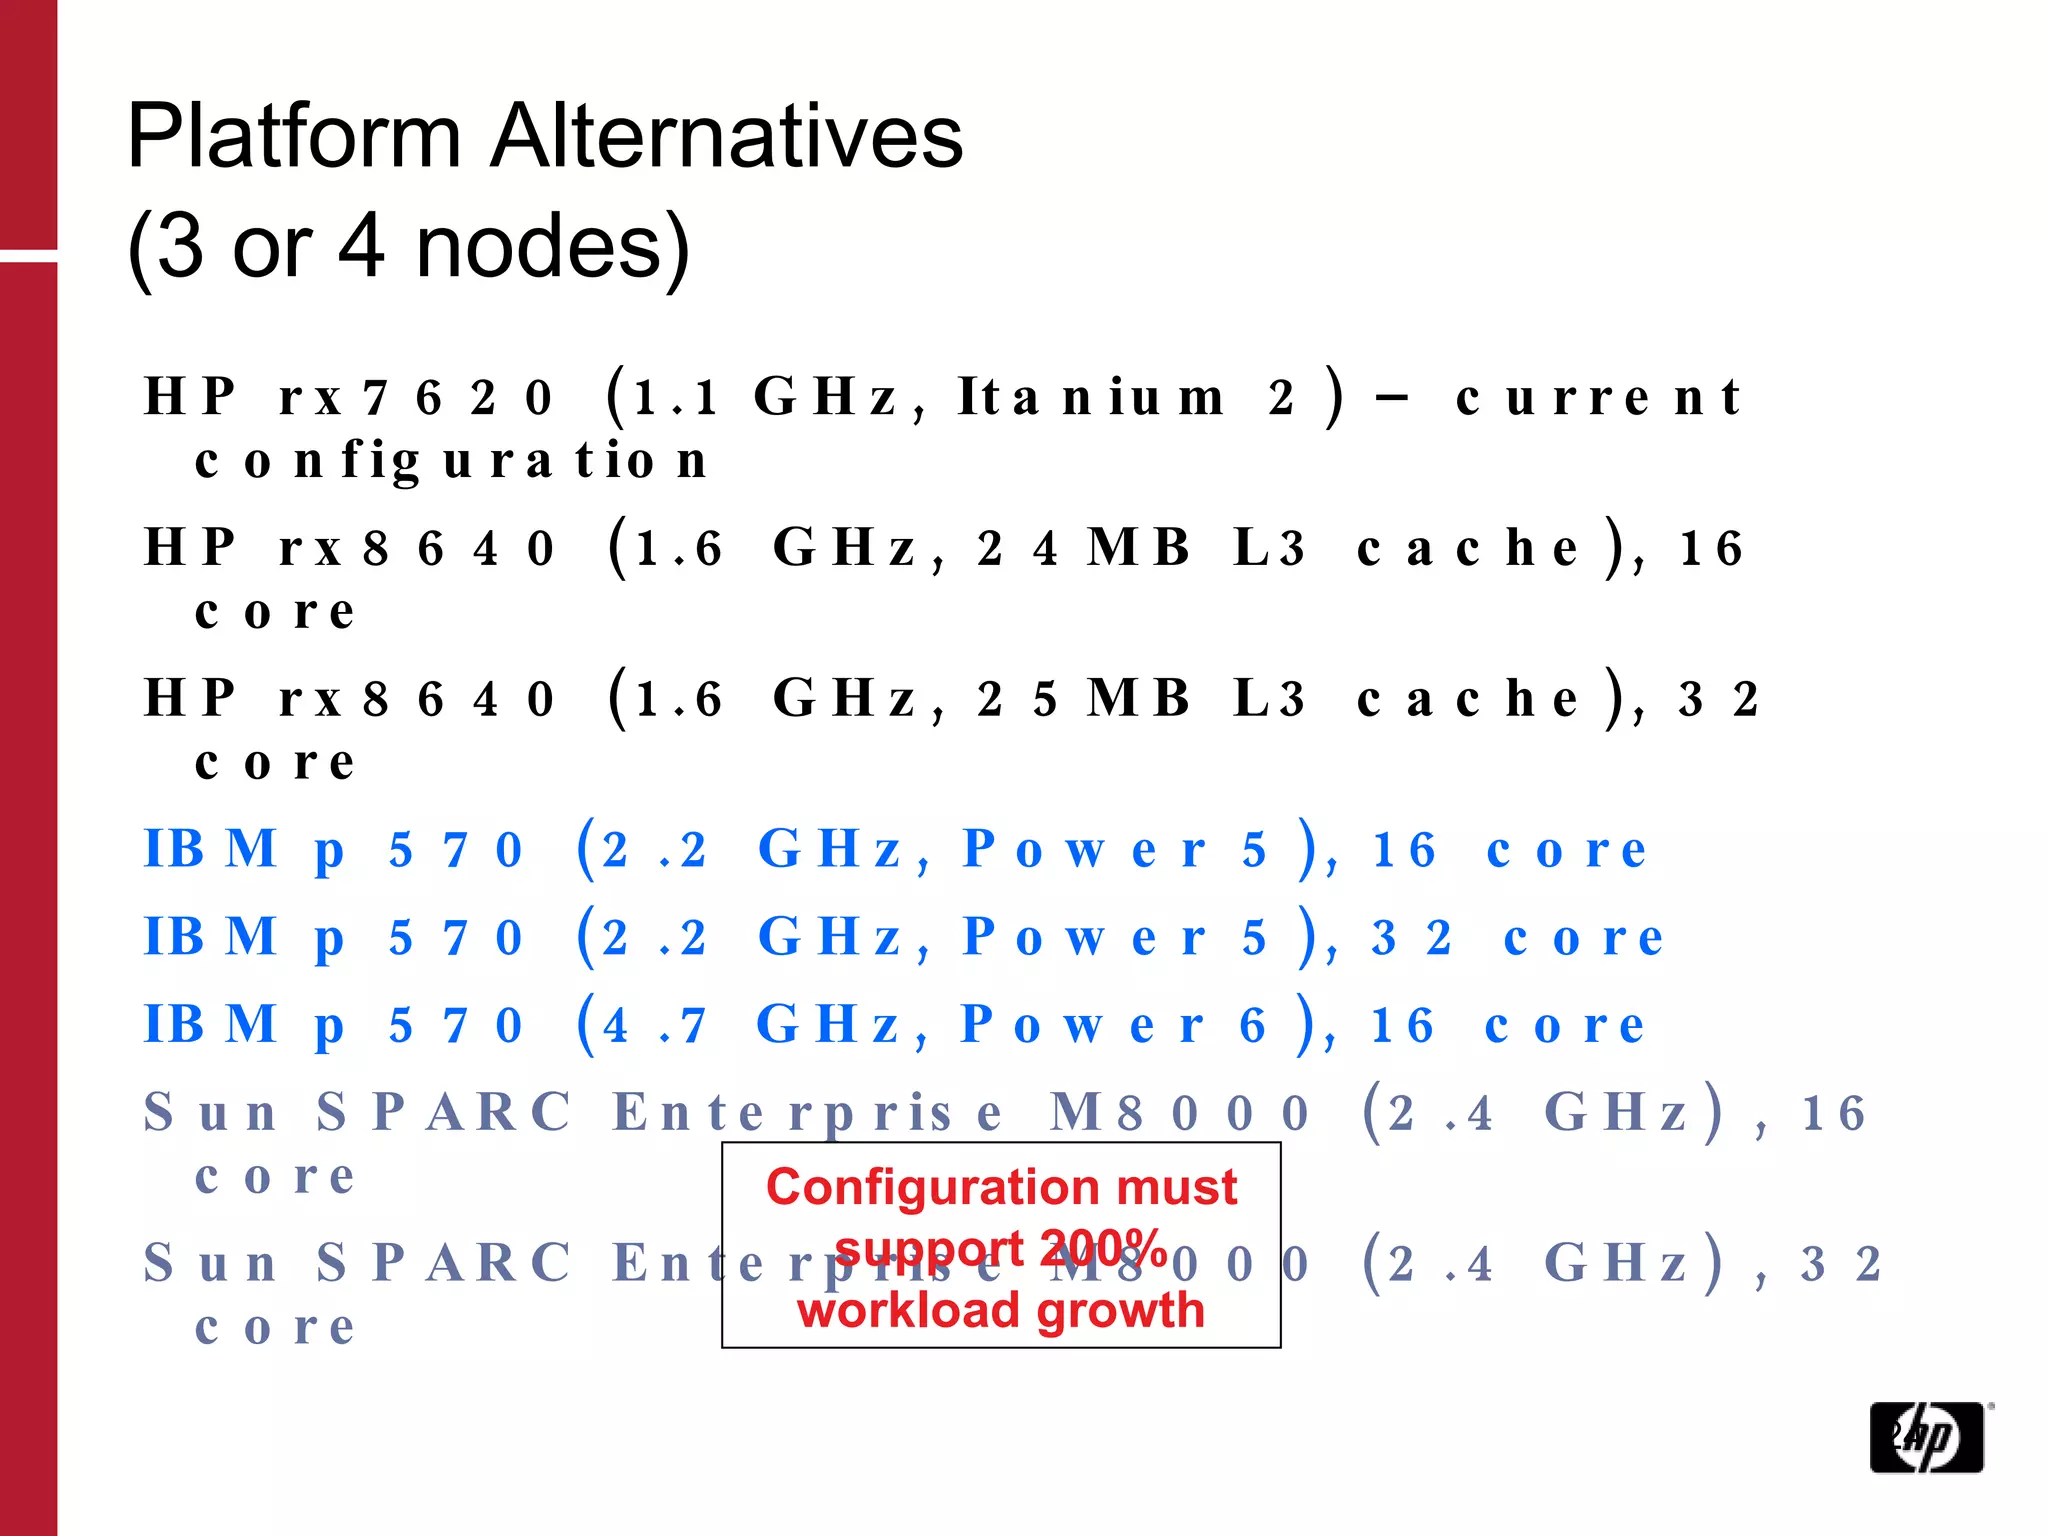
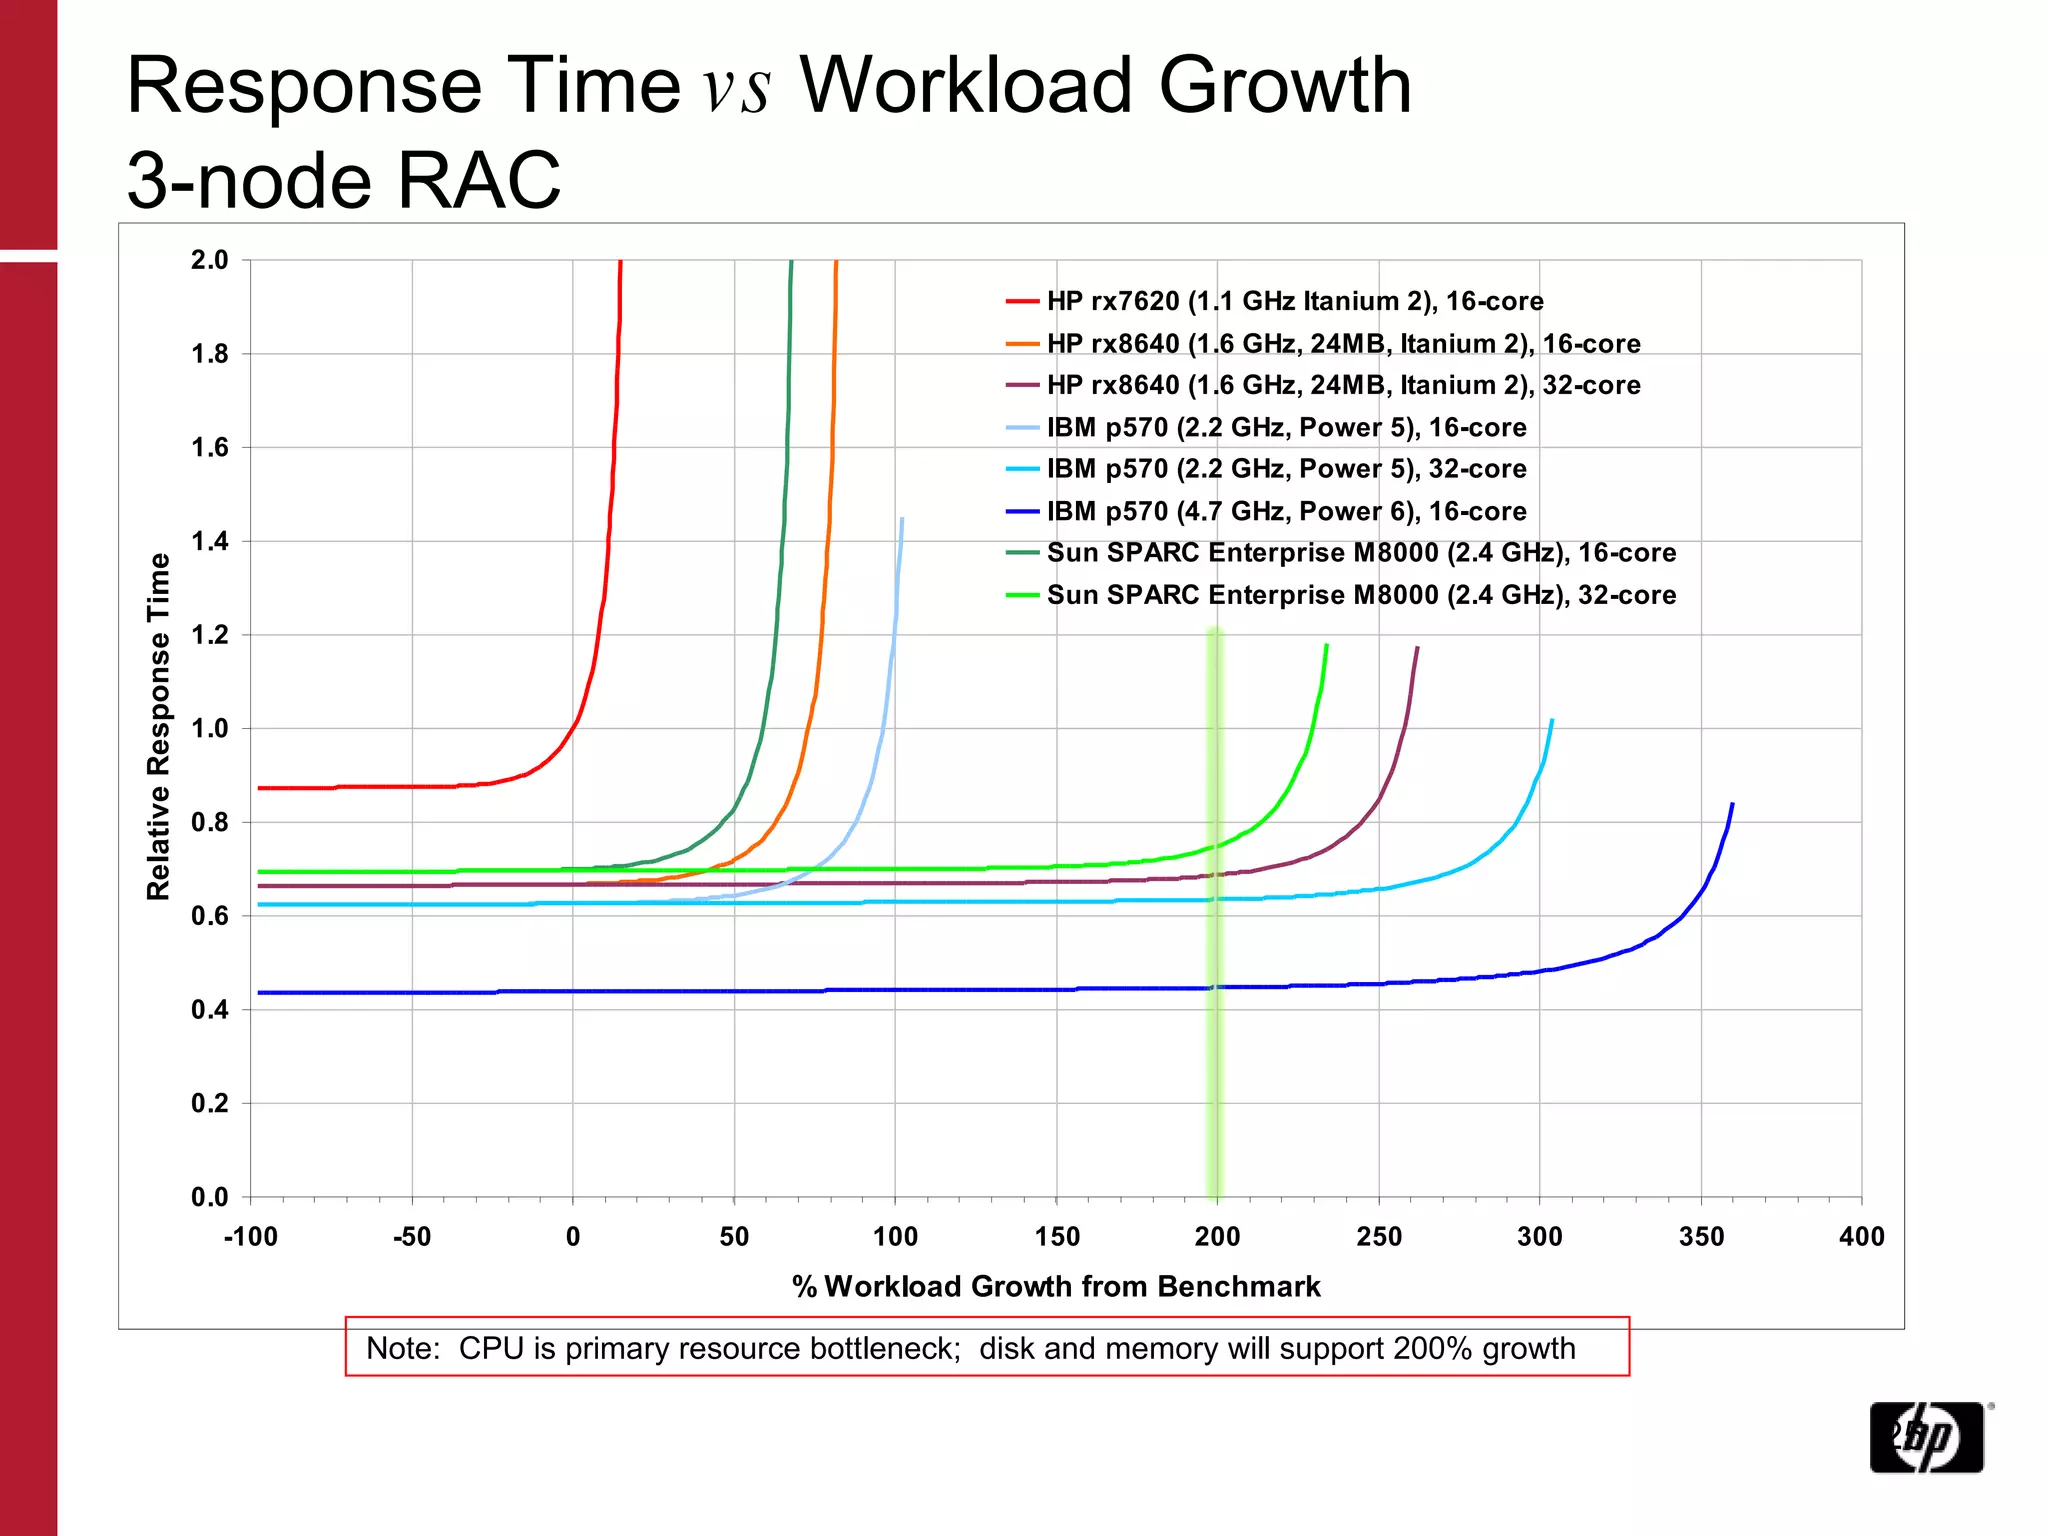
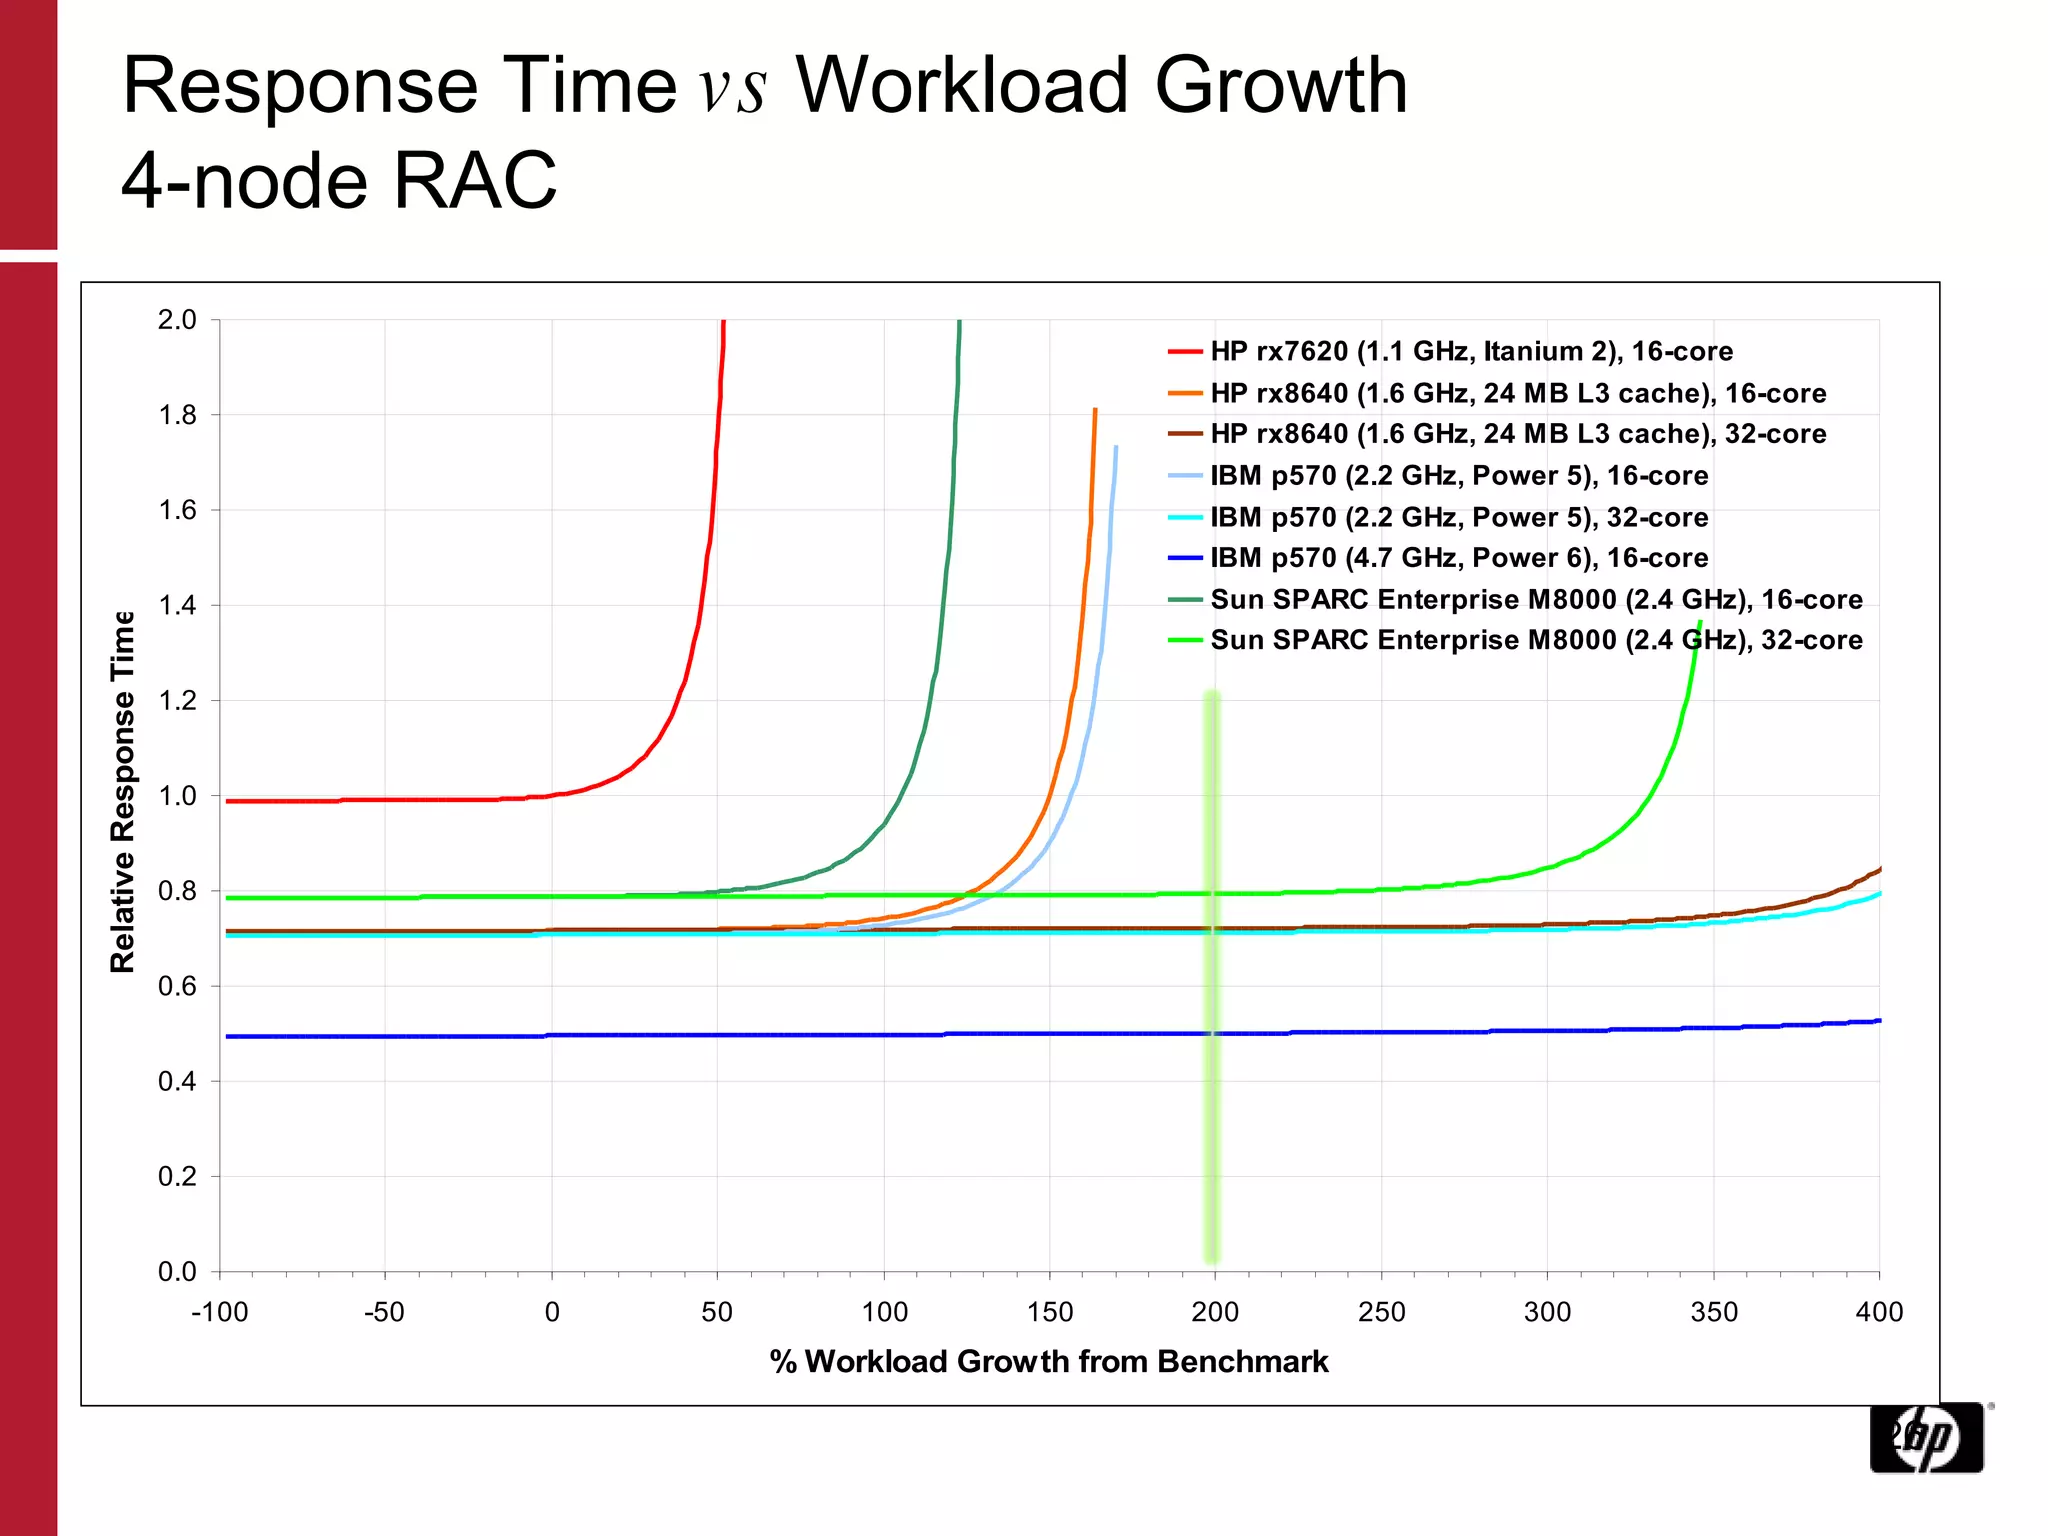
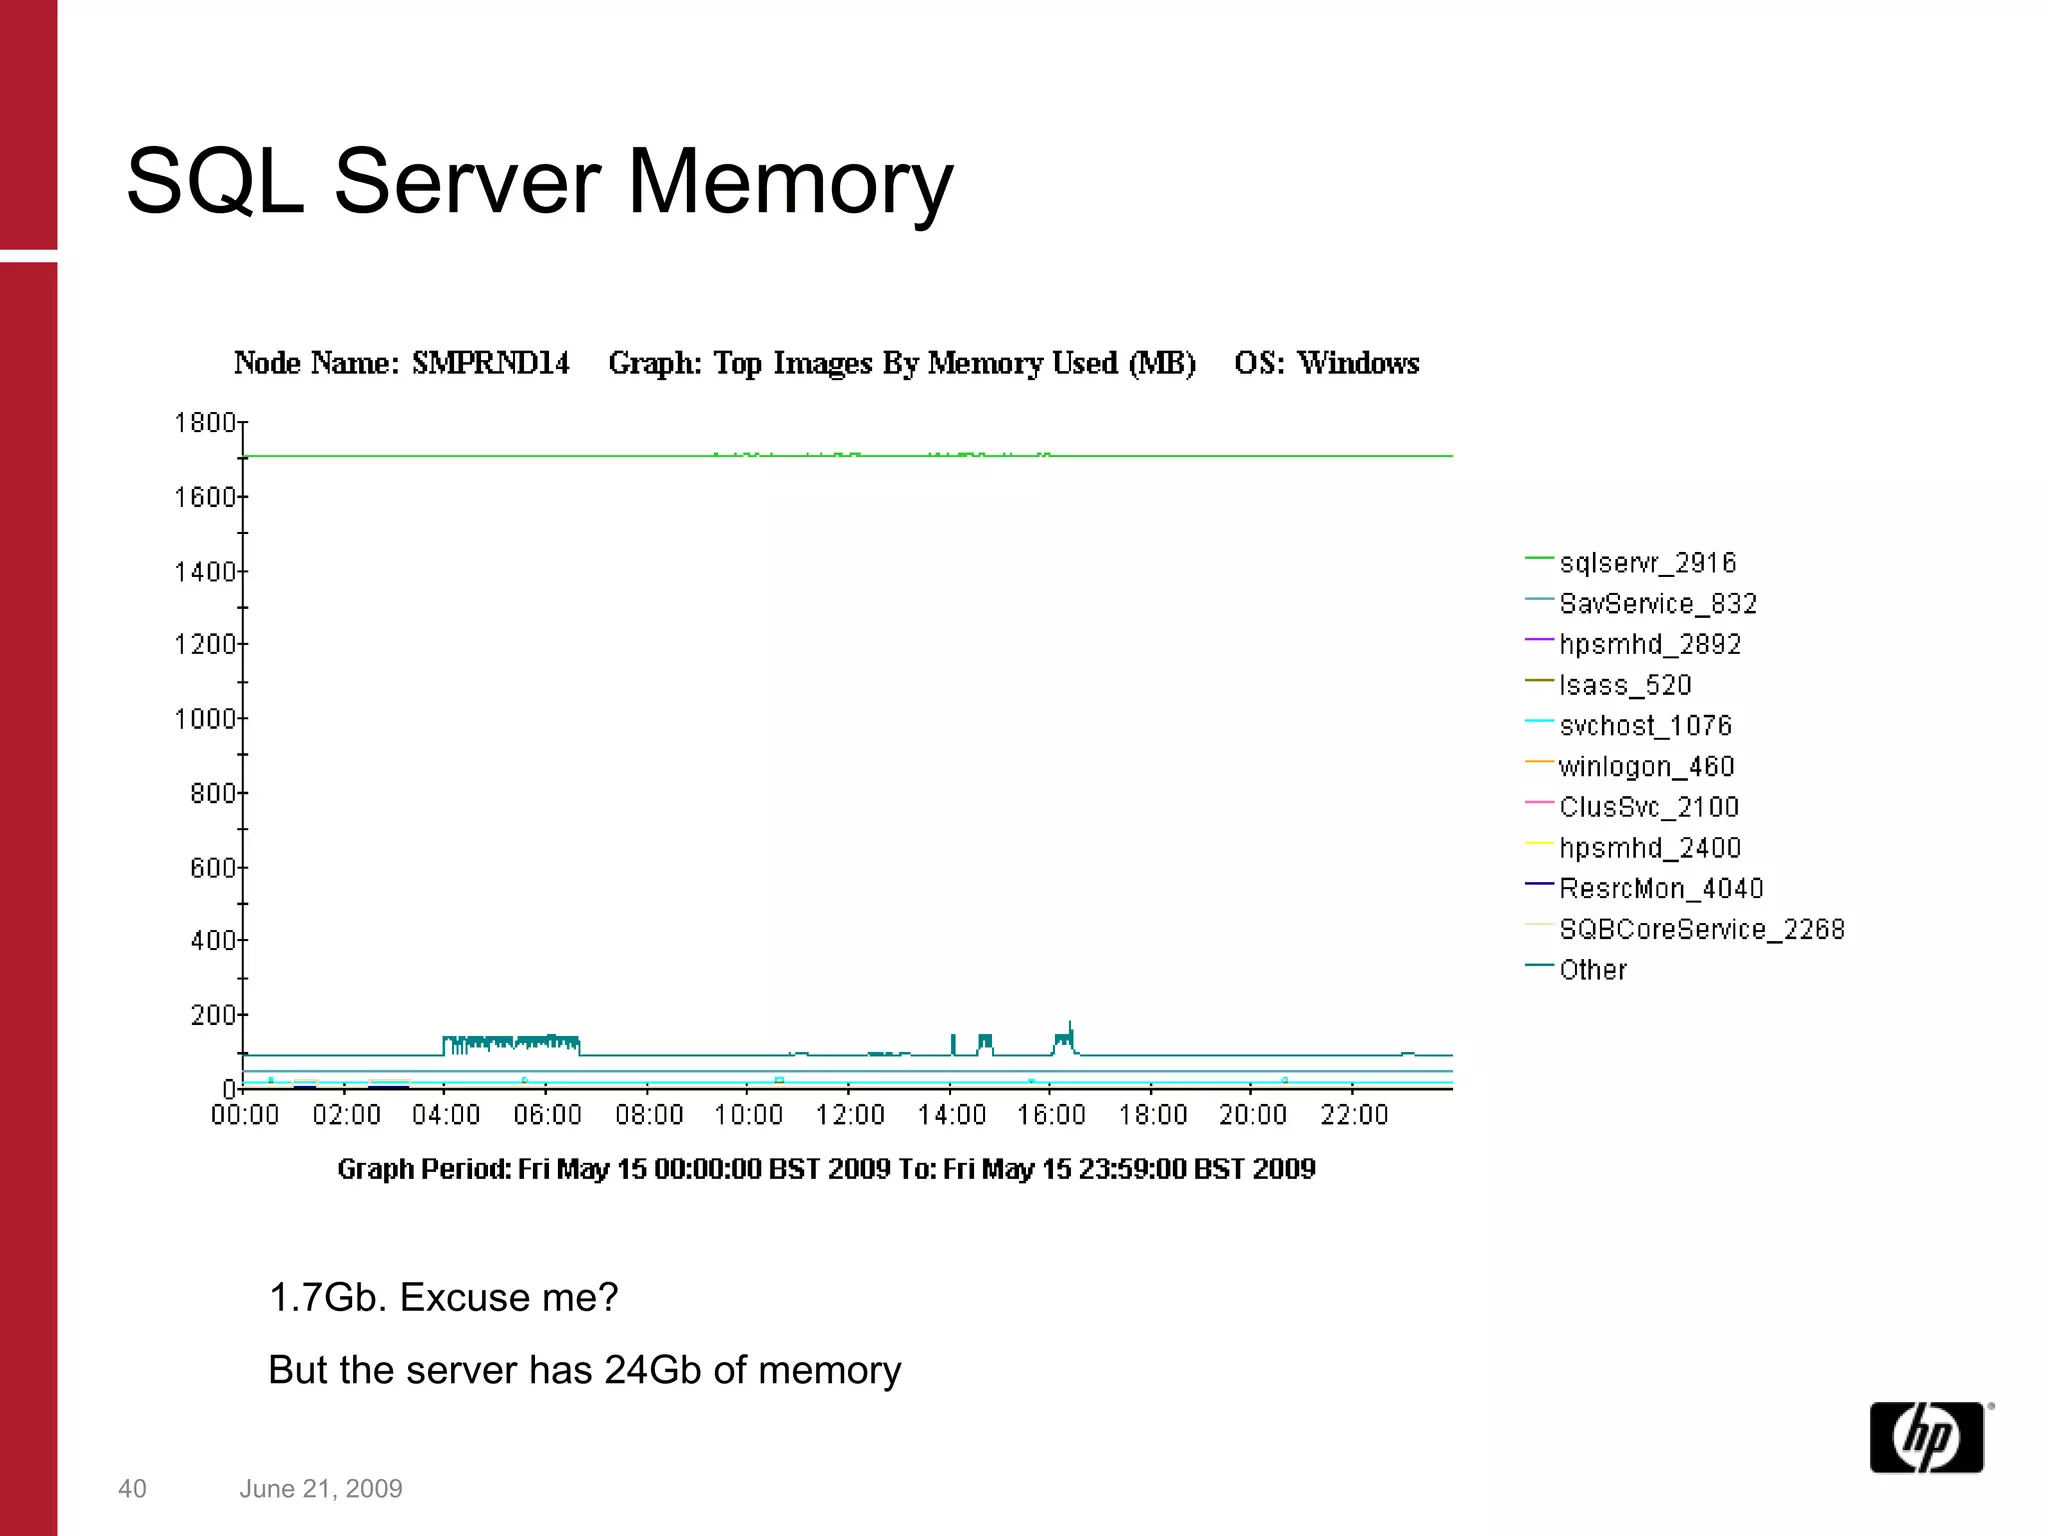
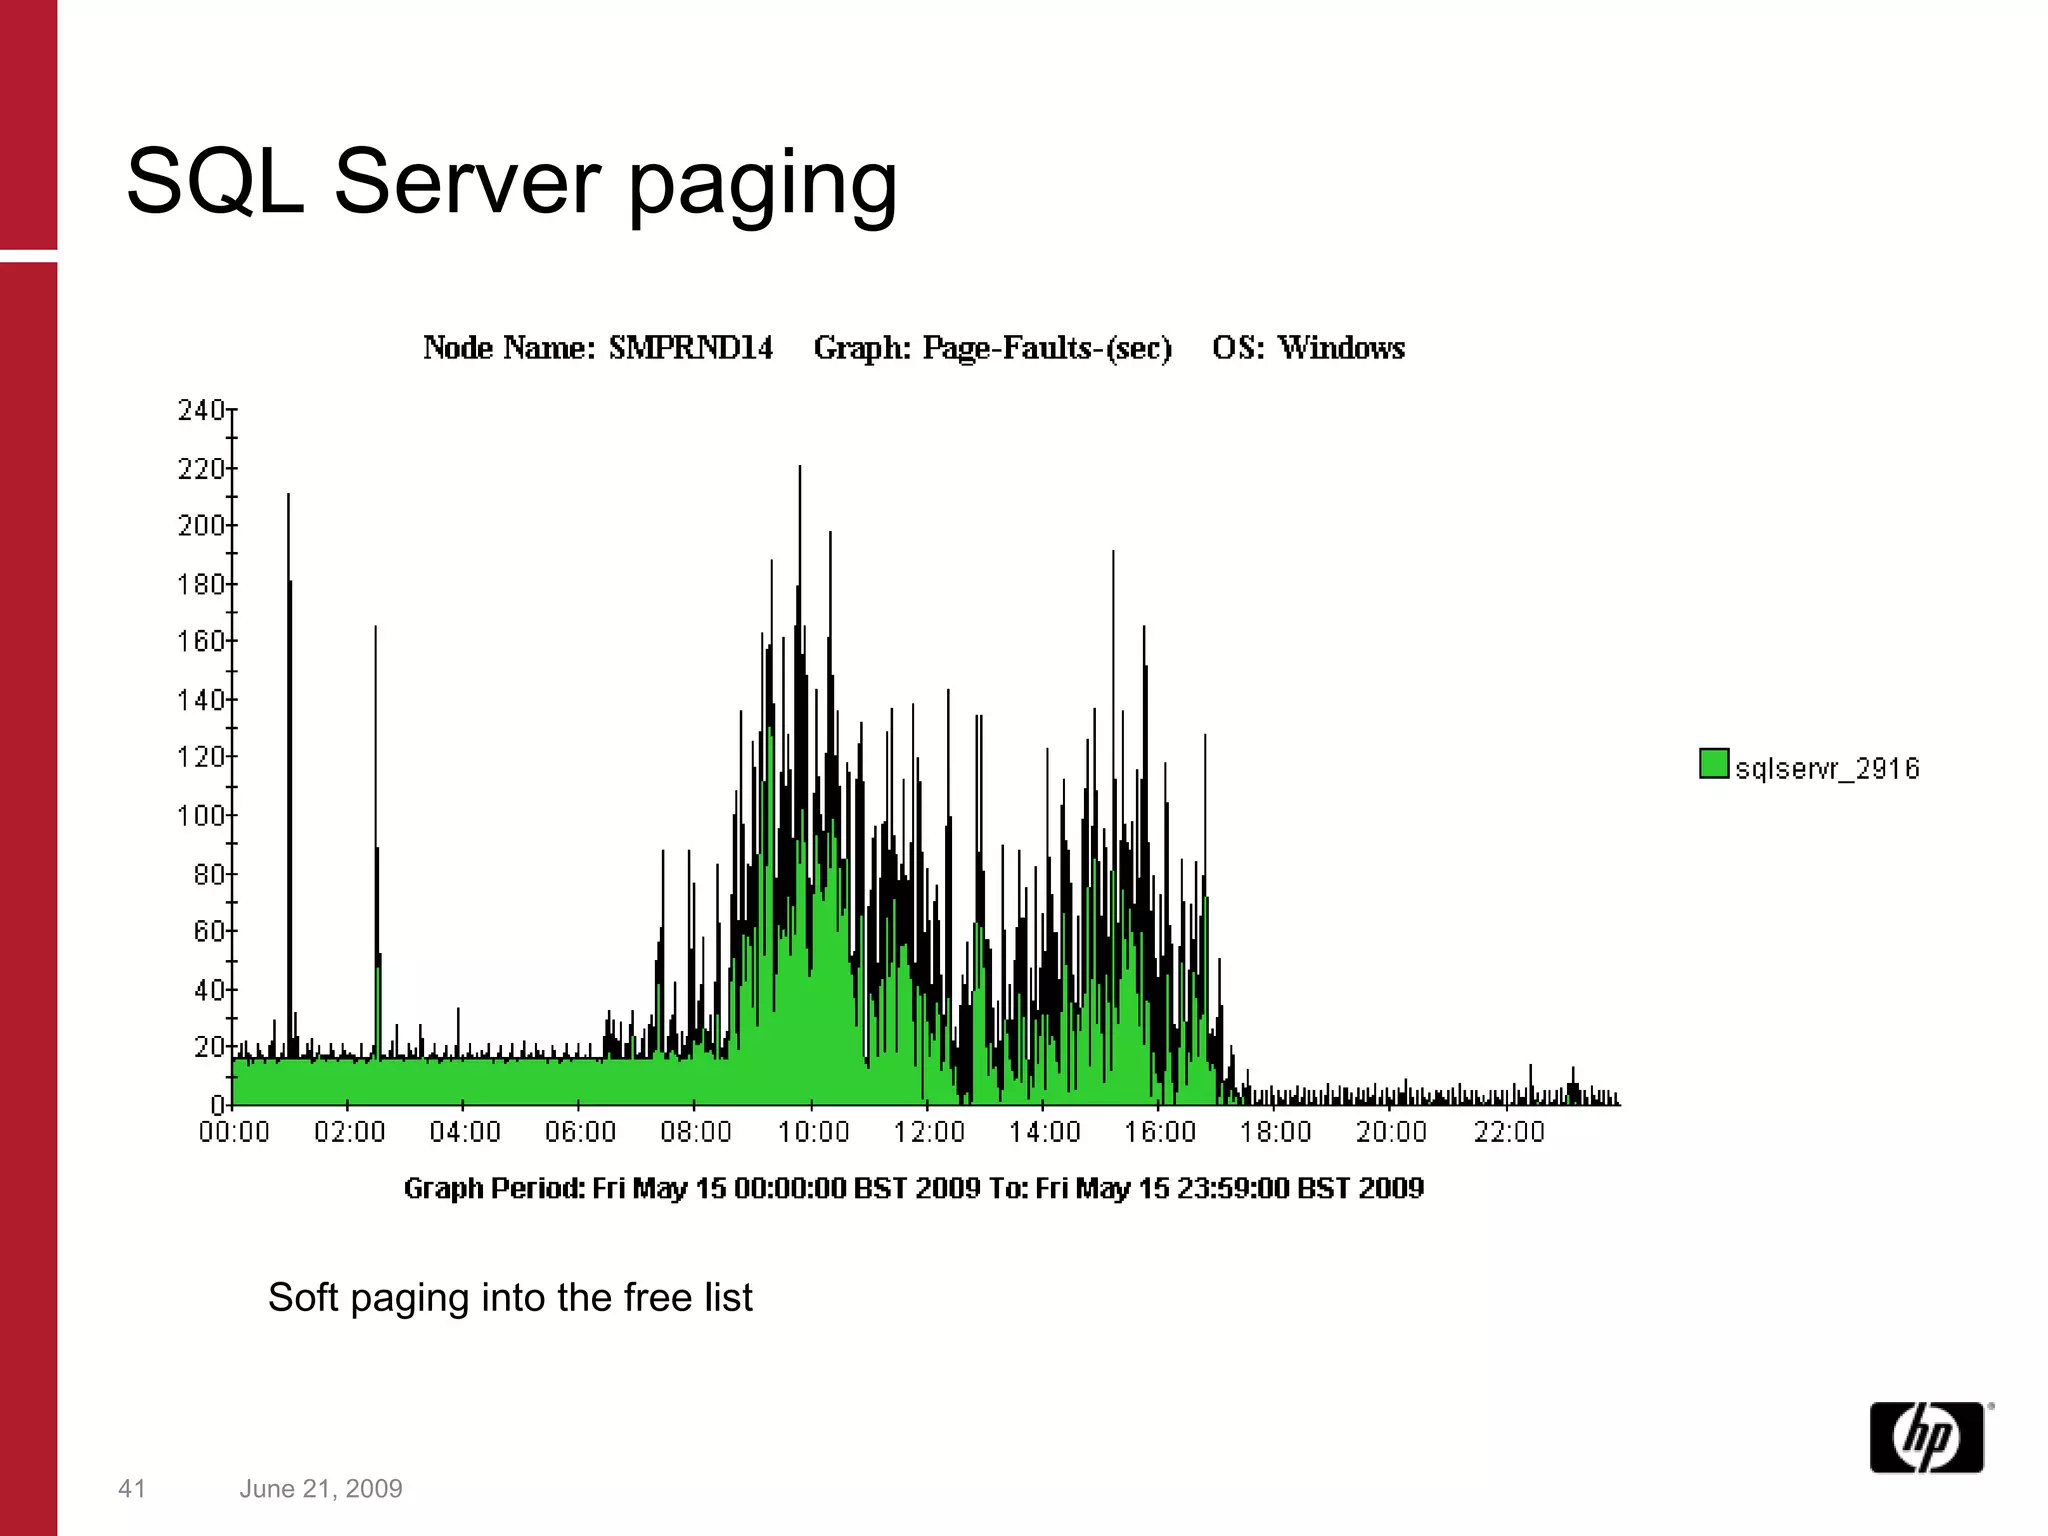
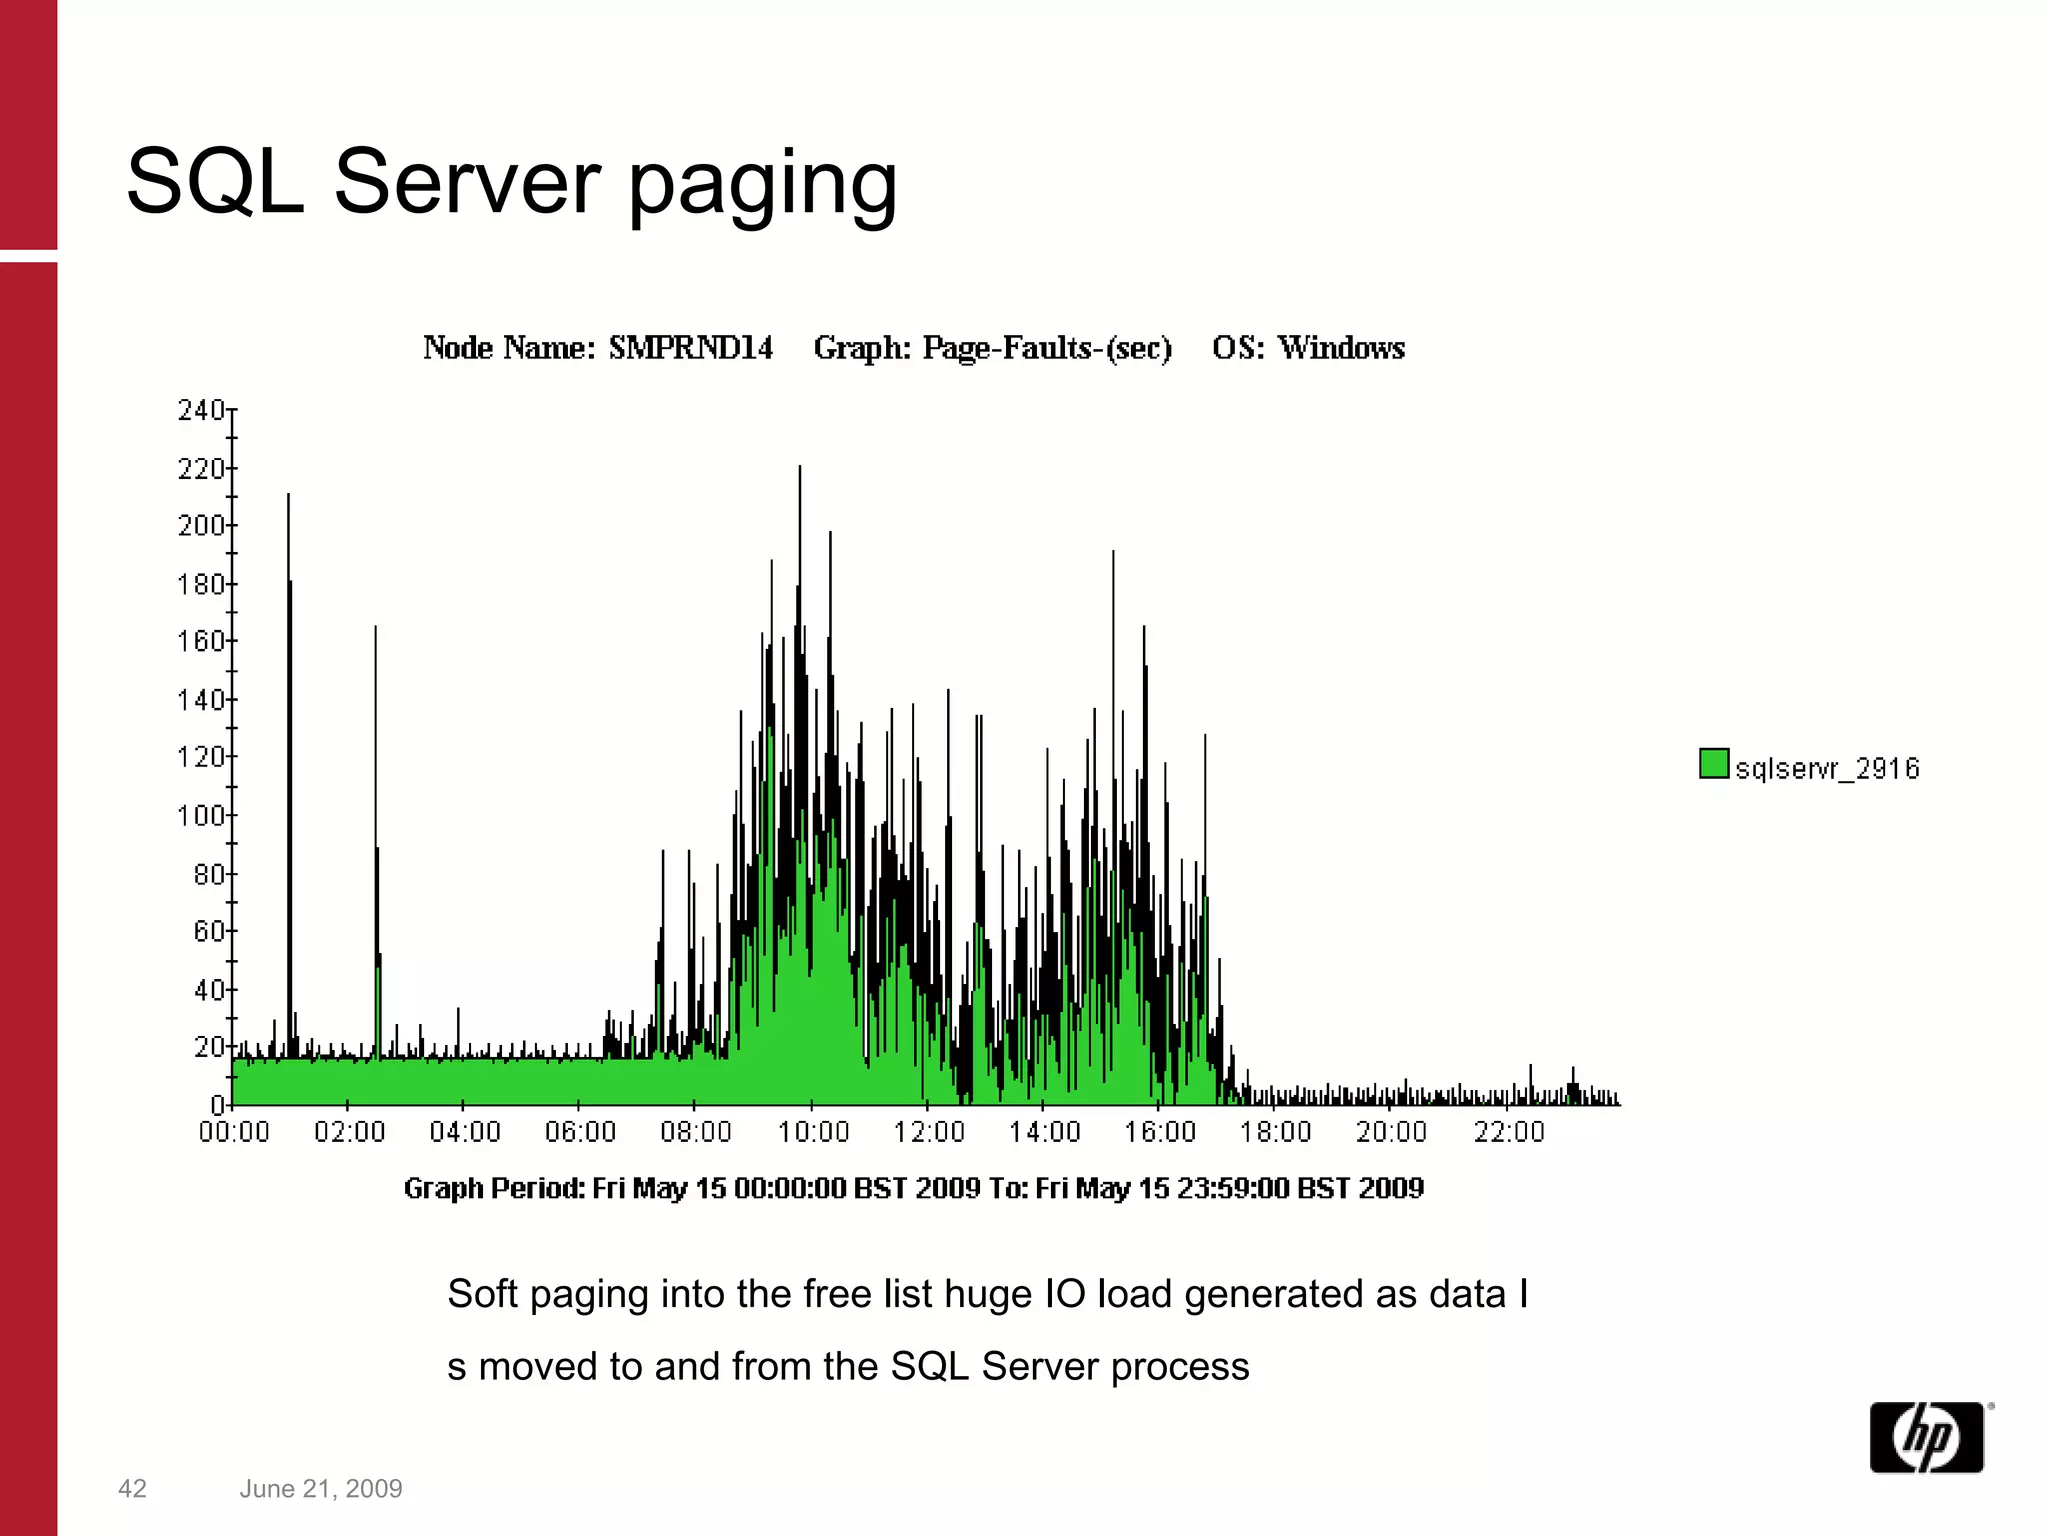
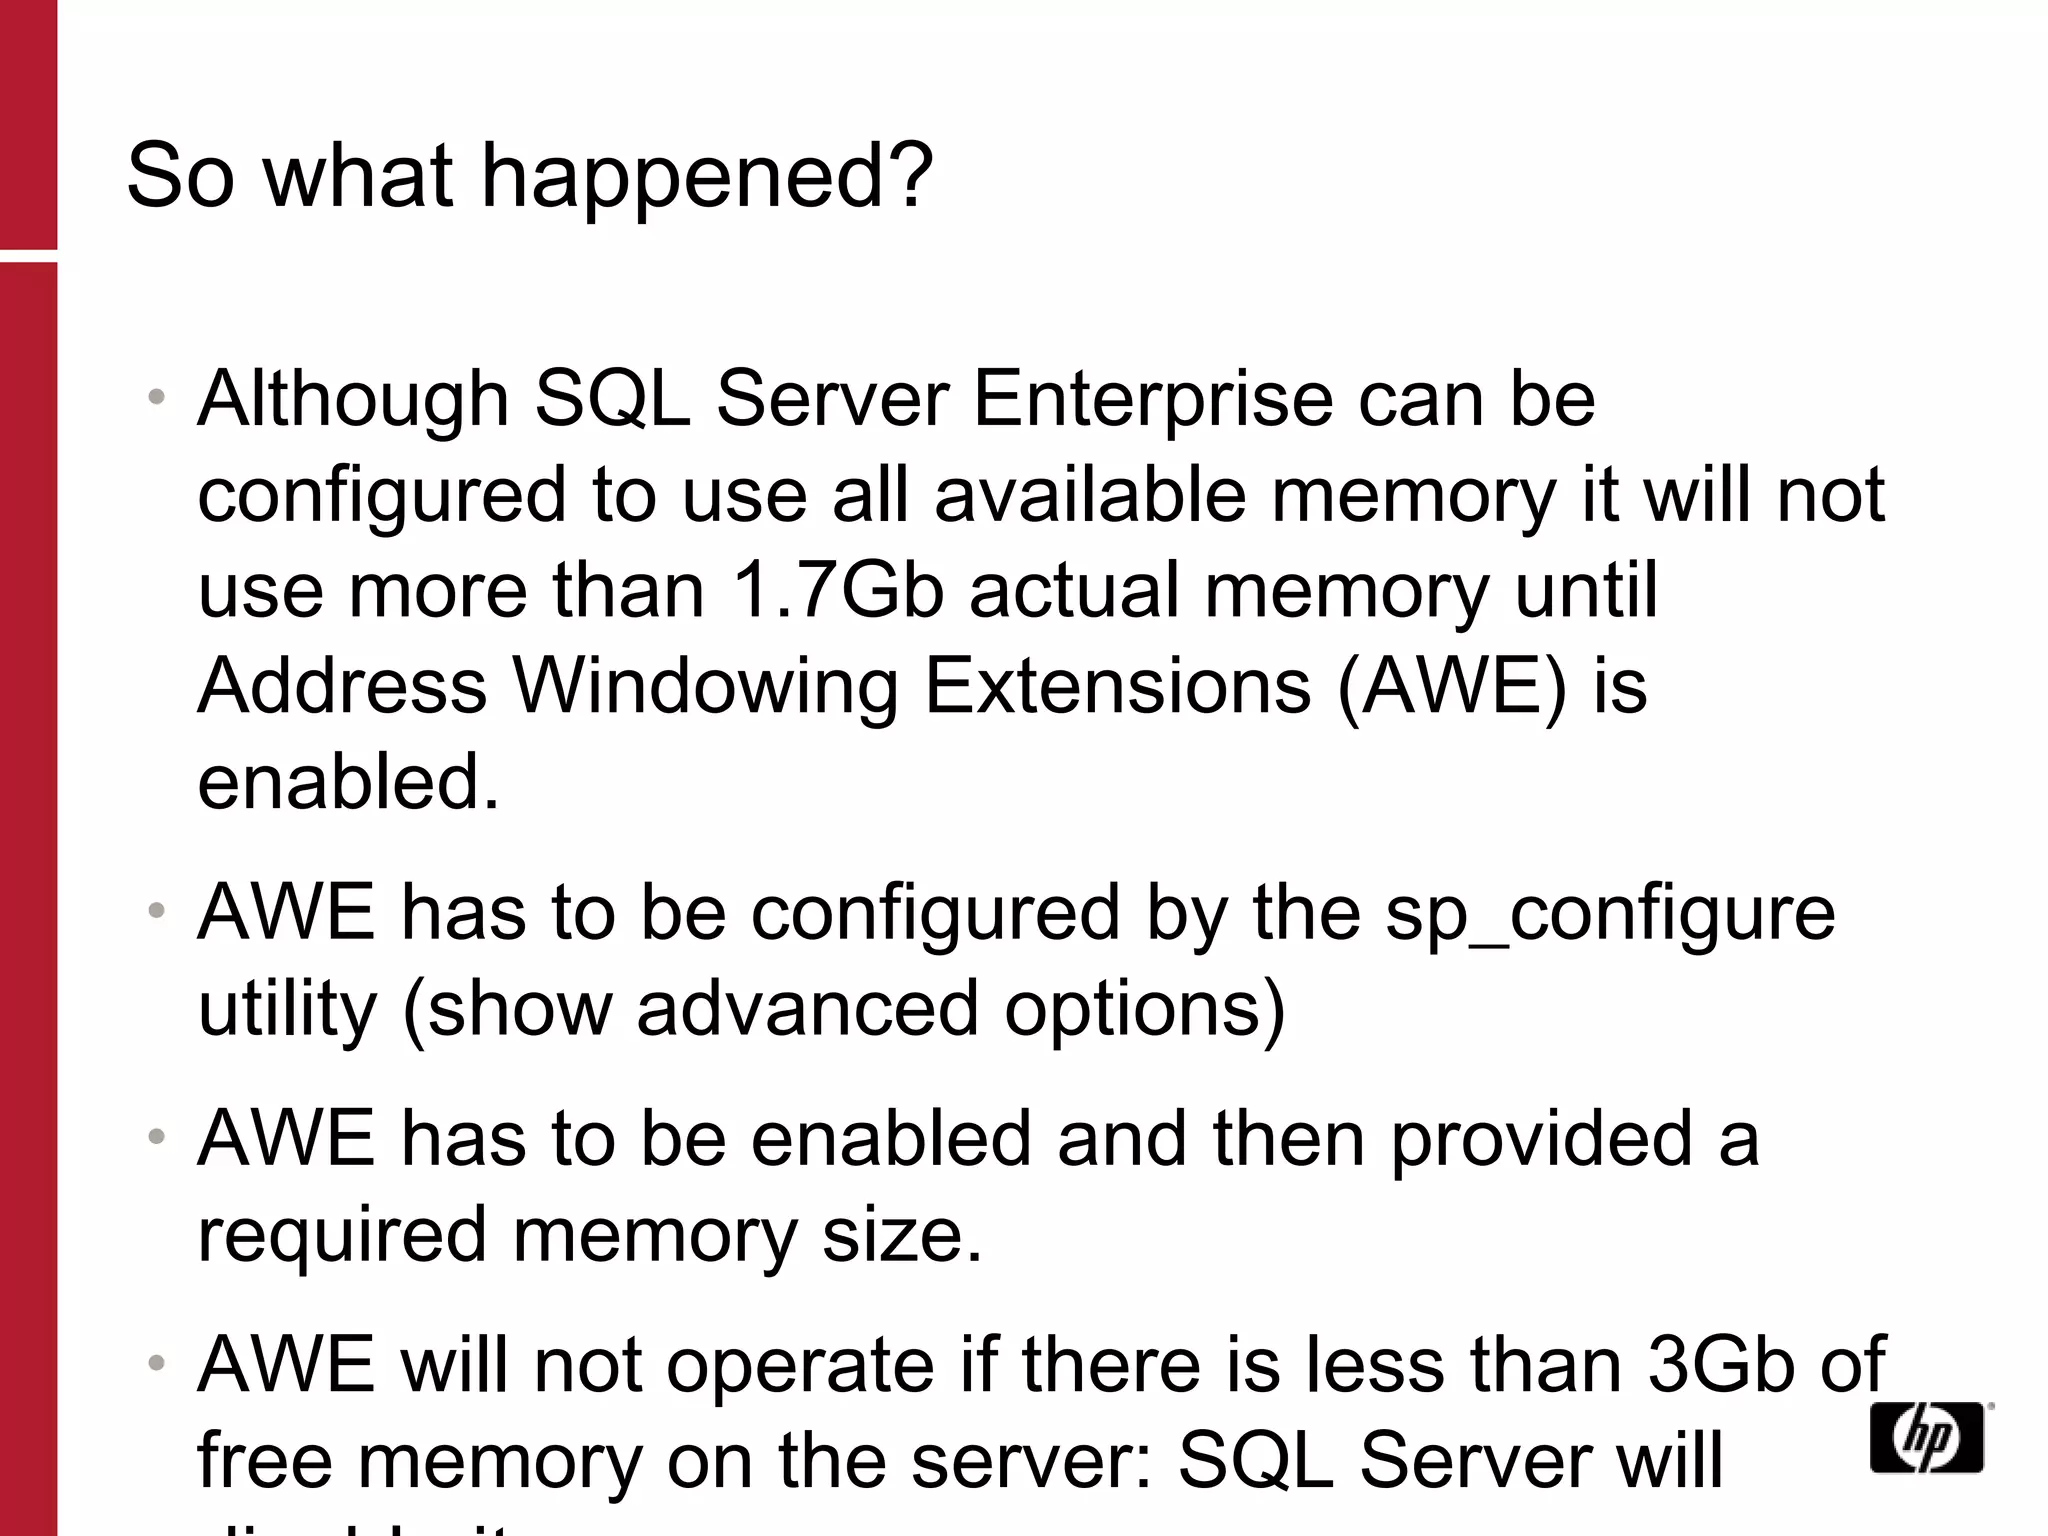
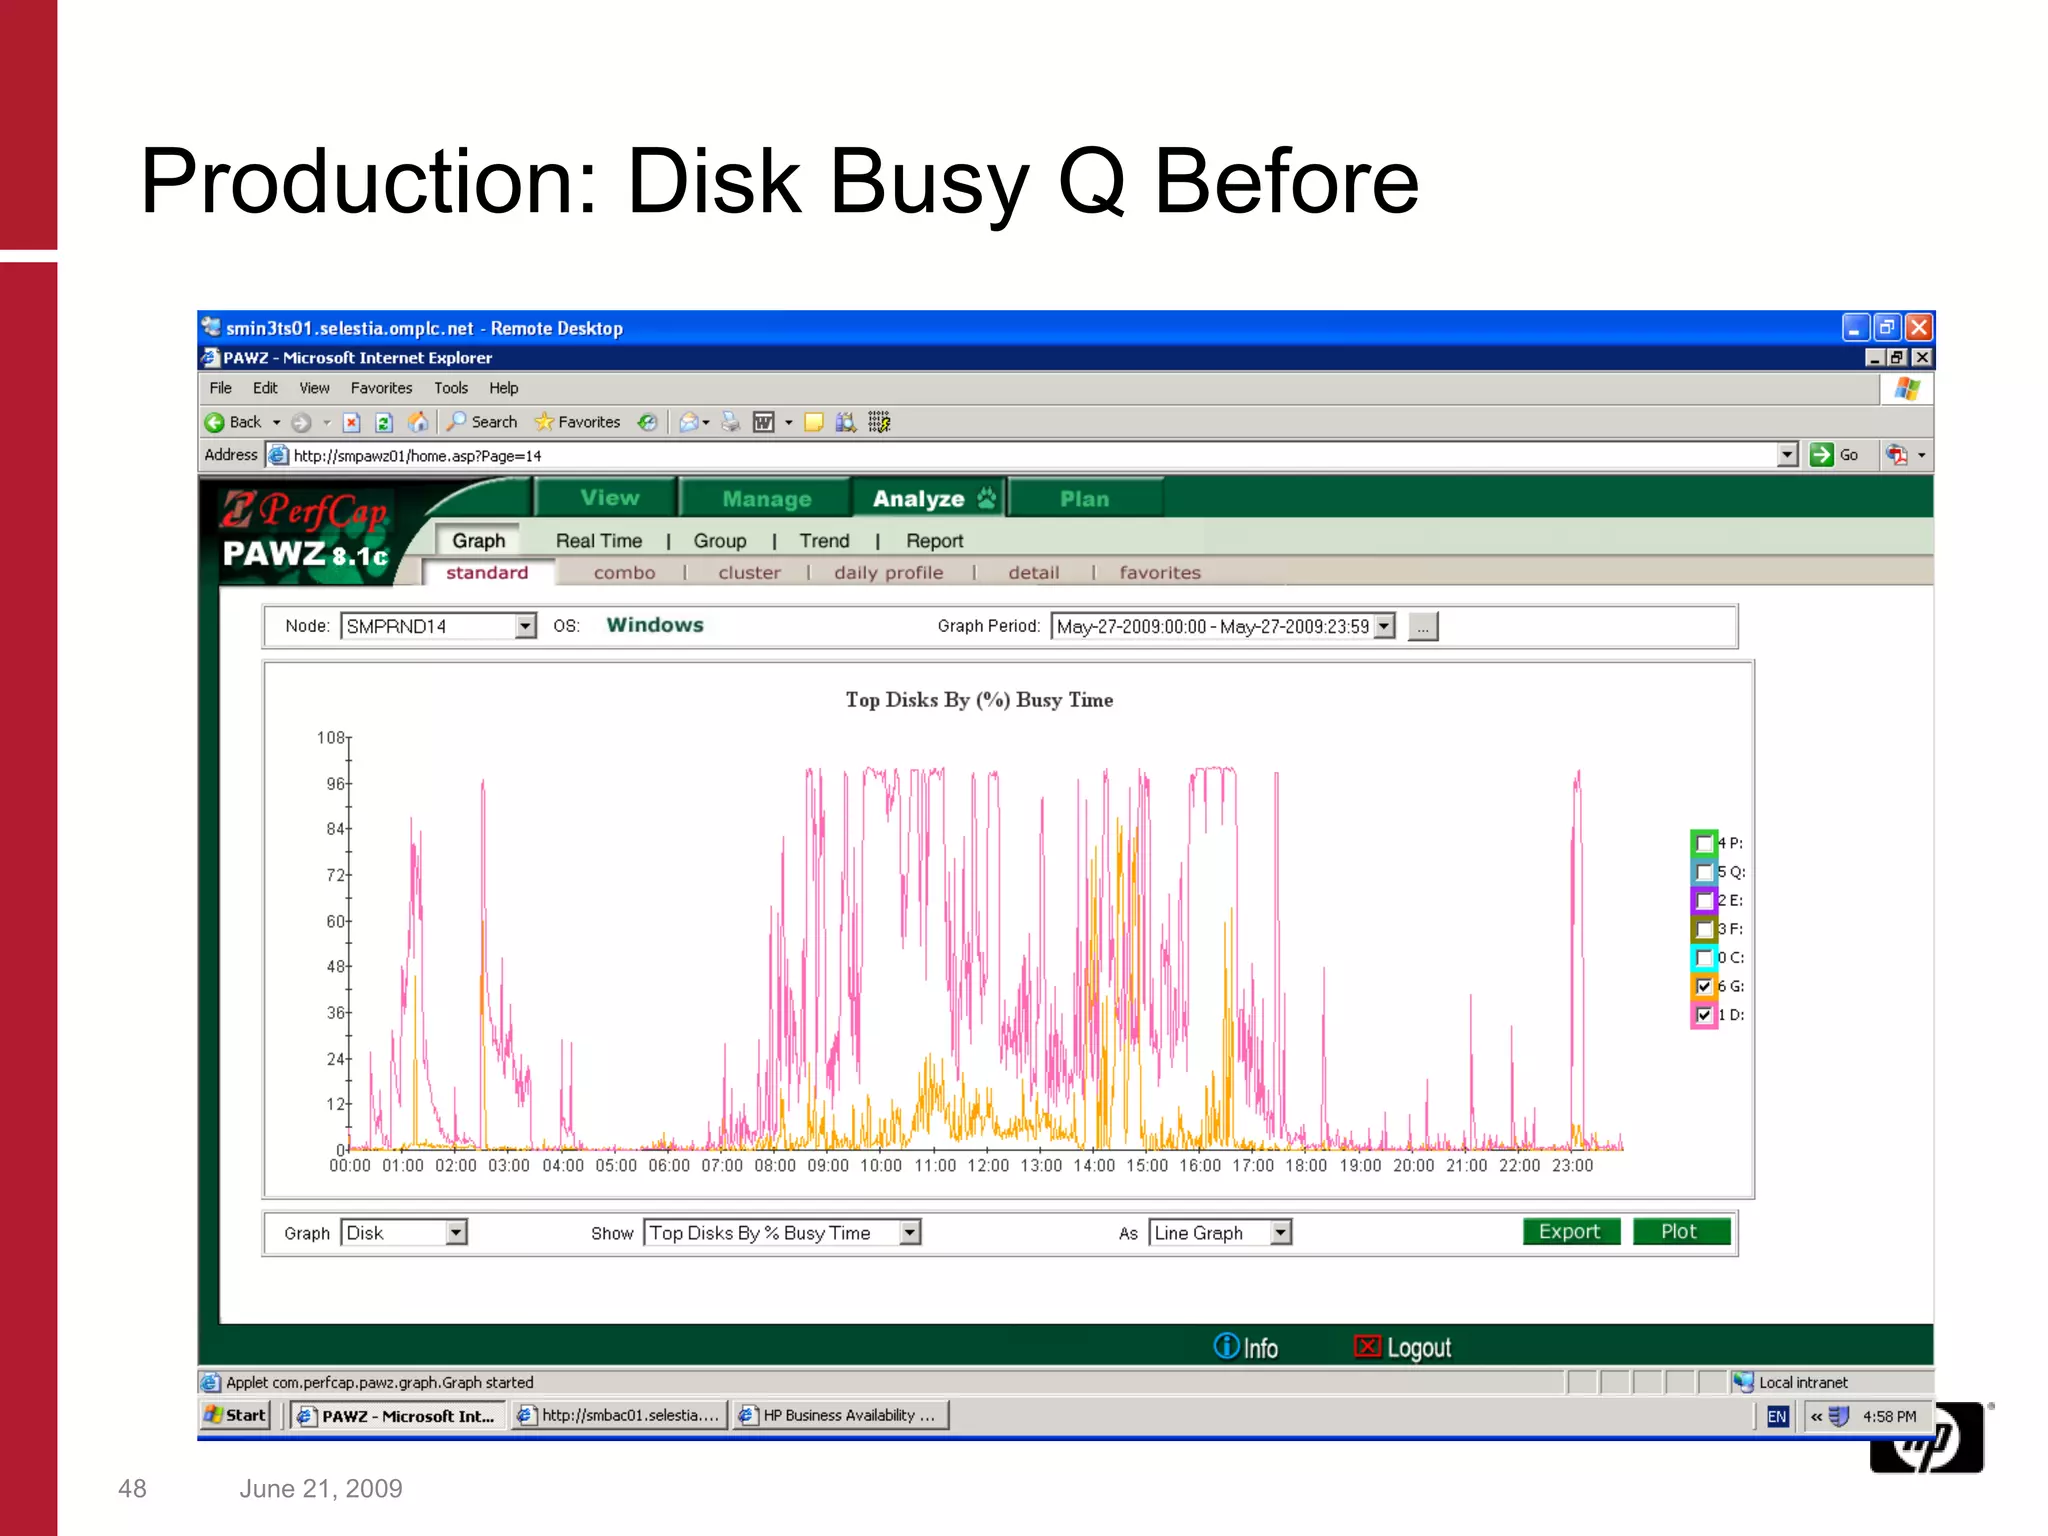
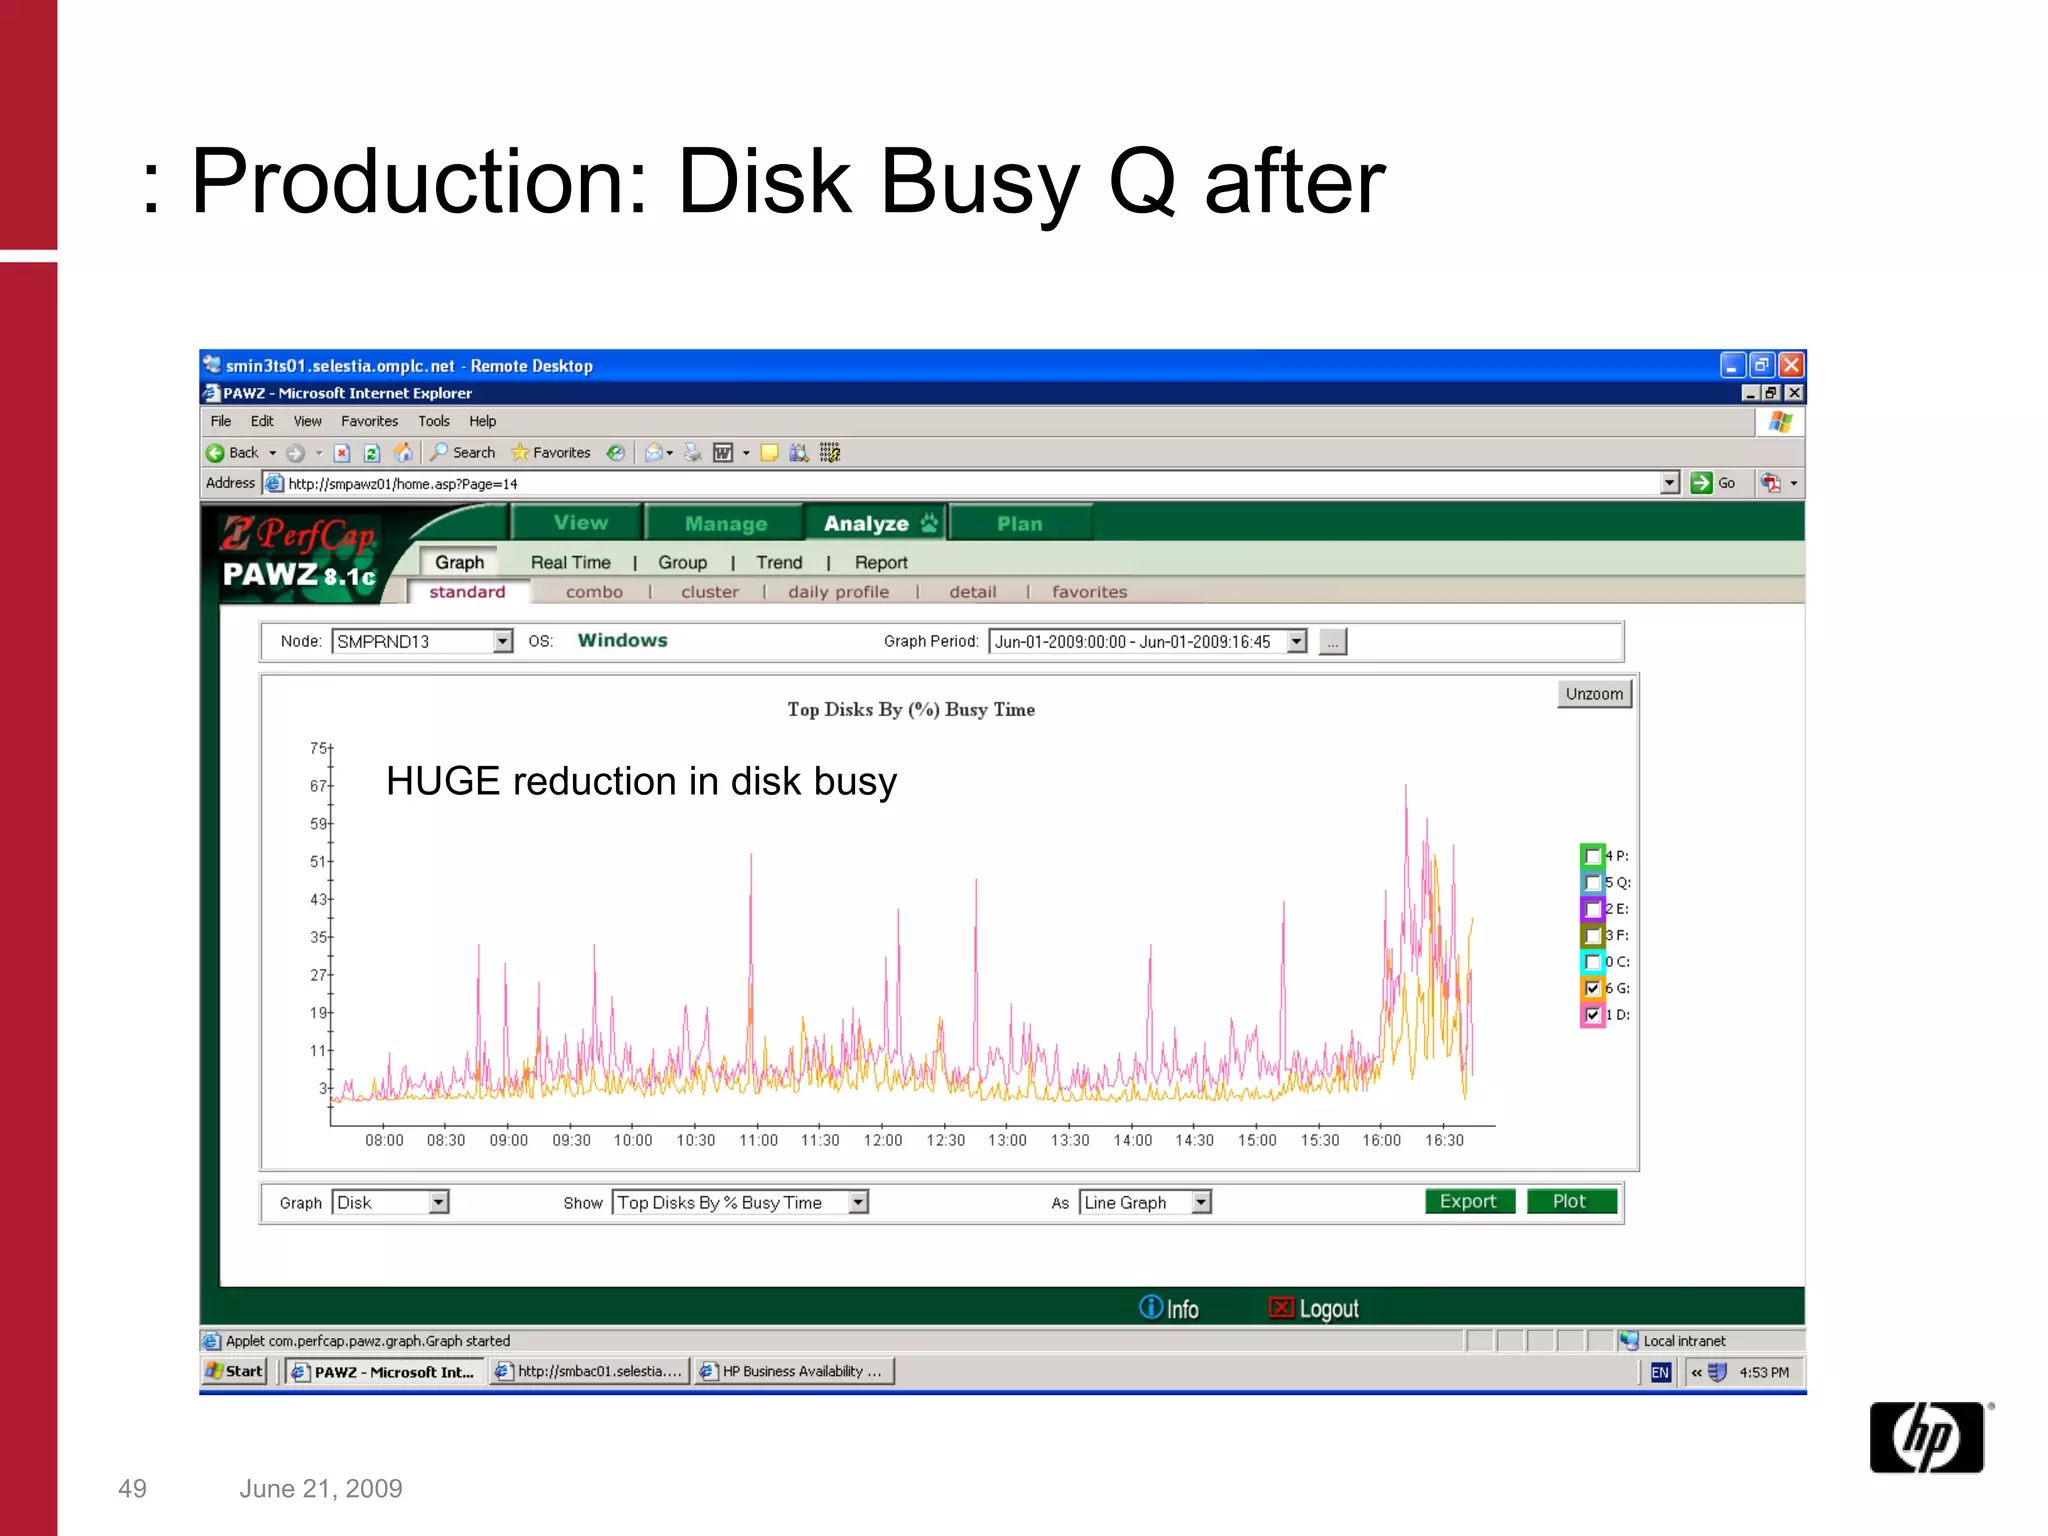
June 21, 2009 Hanging By a Thread: Using Capacity Planning to Survive  Session 2240 Surf F 08:00 Wednesday  Paul O’Sullivan
Topics Up for Discussion Introduction Current Status Case Study 1 – Capacity Planning Case Study 2 – Performance Analysis Findings Future
Introduction Paul O’Sullivan Capacity Management Consultant Capacity Planning/Performance Analyst since 1994 Infrastructure and Fixed Income Investment Banking/Insurance applications PerfCap Corporation
Current State of Performance Analysis and Capacity Planning Capacity Planning Different climate today to even 5 years ago Massive Proliferation of Servers Multi-platform, and Multi-tier Management non-interest High level data only Capacity Planning:  ‘ too difficult to do so we will not bother’ Buy more servers – (not any more)
Issues Lack of specialists Too much data to collect Hard to correlate different platforms and treat application as an entity Top down approach Processes first, data later Diffused Responsibility … and....
Falling hardware costs Following is quotation for typical 4 way database server: 4 x  CPU   GBP  8,000 1 x  Storage Array  GBP  13,235 3 x Power supplies  GBP  750 15 x Drives for Array  GBP  4500 2 x 1GB Memory  GBP  10,000 Total  35,500  Year: 2000 Refurbished!
OK anyone can complain…. … But how can we fix it? Two examples of recent work Capacity Planning Itanium Performance Analysis SQL Server and EVA Futures
June 21, 2009 Capacity Planning Oracle RAC on Itanium Linux
A Sample Study Oracle RAC Capacity Planning Currently 3-node RAC running on IA64 Linux Expect 3x workload on current Oracle RAC within next two years. Must evaluate capacity of current cluster. Examine upgrade alternatives if current configuration not capable of sustaining expected load.
RAC Node CPU Utilizations, July-Sept 2008
Selection of Peak Benchmark Load
CPU by Image / Disk I/O Rate
CPU Utilization by Core Reasonable core load balance at heavy loads.
Overall Disk I/O Rates
Overall Disk Data Rate
Disk Response  Times
Memory Allocation
eCAP Workload Definition
Workload Characteristics Primary Response Time Components oracleNDSPRD1  oracleLockProcs  oracleProcs  asmProcs Disk I/O CPU CPU CPU CPU Disk I/O Disk I/O Disk I/O   Workload Class   Process Count Multi- Processing Level Process Creation Rate (/sec)   CPU Utilization Disk I/O Rate (/sec) oracleNDSPRD1 1110 547.1 0.925 73% 639 oracleLockProcs 8 3.2 0.007 5% 277 oracleWorkProcs 46 31.8 0.038 1% 14 ASM processes 20 9.7 0.017 0.2% 10 daemons 6 2.4 0.005 0.05% 4 data collector 1 0.4 0.001 0.3% 26 root processes 1161 266.0 0.968 3% 233 other processes 774 47.5 0.645 2% 311
Current System Response Time Curve 9% Headroom  9%
Current System Headroom Headroom 9% Capacity  100%
Findings - Current System At peak sustained load,  9% headroom CPU is primary resource bottleneck Possible solutions: Horizontal scaling Integrity upgrade Alternate hardware platform
Platform Alternatives (3 or 4 nodes) HP rx7620 (1.1 GHz, Itanium 2) – current configuration HP rx8640 (1.6 GHz, 24MB L3 cache), 16 core HP rx8640 (1.6 GHz, 25MB L3 cache), 32 core IBM p 570 (2.2 GHz, Power 5), 16 core IBM p 570 (2.2 GHz, Power 5), 32 core IBM p 570 (4.7 GHz, Power 6), 16 core Sun SPARC Enterprise M8000 (2.4 GHz) , 16 core Sun SPARC Enterprise M8000 (2.4 GHz) , 32 core Configuration must support 200% workload growth
Response Time  vs  Workload Growth 3-node RAC Note:  CPU is primary resource bottleneck;  disk and memory will support 200% growth
Response Time  vs  Workload Growth 4-node RAC
Qualifying Platforms 3 configuration platforms support growth: HP rx8640 (1.6 GHz, 25MB L3 cache), 32 core IBM p 570 (2.2 GHz, Power 5), 32 core IBM p 570 (4.7 GHz, Power 6), 16 core Sun SPARC Enterprise M8000 (2.4 GHz) , 32 core Horizontal scaling to 4 nodes will not change qualifying platforms.
Response Time  vs  Workload Growth (reduced core, 3-node configurations)
Response Time  vs  Workload Growth (reduced core, 4-node configurations)
Optimized Configurations Final choice based on cost and management issues. Platform 3-node 4-node Sun SPARC Enterprise M8000 (2.4 GHz) 32 24 HP rx8640 (1.6 GHz, 25MB L3 cache) 30 24 IBM p 570 (2.2 GHz, Power 5) 26 20 IBM p 570 (4.7 GHz, Power 6) 12 10
June 21, 2009 Performance Analysis SQL Server on HP Blades and EVA
Performance Analysis 1 Large Insurance firm acquisition Migrating applications  Requirement of 10x times growth Much new hardware purchased 160 servers in environments Application still slow  SQL Developers under the microscope
Performance Analysis Asked to examine SQL Server Application Theory was that EVA 6000 could not cope with IO load generated by SQL Used PAWZ Performance Analysis and Capacity Planning tool to find performance issues. EVA performance data ‘unavailable’, so used SAN modeling ability on PAWZ Capacity Planner
Hardware Configuration 16 way Quad Core HP Blade 460c 2 x FC 4Gb fibre cards SQL Server 2000 EVA 6000 96 disk disk group, 300Gb 15k drives Shared with other window servers
Initial Analysis SQL Server processes was generated very high response times on SAN drives SQL Server processes were themselves paging (flushing data onto disk) at regular intervals Overall IO rates were low 1000 IO/Sec. CPU Usage is low (10%)  for a server of this type. (?) Memory Usage is low (15%)for a server of this type (?)
June 21, 2009 Not really high IO counts these days…. IO Rates
June 21, 2009 Very high D: drive response time…. Disk Response Time
June 21, 2009 Very high D: drive response time…. IO Sizes
June 21, 2009 SQL Server process generating  all the IO Obviously, something wrong with the application, right? Process-based IO Rates
June 21, 2009 1.7Gb. Excuse me? But the server has 24Gb of memory SQL Server Memory
June 21, 2009 Soft paging into the free list SQL Server paging
June 21, 2009 Soft paging into the free list huge IO load generated as data I s moved to and from the SQL Server process SQL Server paging
So what happened? Although SQL Server Enterprise can be configured to use all available memory it will not use more than 1.7Gb actual memory until Address Windowing Extensions (AWE) is enabled. AWE has to be configured by the sp_configure utility (show advanced options) AWE has to be enabled and then provided a required memory size.  AWE will not operate if there is less than 3Gb of free memory on the server: SQL Server will disable it.
June 21, 2009 Production: IO before
June 21, 2009 Production: IO After
June 21, 2009 Production: IO Q Before
June 21, 2009 Production: IO Q After
June 21, 2009 Production: Disk Busy Q Before
June 21, 2009 : Production: Disk Busy Q after HUGE reduction in disk busy
Result CPU increased Application could handle more concurrent users in test Customer very happy No hardware purchase, no project, no application change Rapid resolution to problem Took 2 hours to work it out -  Problem was bad since January Relieved pressure on SAN Until another SQL Server with the same problem….
Lessons Even if performance tool is already in place, few people were using it well. Blame game without looking at the facts (data) Need to improve fault-finding capabilities Better ways to correlate data Automatic methods of alerting as to real problem and nature of problem Classic case of the ‘cause behind the cause’
So what do we need? 1 st  hurdle  overcome – obtaining data 2 nd  hurdle overcome – presenting data efficiently 3 rd  hurdle overcome – scalability of performance data from clients 4 th  hurdle overcome – automatic capacity planning data 5 th  hurdle –  to do  – making sense of the data Expert reports Just showing the issues Removing the need for manual analysis
Want to know more? Booth Number 631 http://www.perfcap.com [email_address] [email_address] [email_address]

Hptf 2240 Final

  • 1.
    June 21, 2009Hanging By a Thread: Using Capacity Planning to Survive Session 2240 Surf F 08:00 Wednesday Paul O’Sullivan
  • 2.
    Topics Up forDiscussion Introduction Current Status Case Study 1 – Capacity Planning Case Study 2 – Performance Analysis Findings Future
  • 3.
    Introduction Paul O’SullivanCapacity Management Consultant Capacity Planning/Performance Analyst since 1994 Infrastructure and Fixed Income Investment Banking/Insurance applications PerfCap Corporation
  • 4.
    Current State ofPerformance Analysis and Capacity Planning Capacity Planning Different climate today to even 5 years ago Massive Proliferation of Servers Multi-platform, and Multi-tier Management non-interest High level data only Capacity Planning: ‘ too difficult to do so we will not bother’ Buy more servers – (not any more)
  • 5.
    Issues Lack ofspecialists Too much data to collect Hard to correlate different platforms and treat application as an entity Top down approach Processes first, data later Diffused Responsibility … and....
  • 6.
    Issues Lack ofspecialists Too much data to collect Hard to correlate different platforms and treat application as an entity Top down approach Processes first, data later Diffused Responsibility … and....
  • 7.
    Falling hardware costsFollowing is quotation for typical 4 way database server: 4 x CPU GBP 8,000 1 x Storage Array GBP 13,235 3 x Power supplies GBP 750 15 x Drives for Array GBP 4500 2 x 1GB Memory GBP 10,000 Total 35,500 Year: 2000 Refurbished!
  • 8.
    OK anyone cancomplain…. … But how can we fix it? Two examples of recent work Capacity Planning Itanium Performance Analysis SQL Server and EVA Futures
  • 9.
    June 21, 2009Capacity Planning Oracle RAC on Itanium Linux
  • 10.
    A Sample StudyOracle RAC Capacity Planning Currently 3-node RAC running on IA64 Linux Expect 3x workload on current Oracle RAC within next two years. Must evaluate capacity of current cluster. Examine upgrade alternatives if current configuration not capable of sustaining expected load.
  • 11.
    RAC Node CPUUtilizations, July-Sept 2008
  • 12.
    Selection of PeakBenchmark Load
  • 13.
    CPU by Image/ Disk I/O Rate
  • 14.
    CPU Utilization byCore Reasonable core load balance at heavy loads.
  • 15.
  • 16.
  • 17.
  • 18.
  • 19.
  • 20.
    Workload Characteristics PrimaryResponse Time Components oracleNDSPRD1 oracleLockProcs oracleProcs asmProcs Disk I/O CPU CPU CPU CPU Disk I/O Disk I/O Disk I/O Workload Class Process Count Multi- Processing Level Process Creation Rate (/sec) CPU Utilization Disk I/O Rate (/sec) oracleNDSPRD1 1110 547.1 0.925 73% 639 oracleLockProcs 8 3.2 0.007 5% 277 oracleWorkProcs 46 31.8 0.038 1% 14 ASM processes 20 9.7 0.017 0.2% 10 daemons 6 2.4 0.005 0.05% 4 data collector 1 0.4 0.001 0.3% 26 root processes 1161 266.0 0.968 3% 233 other processes 774 47.5 0.645 2% 311
  • 21.
    Current System ResponseTime Curve 9% Headroom 9%
  • 22.
    Current System HeadroomHeadroom 9% Capacity 100%
  • 23.
    Findings - CurrentSystem At peak sustained load, 9% headroom CPU is primary resource bottleneck Possible solutions: Horizontal scaling Integrity upgrade Alternate hardware platform
  • 24.
    Platform Alternatives (3or 4 nodes) HP rx7620 (1.1 GHz, Itanium 2) – current configuration HP rx8640 (1.6 GHz, 24MB L3 cache), 16 core HP rx8640 (1.6 GHz, 25MB L3 cache), 32 core IBM p 570 (2.2 GHz, Power 5), 16 core IBM p 570 (2.2 GHz, Power 5), 32 core IBM p 570 (4.7 GHz, Power 6), 16 core Sun SPARC Enterprise M8000 (2.4 GHz) , 16 core Sun SPARC Enterprise M8000 (2.4 GHz) , 32 core Configuration must support 200% workload growth
  • 25.
    Response Time vs Workload Growth 3-node RAC Note: CPU is primary resource bottleneck; disk and memory will support 200% growth
  • 26.
    Response Time vs Workload Growth 4-node RAC
  • 27.
    Qualifying Platforms 3configuration platforms support growth: HP rx8640 (1.6 GHz, 25MB L3 cache), 32 core IBM p 570 (2.2 GHz, Power 5), 32 core IBM p 570 (4.7 GHz, Power 6), 16 core Sun SPARC Enterprise M8000 (2.4 GHz) , 32 core Horizontal scaling to 4 nodes will not change qualifying platforms.
  • 28.
    Response Time vs Workload Growth (reduced core, 3-node configurations)
  • 29.
    Response Time vs Workload Growth (reduced core, 4-node configurations)
  • 30.
    Optimized Configurations Finalchoice based on cost and management issues. Platform 3-node 4-node Sun SPARC Enterprise M8000 (2.4 GHz) 32 24 HP rx8640 (1.6 GHz, 25MB L3 cache) 30 24 IBM p 570 (2.2 GHz, Power 5) 26 20 IBM p 570 (4.7 GHz, Power 6) 12 10
  • 31.
    June 21, 2009Performance Analysis SQL Server on HP Blades and EVA
  • 32.
    Performance Analysis 1Large Insurance firm acquisition Migrating applications Requirement of 10x times growth Much new hardware purchased 160 servers in environments Application still slow SQL Developers under the microscope
  • 33.
    Performance Analysis Askedto examine SQL Server Application Theory was that EVA 6000 could not cope with IO load generated by SQL Used PAWZ Performance Analysis and Capacity Planning tool to find performance issues. EVA performance data ‘unavailable’, so used SAN modeling ability on PAWZ Capacity Planner
  • 34.
    Hardware Configuration 16way Quad Core HP Blade 460c 2 x FC 4Gb fibre cards SQL Server 2000 EVA 6000 96 disk disk group, 300Gb 15k drives Shared with other window servers
  • 35.
    Initial Analysis SQLServer processes was generated very high response times on SAN drives SQL Server processes were themselves paging (flushing data onto disk) at regular intervals Overall IO rates were low 1000 IO/Sec. CPU Usage is low (10%) for a server of this type. (?) Memory Usage is low (15%)for a server of this type (?)
  • 36.
    June 21, 2009Not really high IO counts these days…. IO Rates
  • 37.
    June 21, 2009Very high D: drive response time…. Disk Response Time
  • 38.
    June 21, 2009Very high D: drive response time…. IO Sizes
  • 39.
    June 21, 2009SQL Server process generating all the IO Obviously, something wrong with the application, right? Process-based IO Rates
  • 40.
    June 21, 20091.7Gb. Excuse me? But the server has 24Gb of memory SQL Server Memory
  • 41.
    June 21, 2009Soft paging into the free list SQL Server paging
  • 42.
    June 21, 2009Soft paging into the free list huge IO load generated as data I s moved to and from the SQL Server process SQL Server paging
  • 43.
    So what happened?Although SQL Server Enterprise can be configured to use all available memory it will not use more than 1.7Gb actual memory until Address Windowing Extensions (AWE) is enabled. AWE has to be configured by the sp_configure utility (show advanced options) AWE has to be enabled and then provided a required memory size. AWE will not operate if there is less than 3Gb of free memory on the server: SQL Server will disable it.
  • 44.
    June 21, 2009Production: IO before
  • 45.
    June 21, 2009Production: IO After
  • 46.
    June 21, 2009Production: IO Q Before
  • 47.
    June 21, 2009Production: IO Q After
  • 48.
    June 21, 2009Production: Disk Busy Q Before
  • 49.
    June 21, 2009: Production: Disk Busy Q after HUGE reduction in disk busy
  • 50.
    Result CPU increasedApplication could handle more concurrent users in test Customer very happy No hardware purchase, no project, no application change Rapid resolution to problem Took 2 hours to work it out - Problem was bad since January Relieved pressure on SAN Until another SQL Server with the same problem….
  • 51.
    Lessons Even ifperformance tool is already in place, few people were using it well. Blame game without looking at the facts (data) Need to improve fault-finding capabilities Better ways to correlate data Automatic methods of alerting as to real problem and nature of problem Classic case of the ‘cause behind the cause’
  • 52.
    So what dowe need? 1 st hurdle overcome – obtaining data 2 nd hurdle overcome – presenting data efficiently 3 rd hurdle overcome – scalability of performance data from clients 4 th hurdle overcome – automatic capacity planning data 5 th hurdle – to do – making sense of the data Expert reports Just showing the issues Removing the need for manual analysis
  • 53.
    Want to knowmore? Booth Number 631 http://www.perfcap.com [email_address] [email_address] [email_address]

Editor's Notes

  • #4 Note that having experience of the other side of the fence – (almost adverserial) Compaq/DEC background.
  • #5 Server numbers peaked 2005-2007 Windows/Blades/Virtualiasation All platforms (worse with Solaris x86) Not seen as a value add
  • #6 CP and Performmance Specialists are almost extinct Replaced by ITIL Capacity Management Specialists – not the same thing! CP 99% of cases only under infrastructure budgets – not aligned to business Experiences with ITIL found – good for developing processes, bad for developing budget Suits management not to have overall department with responsbility for Infrastructure and Applications
  • #7 CP and Performmance Specialists are almost extinct Replaced by ITIL Capacity Management Specialists – not the same thing! CP 99% of cases only under infrastructure budgets – not aligned to business Experiences with ITIL found – good for developing processes, bad for developing budget Suits management not to have overall department with responsbility for Infrastructure and Applications
  • #8 This was for a 4 way Sybase Server which today could be performed by a single blade server on the end of a SAN Point here: with a server costing so much you NEED to make sure that it is correctly sized – today better performance for less than ¼ fo the price – is that why many sites have 4x the servers?
  • #9 This was for a 4 way Sybase Server which today could be performed by a single blade server on the end of a SAN Point here: with a server costing so much you NEED to make sure that it is correctly sized – today better performance for less than ¼ fo the price – is that why many sites have 4x the servers?
  • #35 Clearly, something odd is happening here
  • #36 Clearly, something odd is happening here
  • #37 Server was a BL460c 4Gb FC cards, 24Gb of memory
  • #38 Asked the question: what was the EVA configuration: EVA6000, 300Gb 15k drives, 96 disks. Shared Modelled EVA to confirm issues….
  • #39 Ah, first clue, large sizes of IO 80,000kB/sec = 8000MB size, 8Gb xfers !!!!!
  • #40 All SQL Server, mostly during on-line day.
  • #41 SQL Server has 1.7Gb, is enterprise edition, and SLQ server memory has been set to use all the memory it can.
  • #42 So, what happens when SQL cannot get enough memory – it will soft fault…
  • #43 So, what happens when SQL cannot get enough memory – it will soft fault…
  • #44 ALL SQL servers had this issue. Looks like the customer forgot to implement the feature…. But what happened next?
  • #45 So, what happens when SQL cannot get enough memory – it will soft fault…
  • #46 So, what happens when SQL cannot get enough memory – it will soft fault…
  • #47 So, what happens when SQL cannot get enough memory – it will soft fault…
  • #48 So, what happens when SQL cannot get enough memory – it will soft fault…
  • #49 We put the change on a stress test system
  • #50 We put the change on a stress test system
  • #51 Since this work, the fix went in onto another SQL Server – Disk read queue of 34m peak down to 300. Analysis was’t hard to do, just no-one had done it before.
  • #52 ALL SQL servers had this issue. But what happened next?
  • #53 To start with, just getting decent performance data was a problem Then came the issue of logging into each system and looking at the graphs Then came the issue of looking at 100s of systems Then came the issue of modelling