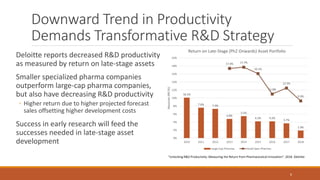
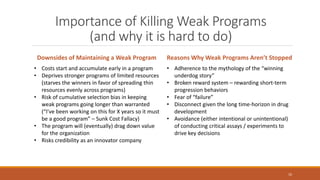
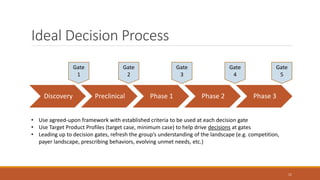
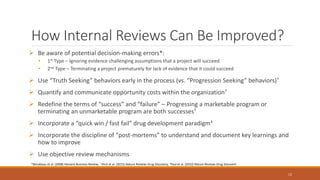
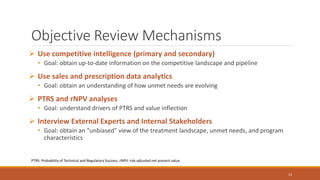
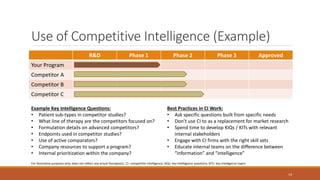
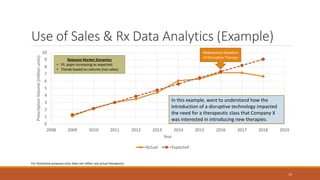
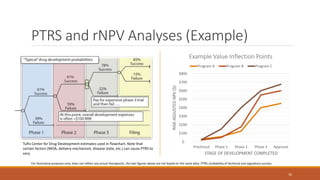
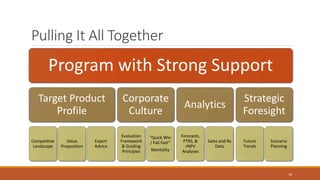
How and When to Kill a Program in New
Product Planning
TONY RUSSELL , PHD, MBA
EXECUTIVE DIREC TOR, PRODUC T STRATEGY AND COMMERCIAL PLANNING
THERAVANCE BIOPHARMA US, INC.
1
Disclaimer
The views and opinions expressed are solely those of the speaker and do not represent those of
my current or previous employers
2
Tony Russell, PhD MBA
Background and Experience
Year Company Position
2015 – Present Theravance Biopharma US, Inc. Product Strategy and Commercial Planning
2010 – 2015 Alder BioPharmaceuticals Commercial Strategy
2007 – 2010 ZymoGenetics (acq. BMS) Medical Affairs
2006 – 2007 ICOS (acq. Eli Lilly) Strategic Marketing
2004 – 2006 Corus Pharma (acq. Gilead Sciences) Product Management
2000 – 2004 Amgen Medical Affairs
1999 – 2000 Baxter Global Marketing
1998 University of Washington PhD (Physiology and Biophysics)
1998 Seattle University MBA
3
https://www.linkedin.com/in/arussellbiotech/
Scenarios in New Product Planning
4
Program X has a
unique MOA but
entering a
crowded market
with no clear
advantage
Program X is
technically feasible
but too far behind
the competition
We have many
programs going on,
but data read-out
on Program X will
be years from now
after other
programs read out
Many Options Available to Deal with the Scenarios Above
• Pivot program to new disease or patient sub-population
• Collaborate with an external partner to accelerate program development
• Stop the program to conserve resources
Key Topics to be Covered
 Downward Trends in R&D Productivity
 What Defines a “Weak” Program
 How Can Internal Review Processes Be Improved
 Example Mechanisms for Objective Review of Programs
5
Downward Trend in Productivity
Demands Transformative R&D Strategy
6
Deloitte reports decreased R&D productivity
as measured by return on late-stage assets
Smaller specialized pharma companies
outperform large-cap pharma companies,
but also have decreasing R&D productivity
◦ Higher return due to higher projected forecast
sales offsetting higher development costs
Success in early research will feed the
successes needed in late-stage asset
development
“Unlocking R&D Productivity: Measuring the Return from Pharmaceutical Innovation”. 2018. Deloitte
10.1%
7.6% 7.3%
4.8%
5.5%
4.2% 4.2%
3.7%
1.9%
17.4% 17.7%
16.1%
11.0%
12.5%
9.3%
0%
2%
4%
6%
8%
10%
12%
14%
16%
18%
20%
2010 2011 2012 2013 2014 2015 2016 2017 2018
AbsoluteIRR(%)
Return on Late-Stage (Ph2 Onwards) Asset Portfolio
Large-Cap Pharmas Small Spec Pharmas
Decreasing R&D Productivity is Not a
Recent Phenomenon
7
“Productivity: in R&D, healthcare and the whole economy” Richard Jones (7/18/2018) (accessed at: http://www.softmachines.org/wordpress/?p=2243)
Drivers of Downward Productivity
8
IncreasingDevelopment
Costs
• Longer development
timelines
• Complex trial designs
• Crowded markets
impacting recruitment
timelines
• Pricing pressures
• Market access pressures
• Crowded markets
impacting market share
potential
DecreasingMarket
Opportunities
Therefore, organizations cannot afford to select and maintain weak programs
What Defines a “Weak” Program
 Value proposition is not defined
• Unclear what problem is being effectively solved for the patient, physician and payer
• Unclear what treatment gap is being filled by the proposed therapeutic
 Relatively late entrant into a market with a pipeline filled with advanced
programs
• Will be the nth entrant into what is or will become a crowded market
 No clear competitive advantage
• Does the team rely on uniqueness of MOA to translate into an advantage in the absence of
compelling confidence-building data?
• Does the team depend on “hope” as a strategy (hope the competition will fail, hope the
compound will perform better than expected, etc.)?
9
Importance of Killing Weak Programs
(and why it is hard to do)
10
Downsides of Maintaining a Weak Program Reasons Why Weak Programs Aren’t Stopped
• Costs start and accumulate early in a program
• Deprives stronger programs of limited resources
(starves the winners in favor of spreading thin
resources evenly across programs)
• Risk of cumulative selection bias in keeping
weak programs going longer than warranted
(“I’ve been working on this for X years so it must
be a good program” – Sunk Cost Fallacy)
• The program will (eventually) drag down value
for the organization
• Risks credibility as an innovator company
• Adherence to the mythology of the “winning
underdog story”
• Broken reward system – rewarding short-term
progression behaviors
• Fear of “failure”
• Disconnect given the long time-horizon in drug
development
• Avoidance (either intentional or unintentional)
of conducting critical assays / experiments to
drive key decisions
Discovery Preclinical Phase 1 Phase 2 Phase 3
Ideal Decision Process
11
Gate
1
Gate
2
Gate
3
Gate
4
• Use agreed-upon framework with established criteria to be used at each decision gate
• Use Target Product Profiles (target case, minimum case) to help drive decisions at gates
• Leading up to decision gates, refresh the group’s understanding of the landscape (e.g. competition,
payer landscape, prescribing behaviors, evolving unmet needs, etc.)
Gate
5
How Internal Reviews Can Be Improved?
 Be aware of potential decision-making errors*:
• 1st Type – Ignoring evidence challenging assumptions that a project will succeed
• 2nd Type – Terminating a project prematurely for lack of evidence that it could succeed
 Use “Truth Seeking” behaviors early in the process (vs. “Progression Seeking” behaviors)†
 Quantify and communicate opportunity costs within the organization†
 Redefine the terms of “success” and “failure” – Progressing a marketable program or
terminating an unmarketable program are both successes†
 Incorporate a “quick win / fast fail” drug development paradigm‡
 Incorporate the discipline of “post-mortems” to understand and document key learnings and
how to improve
 Use objective review mechanisms
12
*Bonabeau et al. (2008) Harvard Business Review; † Peck et al. (2015) Nature Reviews Drug Discovery; ‡Paul et al. (2010) Nature Reviews Drug Discovert
Objective Review Mechanisms
 Use competitive intelligence (primary and secondary)
• Goal: obtain up-to-date information on the competitive landscape and pipeline
 Use sales and prescription data analytics
• Goal: obtain an understanding of how unmet needs are evolving
 PTRS and rNPV analyses
• Goal: understand drivers of PTRS and value inflection
 Interview External Experts and Internal Stakeholders
• Goal: obtain an “unbiased” view of the treatment landscape, unmet needs, and program
characteristics
13
PTRS: Probability of Technical and Regulatory Success; rNPV: risk-adjusted net present value
Use of Competitive Intelligence (Example)
14
R&D Phase 1 Phase 2 Phase 3 Approved
Your Program
Competitor A
Competitor B
Competitor C
Example Key Intelligence Questions:
• Patient sub-types in competitor studies?
• What line of therapy are the competitors focused on?
• Formulation details on advanced competitors?
• Endpoints used in competitor studies?
• Use of active comparators?
• Company resources to support a program?
• Internal prioritization within the company?
For illustrative purposes only; does not reflect any actual therapeutic. CI: competitive intelligence; KIQs: key intelligence questions; KITs: key intelligence topics
Best Practices in CI Work:
• Ask specific questions built from specific needs
• Don’t use CI to as a replacement for market research
• Spend time to develop KIQs / KITs with relevant
internal stakeholders
• Engage with CI firms with the right skill sets
• Educate internal teams on the difference between
“information” and “intelligence”
Use of Sales & Rx Data Analytics (Example)
15
0
1
2
3
4
5
6
7
8
9
10
2008 2009 2010 2011 2012 2013 2014 2015 2016 2017 2018 2019
PrescriptionVolume(millionunits)
Year
Actual Expected
For illustrative purposes only; does not reflect any actual therapeutic
Widespread Adoption
of Disruptive Therapy
Relevant Market Dynamics
• Pt. popn increasing as expected
• Trends based on volume (not sales)
In this example, want to understand how the
introduction of a disruptive technology impacted
the need for a therapeutic class that Company X
was interested in introducing new therapies.
PTRS and rNPV Analyses (Example)
16
$-
$100
$200
$300
$400
$500
$600
$700
$800
Preclinical Phase 1 Phase 2 Phase 3 Approval
RISK-ADJUSTEDNPV($)
STAGE OF DEVELOPMENT COMPLETED
Example Value Inflection Points
Program A Program B Program C
For illustrative purposes only; does not reflect any actual therapeutic; the two figures above are not based on the same data; PTRS: probability of technical and regulatory success
Tufts Center for Drug Development estimates used in flowchart. Note that
certain factors (MOA, delivery mechanism, disease state, etc.) can cause PTRS to
vary.
Leveraging Expert Advice
 Utilize double-blinded (ideally) 1:1 interviews with external therapeutic area experts to
understand degree of unmet need and persistent patient management challenges
• Goal is to minimize bias that can occur in unblinded interviews
• In some cases, the investment in qualitative market research can be justified
 Develop a discussion guide that focuses on uncovering the drivers of unmet need, how
emerging competition therapies will be utilized, and other changes relevant to patient
management
• Critically important to avoid “confirmation bias” in conducting interviews
 Important to talk with internal stakeholders 1:1 (subject matter experts, senior leadership)
• Can be important in uncovering any “hidden issues” that may not get discussed in group meetings
• Can also help build advocacy for supporting or stopping a program based on objective information
17
Pulling It All Together
18
Program with Strong Support
Target Product
Profile
Competitive
Landscape
Value
Proposition
Expert
Advice
Corporate
Culture
Evaluation
Framework
& Guiding
Principles
“Quick Win
/ Fail Fast”
Mentality
Analytics
Forecasts,
PTRS, &
rNPV
Analyses
Sales and Rx
Data
Strategic
Foresight
Future
Trends
Scenario
Planning
Key Learnings
 “The essence of strategy is choosing what not to do.” - Michael Porter*
 It can be extremely difficult to discuss the option of stopping a program. Be prepared.
 Have regular pre-determined periods of evaluating programs.
 Spend time to learn from the process and find opportunities to improve.
 Remind the team that the goal is to have programs with the strongest chance of success that
will build value for your organization.
19
* “What is Strategy?” Harvard Business Review (Nov-Dec 1996)
20
Thank You!
https://www.linkedin.com/in/arussellbiotech/

How and When to Kill a Program in New Product Planning

  • 1.
    How and Whento Kill a Program in New Product Planning TONY RUSSELL , PHD, MBA EXECUTIVE DIREC TOR, PRODUC T STRATEGY AND COMMERCIAL PLANNING THERAVANCE BIOPHARMA US, INC. 1
  • 2.
    Disclaimer The views andopinions expressed are solely those of the speaker and do not represent those of my current or previous employers 2
  • 3.
    Tony Russell, PhDMBA Background and Experience Year Company Position 2015 – Present Theravance Biopharma US, Inc. Product Strategy and Commercial Planning 2010 – 2015 Alder BioPharmaceuticals Commercial Strategy 2007 – 2010 ZymoGenetics (acq. BMS) Medical Affairs 2006 – 2007 ICOS (acq. Eli Lilly) Strategic Marketing 2004 – 2006 Corus Pharma (acq. Gilead Sciences) Product Management 2000 – 2004 Amgen Medical Affairs 1999 – 2000 Baxter Global Marketing 1998 University of Washington PhD (Physiology and Biophysics) 1998 Seattle University MBA 3 https://www.linkedin.com/in/arussellbiotech/
  • 4.
    Scenarios in NewProduct Planning 4 Program X has a unique MOA but entering a crowded market with no clear advantage Program X is technically feasible but too far behind the competition We have many programs going on, but data read-out on Program X will be years from now after other programs read out Many Options Available to Deal with the Scenarios Above • Pivot program to new disease or patient sub-population • Collaborate with an external partner to accelerate program development • Stop the program to conserve resources
  • 5.
    Key Topics tobe Covered  Downward Trends in R&D Productivity  What Defines a “Weak” Program  How Can Internal Review Processes Be Improved  Example Mechanisms for Objective Review of Programs 5
  • 6.
    Downward Trend inProductivity Demands Transformative R&D Strategy 6 Deloitte reports decreased R&D productivity as measured by return on late-stage assets Smaller specialized pharma companies outperform large-cap pharma companies, but also have decreasing R&D productivity ◦ Higher return due to higher projected forecast sales offsetting higher development costs Success in early research will feed the successes needed in late-stage asset development “Unlocking R&D Productivity: Measuring the Return from Pharmaceutical Innovation”. 2018. Deloitte 10.1% 7.6% 7.3% 4.8% 5.5% 4.2% 4.2% 3.7% 1.9% 17.4% 17.7% 16.1% 11.0% 12.5% 9.3% 0% 2% 4% 6% 8% 10% 12% 14% 16% 18% 20% 2010 2011 2012 2013 2014 2015 2016 2017 2018 AbsoluteIRR(%) Return on Late-Stage (Ph2 Onwards) Asset Portfolio Large-Cap Pharmas Small Spec Pharmas
  • 7.
    Decreasing R&D Productivityis Not a Recent Phenomenon 7 “Productivity: in R&D, healthcare and the whole economy” Richard Jones (7/18/2018) (accessed at: http://www.softmachines.org/wordpress/?p=2243)
  • 8.
    Drivers of DownwardProductivity 8 IncreasingDevelopment Costs • Longer development timelines • Complex trial designs • Crowded markets impacting recruitment timelines • Pricing pressures • Market access pressures • Crowded markets impacting market share potential DecreasingMarket Opportunities Therefore, organizations cannot afford to select and maintain weak programs
  • 9.
    What Defines a“Weak” Program  Value proposition is not defined • Unclear what problem is being effectively solved for the patient, physician and payer • Unclear what treatment gap is being filled by the proposed therapeutic  Relatively late entrant into a market with a pipeline filled with advanced programs • Will be the nth entrant into what is or will become a crowded market  No clear competitive advantage • Does the team rely on uniqueness of MOA to translate into an advantage in the absence of compelling confidence-building data? • Does the team depend on “hope” as a strategy (hope the competition will fail, hope the compound will perform better than expected, etc.)? 9
  • 10.
    Importance of KillingWeak Programs (and why it is hard to do) 10 Downsides of Maintaining a Weak Program Reasons Why Weak Programs Aren’t Stopped • Costs start and accumulate early in a program • Deprives stronger programs of limited resources (starves the winners in favor of spreading thin resources evenly across programs) • Risk of cumulative selection bias in keeping weak programs going longer than warranted (“I’ve been working on this for X years so it must be a good program” – Sunk Cost Fallacy) • The program will (eventually) drag down value for the organization • Risks credibility as an innovator company • Adherence to the mythology of the “winning underdog story” • Broken reward system – rewarding short-term progression behaviors • Fear of “failure” • Disconnect given the long time-horizon in drug development • Avoidance (either intentional or unintentional) of conducting critical assays / experiments to drive key decisions
  • 11.
    Discovery Preclinical Phase1 Phase 2 Phase 3 Ideal Decision Process 11 Gate 1 Gate 2 Gate 3 Gate 4 • Use agreed-upon framework with established criteria to be used at each decision gate • Use Target Product Profiles (target case, minimum case) to help drive decisions at gates • Leading up to decision gates, refresh the group’s understanding of the landscape (e.g. competition, payer landscape, prescribing behaviors, evolving unmet needs, etc.) Gate 5
  • 12.
    How Internal ReviewsCan Be Improved?  Be aware of potential decision-making errors*: • 1st Type – Ignoring evidence challenging assumptions that a project will succeed • 2nd Type – Terminating a project prematurely for lack of evidence that it could succeed  Use “Truth Seeking” behaviors early in the process (vs. “Progression Seeking” behaviors)†  Quantify and communicate opportunity costs within the organization†  Redefine the terms of “success” and “failure” – Progressing a marketable program or terminating an unmarketable program are both successes†  Incorporate a “quick win / fast fail” drug development paradigm‡  Incorporate the discipline of “post-mortems” to understand and document key learnings and how to improve  Use objective review mechanisms 12 *Bonabeau et al. (2008) Harvard Business Review; † Peck et al. (2015) Nature Reviews Drug Discovery; ‡Paul et al. (2010) Nature Reviews Drug Discovert
  • 13.
    Objective Review Mechanisms Use competitive intelligence (primary and secondary) • Goal: obtain up-to-date information on the competitive landscape and pipeline  Use sales and prescription data analytics • Goal: obtain an understanding of how unmet needs are evolving  PTRS and rNPV analyses • Goal: understand drivers of PTRS and value inflection  Interview External Experts and Internal Stakeholders • Goal: obtain an “unbiased” view of the treatment landscape, unmet needs, and program characteristics 13 PTRS: Probability of Technical and Regulatory Success; rNPV: risk-adjusted net present value
  • 14.
    Use of CompetitiveIntelligence (Example) 14 R&D Phase 1 Phase 2 Phase 3 Approved Your Program Competitor A Competitor B Competitor C Example Key Intelligence Questions: • Patient sub-types in competitor studies? • What line of therapy are the competitors focused on? • Formulation details on advanced competitors? • Endpoints used in competitor studies? • Use of active comparators? • Company resources to support a program? • Internal prioritization within the company? For illustrative purposes only; does not reflect any actual therapeutic. CI: competitive intelligence; KIQs: key intelligence questions; KITs: key intelligence topics Best Practices in CI Work: • Ask specific questions built from specific needs • Don’t use CI to as a replacement for market research • Spend time to develop KIQs / KITs with relevant internal stakeholders • Engage with CI firms with the right skill sets • Educate internal teams on the difference between “information” and “intelligence”
  • 15.
    Use of Sales& Rx Data Analytics (Example) 15 0 1 2 3 4 5 6 7 8 9 10 2008 2009 2010 2011 2012 2013 2014 2015 2016 2017 2018 2019 PrescriptionVolume(millionunits) Year Actual Expected For illustrative purposes only; does not reflect any actual therapeutic Widespread Adoption of Disruptive Therapy Relevant Market Dynamics • Pt. popn increasing as expected • Trends based on volume (not sales) In this example, want to understand how the introduction of a disruptive technology impacted the need for a therapeutic class that Company X was interested in introducing new therapies.
  • 16.
    PTRS and rNPVAnalyses (Example) 16 $- $100 $200 $300 $400 $500 $600 $700 $800 Preclinical Phase 1 Phase 2 Phase 3 Approval RISK-ADJUSTEDNPV($) STAGE OF DEVELOPMENT COMPLETED Example Value Inflection Points Program A Program B Program C For illustrative purposes only; does not reflect any actual therapeutic; the two figures above are not based on the same data; PTRS: probability of technical and regulatory success Tufts Center for Drug Development estimates used in flowchart. Note that certain factors (MOA, delivery mechanism, disease state, etc.) can cause PTRS to vary.
  • 17.
    Leveraging Expert Advice Utilize double-blinded (ideally) 1:1 interviews with external therapeutic area experts to understand degree of unmet need and persistent patient management challenges • Goal is to minimize bias that can occur in unblinded interviews • In some cases, the investment in qualitative market research can be justified  Develop a discussion guide that focuses on uncovering the drivers of unmet need, how emerging competition therapies will be utilized, and other changes relevant to patient management • Critically important to avoid “confirmation bias” in conducting interviews  Important to talk with internal stakeholders 1:1 (subject matter experts, senior leadership) • Can be important in uncovering any “hidden issues” that may not get discussed in group meetings • Can also help build advocacy for supporting or stopping a program based on objective information 17
  • 18.
    Pulling It AllTogether 18 Program with Strong Support Target Product Profile Competitive Landscape Value Proposition Expert Advice Corporate Culture Evaluation Framework & Guiding Principles “Quick Win / Fail Fast” Mentality Analytics Forecasts, PTRS, & rNPV Analyses Sales and Rx Data Strategic Foresight Future Trends Scenario Planning
  • 19.
    Key Learnings  “Theessence of strategy is choosing what not to do.” - Michael Porter*  It can be extremely difficult to discuss the option of stopping a program. Be prepared.  Have regular pre-determined periods of evaluating programs.  Spend time to learn from the process and find opportunities to improve.  Remind the team that the goal is to have programs with the strongest chance of success that will build value for your organization. 19 * “What is Strategy?” Harvard Business Review (Nov-Dec 1996)
  • 20.