Unit One: Preparefor Work
Subtitle:
Job Instructions, Safety, Materials, and Tools
2.
UNIT OVERVIEW
Topics Covered:
Job requirement work instructions
OHS (Occupational Health and Safety) requirements
Appropriate materials for work
Safety equipment and tools
Learning Outcomes:
Determine job requirement work instructions
Understand OHS requirements for personal protection
Select appropriate materials for work
Identify and check safety equipment and tools
3.
JOB REQUIREMENT WORKINSTRUCTIONS
Definition of a Job:
A specific task or duty
Employment (part-time/full-time)
Responsibility or obligation
Project, task, or matter being worked on
4.
JOB BASICS –WHAT EVERY JOB REQUIRES
Regardless of the job type, these are essential:
Discipline
Enthusiasm
Qualifications
Discipline
Key Point:
Foundation of all job success
Why it's important:
Enables consistency and commitment
Applies to everyone, regardless of position
5.
ENTHUSIASM
Key Point:
Job satisfactionfuels growth
Why it's important:
Leads to innovation, motivation, and success
Passion turns a job into a profession
SOFT SKILLS INTHE WORKPLACE
What are Soft Skills?
Smooth communication
Computer proficiency
Language fluency
Presentable appearance
Crisis management skills
Why they're important:
Soft skills ensure not just job execution but also professional
behavior and interpersonal effectiveness.
8.
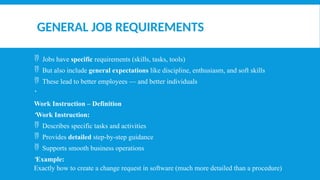
GENERAL JOB REQUIREMENTS
Jobs have specific requirements (skills, tasks, tools)
But also include general expectations like discipline, enthusiasm, and soft skills
These lead to better employees — and better individuals
Work Instruction – Definition
Work Instruction:
Describes specific tasks and activities
Provides detailed step-by-step guidance
Supports smooth business operations
Example:
Exactly how to create a change request in software (much more detailed than a procedure)
9.
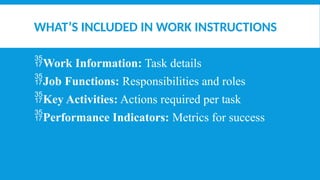
WHAT’S INCLUDED INWORK INSTRUCTIONS
Work Information: Task details
Job Functions: Responsibilities and roles
Key Activities: Actions required per task
Performance Indicators: Metrics for success
10.
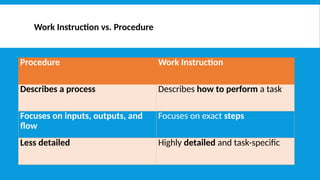
Work Instruction vs.Procedure
Procedure Work Instruction
Describes a process Describes how to perform a task
Focuses on inputs, outputs, and
flow
Focuses on exact steps
Less detailed Highly detailed and task-specific
11.
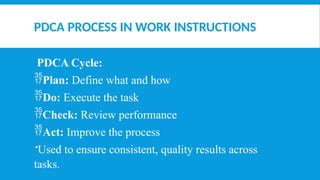
PDCA PROCESS INWORK INSTRUCTIONS
PDCA Cycle:
Plan: Define what and how
Do: Execute the task
Check: Review performance
Act: Improve the process
Used to ensure consistent, quality results across
tasks.
12.
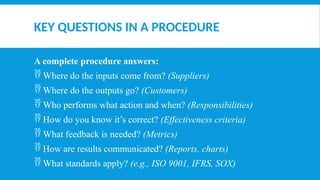
KEY QUESTIONS INA PROCEDURE
A complete procedure answers:
Where do the inputs come from? (Suppliers)
Where do the outputs go? (Customers)
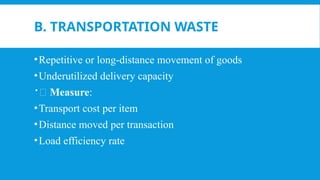
Who performs what action and when? (Responsibilities)
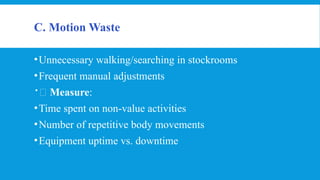
How do you know it’s correct? (Effectiveness criteria)
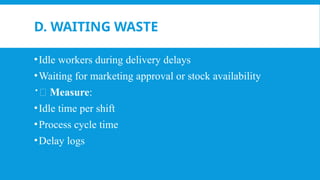
What feedback is needed? (Metrics)
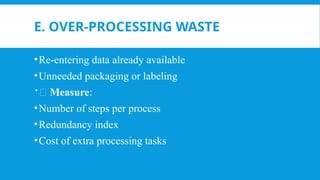
How are results communicated? (Reports, charts)
What standards apply? (e.g., ISO 9001, IFRS, SOX)
13.
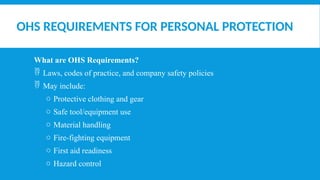
OHS REQUIREMENTS FORPERSONAL PROTECTION
What are OHS Requirements?
Laws, codes of practice, and company safety policies
May include:
o Protective clothing and gear
o Safe tool/equipment use
o Material handling
o Fire-fighting equipment
o First aid readiness
o Hazard control
14.
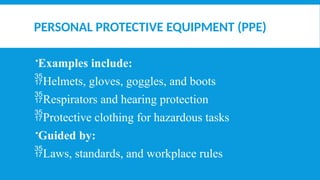
PERSONAL PROTECTIVE EQUIPMENT(PPE)
Examples include:
Helmets, gloves, goggles, and boots
Respirators and hearing protection
Protective clothing for hazardous tasks
Guided by:
Laws, standards, and workplace rules
15.
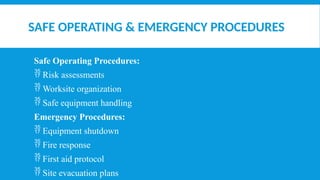
SAFE OPERATING &EMERGENCY PROCEDURES
Safe Operating Procedures:
Risk assessments
Worksite organization
Safe equipment handling
Emergency Procedures:
Equipment shutdown
Fire response
First aid protocol
Site evacuation plans
16.
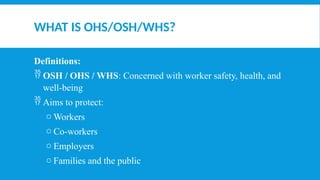
WHAT IS OHS/OSH/WHS?
Definitions:
OSH / OHS / WHS: Concerned with worker safety, health, and
well-being
Aims to protect:
o Workers
o Co-workers
o Employers
o Families and the public
17.
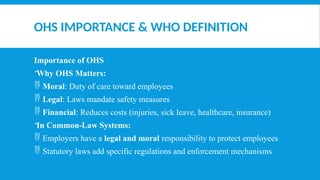
OHS IMPORTANCE &WHO DEFINITION
Importance of OHS
Why OHS Matters:
Moral: Duty of care toward employees
Legal: Laws mandate safety measures
Financial: Reduces costs (injuries, sick leave, healthcare, insurance)
In Common-Law Systems:
Employers have a legal and moral responsibility to protect employees
Statutory laws add specific regulations and enforcement mechanisms
18.
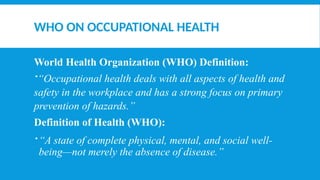
WHO ON OCCUPATIONALHEALTH
World Health Organization (WHO) Definition:
“Occupational health deals with all aspects of health and
safety in the workplace and has a strong focus on primary
prevention of hazards.”
Definition of Health (WHO):
“A state of complete physical, mental, and social well-
being—not merely the absence of disease.”
19.
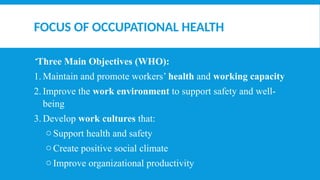
FOCUS OF OCCUPATIONALHEALTH
Three Main Objectives (WHO):
1. Maintain and promote workers’ health and working capacity
2. Improve the work environment to support safety and well-
being
3. Develop work cultures that:
o Support health and safety
o Create positive social climate
o Improve organizational productivity
20.
WHAT IS A“WORKING CULTURE”?
Definition:
The values and attitudes reflected in:
o Management systems
o Personnel policies
o Participation practices
o Training and development
o Quality management
Goal:
A workplace culture that actively supports health, safety, and productivity.
21.
JOINT ILO/WHO COMMITTEEON OCCUPATIONAL HEALTH
Occupational Health Is Multidisciplinary:
Professionals include:
o Physicians, psychologists
o Epidemiologists
o Physiotherapists & rehabilitation experts
o Human factors & ergonomics specialists
Areas of Advice:
Adapting jobs to pre-existing conditions
Proper posture and movement
Appropriate rest breaks
Preventive strategies for workplace hazards
22.
AIMS OF OCCUPATIONALHEALTH
Core Goals:
Promote and maintain physical, mental, and social well-
being
Prevent health issues caused by working conditions
Protect workers from health risks at work
Match jobs to the capabilities of each worker
Ensure mutual adaptation:
23.
WORKPLACE HAZARDS
Workplace Hazards– An Overview
Workplaces Can Present Many Hazards:
Chemical exposures
Biological agents
Physical dangers
Ergonomic stressors
Allergens
Safety risks
Psychosocial factors (e.g., stress, harassment)
While work offers benefits, it also comes with health and safety risks that must be
actively managed.
24.
PHYSICAL & MECHANICALHAZARDS
Physical Hazards:
Common in industries like construction, mining, healthcare, and transportation
Examples: Falls, loud noise, heat, vibration
Child labor can introduce additional risks
Example: Fabrication & Welding Workshop
Must follow PPE Regulations (1992)
Required PPE includes:
o Eye and face protection
o Safety boots and clothing
o Protective overalls
25.
MECHANICAL HAZARDS INTHE WORKPLACE
Machines May Cause:
Crushing
Burns
Cuts, shears, or stabs
Strikes or wounds
Industries Affected:
Manufacturing
Mining
Agriculture
Construction
Safety Measures:
Lockout-tagout (LOTO) procedures
Roll-over protection for vehicles
26.
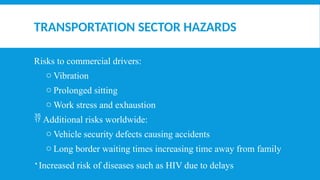
TRANSPORTATION SECTOR HAZARDS
Risksto commercial drivers:
o Vibration
o Prolonged sitting
o Work stress and exhaustion
Additional risks worldwide:
o Vehicle security defects causing accidents
o Long border waiting times increasing time away from family
Increased risk of diseases such as HIV due to delays
27.
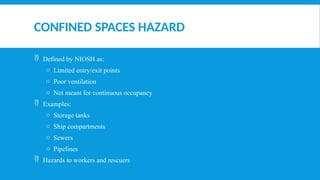
CONFINED SPACES HAZARD
Defined by NIOSH as:
o Limited entry/exit points
o Poor ventilation
o Not meant for continuous occupancy
Examples:
o Storage tanks
o Ship compartments
o Sewers
o Pipelines
Hazards to workers and rescuers
28.
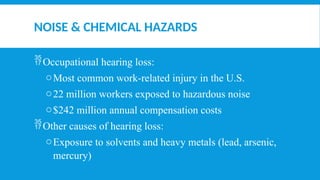
NOISE & CHEMICALHAZARDS
Occupational hearing loss:
oMost common work-related injury in the U.S.
o22 million workers exposed to hazardous noise
o$242 million annual compensation costs
Other causes of hearing loss:
oExposure to solvents and heavy metals (lead, arsenic,
mercury)
29.
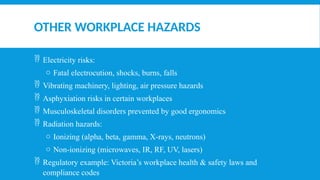
OTHER WORKPLACE HAZARDS
Electricity risks:
o Fatal electrocution, shocks, burns, falls
Vibrating machinery, lighting, air pressure hazards
Asphyxiation risks in certain workplaces
Musculoskeletal disorders prevented by good ergonomics
Radiation hazards:
o Ionizing (alpha, beta, gamma, X-rays, neutrons)
o Non-ionizing (microwaves, IR, RF, UV, lasers)
Regulatory example: Victoria’s workplace health & safety laws and
compliance codes
30.
OCCUPATIONAL HEALTH ANDSAFETY (OHS) ACT
OHS Act 2004 (Victoria) is the cornerstone law
Sets out key principles, duties, and rights for occupational health and safety
Duties cover a wide variety of situations, offering flexibility to comply
OHS Regulations
Occupational Health and Safety Regulations 2007 support the Act
Specify how duties must be performed
Include procedural and administrative requirements:
o Licensing
o Record keeping
o Reporting/notifying incidents
31.
OHS GUIDANCE
WorkSafe Victoriaprovides guidance for compliance
Tools include:
o Compliance Codes
o WorkSafe positions
o Non-statutory guidance documents
All form part of the OHS compliance framework
OHS Policy
Not all legislation terms are fully defined
New work circumstances and industries bring new challenges
WorkSafe develops policies to interpret legislation and clarify actions
Policies ensure consistent understanding and enforcement
32.
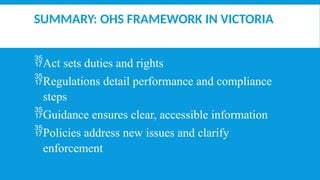
SUMMARY: OHS FRAMEWORKIN VICTORIA
Act sets duties and rights
Regulations detail performance and compliance
steps
Guidance ensures clear, accessible information
Policies address new issues and clarify
enforcement
33.
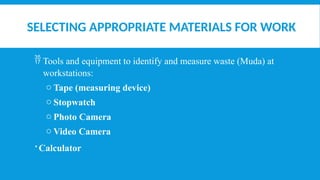
SELECTING APPROPRIATE MATERIALSFOR WORK
Tools and equipment to identify and measure waste (Muda) at
workstations:
o Tape (measuring device)
o Stopwatch
o Photo Camera
o Video Camera
Calculator
34.
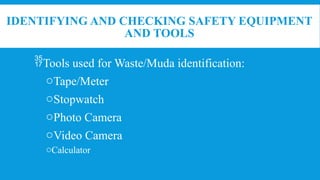
IDENTIFYING AND CHECKINGSAFETY EQUIPMENT
AND TOOLS
Tools used for Waste/Muda identification:
oTape/Meter
oStopwatch
oPhoto Camera
oVideo Camera
oCalculator
35.
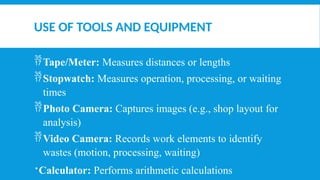
USE OF TOOLSAND EQUIPMENT
Tape/Meter: Measures distances or lengths
Stopwatch: Measures operation, processing, or waiting
times
Photo Camera: Captures images (e.g., shop layout for
analysis)
Video Camera: Records work elements to identify
wastes (motion, processing, waiting)
Calculator: Performs arithmetic calculations
36.
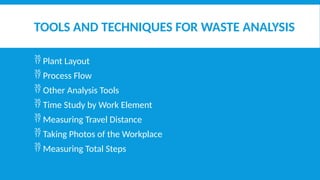
TOOLS AND TECHNIQUESFOR WASTE ANALYSIS
Plant Layout
Process Flow
Other Analysis Tools
Time Study by Work Element
Measuring Travel Distance
Taking Photos of the Workplace
Measuring Total Steps
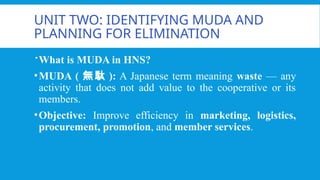
UNIT TWO: IDENTIFYINGMUDA AND
PLANNING FOR ELIMINATION
What is MUDA in HNS?
•MUDA ( 無駄 ): A Japanese term meaning waste — any
activity that does not add value to the cooperative or its
members.
•Objective: Improve efficiency in marketing, logistics,
procurement, promotion, and member services.
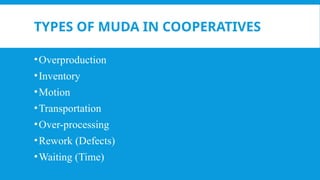
2.2 DISCUSSING CAUSESAND EFFECTS
OF MUDA IN COOPERATIVE MARKETING
Overproduction in Cooperatives
Causes:
• Producing or purchasing products beyond actual member demand
• Preparing large quantities “just in case”
• Using oversized machinery not suited for changing small demands
• Overstaffing due to inefficient planning
Effects:
• Overstocked goods in warehouses
• Increased storage cost
• Inflexibility in adjusting to real-time market trends
• Potential spoilage or expiration
• Blocked cash flow and resources
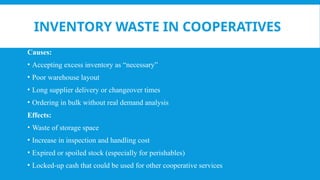
41.
INVENTORY WASTE INCOOPERATIVES
Causes:
• Accepting excess inventory as “necessary”
• Poor warehouse layout
• Long supplier delivery or changeover times
• Ordering in bulk without real demand analysis
Effects:
• Waste of storage space
• Increase in inspection and handling cost
• Expired or spoiled stock (especially for perishables)
• Locked-up cash that could be used for other cooperative services
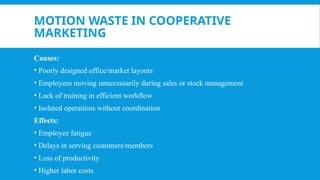
42.
MOTION WASTE INCOOPERATIVE
MARKETING
Causes:
• Poorly designed office/market layouts
• Employees moving unnecessarily during sales or stock management
• Lack of training in efficient workflow
• Isolated operations without coordination
Effects:
• Employee fatigue
• Delays in serving customers/members
• Loss of productivity
• Higher labor costs
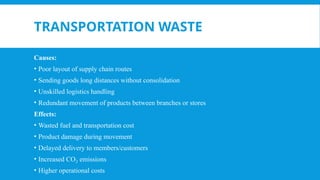
43.
TRANSPORTATION WASTE
Causes:
• Poorlayout of supply chain routes
• Sending goods long distances without consolidation
• Unskilled logistics handling
• Redundant movement of products between branches or stores
Effects:
• Wasted fuel and transportation cost
• Product damage during movement
• Delayed delivery to members/customers
• Increased CO emissions
₂
• Higher operational costs
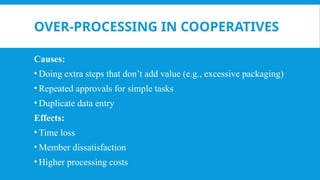
44.
OVER-PROCESSING IN COOPERATIVES
Causes:
•Doing extra steps that don’t add value (e.g., excessive packaging)
• Repeated approvals for simple tasks
• Duplicate data entry
Effects:
• Time loss
• Member dissatisfaction
• Higher processing costs
45.
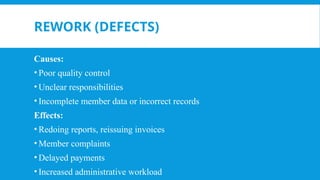
REWORK (DEFECTS)
Causes:
• Poorquality control
• Unclear responsibilities
• Incomplete member data or incorrect records
Effects:
• Redoing reports, reissuing invoices
• Member complaints
• Delayed payments
• Increased administrative workload
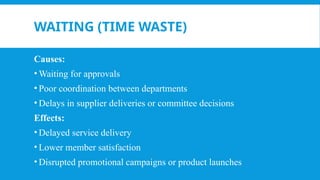
46.
WAITING (TIME WASTE)
Causes:
•Waiting for approvals
• Poor coordination between departments
• Delays in supplier deliveries or committee decisions
Effects:
• Delayed service delivery
• Lower member satisfaction
• Disrupted promotional campaigns or product launches
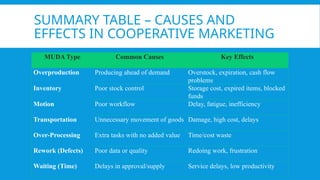
47.
SUMMARY TABLE –CAUSES AND
EFFECTS IN COOPERATIVE MARKETING
MUDA Type Common Causes Key Effects
Overproduction Producing ahead of demand Overstock, expiration, cash flow
problems
Inventory Poor stock control Storage cost, expired items, blocked
funds
Motion Poor workflow Delay, fatigue, inefficiency
Transportation Unnecessary movement of goods Damage, high cost, delays
Over-Processing Extra tasks with no added value Time/cost waste
Rework (Defects) Poor data or quality Redoing work, frustration
Waiting (Time) Delays in approval/supply Service delays, low productivity
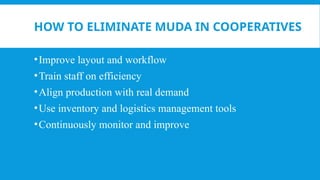
48.
HOW TO ELIMINATEMUDA IN COOPERATIVES
•Improve layout and workflow
•Train staff on efficiency
•Align production with real demand
•Use inventory and logistics management tools
•Continuously monitor and improve
49.
DISCUSSION AND REFLECTION
•Canyou identify one MUDA from your cooperative’s
marketing process?
•What caused it?
•What can be improved?
50.
CAUSES OF MUDA– WAITING / IDLE
TIME
Causes:
• Obstruction of product/service flow
• Poor layout of equipment or workstations
• Unbalanced work schedules among cooperative units
Effects:
• Delays in earlier (upstream) processes
• Capacity imbalances between teams
• Waste of manpower, time, and machinery
• Growing in-process inventory
• Missed delivery deadlines to members or buyers
51.
CAUSES OF MUDA– DEFECT MAKING
Causes:
• Over-reliance on final inspection rather than prevention
• No clear standards for inspection
• Missing or inconsistent standard operations
• Poor material handling during packaging or transport
Effects:
• Higher material costs due to waste
• Decline in cooperative productivity
• More staff and time required for re-inspection and correction
• Damaged reputation among members and customers
52.
CAUSES OF MUDA– OVER-
PROCESSING
Causes:
• Excessive rework due to defects and complaints
• Poor analysis of production and marketing processes
• Repetition of unnecessary operations
• Lack of standard operating procedures
Effects:
• Incomplete or inconsistent process standardization
• Unnecessary steps that reduce efficiency
• Poor workability and increased error rate
• Higher labor and time consumption for little added value
53.
MUDA – WASTINGTALENT AND IDEAS
What is it?
• Ignoring creative ideas from cooperative members or employees
• Under-utilizing people’s knowledge and potential
Example in Cooperatives:
• Not involving members in product improvement discussions
• Dismissing feedback from marketing or sales teams
Solution:
• Encourage teamwork and open idea-sharing
• Conduct regular brainstorming sessions and surveys
54.
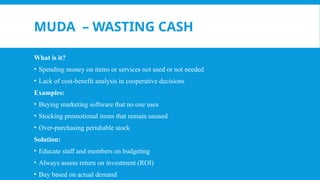
MUDA – WASTINGCASH
What is it?
• Spending money on items or services not used or not needed
• Lack of cost-benefit analysis in cooperative decisions
Examples:
• Buying marketing software that no one uses
• Stocking promotional items that remain unused
• Over-purchasing perishable stock
Solution:
• Educate staff and members on budgeting
• Always assess return on investment (ROI)
• Buy based on actual demand
55.
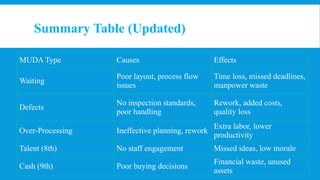
Summary Table (Updated)
MUDAType Causes Effects
Waiting
Poor layout, process flow
issues
Time loss, missed deadlines,
manpower waste
Defects
No inspection standards,
poor handling
Rework, added costs,
quality loss
Over-Processing Ineffective planning, rework
Extra labor, lower
productivity
Talent (8th) No staff engagement Missed ideas, low morale
Cash (9th) Poor buying decisions
Financial waste, unused
assets
56.
FINAL REFLECTION
• WhichMUDA types exist in your cooperative today?
• What low-cost or no-cost changes can you start implementing?
• Are you using the talent and creativity of your cooperative
members?
Engage your members. Reduce your waste. Grow your
cooperative.
57.
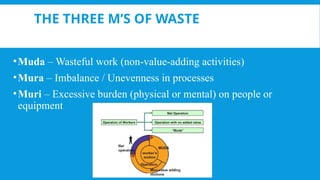
THE THREE M’SOF WASTE
•Muda – Wasteful work (non-value-adding activities)
•Mura – Imbalance / Unevenness in processes
•Muri – Excessive burden (physical or mental) on people or
equipment
58.
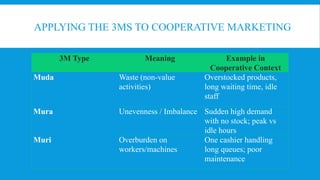
APPLYING THE 3MSTO COOPERATIVE MARKETING
3M Type Meaning Example in
Cooperative Context
Muda Waste (non-value
activities)
Overstocked products,
long waiting time, idle
staff
Mura Unevenness / Imbalance Sudden high demand
with no stock; peak vs
idle hours
Muri Overburden on
workers/machines
One cashier handling
long queues; poor
maintenance
59.
MORE ABOUT MURI
•Muri means pushing people or machines beyond their natural
limits
• In cooperatives:
• Assigning marketing or sales teams unrealistic daily targets
• Forcing unpaid overtime
• Making one person do the job of three
• ⚠️“Overburden leads to errors, stress, breakdowns, and burnout.”
60.
CLASSIFICATION METHODS FOR
WASTE
•Severalframeworks are used to identify and categorize
waste in operations:
• The 3MUs – Muda, Mura, Muri
• 5M + Q + S – (Man, Machine, Material, Method,
Measurement + Quality + Safety)
• The Flow of Goods – Analysis of each step in the value
chain
• The Seven Deadly Wastes – (Overproduction, Waiting,
etc.)
61.
MURI:-
Mental and physicaloverburden on operators,
and overburden on production machinery
We should not force hard work on Employees
in the name of productivity improvement •
Mental and physical overburden on operators,
and overburden on production machinery
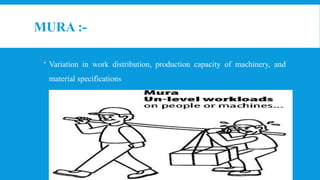
62.
MURA :-
Variationin work distribution, production capacity of machinery, and
material specifications
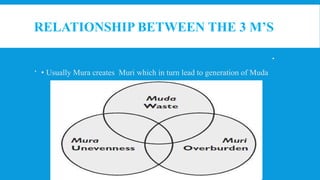
63.
RELATIONSHIP BETWEEN THE3 M’S
• Usually Mura creates Muri which in turn lead to generation of Muda
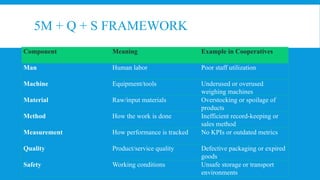
64.
5M + Q+ S FRAMEWORK
Component Meaning Example in Cooperatives
Man Human labor Poor staff utilization
Machine Equipment/tools Underused or overused
weighing machines
Material Raw/input materials Overstocking or spoilage of
products
Method How the work is done Inefficient record-keeping or
sales method
Measurement How performance is tracked No KPIs or outdated metrics
Quality Product/service quality Defective packaging or expired
goods
Safety Working conditions Unsafe storage or transport
environments
65.
REMEMBER
We should notforce hard work on employees in the
name of productivity improvement.”
•Good management means:
•Preventing overburden (Muri)
•Ensuring balance (Mura)
•Eliminating waste (Muda)
66.
FINAL DISCUSSION QUESTIONS
•Are there signs of Muda, Mura, or Muri in your cooperative?
• How can we apply the 5M+Q+S model to improve our processes?
• What actions will we take today to reduce overburden and
imbalance?
67.
UNDERSTANDING MURA –IMBALANCE IN COOPERATIVES
Definition: MURA means unevenness or inconsistency in
operations
• Examples in Cooperative Marketing:
• Irregular member product supply
• Different packaging standards between teams
• Varying machine capacities in processing units
• Inconsistent service quality across locations
68.
RELATIONSHIP BETWEEN THE3 M'S
•Mura (Unevenness) often leads to:
• Muri (Overburden) → Too much pressure on staff
or machines
• Which results in Muda (Waste) → Time, energy,
money loss
Mura → Muri → Muda
"Balance is essential. Without it, stress and waste follow."
69.
INTRODUCTION TO KAIZEN
•Kaizen= Continuous Improvement
•Focus: Small, consistent improvements in all business
processes
•Objective: Eliminate waste and maximize value in
cooperative operations
70.
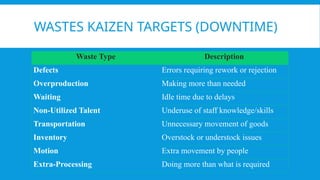
WASTES KAIZEN TARGETS(DOWNTIME)
Waste Type Description
Defects Errors requiring rework or rejection
Overproduction Making more than needed
Waiting Idle time due to delays
Non-Utilized Talent Underuse of staff knowledge/skills
Transportation Unnecessary movement of goods
Inventory Overstock or understock issues
Motion Extra movement by people
Extra-Processing Doing more than what is required
71.
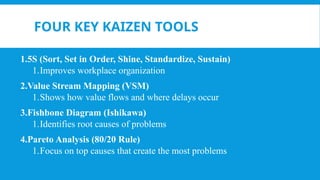
FOUR KEY KAIZENTOOLS
1.5S (Sort, Set in Order, Shine, Standardize, Sustain)
1.Improves workplace organization
2.Value Stream Mapping (VSM)
1.Shows how value flows and where delays occur
3.Fishbone Diagram (Ishikawa)
1.Identifies root causes of problems
4.Pareto Analysis (80/20 Rule)
1.Focus on top causes that create the most problems
72.
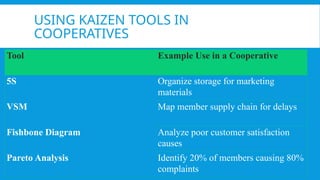
USING KAIZEN TOOLSIN
COOPERATIVES
Tool Example Use in a Cooperative
5S Organize storage for marketing
materials
VSM Map member supply chain for delays
Fishbone Diagram Analyze poor customer satisfaction
causes
Pareto Analysis Identify 20% of members causing 80%
complaints
73.
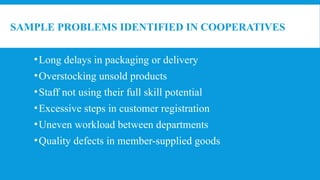
SAMPLE PROBLEMS IDENTIFIEDIN COOPERATIVES
•Long delays in packaging or delivery
•Overstocking unsold products
•Staff not using their full skill potential
•Excessive steps in customer registration
•Uneven workload between departments
•Quality defects in member-supplied goods
74.
SUMMARY
•Recognize how Mura,Muri, and Muda are connected
•Apply Kaizen tools to continuously improve cooperative
systems
•Engage cooperative members and staff to identify and solve
problems
75.
KAIZEN PROBLEM IDENTIFICATION
TECHNIQUES
•Kaizenrelies on practical tools to identify and solve
workplace inefficiencies.
•These techniques help cooperatives improve marketing,
distribution, and internal workflow.
76.
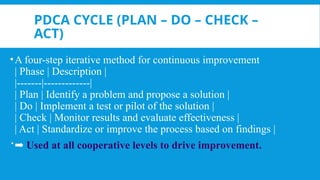
PDCA CYCLE (PLAN– DO – CHECK –
ACT)
•A four-step iterative method for continuous improvement
| Phase | Description |
|-------|-------------|
| Plan | Identify a problem and propose a solution |
| Do | Implement a test or pilot of the solution |
| Check | Monitor results and evaluate effectiveness |
| Act | Standardize or improve the process based on findings |
➡ Used at all cooperative levels to drive improvement.
77.
GEMBA – “THEREAL PLACE”
•Gemba means going to where the work actually happens
•In a cooperative, this means:
• Visiting storage areas
• Observing product marketing and sales
• Talking with frontline workers and members
🔍 Managers gain real-time insight to support
problem-solving.
78.
JISHUKEN – SELF-DIRECTEDSTUDY
GROUPS
Jishuken = Self-learning & team learning
•In a cooperative:
• Marketing staff form teams to review promotional processes
• Management studies member delivery schedules and quality
control
✅ Encourages accountability and continuous improvement from
within
79.
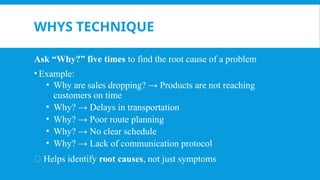
WHYS TECHNIQUE
Ask “Why?”five times to find the root cause of a problem
• Example:
• Why are sales dropping? → Products are not reaching
customers on time
• Why? → Delays in transportation
• Why? → Poor route planning
• Why? → No clear schedule
• Why? → Lack of communication protocol
🎯 Helps identify root causes, not just symptoms
80.
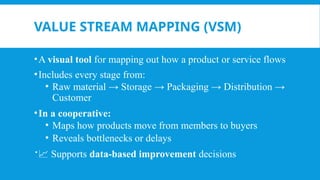
VALUE STREAM MAPPING(VSM)
•A visual tool for mapping out how a product or service flows
•Includes every stage from:
• Raw material → Storage → Packaging → Distribution →
Customer
•In a cooperative:
• Maps how products move from members to buyers
• Reveals bottlenecks or delays
📈 Supports data-based improvement decisions
81.
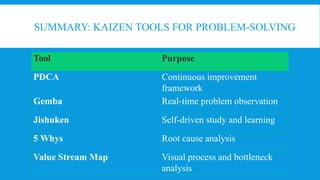
SUMMARY: KAIZEN TOOLSFOR PROBLEM-SOLVING
Tool Purpose
PDCA Continuous improvement
framework
Gemba Real-time problem observation
Jishuken Self-driven study and learning
5 Whys Root cause analysis
Value Stream Map Visual process and bottleneck
analysis
82.
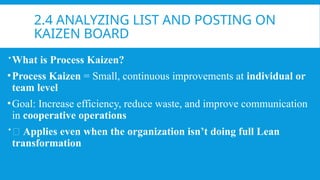
2.4 ANALYZING LISTAND POSTING ON
KAIZEN BOARD
What is Process Kaizen?
•Process Kaizen = Small, continuous improvements at individual or
team level
•Goal: Increase efficiency, reduce waste, and improve communication
in cooperative operations
💡 Applies even when the organization isn’t doing full Lean
transformation
83.
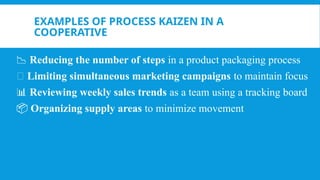
EXAMPLES OF PROCESSKAIZEN IN A
COOPERATIVE
📉 Reducing the number of steps in a product packaging process
🔄 Limiting simultaneous marketing campaigns to maintain focus
📊 Reviewing weekly sales trends as a team using a tracking board
📦 Organizing supply areas to minimize movement
84.
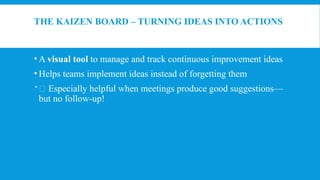
THE KAIZEN BOARD– TURNING IDEAS INTO ACTIONS
• A visual tool to manage and track continuous improvement ideas
• Helps teams implement ideas instead of forgetting them
🧩 Especially helpful when meetings produce good suggestions—
but no follow-up!
85.
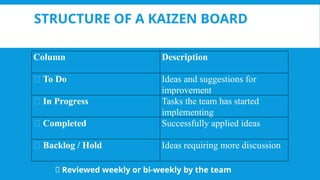
STRUCTURE OF AKAIZEN BOARD
Column Description
📌 To Do Ideas and suggestions for
improvement
🚧 In Progress Tasks the team has started
implementing
✅ Completed Successfully applied ideas
🧠 Backlog / Hold Ideas requiring more discussion
🔁 Reviewed weekly or bi-weekly by the team
86.
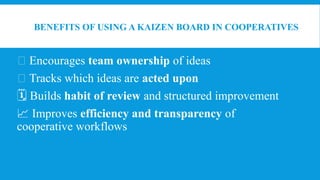
BENEFITS OF USINGA KAIZEN BOARD IN COOPERATIVES
👥 Encourages team ownership of ideas
✅ Tracks which ideas are acted upon
🗓 Builds habit of review and structured improvement
📈 Improves efficiency and transparency of
cooperative workflows
87.
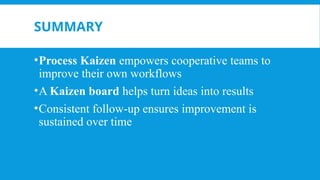
SUMMARY
•Process Kaizen empowerscooperative teams to
improve their own workflows
•A Kaizen board helps turn ideas into results
•Consistent follow-up ensures improvement is
sustained over time
88.
2.5: IDENTIFYING ANDMEASURING RELEVANT
PROCEDURES ON MUDA
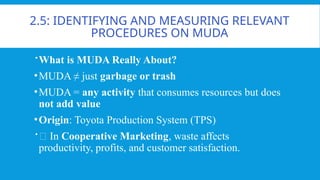
What is MUDA Really About?
•MUDA ≠ just garbage or trash
•MUDA = any activity that consumes resources but does
not add value
•Origin: Toyota Production System (TPS)
🔎 In Cooperative Marketing, waste affects
productivity, profits, and customer satisfaction.
89.
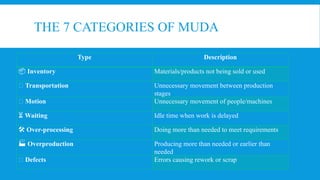
THE 7 CATEGORIESOF MUDA
Type Description
📦 Inventory Materials/products not being sold or used
🚛 Transportation Unnecessary movement between production
stages
🤸 Motion Unnecessary movement of people/machines
⏳ Waiting Idle time when work is delayed
🛠 Over-processing Doing more than needed to meet requirements
🏭 Overproduction Producing more than needed or earlier than
needed
❌ Defects Errors causing rework or scrap
90.
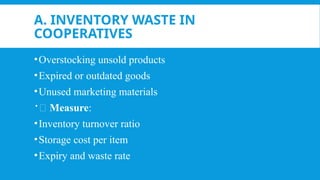
A. INVENTORY WASTEIN
COOPERATIVES
•Overstocking unsold products
•Expired or outdated goods
•Unused marketing materials
📏 Measure:
•Inventory turnover ratio
•Storage cost per item
•Expiry and waste rate
91.
B. TRANSPORTATION WASTE
•Repetitiveor long-distance movement of goods
•Underutilized delivery capacity
📏 Measure:
•Transport cost per item
•Distance moved per transaction
•Load efficiency rate
92.
C. Motion Waste
•Unnecessarywalking/searching in stockrooms
•Frequent manual adjustments
📏 Measure:
•Time spent on non-value activities
•Number of repetitive body movements
•Equipment uptime vs. downtime
93.
D. WAITING WASTE
•Idleworkers during delivery delays
•Waiting for marketing approval or stock availability
📏 Measure:
•Idle time per shift
•Process cycle time
•Delay logs
94.
E. OVER-PROCESSING WASTE
•Re-enteringdata already available
•Unneeded packaging or labeling
📏 Measure:
•Number of steps per process
•Redundancy index
•Cost of extra processing tasks
95.
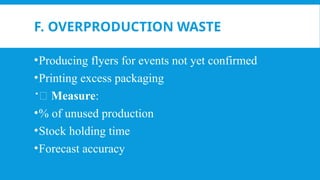
F. OVERPRODUCTION WASTE
•Producingflyers for events not yet confirmed
•Printing excess packaging
📏 Measure:
•% of unused production
•Stock holding time
•Forecast accuracy
96.
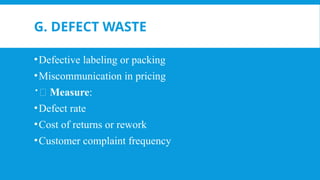
G. DEFECT WASTE
•Defectivelabeling or packing
•Miscommunication in pricing
📏 Measure:
•Defect rate
•Cost of returns or rework
•Customer complaint frequency
97.
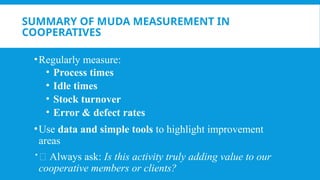
SUMMARY OF MUDAMEASUREMENT IN
COOPERATIVES
•Regularly measure:
• Process times
• Idle times
• Stock turnover
• Error & defect rates
•Use data and simple tools to highlight improvement
areas
📌 Always ask: Is this activity truly adding value to our
cooperative members or clients?


![chapter-1 Introduction to Emerging Technologies [Autosaved].pptx](https://cdn.slidesharecdn.com/ss_thumbnails/chapter-1introductiontoemergingtechnologiesautosaved-250721132907-a397d4ad-thumbnail.jpg?width=640&height=640&fit=bounds)

![chapter-1 Introduction to Emerging Technologies [Autosaved].pptx](https://cdn.slidesharecdn.com/ss_thumbnails/chapter-1introductiontoemergingtechnologiesautosaved-250706055921-dccba335-thumbnail.jpg?width=640&height=640&fit=bounds)


