US Hispanic Population Stats - 2014
•
1 like•936 views

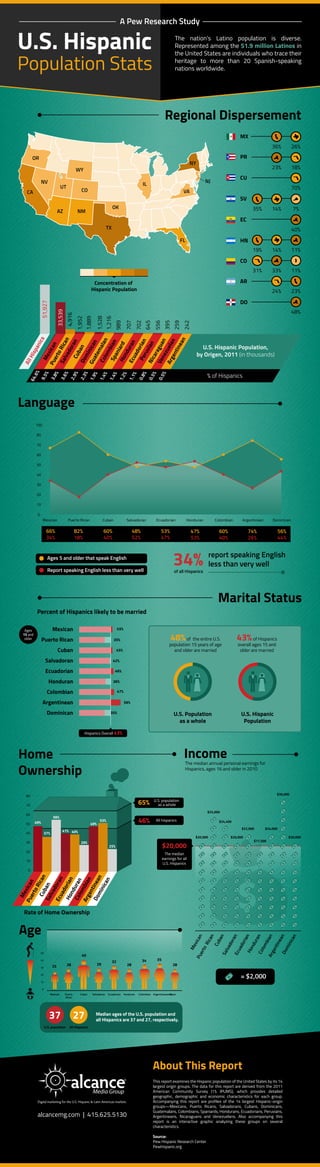
The nation’s Latino population is diverse. Represented among the 51.9 million Latinos in the United States are individuals who trace their heritage to more than 20 Spanish-speaking nations worldwide.
Report
Share
Report
Share
Recommended
nutritionprofiles_california_101916
This document summarizes the state of nutrition among Latino children and families in California. It finds that Latino children in California are more likely than other groups to live in low-income households and experience food insecurity. Latinos also have less access to healthy food retailers in their communities. As a result, Latinos in California have higher rates of being overweight, obese, and experiencing related chronic health conditions like diabetes. Federal nutrition programs help many Latinos access nutritious food, but disparities remain, highlighting the need for continued efforts to improve access to healthy options.
Neuropharmacology: Epidemiology
Lecture 10 from a college level neuropharmacology course taught in the spring 2012 semester by Brian J. Piper, Ph.D. (psy391@gmail.com) at Willamette University. Focus is on the Monitoring the Future.
Census
Hispanics accounted for over half of the total US population growth between 2000 and 2010. The Hispanic population grew to 50.5 million, a 43% increase, with those under 18 growing by 39%. Most Hispanics live in nine states including California, Texas, and Florida, but the population more than doubled in several southern states. Hispanics were responsible for the only growth in six states, and while Michigan's overall population declined, its Hispanic population grew.
Welcome to the Revelation Nation Series: A surprising look at today’s multicu...
Our country’s population is diverse. Complex. And possibly not at all what you think.
Welcome to the Revelation Nation series: A surprising look at the multicultural health landscape.
Minorities are quickly becoming anything but that. The growing multicultural population now accounts for nearly 40% of the U.S. population. Hispanics, African-Americans, Asian-Americans and the LGBTQ community alike are increasingly engaging with the healthcare industry at all levels of care. And while we marketers may think they have a solid grasp on how they engage, the realities of it all may surprise you.
Aetna Presentation Latino Demographics
Latinos in the U.S. and Northeast Florida: A Demographic Overview
Feb 25, 2005 _ UNF Hispanic Health Issues Seminar
This is part 1 of an 8 part series of seminars on Hispanic Health Issues brought to you by the University of North Florida’s Dept. of Public Health, College of Health, a grant from AETNA, and the cooperation of Duval County Health Department.
Welcome to the Revelation Nation Series: A surprising look at today’s multicu...
Welcome to the Revelation Nation Series: A surprising look at today’s multicu...Fabric, An Evoke Group Company
Fabric is the agency for multicultural health in a connected world. Across cultures, languages, generations and channels, Fabric weaves enduring connections between health & wellness brands and the diversity of their consumers. We help clients navigate today’s shifting cultural landscape and identify actionable insights that can create more culturally inspired—more human—brands.America and the europe culture and the traditions
This document summarizes data from the 2010 US Census on the racial and ethnic composition of the United States population. It finds that the largest groups are White Americans at 72.4%, Hispanic and Latino Americans at 16.3%, Black or African Americans at 12.6%, Asian Americans at 4.8%, American Indian and Alaska Natives at 0.9%, and Native Hawaiians and Other Pacific Islanders at 0.2%. It also provides more detail on the subgroups and ancestry of each of these racial and ethnic categories.
"U.S. Hispanic Market Info & Insights" – By Michelle Villalobos, Former Publi...
The document discusses the U.S. Hispanic market, which represented $800 billion in spending power in 2006 and is estimated to grow to $1.2 trillion by 2011. Hispanics strongly influence popular culture and require specialized marketing strategies due to differences in media consumption habits, acculturation levels, and attachment to their country of origin. Hispanics vary widely in language preference, cultural practices, and how connected they feel to their native country.
Sxsw hispanic 3.15.11
The document discusses trends from the 2010 US Census data regarding population growth among Hispanic and multi-cultural populations. Some key points:
- The Hispanic population grew much faster than total and non-Hispanic white populations between 2000-2010.
- Hispanic population growth significantly impacted states like Texas, California, Oregon, North Carolina and Alabama, with growth rates far exceeding projections.
- The document also discusses media usage trends, finding that while Hispanic households are less likely to own home computers/broadband, those with internet access spend as much/more time online and watching online video compared to non-Hispanics. Hispanics also more commonly own internet-enabled cell phones and spend more time watching video on phones
Journal of family planning perspectives www.lizettealvarez.com
Among 432 low-income Hispanic women surveyed at an obstetrics clinic in Los Angeles, respondents reported wanting an average of 2.8 sons but only 0.1 daughters. Being older than 30, having less than an eighth grade education, preferring to speak Spanish, having been born outside the US, and coming from a large family were associated with a stronger desire for sons. A multivariate analysis found that preference for Spanish and number of existing children were the strongest predictors of desiring more sons. The findings suggest that family planning programs should acknowledge cultural values like son preference rather than just providing contraceptive access and education.
Geo finalpresentation michellesuarez3
The document discusses Hispanic racial identity in the US according to the US Census. It notes that Hispanics were not counted until the 20th century but are now the fastest growing minority. The census may list Hispanic as a racial identifier in 2020. Hispanics share traits like immigration experience, language, and traditions from Latin America. However, race is a social construct and Hispanics trace their origins to Native Americans, Europeans, and African slaves brought to Latin America. The document examines the complex racial histories and classifications that influence how Hispanics identify racially in the US.
Hispanic Marketing
This document discusses marketing strategies for reaching Hispanic audiences in the United States. It notes that Hispanics originate from over 22 countries and concentrate in different areas, so a single message does not work for all. Hispanics are a growing demographic and influential in areas like popular culture, consumerism, and social media. Religion and festivals are also important to Hispanic culture. Successful marketing will feature influential Hispanic celebrities and leverage Spanish-language media and social media influencers like Latina mothers. The document advocates tailoring messaging to specific Hispanic ethnicities and settlement patterns.
Womens health issues journal www.lizettealvarez.com
1) The study examined factors related to contraceptive use among Latina women in Los Angeles, including cultural expectations, attitudes, and perceived barriers.
2) Surveys were administered to 291 Latina women ages 15-50 at four clinics, in English or Spanish, to assess contraceptive use practices and perceptions of various social and cultural influences.
3) Key factors examined included cultural norms about the value of motherhood, perceived reliability and side effects of contraceptives, embarrassment about obtaining or discussing contraceptives, and perceived barriers to use. Understanding these factors could provide insight into the high birth rate among Latinas in the United States.
According to the 2010 Census, the number of Hispanics in the US has increased.
The gap between the Census 2010 count and Census Bureau population estimates has been widest in states with relatively small Hispanic populations.
New Bostonians 2013-2014
This document provides a summary of demographic data on immigrants and foreign-born residents in Boston from 2013-2014. Some of the key findings include:
- 27.1% of Boston's population is foreign-born, higher than Massachusetts and the U.S.
- The top countries of origin for Boston's foreign-born residents are Dominican Republic, China, Haiti, Brazil, and Jamaica.
- Boston is becoming more racially and ethnically diverse, with non-Hispanic whites now making up less than half the population.
- Over 40% of Boston Public School students speak a language other than English at home.
- The neighborhoods with the highest percentage of foreign-born residents are East Boston
Health equity-latinos-nys-english
Hispanics/Latinos in New York State continue to experience health disparities and poorer health outcomes compared to non-Hispanic whites. They have higher rates of chronic conditions like diabetes, HIV, asthma, and teen pregnancy. They also have lower education levels, higher poverty rates, less health insurance coverage, and language barriers that influence their health. The document outlines these disparities and calls for action to address social determinants of health and improve access to culturally-responsive healthcare services to achieve health equity for Hispanics/Latinos in New York State.
Montenegro -indigenous_health
This document provides an overview of Indigenous health in Latin America and the Caribbean. It discusses the complex history and current situation of Indigenous peoples in the region, which is home to over 400 Indigenous groups totaling approximately 45-48 million people. While Indigenous populations and cultures were once much larger, European colonization dramatically reduced Indigenous populations and marginalized Indigenous communities. More recently, however, some Indigenous populations and political influence have increased. The document examines key topics like Indigenous health systems, changing political environments, and variations in defining and measuring Indigenous demographics.
Bureau of Prisons | Latino Movement in the US
I was invited to speak to the staff at the Tallahassee Federal Penitentiary on the current Latino movement in the United States.
Health and Health Care for Hispanics in the United States - Updated January 2018
Hispanics make up nearly 1 in 5 of the US population and are projected to account for 1 in 4 people by 2045. They face greater health challenges such as higher rates of obesity, diabetes, HIV diagnosis, and teen birth compared to whites. Hispanics also experience greater barriers to healthcare access, with higher rates of being uninsured, having no usual source of care, and not seeing a doctor or dentist in the last year. Additionally, Hispanics are more likely to face other social determinants of poorer health such as lower levels of education, food insecurity, and unsafe neighborhoods. While the uninsured rate for Hispanics declined under the Affordable Care Act, they are still more likely than whites to
Marketig services-hispanic-demographic-report-11-2012
This document discusses trends in the Hispanic consumer market in the United States. It finds that the Hispanic population, especially younger cohorts, is growing rapidly and influencing American culture. Hispanics now make up 16% of the US population and control 10% of discretionary spending. The markets seeing the largest growth in Hispanic populations are spread across the country. Hispanic consumers tend to be more optimistic about their financial future compared to non-Hispanics. While language preferences vary by generation, three-quarters of Hispanic adults prefer to speak at least some Spanish. Advertising in Spanish resonates even with many English-dominant Hispanics. Technology and retail websites visited by Spanish-speaking consumers reflect this demographic's influence.
How US Hispanics search - POV
This document discusses strategies for marketing to US Hispanics. It notes that US Hispanics are a diverse group originating from over 40 countries. While many speak English most of the time online, Spanglish may resonate more for certain product categories. The key is taking a culturally sensitive approach and understanding that language is less important than cultural relevance. Reaching US Hispanics can have global impact since they have family abroad. Marketers need to allocate over 8% of their budget to effectively reach the one-fifth of the US population that is Hispanic.
Edelman Multicultural Capabilities
The document provides statistics and information about Hispanics/Latinos and African Americans in the US. Some of the key points include:
- By 2050, multicultural communities will represent 54% of the US population. 40% of Millennials and 61% of Millennials are minorities/bilingual.
- Hispanics account for 17% of the US population and over half of Hispanic children are born in the US. Over half of online Hispanics are ages 18-29.
- African Americans account for 12.6% of the US population and over 30% of African Americans will be online in the next four years.
- The purchasing power of Hispanics is estimated at
TEN-STEP STUDY PLAN1. Statement of the problem and its significa.docx
TEN-STEP STUDY PLAN
1. Statement of the problem and its significance
2. Theoretical or conceptual framework
3. Research questions to be answered by the study
4. List of hypotheses to be tested
5. Definitions of key terms and variables
6. Description of the research design
7. Description of the sample and how it was obtained
8. Description of the planned statistical analysis
9. Statement of assumptions and limitations
10. Dissemination plan.
obesity pdf.pdf
NCHS Data Brief ■ No. 219 ■ November 2015
Prevalence of Obesity Among Adults and Youth:
United States, 2011–2014
Cynthia L. Ogden, Ph.D.; Margaret D. Carroll, M.S.P.H.; Cheryl D. Fryar, M.S.P.H.;
and Katherine M. Flegal, Ph.D.
Figure 1. Prevalence of obesity among adults aged 20 and over, by sex and age: United States,
2011–2014
P
er
ce
nt
0
10
20
30
40
50 60 and over40–5920–3920 and over
WomenMenAll
36.3
32.3
140.2
137.0
234.3
230.3
1,238.3
34.9
38.3
34.4
142.1
138.8
1Significantly different from those aged 20–39.
2
Key findings
Data from the National
Health and Nutrition
Examination Survey
● In 2011–2014, the
prevalence of obesity was just
over 36% in adults and 17% in
youth.
● The prevalence of obesity
was higher in women (38.3%)
than in men (34.3%). Among
all youth, no difference was
seen by sex.
● The prevalence of obesity
was higher among middle-aged
(40.2%) and older (37.0%)
adults than younger (32.3%)
adults.
● The prevalence of obesity
was higher among non-
Hispanic white, non-Hispanic
black, and Hispanic adults and
youth than among non-Hispanic
Asian adults and youth.
● From 1999 through 2014,
obesity prevalence increased
among adults and youth.
However, among youth,
prevalence did not change
from 2003–2004 through
2013–2014.
U.S. DEPA
Obesity is associated with health risks (1,2). Monitoring the prevalence
of obesity is relevant for public health programs that focus on reducing
or preventing obesity. No significant changes were seen in either adult or
childhood obesity prevalence in the United States between 2003–2004 and
2011–2012 (3). This report provides the most recent national data on obesity
prevalence by sex, age, and race and Hispanic origin, using data for 2011–
2014. Overall prevalence estimates from 1999–2000 through 2013–2014 are
also presented.
Keyword: National Health and Nutrition Examination Survey
What was the prevalence of obesity among adults in
2011–2014?
The prevalence of obesity was 36.5% (crude estimate) among U.S. adults
during 2011–2014. Overall, the prevalence of obesity among middle-aged
RTMENT OF HEALTH AND HUMAN SERVICES
Centers for Disease Control and Prevention
National Center for Health Statistics
Significantly different from women of the same age group.
NOTES: Totals were age-adjusted by the direct method to the 2000 U.S. census population using the age groups 20–39, 40–59,
and 60 and over. Crude estimates are 36.5% for all, 34.5% for men, and 38.5% for women.
SOURCE: CDC/NCHS, ...
2018 State of Hispanic Homeownership Report by NAHREP GREATER LAS VEGAS
The 2018 State of Hispanic Homeownership Report published by the National Association of Hispanic Real Estate Professionals analyzes Hispanic homeownership trends in the U.S. It finds that in 2018, Hispanics achieved the largest net gain in homeowners since 2005, raising the Hispanic homeownership rate to 47.1%. Hispanics have accounted for 62.7% of net homeownership gains over the past decade and are projected to drive over half of new homeowners in coming years. Factors contributing to these gains include high rates of household formation, labor force participation, and population and income growth among Hispanics.
Case Study: "Targeting the Hispanic Demo"
This document provides an overview of the growing Hispanic market in the United States and strategies for targeting Hispanic audiences. Some key points:
- The U.S. Hispanic population is over 52 million with a buying power of $1.7 trillion.
- Hispanics make up 47% of multicultural births in the U.S. and are increasingly shaping mainstream American culture.
- Successful strategies recognize the duality of Hispanic audiences and blend Spanish language with English language content, American culture with roots in Latin American countries.
- Programming should reflect Hispanic values like family and education as well as interests in music, sports and pop culture trends.
CALPACT Webinar: Putting Culture Into Context: Communicating with Diverse Lat...
CALPACT Webinar: Putting Culture Into Context: Communicating with Diverse Lat...Center for Public Health Practice & Leadership at UC Berkeley
Today's U.S. Latino population is growing, dynamic and evolving, reflecting a new American reality. Latino culture and family dynamics impact healthcare decisions and behaviors. Recognizing that Latinos are not a homogeneous group, experts from media, academic research and public health promotion will share insights, tips and tools in this timely webinar for closing the cultural communication gap with this diverse population.
After this session, participants will be able to:
- Identify diversity among Latino populations and take appropriate steps to build a communication ecology relative to that diversity
- List at least two healthcare myths about Latinos
- Describe the role that media, community and family influences play in healthcare decisions
- Describe how to reach Latinos more effectively through culturally relevant communication and outreach
Speakers:
Sonya Suarez-Hammond, Senior Director of Strategy & Insights/Healthcare at Univision Communications
Dr. Holley Wilkin, Professor and affiliated faculty of the department of Partnership for Urban Health Research at Georgia State University
Dr. Carmen Gonzalez, Postdoctoral Scholar at the Annenberg School for Communication and Journalism at the University of Southern California.
Moderator: Nancy Murphy, Executive Vice President, Metropolitan Group.
This presentation was from the fifth session in the CALPACT sponsored Health Communication Matters Webinar Series, which will help participants in all walks of public health to apply health literacy principles to their everyday communications.
Please visit here to listen to the audio recording of the webinar:
http://cc.readytalk.com/play?id=2peynd
Visit these links for the other resources related to this webinar:
Resources:
http://www.slideshare.net/SPHCalpact/putting-culture-into-context-resources
Health Literacy Undervalued by Public Health? A tool for public health professionals:
http://www.slideshare.net/SPHCalpact/calpact-training-health-literacy-undervalued-by-public-health-training-tool
Follow Us on Twitter: @CALPACT
Facebook: http://www.facebook.com/CALPACTUCB
Website: www.calpact.org
Questions?
Email sphcalpact@berkeley.edu Please go to the New York State Health Dept.httpswww.health.docx
Please go to the New York State Health Dept.
https://www.health.ny.gov/statistics/vital_statistics/2013/
Census Bureau
http://quickfacts.census.gov/qfd/states/36000.html
Before you start the specific assignment you may want to examine the information available.
Area I Area II Source of
Data
Population
Birth Rate per 1000
Mortality Rate per 100,000
Major Causes of Death
Top 3 in order
Level of Education
% high school grad
% college grad
% adv
Level of Income
Median household in $
Racial/Ethnic composition
Use data from New York State Health Dept. and the Census Bureau to compare two communities of your choice. You may also want to try the Centers for Disease Prevention and Control CDC at www.cdc.gov. Another strategy to get information is to "google" your topic e.g. White Plains, New York demographic and mortality data.
The communities may be counties, cities, states or any combination of the two: eg. Westchester and Rockland, White Plains and Yonkers, Overall Westchester and White Plains etc., Bronx and NYC, Brooklyn and Queens, Brooklyn and Statewide or Citywide, New York State and North Carolina etc. HINT Before you finalize the choice of community make sure that you are able to locate material on it.
Please put the data in a table see above. Write a narrative -- a paragraph in length comparing the two areas. (I would suggest that online students prepare a paper copy for themselves). Be sure that your name appears on the report itself if you submit it as an attachment. Also, check that your data clearly indicates whether the number is a number, rate or percentage. If figure is a rate indicate the relevant population e.g. per 1,000, 10,000, per 100,000. See text for more information on rates.
You may attach map(s) and data table from NY State Health Dept. and the Census Bureau to your report. However, the table must report the data.
Grading-- A Complete report and comparison of two areas--Thoughtful comparison of the two areas. Sources of information ( for each item of information) clearly indicated. Provides a useful profile of socio-economic and health profile for areas selected.
B/B+ Good chart, good comparison. Sources of information clearly indicated.
C Comparison missing items, narrative comparison brief
D Assignment begun but not substantially completed
F Did not do assignment
Discussion Folder Open
Email your answer to me in the course email before 6 p.m on the due date.
Post your answer here after 6 p.m on the due date.
Article on Puerto Rican in US
See article. Has data from CDC National Center for Health Statistics
Health of Hispanic Adults: US 2010-2014
Centers for Disease Control and Prevention. CDC twenty four seven. Saving Lives, Protecting People
CDC A-Z Index
MENU
CDC A-Z
SEARCH
National Center for Health Statistics
Publications and Information Products
Data Briefs
Health of Hispanic Adults.
Cultural Snapshot Hispanics Latinos
The document discusses the Hispanic/Latino population in South Omaha and their cultural heritage, origins, and definitions. It notes that roughly one-fourth of US kindergarteners are Hispanic, and minorities will become the majority of children by 2023. The terms Hispanic and Latino refer to people with ancestry from Spanish-speaking countries but there is no single definition and identity varies between individuals.
The HIspanic Influence in the USA
This document discusses a study examining the influence of Hispanic culture on American culture. Some key findings include:
- Three out of four Americans agree that Hispanics have had a significant influence on American culture. This influence is seen across many spheres including food, music, sports, beauty, fashion, television and more.
- Food is seen as having the greatest influence on American culture by both Hispanics and non-Hispanics. Music is also seen as strongly influenced, especially in cities like New York, Miami, and McAllen, Texas.
- Hispanic culture is perceived to have influenced standards of beauty, style/appearance, and clothing for Hispanics, but to a lesser degree for non-
Mark Hugo Lopez - Pew Hispanic - Census 2010 - Reaching Latinos Online - Apri...
Presentation done by Mark Hugo Lopez of Pew Hispanic at the Reaching Latinos Online Meetup organized by Bixal on April 27, 2011.
More Related Content
What's hot
Sxsw hispanic 3.15.11
The document discusses trends from the 2010 US Census data regarding population growth among Hispanic and multi-cultural populations. Some key points:
- The Hispanic population grew much faster than total and non-Hispanic white populations between 2000-2010.
- Hispanic population growth significantly impacted states like Texas, California, Oregon, North Carolina and Alabama, with growth rates far exceeding projections.
- The document also discusses media usage trends, finding that while Hispanic households are less likely to own home computers/broadband, those with internet access spend as much/more time online and watching online video compared to non-Hispanics. Hispanics also more commonly own internet-enabled cell phones and spend more time watching video on phones
Journal of family planning perspectives www.lizettealvarez.com
Among 432 low-income Hispanic women surveyed at an obstetrics clinic in Los Angeles, respondents reported wanting an average of 2.8 sons but only 0.1 daughters. Being older than 30, having less than an eighth grade education, preferring to speak Spanish, having been born outside the US, and coming from a large family were associated with a stronger desire for sons. A multivariate analysis found that preference for Spanish and number of existing children were the strongest predictors of desiring more sons. The findings suggest that family planning programs should acknowledge cultural values like son preference rather than just providing contraceptive access and education.
Geo finalpresentation michellesuarez3
The document discusses Hispanic racial identity in the US according to the US Census. It notes that Hispanics were not counted until the 20th century but are now the fastest growing minority. The census may list Hispanic as a racial identifier in 2020. Hispanics share traits like immigration experience, language, and traditions from Latin America. However, race is a social construct and Hispanics trace their origins to Native Americans, Europeans, and African slaves brought to Latin America. The document examines the complex racial histories and classifications that influence how Hispanics identify racially in the US.
Hispanic Marketing
This document discusses marketing strategies for reaching Hispanic audiences in the United States. It notes that Hispanics originate from over 22 countries and concentrate in different areas, so a single message does not work for all. Hispanics are a growing demographic and influential in areas like popular culture, consumerism, and social media. Religion and festivals are also important to Hispanic culture. Successful marketing will feature influential Hispanic celebrities and leverage Spanish-language media and social media influencers like Latina mothers. The document advocates tailoring messaging to specific Hispanic ethnicities and settlement patterns.
Womens health issues journal www.lizettealvarez.com
1) The study examined factors related to contraceptive use among Latina women in Los Angeles, including cultural expectations, attitudes, and perceived barriers.
2) Surveys were administered to 291 Latina women ages 15-50 at four clinics, in English or Spanish, to assess contraceptive use practices and perceptions of various social and cultural influences.
3) Key factors examined included cultural norms about the value of motherhood, perceived reliability and side effects of contraceptives, embarrassment about obtaining or discussing contraceptives, and perceived barriers to use. Understanding these factors could provide insight into the high birth rate among Latinas in the United States.
According to the 2010 Census, the number of Hispanics in the US has increased.
The gap between the Census 2010 count and Census Bureau population estimates has been widest in states with relatively small Hispanic populations.
New Bostonians 2013-2014
This document provides a summary of demographic data on immigrants and foreign-born residents in Boston from 2013-2014. Some of the key findings include:
- 27.1% of Boston's population is foreign-born, higher than Massachusetts and the U.S.
- The top countries of origin for Boston's foreign-born residents are Dominican Republic, China, Haiti, Brazil, and Jamaica.
- Boston is becoming more racially and ethnically diverse, with non-Hispanic whites now making up less than half the population.
- Over 40% of Boston Public School students speak a language other than English at home.
- The neighborhoods with the highest percentage of foreign-born residents are East Boston
What's hot (7)
Journal of family planning perspectives www.lizettealvarez.com
Journal of family planning perspectives www.lizettealvarez.com
Womens health issues journal www.lizettealvarez.com
Womens health issues journal www.lizettealvarez.com
According to the 2010 Census, the number of Hispanics in the US has increased.
According to the 2010 Census, the number of Hispanics in the US has increased.
Similar to US Hispanic Population Stats - 2014
Health equity-latinos-nys-english
Hispanics/Latinos in New York State continue to experience health disparities and poorer health outcomes compared to non-Hispanic whites. They have higher rates of chronic conditions like diabetes, HIV, asthma, and teen pregnancy. They also have lower education levels, higher poverty rates, less health insurance coverage, and language barriers that influence their health. The document outlines these disparities and calls for action to address social determinants of health and improve access to culturally-responsive healthcare services to achieve health equity for Hispanics/Latinos in New York State.
Montenegro -indigenous_health
This document provides an overview of Indigenous health in Latin America and the Caribbean. It discusses the complex history and current situation of Indigenous peoples in the region, which is home to over 400 Indigenous groups totaling approximately 45-48 million people. While Indigenous populations and cultures were once much larger, European colonization dramatically reduced Indigenous populations and marginalized Indigenous communities. More recently, however, some Indigenous populations and political influence have increased. The document examines key topics like Indigenous health systems, changing political environments, and variations in defining and measuring Indigenous demographics.
Bureau of Prisons | Latino Movement in the US
I was invited to speak to the staff at the Tallahassee Federal Penitentiary on the current Latino movement in the United States.
Health and Health Care for Hispanics in the United States - Updated January 2018
Hispanics make up nearly 1 in 5 of the US population and are projected to account for 1 in 4 people by 2045. They face greater health challenges such as higher rates of obesity, diabetes, HIV diagnosis, and teen birth compared to whites. Hispanics also experience greater barriers to healthcare access, with higher rates of being uninsured, having no usual source of care, and not seeing a doctor or dentist in the last year. Additionally, Hispanics are more likely to face other social determinants of poorer health such as lower levels of education, food insecurity, and unsafe neighborhoods. While the uninsured rate for Hispanics declined under the Affordable Care Act, they are still more likely than whites to
Marketig services-hispanic-demographic-report-11-2012
This document discusses trends in the Hispanic consumer market in the United States. It finds that the Hispanic population, especially younger cohorts, is growing rapidly and influencing American culture. Hispanics now make up 16% of the US population and control 10% of discretionary spending. The markets seeing the largest growth in Hispanic populations are spread across the country. Hispanic consumers tend to be more optimistic about their financial future compared to non-Hispanics. While language preferences vary by generation, three-quarters of Hispanic adults prefer to speak at least some Spanish. Advertising in Spanish resonates even with many English-dominant Hispanics. Technology and retail websites visited by Spanish-speaking consumers reflect this demographic's influence.
How US Hispanics search - POV
This document discusses strategies for marketing to US Hispanics. It notes that US Hispanics are a diverse group originating from over 40 countries. While many speak English most of the time online, Spanglish may resonate more for certain product categories. The key is taking a culturally sensitive approach and understanding that language is less important than cultural relevance. Reaching US Hispanics can have global impact since they have family abroad. Marketers need to allocate over 8% of their budget to effectively reach the one-fifth of the US population that is Hispanic.
Edelman Multicultural Capabilities
The document provides statistics and information about Hispanics/Latinos and African Americans in the US. Some of the key points include:
- By 2050, multicultural communities will represent 54% of the US population. 40% of Millennials and 61% of Millennials are minorities/bilingual.
- Hispanics account for 17% of the US population and over half of Hispanic children are born in the US. Over half of online Hispanics are ages 18-29.
- African Americans account for 12.6% of the US population and over 30% of African Americans will be online in the next four years.
- The purchasing power of Hispanics is estimated at
TEN-STEP STUDY PLAN1. Statement of the problem and its significa.docx
TEN-STEP STUDY PLAN
1. Statement of the problem and its significance
2. Theoretical or conceptual framework
3. Research questions to be answered by the study
4. List of hypotheses to be tested
5. Definitions of key terms and variables
6. Description of the research design
7. Description of the sample and how it was obtained
8. Description of the planned statistical analysis
9. Statement of assumptions and limitations
10. Dissemination plan.
obesity pdf.pdf
NCHS Data Brief ■ No. 219 ■ November 2015
Prevalence of Obesity Among Adults and Youth:
United States, 2011–2014
Cynthia L. Ogden, Ph.D.; Margaret D. Carroll, M.S.P.H.; Cheryl D. Fryar, M.S.P.H.;
and Katherine M. Flegal, Ph.D.
Figure 1. Prevalence of obesity among adults aged 20 and over, by sex and age: United States,
2011–2014
P
er
ce
nt
0
10
20
30
40
50 60 and over40–5920–3920 and over
WomenMenAll
36.3
32.3
140.2
137.0
234.3
230.3
1,238.3
34.9
38.3
34.4
142.1
138.8
1Significantly different from those aged 20–39.
2
Key findings
Data from the National
Health and Nutrition
Examination Survey
● In 2011–2014, the
prevalence of obesity was just
over 36% in adults and 17% in
youth.
● The prevalence of obesity
was higher in women (38.3%)
than in men (34.3%). Among
all youth, no difference was
seen by sex.
● The prevalence of obesity
was higher among middle-aged
(40.2%) and older (37.0%)
adults than younger (32.3%)
adults.
● The prevalence of obesity
was higher among non-
Hispanic white, non-Hispanic
black, and Hispanic adults and
youth than among non-Hispanic
Asian adults and youth.
● From 1999 through 2014,
obesity prevalence increased
among adults and youth.
However, among youth,
prevalence did not change
from 2003–2004 through
2013–2014.
U.S. DEPA
Obesity is associated with health risks (1,2). Monitoring the prevalence
of obesity is relevant for public health programs that focus on reducing
or preventing obesity. No significant changes were seen in either adult or
childhood obesity prevalence in the United States between 2003–2004 and
2011–2012 (3). This report provides the most recent national data on obesity
prevalence by sex, age, and race and Hispanic origin, using data for 2011–
2014. Overall prevalence estimates from 1999–2000 through 2013–2014 are
also presented.
Keyword: National Health and Nutrition Examination Survey
What was the prevalence of obesity among adults in
2011–2014?
The prevalence of obesity was 36.5% (crude estimate) among U.S. adults
during 2011–2014. Overall, the prevalence of obesity among middle-aged
RTMENT OF HEALTH AND HUMAN SERVICES
Centers for Disease Control and Prevention
National Center for Health Statistics
Significantly different from women of the same age group.
NOTES: Totals were age-adjusted by the direct method to the 2000 U.S. census population using the age groups 20–39, 40–59,
and 60 and over. Crude estimates are 36.5% for all, 34.5% for men, and 38.5% for women.
SOURCE: CDC/NCHS, ...
2018 State of Hispanic Homeownership Report by NAHREP GREATER LAS VEGAS
The 2018 State of Hispanic Homeownership Report published by the National Association of Hispanic Real Estate Professionals analyzes Hispanic homeownership trends in the U.S. It finds that in 2018, Hispanics achieved the largest net gain in homeowners since 2005, raising the Hispanic homeownership rate to 47.1%. Hispanics have accounted for 62.7% of net homeownership gains over the past decade and are projected to drive over half of new homeowners in coming years. Factors contributing to these gains include high rates of household formation, labor force participation, and population and income growth among Hispanics.
Case Study: "Targeting the Hispanic Demo"
This document provides an overview of the growing Hispanic market in the United States and strategies for targeting Hispanic audiences. Some key points:
- The U.S. Hispanic population is over 52 million with a buying power of $1.7 trillion.
- Hispanics make up 47% of multicultural births in the U.S. and are increasingly shaping mainstream American culture.
- Successful strategies recognize the duality of Hispanic audiences and blend Spanish language with English language content, American culture with roots in Latin American countries.
- Programming should reflect Hispanic values like family and education as well as interests in music, sports and pop culture trends.
CALPACT Webinar: Putting Culture Into Context: Communicating with Diverse Lat...
CALPACT Webinar: Putting Culture Into Context: Communicating with Diverse Lat...Center for Public Health Practice & Leadership at UC Berkeley
Today's U.S. Latino population is growing, dynamic and evolving, reflecting a new American reality. Latino culture and family dynamics impact healthcare decisions and behaviors. Recognizing that Latinos are not a homogeneous group, experts from media, academic research and public health promotion will share insights, tips and tools in this timely webinar for closing the cultural communication gap with this diverse population.
After this session, participants will be able to:
- Identify diversity among Latino populations and take appropriate steps to build a communication ecology relative to that diversity
- List at least two healthcare myths about Latinos
- Describe the role that media, community and family influences play in healthcare decisions
- Describe how to reach Latinos more effectively through culturally relevant communication and outreach
Speakers:
Sonya Suarez-Hammond, Senior Director of Strategy & Insights/Healthcare at Univision Communications
Dr. Holley Wilkin, Professor and affiliated faculty of the department of Partnership for Urban Health Research at Georgia State University
Dr. Carmen Gonzalez, Postdoctoral Scholar at the Annenberg School for Communication and Journalism at the University of Southern California.
Moderator: Nancy Murphy, Executive Vice President, Metropolitan Group.
This presentation was from the fifth session in the CALPACT sponsored Health Communication Matters Webinar Series, which will help participants in all walks of public health to apply health literacy principles to their everyday communications.
Please visit here to listen to the audio recording of the webinar:
http://cc.readytalk.com/play?id=2peynd
Visit these links for the other resources related to this webinar:
Resources:
http://www.slideshare.net/SPHCalpact/putting-culture-into-context-resources
Health Literacy Undervalued by Public Health? A tool for public health professionals:
http://www.slideshare.net/SPHCalpact/calpact-training-health-literacy-undervalued-by-public-health-training-tool
Follow Us on Twitter: @CALPACT
Facebook: http://www.facebook.com/CALPACTUCB
Website: www.calpact.org
Questions?
Email sphcalpact@berkeley.edu Please go to the New York State Health Dept.httpswww.health.docx
Please go to the New York State Health Dept.
https://www.health.ny.gov/statistics/vital_statistics/2013/
Census Bureau
http://quickfacts.census.gov/qfd/states/36000.html
Before you start the specific assignment you may want to examine the information available.
Area I Area II Source of
Data
Population
Birth Rate per 1000
Mortality Rate per 100,000
Major Causes of Death
Top 3 in order
Level of Education
% high school grad
% college grad
% adv
Level of Income
Median household in $
Racial/Ethnic composition
Use data from New York State Health Dept. and the Census Bureau to compare two communities of your choice. You may also want to try the Centers for Disease Prevention and Control CDC at www.cdc.gov. Another strategy to get information is to "google" your topic e.g. White Plains, New York demographic and mortality data.
The communities may be counties, cities, states or any combination of the two: eg. Westchester and Rockland, White Plains and Yonkers, Overall Westchester and White Plains etc., Bronx and NYC, Brooklyn and Queens, Brooklyn and Statewide or Citywide, New York State and North Carolina etc. HINT Before you finalize the choice of community make sure that you are able to locate material on it.
Please put the data in a table see above. Write a narrative -- a paragraph in length comparing the two areas. (I would suggest that online students prepare a paper copy for themselves). Be sure that your name appears on the report itself if you submit it as an attachment. Also, check that your data clearly indicates whether the number is a number, rate or percentage. If figure is a rate indicate the relevant population e.g. per 1,000, 10,000, per 100,000. See text for more information on rates.
You may attach map(s) and data table from NY State Health Dept. and the Census Bureau to your report. However, the table must report the data.
Grading-- A Complete report and comparison of two areas--Thoughtful comparison of the two areas. Sources of information ( for each item of information) clearly indicated. Provides a useful profile of socio-economic and health profile for areas selected.
B/B+ Good chart, good comparison. Sources of information clearly indicated.
C Comparison missing items, narrative comparison brief
D Assignment begun but not substantially completed
F Did not do assignment
Discussion Folder Open
Email your answer to me in the course email before 6 p.m on the due date.
Post your answer here after 6 p.m on the due date.
Article on Puerto Rican in US
See article. Has data from CDC National Center for Health Statistics
Health of Hispanic Adults: US 2010-2014
Centers for Disease Control and Prevention. CDC twenty four seven. Saving Lives, Protecting People
CDC A-Z Index
MENU
CDC A-Z
SEARCH
National Center for Health Statistics
Publications and Information Products
Data Briefs
Health of Hispanic Adults.
Cultural Snapshot Hispanics Latinos
The document discusses the Hispanic/Latino population in South Omaha and their cultural heritage, origins, and definitions. It notes that roughly one-fourth of US kindergarteners are Hispanic, and minorities will become the majority of children by 2023. The terms Hispanic and Latino refer to people with ancestry from Spanish-speaking countries but there is no single definition and identity varies between individuals.
The HIspanic Influence in the USA
This document discusses a study examining the influence of Hispanic culture on American culture. Some key findings include:
- Three out of four Americans agree that Hispanics have had a significant influence on American culture. This influence is seen across many spheres including food, music, sports, beauty, fashion, television and more.
- Food is seen as having the greatest influence on American culture by both Hispanics and non-Hispanics. Music is also seen as strongly influenced, especially in cities like New York, Miami, and McAllen, Texas.
- Hispanic culture is perceived to have influenced standards of beauty, style/appearance, and clothing for Hispanics, but to a lesser degree for non-
Mark Hugo Lopez - Pew Hispanic - Census 2010 - Reaching Latinos Online - Apri...
Presentation done by Mark Hugo Lopez of Pew Hispanic at the Reaching Latinos Online Meetup organized by Bixal on April 27, 2011.
Immigration&SubstanceAbuseFinalProject
This document summarizes a student research project on substance abuse and immigration. The study examines how factors like length of stay in the US, gender, and documentation status may impact substance abuse rates among recently immigrated Hispanic individuals from Central America. Survey results showed that substance abuse was higher in the first 2 years after immigration but then declined between years 3-4, rising again after 5 years. Men reported higher rates of substance abuse than women. Those in the process of gaining documentation had lower rates than those who were undocumented or documented. The study had limitations like only examining immigrants who successfully made the journey to the US.
Creció el número de hispanos en EE.UU. Según el censo 2010
La brecha entre la cuenta del censo 2010 y las estimaciones de población de la Oficina de censo, ha sido mayor en los estados con población hispana relativamente pequeña.
The Spanish Speaking population in the United States
This document provides information about the Spanish speaking population in the United States. It notes that 37.6 million people over 5 years old speak Spanish at home, with 34.8 million being Hispanic and 2.8 million being non-Hispanic. Of the non-Hispanic Spanish speakers, 59% trace their ancestry to non-Spanish European countries and 12% say they are of African American descent. The racial composition of non-Hispanic Spanish speakers mirrors that of the overall non-Hispanic US population, with 77% being white, 14% black, and 9% other races.
Hispanic fans
This study analyzed the use of Spanish language on the websites of major North American professional sports leagues and teams. The following key points were found:
1) MLB and MLS incorporated Spanish the most into their league and team websites, with around 10-30% of pages in Spanish. Other leagues had little to no Spanish content.
2) There was variability across individual team websites, particularly those in markets with large Hispanic populations. MLB teams were most likely to have fully Spanish language pages, toggle features, and Spanish sales pages.
3) Teams in markets with the largest Hispanic populations, like Los Angeles and Miami, provided around 10% of pages in Spanish on average. MLS and MLB teams in these markets offered the
Hispanics and Language, Acculturation, Retro-Aculturion and Language
The document discusses trends in the Spanish-speaking Latino population in the United States. It notes that the number of Latinos in the US who speak Spanish is growing and expected to reach 40-45 million by 2020. While some Latinos are becoming English dominant by the third generation, Spanish language retention remains strong, especially among younger generations who see their Latino identity and Spanish language as closely linked. The growing Latino population and emphasis on bilingualism and Latino culture suggests the prominence of Spanish and relevance of Spanish-language media will continue increasing in the United States.
Similar to US Hispanic Population Stats - 2014 (20)
Health and Health Care for Hispanics in the United States - Updated January 2018
Health and Health Care for Hispanics in the United States - Updated January 2018
Marketig services-hispanic-demographic-report-11-2012
Marketig services-hispanic-demographic-report-11-2012
TEN-STEP STUDY PLAN1. Statement of the problem and its significa.docx
TEN-STEP STUDY PLAN1. Statement of the problem and its significa.docx
2018 State of Hispanic Homeownership Report by NAHREP GREATER LAS VEGAS
2018 State of Hispanic Homeownership Report by NAHREP GREATER LAS VEGAS
CALPACT Webinar: Putting Culture Into Context: Communicating with Diverse Lat...
CALPACT Webinar: Putting Culture Into Context: Communicating with Diverse Lat...
Please go to the New York State Health Dept.httpswww.health.docx
Please go to the New York State Health Dept.httpswww.health.docx
Mark Hugo Lopez - Pew Hispanic - Census 2010 - Reaching Latinos Online - Apri...
Mark Hugo Lopez - Pew Hispanic - Census 2010 - Reaching Latinos Online - Apri...
Creció el número de hispanos en EE.UU. Según el censo 2010
Creció el número de hispanos en EE.UU. Según el censo 2010
The Spanish Speaking population in the United States
The Spanish Speaking population in the United States
Hispanics and Language, Acculturation, Retro-Aculturion and Language
Hispanics and Language, Acculturation, Retro-Aculturion and Language
More from Alfredo Cisneros
Advertisers Mediakit - Alcancemg 2014
Alcance Media Group is a digital media company that targets the US Hispanic and Latin American markets. It provides advertisers with display, mobile, video, and tablet advertising networks to reach Hispanic audiences cost effectively. Alcance Media Group's networks include over 700 domestic and international publishers and offer advanced targeting capabilities by geography, language, demographics and content channels. Reporting and integration with third party technologies allow for flexible campaign set up and performance tracking.
Website designed and developed for Adtango Media - Digital marketing company,...
- Website Design and customization.
- Developed using Joomla! CMS.
CFH Cuba - Annual Report - 2005
El documento resume el informe anual de 2005 de Corporación Financiera Habana (CFH). CFH experimentó un crecimiento significativo en 2005, con un aumento del 30% en su balance general y del 32% en su cartera de inversiones. La rentabilidad y los resultados también mejoraron, con un beneficio bruto cercano a los 4 millones de dólares, un 32% más que en 2004. A pesar del crecimiento, la cartera mantuvo una morosidad del 0%, gracias a una estricta política de crédito y diversificación del riesgo.
CFH Cuba - Annual Report - 2004
El informe resume los resultados positivos de Corporación Financiera Habana (CFH) en 2004. CFH experimentó un crecimiento en su cartera de 1.41% y balance de 2.83% respecto al año anterior. Obtuvo una utilidad antes de impuestos de 3 millones de dólares, un 10.46% más que en 2003. La morosidad se mantuvo en 0.00%. CFH continuará enfocándose en satisfacer las necesidades financieras de sus clientes y ofrecer productos innovadores.
CFH Cuba - Annual Report - 2003
Este documento presenta el informe anual de 2003 de Corporación Financiera Habana (CFH). Resume que CFH tuvo un crecimiento del 20% en operaciones y captó un 25% más de nuevos clientes. Los resultados financieros también mejoraron, con una utilidad neta de 1,74 millones de dólares, un incremento del 8,94% con respecto al año anterior. El informe concluye que CFH continúa consolidando su posición en el mercado financiero cubano a través de un sólido crecimiento y diversificación.
CFH Cuba - Annual Report - 2002
El documento resume el cuarto año de actividad de Corporación Financiera Habana (CFH), la primera entidad financiera mixta creada en Cuba. A pesar de las dificultades económicas, CFH ha seguido creciendo de forma rentable, con un balance 8.9% mayor y un beneficio antes de impuestos un 17.8% más alto que el año anterior. CFH ha captado nuevos clientes en nuevos sectores y ha ampliado sus productos financieros, manteniendo una tasa de morosidad del 0%.
CFH Cuba - Annual Report - 2001
El documento resume el informe anual de 2001 de la Corporación Financiera Habana (CFH). En su tercer año de operaciones, CFH experimentó un crecimiento de los ingresos del 28,95% y una utilidad neta de 1.090.216,62 dólares. CFH ha mantenido una cartera de créditos sólida con una tasa de morosidad de 0% y ha ampliado su cartera de clientes en un 40%. El informe atribuye el éxito continuo de CFH a la confianza de los clientes y el esfuerzo
CFH Cuba - Annual Report - 2000
El resumen del documento es el siguiente:
1) Corporación Financiera Habana (CFH) alcanzó sus objetivos para el año 2000, incluyendo invertir el 100% de sus recursos disponibles y mantener un índice de morosidad por debajo del 2%.
2) La cartera de inversiones de CFH aumentó a $32.7 millones, duplicando el monto concedido en préstamos el año anterior.
3) CFH obtuvo utilidades antes de impuestos de $1.6 millones, superando sus metas financieras para el
CFH Cuba - Annual Report - 1999
The first Annual Report designed for CFH Corporación Financiera Habana.
Software used: Adobe Photoshop, QuarkXpress
Alcance Media Group - Media Kit - 2011
Media Kit designed for Alcance Media Group, Digital marketing company focused on the Hispanic market in the U.S.,
Internationally and cross border advertising solutions for Latin American marketers.
Adtango Media Kit
Media Kit designed for @AdTangoMedia with Adobe Illustrator CC. The content of this material is about the Hispanic advertising network dedicated to bringing Hispanics and advertisers together through digital media.
Publisher Media Kit - Alcance Media Group - 2015
This document is a media kit from Alcance Media Group that outlines their digital marketing services for connecting brands with U.S. Hispanic and Latin American audiences. It provides examples of display, mobile, and video ad formats. Alcance Media Group works with over 720 trusted digital publishers and offers advanced targeting options, fast payment, and bilingual support to advertisers. They highlight statistics on the size and purchasing power of U.S. Hispanic and Latin American audiences.
Alcance Media Group - Capabilities - 2013
AlcanceMG Adnetwork: The nitty gritty - Capabilities published in 2013 by the Company on its website.
Misunderstanding Hispanics
Hispanic or Latino? Humorous infographic, playing with facts and statistics to be identified as Hispanic or Latino.
Mobile latino - 2014
This document summarizes statistics about Hispanic internet usage in the United States. It finds that 73% of Hispanic internet users access the internet on mobile devices, compared to 60% of white users and only 32% are English dominant while 47% are bilingual. It also shows that 59% of Latinos ages 18-29 from households earning over $50,000 own smartphones, while only 49% of rural Latinos own smartphones, and over 75% of Latino smartphone owners have some college education or more.
Marketing to Hispanics with Social Media.
Why market to Hispanics? Why use Social Media? Which Forums? This info-graphic shows 4 great reasons.
iab - nuevos formatos display
El documento describe nuevos formatos de anuncios publicitarios como Billboard, Filmstrip, Pushdown, Sidekick y Slider. Estos formatos aprovechan las capacidades tecnológicas actuales para proporcionar experiencias ricas de marca que permiten una mayor interacción del usuario y tiempo de visualización en comparación con los formatos tradicionales. Los anunciantes pueden usar estos nuevos formatos para mejorar el alcance y el compromiso con los consumidores.
Infographic concepts - Portada's magazine - full page ad
Graphic concepts, proposals for an info-graphic.
Conceptos gráficos, propuestas para una infografía.
Ana 2014 multicultural marketing - Graphic Design - flyer
Flyer designed for the ANA Multicultural Marketing & Diversity Conference event, Jan. 2014.
2013 AlcanceMG - Digital Latin America
Info graphic - designed for Alcance Media Group. Topic: Digital Latin America: Internet penetration - Onesheet Latin Forum 2013.
More from Alfredo Cisneros (20)
Website designed and developed for Adtango Media - Digital marketing company,...
Website designed and developed for Adtango Media - Digital marketing company,...
Infographic concepts - Portada's magazine - full page ad
Infographic concepts - Portada's magazine - full page ad
Ana 2014 multicultural marketing - Graphic Design - flyer
Ana 2014 multicultural marketing - Graphic Design - flyer
Recently uploaded
一比一原版(UO毕业证)渥太华大学毕业证如何办理
UO毕业证录取书【微信95270640】购买(渥太华大学毕业证成绩单硕士学历)Q微信95270640代办UO学历认证留信网伪造渥太华大学学位证书精仿渥太华大学本科/硕士文凭证书补办渥太华大学 diplomaoffer,Transcript购买渥太华大学毕业证成绩单购买UO假毕业证学位证书购买伪造渥太华大学文凭证书学位证书,专业办理雅思、托福成绩单,学生ID卡,在读证明,海外各大学offer录取通知书,毕业证书,成绩单,文凭等材料:1:1完美还原毕业证、offer录取通知书、学生卡等各种在读或毕业材料的防伪工艺(包括 烫金、烫银、钢印、底纹、凹凸版、水印、防伪光标、热敏防伪、文字图案浮雕,激光镭射,紫外荧光,温感光标)学校原版上有的工艺我们一样不会少,不论是老版本还是最新版本,都能保证最高程度还原,力争完美以求让所有同学都能享受到完美的品质服务。
文凭办理流程:
1客户提供办理信息:姓名生日专业学位毕业时间等(如信息不确定可以咨询顾问:微信95270640我们有专业老师帮你查询);
2开始安排制作毕业证成绩单电子图;
3毕业证成绩单电子版做好以后发送给您确认;
4毕业证成绩单电子版您确认信息无误之后安排制作成品;
5成品做好拍照或者视频给您确认;
6快递给客户(国内顺丰国外DHLUPS等快读邮寄)。
7完成交易删除客户资料
高精端提供以下服务:
一:渥太华大学渥太华大学毕业证文凭证书全套材料从防伪到印刷水印底纹到钢印烫金
二:真实使馆认证(留学人员回国证明)使馆存档
三:真实教育部认证教育部存档教育部留服网站可查
四:留信认证留学生信息网站可查
五:与学校颁发的相关证件1:1纸质尺寸制定(定期向各大院校毕业生购买最新版本毕,业证成绩单保证您拿到的是鲁昂大学内部最新版本毕业证成绩单微信95270640)
A.为什么留学生需要操作留信认证?
留信认证全称全国留学生信息服务网认证,隶属于北京中科院。①留信认证门槛条件更低,费用更美丽,并且包过,完单周期短,效率高②留信认证虽然不能去国企,但是一般的公司都没有问题,因为国内很多公司连基本的留学生学历认证都不了解。这对于留学生来说,这就比自己光拿一个证书更有说服力,因为留学学历可以在留信网站上进行查询!
B.为什么我们提供的毕业证成绩单具有使用价值?
查询留服认证是国内鉴别留学生海外学历的唯一途径但认证只是个体行为不是所有留学生都操作所以没有办理认证的留学生的学历在国内也是查询不到的他们也仅仅只有一张文凭。所以这时候我们提供的和学校颁发的一模一样的毕业证成绩单就有了使用价值。只硕大的蛇皮袋手里拎着长铁钩正站在门口朝黑色的屋内张望不好坏人小偷山娃一怔却也灵机一动立马仰起头双手拢在嘴边朝楼上大喊:“爸爸爸——有人找——那人一听朝山娃尴尬地笑笑悻悻地走了山娃立马“嘭的一声将铁门锁死心却咚咚地乱跳当山娃跟父亲说起这事时父亲很吃惊抚摸着山娃的头说还好醒得及时要不家早被人掏空了到时连电视也没得看啰不过父亲还是夸山娃能临危不乱随机应变有胆有谋山娃笑笑说那都是书上学的看童话和小说时多
Population Growth in Bataan: The effects of population growth around rural pl...
A population analysis specific to Bataan.
End-to-end pipeline agility - Berlin Buzzwords 2024
We describe how we achieve high change agility in data engineering by eliminating the fear of breaking downstream data pipelines through end-to-end pipeline testing, and by using schema metaprogramming to safely eliminate boilerplate involved in changes that affect whole pipelines.
A quick poll on agility in changing pipelines from end to end indicated a huge span in capabilities. For the question "How long time does it take for all downstream pipelines to be adapted to an upstream change," the median response was 6 months, but some respondents could do it in less than a day. When quantitative data engineering differences between the best and worst are measured, the span is often 100x-1000x, sometimes even more.
A long time ago, we suffered at Spotify from fear of changing pipelines due to not knowing what the impact might be downstream. We made plans for a technical solution to test pipelines end-to-end to mitigate that fear, but the effort failed for cultural reasons. We eventually solved this challenge, but in a different context. In this presentation we will describe how we test full pipelines effectively by manipulating workflow orchestration, which enables us to make changes in pipelines without fear of breaking downstream.
Making schema changes that affect many jobs also involves a lot of toil and boilerplate. Using schema-on-read mitigates some of it, but has drawbacks since it makes it more difficult to detect errors early. We will describe how we have rejected this tradeoff by applying schema metaprogramming, eliminating boilerplate but keeping the protection of static typing, thereby further improving agility to quickly modify data pipelines without fear.
一比一原版兰加拉学院毕业证(Langara毕业证书)学历如何办理
原版办【微信号:BYZS866】【兰加拉学院毕业证(Langara毕业证书)】【微信号:BYZS866】《成绩单、外壳、雅思、offer、真实留信官方学历认证(永久存档/真实可查)》采用学校原版纸张、特殊工艺完全按照原版一比一制作(包括:隐形水印,阴影底纹,钢印LOGO烫金烫银,LOGO烫金烫银复合重叠,文字图案浮雕,激光镭射,紫外荧光,温感,复印防伪)行业标杆!精益求精,诚心合作,真诚制作!多年品质 ,按需精细制作,24小时接单,全套进口原装设备,十五年致力于帮助留学生解决难题,业务范围有加拿大、英国、澳洲、韩国、美国、新加坡,新西兰等学历材料,包您满意。
【我们承诺采用的是学校原版纸张(纸质、底色、纹路)我们拥有全套进口原装设备,特殊工艺都是采用不同机器制作,仿真度基本可以达到100%,所有工艺效果都可提前给客户展示,不满意可以根据客户要求进行调整,直到满意为止!】
【业务选择办理准则】
一、工作未确定,回国需先给父母、亲戚朋友看下文凭的情况,办理一份就读学校的毕业证【微信号BYZS866】文凭即可
二、回国进私企、外企、自己做生意的情况,这些单位是不查询毕业证真伪的,而且国内没有渠道去查询国外文凭的真假,也不需要提供真实教育部认证。鉴于此,办理一份毕业证【微信号BYZS866】即可
三、进国企,银行,事业单位,考公务员等等,这些单位是必需要提供真实教育部认证的,办理教育部认证所需资料众多且烦琐,所有材料您都必须提供原件,我们凭借丰富的经验,快捷的绿色通道帮您快速整合材料,让您少走弯路。
留信网认证的作用:
1:该专业认证可证明留学生真实身份
2:同时对留学生所学专业登记给予评定
3:国家专业人才认证中心颁发入库证书
4:这个认证书并且可以归档倒地方
5:凡事获得留信网入网的信息将会逐步更新到个人身份内,将在公安局网内查询个人身份证信息后,同步读取人才网入库信息
6:个人职称评审加20分
7:个人信誉贷款加10分
8:在国家人才网主办的国家网络招聘大会中纳入资料,供国家高端企业选择人才
留信网服务项目:
1、留学生专业人才库服务(留信分析)
2、国(境)学习人员提供就业推荐信服务
3、留学人员区块链存储服务
【关于价格问题(保证一手价格)】
我们所定的价格是非常合理的,而且我们现在做得单子大多数都是代理和回头客户介绍的所以一般现在有新的单子 我给客户的都是第一手的代理价格,因为我想坦诚对待大家 不想跟大家在价格方面浪费时间
对于老客户或者被老客户介绍过来的朋友,我们都会适当给一些优惠。
选择实体注册公司办理,更放心,更安全!我们的承诺:客户在留信官方认证查询网站查询到认证通过结果后付款,不成功不收费!
Intelligence supported media monitoring in veterinary medicine
Media monitoring in veterinary medicien
"Financial Odyssey: Navigating Past Performance Through Diverse Analytical Lens"
Embark on a captivating financial journey with 'Financial Odyssey,' our hackathon project. Delve deep into the past performance of two companies as we employ an array of financial statement analysis techniques. From ratio analysis to trend analysis, uncover insights crucial for informed decision-making in the dynamic world of finance."
Learn SQL from basic queries to Advance queries
Dive into the world of data analysis with our comprehensive guide on mastering SQL! This presentation offers a practical approach to learning SQL, focusing on real-world applications and hands-on practice. Whether you're a beginner or looking to sharpen your skills, this guide provides the tools you need to extract, analyze, and interpret data effectively.
Key Highlights:
Foundations of SQL: Understand the basics of SQL, including data retrieval, filtering, and aggregation.
Advanced Queries: Learn to craft complex queries to uncover deep insights from your data.
Data Trends and Patterns: Discover how to identify and interpret trends and patterns in your datasets.
Practical Examples: Follow step-by-step examples to apply SQL techniques in real-world scenarios.
Actionable Insights: Gain the skills to derive actionable insights that drive informed decision-making.
Join us on this journey to enhance your data analysis capabilities and unlock the full potential of SQL. Perfect for data enthusiasts, analysts, and anyone eager to harness the power of data!
#DataAnalysis #SQL #LearningSQL #DataInsights #DataScience #Analytics
一比一原版(UCSB文凭证书)圣芭芭拉分校毕业证如何办理
毕业原版【微信:176555708】【(UCSB毕业证书)圣芭芭拉分校毕业证】【微信:176555708】成绩单、外壳、offer、留信学历认证(永久存档真实可查)采用学校原版纸张、特殊工艺完全按照原版一比一制作(包括:隐形水印,阴影底纹,钢印LOGO烫金烫银,LOGO烫金烫银复合重叠,文字图案浮雕,激光镭射,紫外荧光,温感,复印防伪)行业标杆!精益求精,诚心合作,真诚制作!多年品质 ,按需精细制作,24小时接单,全套进口原装设备,十五年致力于帮助留学生解决难题,业务范围有加拿大、英国、澳洲、韩国、美国、新加坡,新西兰等学历材料,包您满意。
【我们承诺采用的是学校原版纸张(纸质、底色、纹路),我们拥有全套进口原装设备,特殊工艺都是采用不同机器制作,仿真度基本可以达到100%,所有工艺效果都可提前给客户展示,不满意可以根据客户要求进行调整,直到满意为止!】
【业务选择办理准则】
一、工作未确定,回国需先给父母、亲戚朋友看下文凭的情况,办理一份就读学校的毕业证【微信176555708】文凭即可
二、回国进私企、外企、自己做生意的情况,这些单位是不查询毕业证真伪的,而且国内没有渠道去查询国外文凭的真假,也不需要提供真实教育部认证。鉴于此,办理一份毕业证【微信176555708】即可
三、进国企,银行,事业单位,考公务员等等,这些单位是必需要提供真实教育部认证的,办理教育部认证所需资料众多且烦琐,所有材料您都必须提供原件,我们凭借丰富的经验,快捷的绿色通道帮您快速整合材料,让您少走弯路。
留信网认证的作用:
1:该专业认证可证明留学生真实身份
2:同时对留学生所学专业登记给予评定
3:国家专业人才认证中心颁发入库证书
4:这个认证书并且可以归档倒地方
5:凡事获得留信网入网的信息将会逐步更新到个人身份内,将在公安局网内查询个人身份证信息后,同步读取人才网入库信息
6:个人职称评审加20分
7:个人信誉贷款加10分
8:在国家人才网主办的国家网络招聘大会中纳入资料,供国家高端企业选择人才
留信网服务项目:
1、留学生专业人才库服务(留信分析)
2、国(境)学习人员提供就业推荐信服务
3、留学人员区块链存储服务
→ 【关于价格问题(保证一手价格)】
我们所定的价格是非常合理的,而且我们现在做得单子大多数都是代理和回头客户介绍的所以一般现在有新的单子 我给客户的都是第一手的代理价格,因为我想坦诚对待大家 不想跟大家在价格方面浪费时间
对于老客户或者被老客户介绍过来的朋友,我们都会适当给一些优惠。
选择实体注册公司办理,更放心,更安全!我们的承诺:客户在留信官方认证查询网站查询到认证通过结果后付款,不成功不收费!
原版一比一弗林德斯大学毕业证(Flinders毕业证书)如何办理
原版制作【微信:41543339】【弗林德斯大学毕业证(Flinders毕业证书)】【微信:41543339】《成绩单、外壳、雅思、offer、真实留信官方学历认证(永久存档/真实可查)》采用学校原版纸张、特殊工艺完全按照原版一比一制作(包括:隐形水印,阴影底纹,钢印LOGO烫金烫银,LOGO烫金烫银复合重叠,文字图案浮雕,激光镭射,紫外荧光,温感,复印防伪)行业标杆!精益求精,诚心合作,真诚制作!多年品质 ,按需精细制作,24小时接单,全套进口原装设备,十五年致力于帮助留学生解决难题,业务范围有加拿大、英国、澳洲、韩国、美国、新加坡,新西兰等学历材料,包您满意。
【我们承诺采用的是学校原版纸张(纸质、底色、纹路)我们拥有全套进口原装设备,特殊工艺都是采用不同机器制作,仿真度基本可以达到100%,所有工艺效果都可提前给客户展示,不满意可以根据客户要求进行调整,直到满意为止!】
【业务选择办理准则】
一、工作未确定,回国需先给父母、亲戚朋友看下文凭的情况,办理一份就读学校的毕业证【微信41543339】文凭即可
二、回国进私企、外企、自己做生意的情况,这些单位是不查询毕业证真伪的,而且国内没有渠道去查询国外文凭的真假,也不需要提供真实教育部认证。鉴于此,办理一份毕业证【微信41543339】即可
三、进国企,银行,事业单位,考公务员等等,这些单位是必需要提供真实教育部认证的,办理教育部认证所需资料众多且烦琐,所有材料您都必须提供原件,我们凭借丰富的经验,快捷的绿色通道帮您快速整合材料,让您少走弯路。
留信网认证的作用:
1:该专业认证可证明留学生真实身份
2:同时对留学生所学专业登记给予评定
3:国家专业人才认证中心颁发入库证书
4:这个认证书并且可以归档倒地方
5:凡事获得留信网入网的信息将会逐步更新到个人身份内,将在公安局网内查询个人身份证信息后,同步读取人才网入库信息
6:个人职称评审加20分
7:个人信誉贷款加10分
8:在国家人才网主办的国家网络招聘大会中纳入资料,供国家高端企业选择人才
留信网服务项目:
1、留学生专业人才库服务(留信分析)
2、国(境)学习人员提供就业推荐信服务
3、留学人员区块链存储服务
【关于价格问题(保证一手价格)】
我们所定的价格是非常合理的,而且我们现在做得单子大多数都是代理和回头客户介绍的所以一般现在有新的单子 我给客户的都是第一手的代理价格,因为我想坦诚对待大家 不想跟大家在价格方面浪费时间
对于老客户或者被老客户介绍过来的朋友,我们都会适当给一些优惠。
选择实体注册公司办理,更放心,更安全!我们的承诺:客户在留信官方认证查询网站查询到认证通过结果后付款,不成功不收费!
Orchestrating the Future: Navigating Today's Data Workflow Challenges with Ai...
Navigating today's data landscape isn't just about managing workflows; it's about strategically propelling your business forward. Apache Airflow has stood out as the benchmark in this arena, driving data orchestration forward since its early days. As we dive into the complexities of our current data-rich environment, where the sheer volume of information and its timely, accurate processing are crucial for AI and ML applications, the role of Airflow has never been more critical.
In my journey as the Senior Engineering Director and a pivotal member of Apache Airflow's Project Management Committee (PMC), I've witnessed Airflow transform data handling, making agility and insight the norm in an ever-evolving digital space. At Astronomer, our collaboration with leading AI & ML teams worldwide has not only tested but also proven Airflow's mettle in delivering data reliably and efficiently—data that now powers not just insights but core business functions.
This session is a deep dive into the essence of Airflow's success. We'll trace its evolution from a budding project to the backbone of data orchestration it is today, constantly adapting to meet the next wave of data challenges, including those brought on by Generative AI. It's this forward-thinking adaptability that keeps Airflow at the forefront of innovation, ready for whatever comes next.
The ever-growing demands of AI and ML applications have ushered in an era where sophisticated data management isn't a luxury—it's a necessity. Airflow's innate flexibility and scalability are what makes it indispensable in managing the intricate workflows of today, especially those involving Large Language Models (LLMs).
This talk isn't just a rundown of Airflow's features; it's about harnessing these capabilities to turn your data workflows into a strategic asset. Together, we'll explore how Airflow remains at the cutting edge of data orchestration, ensuring your organization is not just keeping pace but setting the pace in a data-driven future.
Session in https://budapestdata.hu/2024/04/kaxil-naik-astronomer-io/ | https://dataml24.sessionize.com/session/667627
一比一原版(UMN文凭证书)明尼苏达大学毕业证如何办理
毕业原版【微信:176555708】【(UMN毕业证书)明尼苏达大学毕业证】【微信:176555708】成绩单、外壳、offer、留信学历认证(永久存档真实可查)采用学校原版纸张、特殊工艺完全按照原版一比一制作(包括:隐形水印,阴影底纹,钢印LOGO烫金烫银,LOGO烫金烫银复合重叠,文字图案浮雕,激光镭射,紫外荧光,温感,复印防伪)行业标杆!精益求精,诚心合作,真诚制作!多年品质 ,按需精细制作,24小时接单,全套进口原装设备,十五年致力于帮助留学生解决难题,业务范围有加拿大、英国、澳洲、韩国、美国、新加坡,新西兰等学历材料,包您满意。
【我们承诺采用的是学校原版纸张(纸质、底色、纹路),我们拥有全套进口原装设备,特殊工艺都是采用不同机器制作,仿真度基本可以达到100%,所有工艺效果都可提前给客户展示,不满意可以根据客户要求进行调整,直到满意为止!】
【业务选择办理准则】
一、工作未确定,回国需先给父母、亲戚朋友看下文凭的情况,办理一份就读学校的毕业证【微信176555708】文凭即可
二、回国进私企、外企、自己做生意的情况,这些单位是不查询毕业证真伪的,而且国内没有渠道去查询国外文凭的真假,也不需要提供真实教育部认证。鉴于此,办理一份毕业证【微信176555708】即可
三、进国企,银行,事业单位,考公务员等等,这些单位是必需要提供真实教育部认证的,办理教育部认证所需资料众多且烦琐,所有材料您都必须提供原件,我们凭借丰富的经验,快捷的绿色通道帮您快速整合材料,让您少走弯路。
留信网认证的作用:
1:该专业认证可证明留学生真实身份
2:同时对留学生所学专业登记给予评定
3:国家专业人才认证中心颁发入库证书
4:这个认证书并且可以归档倒地方
5:凡事获得留信网入网的信息将会逐步更新到个人身份内,将在公安局网内查询个人身份证信息后,同步读取人才网入库信息
6:个人职称评审加20分
7:个人信誉贷款加10分
8:在国家人才网主办的国家网络招聘大会中纳入资料,供国家高端企业选择人才
留信网服务项目:
1、留学生专业人才库服务(留信分析)
2、国(境)学习人员提供就业推荐信服务
3、留学人员区块链存储服务
→ 【关于价格问题(保证一手价格)】
我们所定的价格是非常合理的,而且我们现在做得单子大多数都是代理和回头客户介绍的所以一般现在有新的单子 我给客户的都是第一手的代理价格,因为我想坦诚对待大家 不想跟大家在价格方面浪费时间
对于老客户或者被老客户介绍过来的朋友,我们都会适当给一些优惠。
选择实体注册公司办理,更放心,更安全!我们的承诺:客户在留信官方认证查询网站查询到认证通过结果后付款,不成功不收费!
在线办理(英国UCA毕业证书)创意艺术大学毕业证在读证明一模一样
学校原件一模一样【微信:741003700 】《(英国UCA毕业证书)创意艺术大学毕业证》【微信:741003700 】学位证,留信认证(真实可查,永久存档)原件一模一样纸张工艺/offer、雅思、外壳等材料/诚信可靠,可直接看成品样本,帮您解决无法毕业带来的各种难题!外壳,原版制作,诚信可靠,可直接看成品样本。行业标杆!精益求精,诚心合作,真诚制作!多年品质 ,按需精细制作,24小时接单,全套进口原装设备。十五年致力于帮助留学生解决难题,包您满意。
本公司拥有海外各大学样板无数,能完美还原。
1:1完美还原海外各大学毕业材料上的工艺:水印,阴影底纹,钢印LOGO烫金烫银,LOGO烫金烫银复合重叠。文字图案浮雕、激光镭射、紫外荧光、温感、复印防伪等防伪工艺。材料咨询办理、认证咨询办理请加学历顾问Q/微741003700
【主营项目】
一.毕业证【q微741003700】成绩单、使馆认证、教育部认证、雅思托福成绩单、学生卡等!
二.真实使馆公证(即留学回国人员证明,不成功不收费)
三.真实教育部学历学位认证(教育部存档!教育部留服网站永久可查)
四.办理各国各大学文凭(一对一专业服务,可全程监控跟踪进度)
如果您处于以下几种情况:
◇在校期间,因各种原因未能顺利毕业……拿不到官方毕业证【q/微741003700】
◇面对父母的压力,希望尽快拿到;
◇不清楚认证流程以及材料该如何准备;
◇回国时间很长,忘记办理;
◇回国马上就要找工作,办给用人单位看;
◇企事业单位必须要求办理的
◇需要报考公务员、购买免税车、落转户口
◇申请留学生创业基金
留信网认证的作用:
1:该专业认证可证明留学生真实身份
2:同时对留学生所学专业登记给予评定
3:国家专业人才认证中心颁发入库证书
4:这个认证书并且可以归档倒地方
5:凡事获得留信网入网的信息将会逐步更新到个人身份内,将在公安局网内查询个人身份证信息后,同步读取人才网入库信息
6:个人职称评审加20分
7:个人信誉贷款加10分
8:在国家人才网主办的国家网络招聘大会中纳入资料,供国家高端企业选择人才
DSSML24_tspann_CodelessGenerativeAIPipelines
Codeless Generative AI Pipelines
(GenAI with Milvus)
https://ml.dssconf.pl/user.html#!/lecture/DSSML24-041a/rate
Discover the potential of real-time streaming in the context of GenAI as we delve into the intricacies of Apache NiFi and its capabilities. Learn how this tool can significantly simplify the data engineering workflow for GenAI applications, allowing you to focus on the creative aspects rather than the technical complexities. I will guide you through practical examples and use cases, showing the impact of automation on prompt building. From data ingestion to transformation and delivery, witness how Apache NiFi streamlines the entire pipeline, ensuring a smooth and hassle-free experience.
Timothy Spann
https://www.youtube.com/@FLaNK-Stack
https://medium.com/@tspann
https://www.datainmotion.dev/
milvus, unstructured data, vector database, zilliz, cloud, vectors, python, deep learning, generative ai, genai, nifi, kafka, flink, streaming, iot, edge
一比一原版(harvard毕业证书)哈佛大学毕业证如何办理
一模一样【微信:A575476】【(harvard毕业证书)哈佛大学毕业证成绩单Offer】【微信:A575476】(留信学历认证永久存档查询)采用学校原版纸张、特殊工艺完全按照原版一比一制作(包括:隐形水印,阴影底纹,钢印LOGO烫金烫银,LOGO烫金烫银复合重叠,文字图案浮雕,激光镭射,紫外荧光,温感,复印防伪)行业标杆!精益求精,诚心合作,真诚制作!多年品质 ,按需精细制作,24小时接单,全套进口原装设备,十五年致力于帮助留学生解决难题,业务范围有加拿大、英国、澳洲、韩国、美国、新加坡,新西兰等学历材料,包您满意。
【业务选择办理准则】
一、工作未确定,回国需先给父母、亲戚朋友看下文凭的情况,办理一份就读学校的毕业证【微信:A575476】文凭即可
二、回国进私企、外企、自己做生意的情况,这些单位是不查询毕业证真伪的,而且国内没有渠道去查询国外文凭的真假,也不需要提供真实教育部认证。鉴于此,办理一份毕业证【微信:A575476】即可
三、进国企,银行,事业单位,考公务员等等,这些单位是必需要提供真实教育部认证的,办理教育部认证所需资料众多且烦琐,所有材料您都必须提供原件,我们凭借丰富的经验,快捷的绿色通道帮您快速整合材料,让您少走弯路。
留信网认证的作用:
1:该专业认证可证明留学生真实身份
2:同时对留学生所学专业登记给予评定
3:国家专业人才认证中心颁发入库证书
4:这个认证书并且可以归档倒地方
5:凡事获得留信网入网的信息将会逐步更新到个人身份内,将在公安局网内查询个人身份证信息后,同步读取人才网入库信息
6:个人职称评审加20分
7:个人信誉贷款加10分
8:在国家人才网主办的国家网络招聘大会中纳入资料,供国家高端企业选择人才
→ 【关于价格问题(保证一手价格)
我们所定的价格是非常合理的,而且我们现在做得单子大多数都是代理和回头客户介绍的所以一般现在有新的单子 我给客户的都是第一手的代理价格,因为我想坦诚对待大家 不想跟大家在价格方面浪费时间
对于老客户或者被老客户介绍过来的朋友,我们都会适当给一些优惠。
选择实体注册公司办理,更放心,更安全!我们的承诺:可来公司面谈,可签订合同,会陪同客户一起到教育部认证窗口递交认证材料,客户在教育部官方认证查询网站查询到认证通过结果后付款,不成功不收费!
Build applications with generative AI on Google Cloud
We will explore Vertex AI - Model Garden powered experiences, we are going to learn more about the integration of these generative AI APIs. We are going to see in action what the Gemini family of generative models are for developers to build and deploy AI-driven applications. Vertex AI includes a suite of foundation models, these are referred to as the PaLM and Gemini family of generative ai models, and they come in different versions. We are going to cover how to use via API to: - execute prompts in text and chat - cover multimodal use cases with image prompts. - finetune and distill to improve knowledge domains - run function calls with foundation models to optimize them for specific tasks. At the end of the session, developers will understand how to innovate with generative AI and develop apps using the generative ai industry trends.
Recently uploaded (20)
Population Growth in Bataan: The effects of population growth around rural pl...
Population Growth in Bataan: The effects of population growth around rural pl...
End-to-end pipeline agility - Berlin Buzzwords 2024
End-to-end pipeline agility - Berlin Buzzwords 2024
A presentation that explain the Power BI Licensing
A presentation that explain the Power BI Licensing
Intelligence supported media monitoring in veterinary medicine
Intelligence supported media monitoring in veterinary medicine
"Financial Odyssey: Navigating Past Performance Through Diverse Analytical Lens"
"Financial Odyssey: Navigating Past Performance Through Diverse Analytical Lens"
Orchestrating the Future: Navigating Today's Data Workflow Challenges with Ai...
Orchestrating the Future: Navigating Today's Data Workflow Challenges with Ai...
Challenges of Nation Building-1.pptx with more important
Challenges of Nation Building-1.pptx with more important
Udemy_2024_Global_Learning_Skills_Trends_Report (1).pdf
Udemy_2024_Global_Learning_Skills_Trends_Report (1).pdf
Build applications with generative AI on Google Cloud
Build applications with generative AI on Google Cloud
US Hispanic Population Stats - 2014
- 1. Marital Status Percent of Hispanics likely to be married 45% 35% 45% 42% 46% 47% 56% 35% 36% Mexican Puerto Rican Cuban Salvadoran Ecuadorian Honduran Colombian Argentinean Dominican 48%of the entire U.S. population 15 years of age and older are married U.S. Population as a whole U.S. Hispanic Population 43%of Hispanics overall ages 15 and older are married Regional Dispersement Concentration of Hispanic Population U.S. Hispanic Population, by Origen, 2011 (in thousands) % of Hispanics Digital marketing for the U.S. Hispanic & Latin American markets This report examines the Hispanic population of the United States by its 14 largest origin groups. The data for this report are derived from the 2011 American Community Survey (1% IPUMS), which provides detailed geographic, demographic and economic characteristics for each group. Accompanying this report are profiles of the 14 largest Hispanic-origin groups—Mexicans, Puerto Ricans, Salvadorans, Cubans, Dominicans, Guatemalans, Colombians, Spaniards, Hondurans, Ecuadorians, Peruvians, Argentineans, Nicaraguans and Venezuelans. Also accompanying this report is an interactive graphic analyzing these groups on several characteristics. Source: Pew Hispanic Research Center Pewhispanic.org alcancemg.com | 415.625.5130 Median ages of the U.S. population and all Hispanics are 37 and 27, respectively. 37 27 U.S. population All Hispanics The nation’s Latino population is diverse. Represented among the 51.9 million Latinos in the United States are individuals who trace their heritage to more than 20 Spanish-speaking nations worldwide. A Pew Research Study Language 100 80 70 60 50 40 30 20 10 0 Ages 5 and older that speak English Report speaking English less than very well of all Hispanics report speaking English less than very well34% Home Ownership Rate of Home Ownership 80 70 60 50 40 30 20 10 0 49% 37% 56% 41% 40% 49% 53% 25% 29% U.S. population as a whole All hispanics 65% 46% About This Report 25 28 40 29 32 34 35 2828 50 40 30 20 10 0 Age CA TX FL NY IL OK NMAZ NV UT CO WY OR VA NJ Ages 15 and older Hispanics Overall 43% The median annual personal earnings for Hispanics, ages 16 and older in 2010 $20,000 The median earnings for all U.S. Hispanics = $2,000