SlideShare a Scribd company logo
1 of 19
Please go to the New York State Health Dept.
https://www.health.ny.gov/statistics/vital_statistics/2013/
Census Bureau
http://quickfacts.census.gov/qfd/states/36000.html
Before you start the specific assignment you may want to
examine the information available.
Area I Area II Source of
Data
Population
Birth Rate per 1000
Mortality Rate per 100,000
Major Causes of Death
Top 3 in order
Level of Education
% high school grad
% college grad
% adv
Level of Income
Median household in $
Racial/Ethnic composition
Use data from New York State Health Dept. and the Census
Bureau to compare two communities of your choice. You may
also want to try the Centers for Disease Prevention and Control
CDC at www.cdc.gov. Another strategy to get information is to
"google" your topic e.g. White Plains, New York demographic
and mortality data.
The communities may be counties, cities, states or any
combination of the two: eg. Westchester and Rockland, White
Plains and Yonkers, Overall Westchester and White Plains etc.,
Bronx and NYC, Brooklyn and Queens, Brooklyn and
Statewide or Citywide, New York State and North Carolina etc.
HINT Before you finalize the choice of community make sure
that you are able to locate material on it.
Please put the data in a table see above. Write a narrative -- a
paragraph in length comparing the two areas. (I would suggest
that online students prepare a paper copy for themselves). Be
sure that your name appears on the report itself if you submit it
as an attachment. Also, check that your data clearly indicates
whether the number is a number, rate or percentage. If figure is
a rate indicate the relevant population e.g. per 1,000, 10,000,
per 100,000. See text for more information on rates.
You may attach map(s) and data table from NY State
Health Dept. and the Census Bureau to your report. However,
the table must report the data.
Grading-- A Complete report and comparison of two areas--
Thoughtful comparison of the two areas. Sources of
information ( for each item of information) clearly indicated.
Provides a useful profile of socio-economic and health profile
for areas selected.
B/B+ Good chart, good comparison. Sources of information
clearly indicated.
C Comparison missing items, narrative comparison brief
D Assignment begun but not substantially completed
F Did not do assignment
Discussion Folder Open
Email your answer to me in the course email before 6 p.m on
the due date.
Post your answer here after 6 p.m on the due date.
Article on Puerto Rican in US
See article. Has data from CDC National Center for Health
Statistics
Health of Hispanic Adults: US 2010-2014
Centers for Disease Control and Prevention. CDC twenty four
seven. Saving Lives, Protecting People
CDC A-Z Index
MENU
CDC A-Z
SEARCH
National Center for Health Statistics
Publications and Information Products
Data Briefs
Health of Hispanic Adults: United States, 2010–2014
Health E-Stats
Health, United States
Life Tables
National Health Statistics Reports
National Vital Statistics Reports
Vital and Health Statistics Series
Vital Statistics Rapid Release
Other Publications
Bibliographies Available on the NCHS Website
Citations for NCHS Publications and Electronic Media
Errata List
Listservs
Ordering Printed Publications
Related Sites
Get E-mail Updates
Data Visualization Gallery
FastStats
NHIS Early Release Program
MMWR QuickStats
Government Printing Office Bookstore
CDC
NCHS
Publications and Information Products
Data Briefs
Health of Hispanic Adults: United States, 2010–2014
Recommend on Facebook
Tweet
Twitter
Facebook
Pinterest
LinkedIn
Email
Digg
Add this to your site
On this Page
Key findings
Did the age-adjusted percentage of adults who were in fair or
poor health vary among Hispanic subgroups?
Did the age-adjusted percentage of adults with multiple chronic
conditions differ among Hispanic subgroups?
Did the age-adjusted percentage of adults with serious
psychological distress vary among Hispanic subgroups?
Did the age-adjusted percentage of adults who were unable to
work due to health problems differ among Hispanic subgroups?
Did the age-adjusted percentage of adults who had a social
participation restriction differ among Hispanic subgroups?
Summary
Definitions
Data source and methods
About the authors
References
Suggested citation
NCHS Data Brief No. 251, June 2016
PDF Version
(http://www.cdc.gov/nchs/data/databriefs/db251.pdf)
(388 KB)
Jacqueline W. Lucas, M.P.H, Gulnur Freeman, M.P.A., and
Patricia F. Adams
Key findings
Data from the National Health Interview Survey, 2010–2014
Overall, Puerto Rican adults consistently reported poorer health
status than non-Hispanic adults.
Puerto Rican (19.2%) and Mexican (17.4%) adults were more
likely than Central or South American (12.3%) and Cuban
(14.7%) adults to be in fair or poor health.
Puerto Rican adults (27.3%) were more likely than Central or
South American adults (16.6%) to have had multiple chronic
conditions.
Puerto Rican adults (6.2%) were nearly twice as likely to report
serious psychological distress in the past 30 days compared with
Central or South American adults (3.3%).
Puerto Rican adults (11.4%) were more likely than Central or
South American (2.9%), Cuban (3.9%), and Mexican (4.8%)
adults to be unable to work due to health problems.
There are 54 million Hispanic persons living in the United
States, making them the largest minority group in the country (
1
). Disaggregated data on Hispanic subgroups are needed to
understand the health of Hispanic persons of diverse
backgrounds (
2
). This report presents selected estimates of health measures for
all Hispanic adults aged 18 and over and for the following four
Hispanic subgroups: Central or South American, Cuban,
Mexican, and Puerto Rican adults. Comparisons are also made
across the subgroups and with the non-Hispanic U.S. adult
population as a whole.
Keywords
:
health status, chronic conditions, disparities, National Health
Interview Survey
Did the age-adjusted percentage of adults who were in fair or
poor health vary among Hispanic subgroups?
Puerto Rican (19.2%) and Mexican (17.4%) adults were more
likely than Central or South American (12.3%) and Cuban
(14.7%) adults to be in fair or poor health (
Figure 1
).
The age-adjusted percentage of Hispanic adults (16.8%) with
fair or poor health was higher compared with non-Hispanic U.S.
adults (11.9%).
Cuban, Mexican, and Puerto Rican adults were all more likely
than non-Hispanic U.S. adults to be in fair or poor health.
No significant difference was observed in the prevalence of fair
or poor health between Central or South American adults and
non-Hispanic U.S. adults.
Figure 1. Age-adjusted percentage of adults aged 18 and over
who were in fair or poor health, by ethnicity and Hispanic
subgroup: United States, 2010–2014
(http://www.cdc.gov/nchs/images/databriefs/251-
300/db251_fig1.png)
1
Significantly different from non-Hispanic U.S. population (
p
< 0.05).
2
Significantly different from Mexican (
p
< 0.05).
3
Significantly different from Puerto Rican (
p
< 0.05).
4
Significantly different from Central or South American (
p
< 0.05). NOTES: Age-adjusted by the direct method to the
2000 U.S. Census population using age groups: 18–44, 45–64,
65–74, and 75 and over.
Access data table for Figure 1
. SOURCE: NCHS, National Health Interview Survey, 2010–
2014.
Did the age-adjusted percentage of adults with multiple chronic
conditions differ among Hispanic subgroups?
Puerto Rican (27.3%) and Mexican (20.8%) adults were more
likely to have two or more chronic conditions—including
hypertension, coronary heart disease, stroke, diabetes, cancer,
arthritis, hepatitis, emphysema, weak or failing kidneys, or
asthma—compared with Central or South American (16.6%) and
Cuban (18.6%) adults (
Figure 2
).
The age-adjusted percentage of Hispanic adults (20.8%) who
have had multiple chronic conditions was lower compared with
non-Hispanic U.S. adults (24.6%).
Central or South American, Cuban, and Mexican adults were
less likely to have had multiple chronic conditions compared
with non-Hispanic U.S. adults, but Puerto Rican adults were
more likely than non-Hispanic U.S. adults to have had multiple
chronic conditions.
Figure 2. Age-adjusted percentage of adults aged 18 and over
who had multiple chronic conditions, by ethnicity and Hispanic
subgroup: United States, 2010–2014
(http://www.cdc.gov/nchs/images/databriefs/251-
300/db251_fig2.png)
1
Significantly different from non-Hispanic U.S. population (
p
< 0.05).
2
Significantly different from Mexican (
p
< 0.05).
3
Significantly different from Puerto Rican (
p
< 0.05).
4
Significantly different from Central or South American (
p
< 0.05). NOTES: Age-adjusted by the direct method to the
2000 U.S. Census population using age groups: 18–44, 45–64,
65–74, and 75 and over.
Access data table for Figure 2
. SOURCE: NCHS, National Health Interview Survey, 2010–
2014.
Did the age-adjusted percentage of adults with serious
psychological distress vary among Hispanic subgroups?
The age-adjusted percentage of serious psychological distress in
the past 30 days was higher among Puerto Rican adults (6.2%)
compared with Central or South American (3.3%), Cuban
(3.7%), and Mexican (3.9%) adults (
Figure 3
).
Puerto Rican adults (6.2%) were nearly twice as likely to report
serious psychological distress in the past 30 days compared with
Central or South American adults (3.3%).
Hispanic adults (4.1%) were more likely to have had serious
psychological distress in the past 30 days compared with non-
Hispanic U.S. adults (3.2%).
There were no significant differences in the age-adjusted
percentages of adults with serious psychological distress among
Central or South American, Cuban, and Mexican adults. There
was also no significant difference between these groups and the
non-Hispanic U.S. population.
Figure 3. Age-adjusted percentage of adults aged 18 and over
who had serious psychological distress, by ethnicity and
Hispanic subgroup: United States, 2010–2014
(http://www.cdc.gov/nchs/images/databriefs/251-
300/db251_fig3.png)
1
Significantly different from non-Hispanic U.S. population (
p
< 0.05).
2
Significantly different from Puerto Rican (
p
< 0.05). NOTES: Age-adjusted by the direct method to the
2000 U.S. Census population using age groups: 18–44, 45–64,
65–74, and 75 and over.
Access data table for Figure 3
. SOURCE: NCHS, National Health Interview Survey, 2010–
2014.
Did the age-adjusted percentage of adults who were unable to
work due to health problems differ among Hispanic subgroups?
Puerto Rican adults (11.4%) were more likely than Central or
South American (2.9%), Cuban (3.9%), Mexican (4.8%), and
non-Hispanic U.S. (6.8%) adults to be unable to work due to
health problems (
Figure 4
).
Mexican adults were more likely to be unable to work due to
health problems compared with Central or South American
adults.
Hispanic adults (5.2%) were less likely than non-Hispanic U.S.
adults (6.8%) to be unable to work due to health problems.
Figure 4. Age-adjusted percentage of adults aged 18–64 who
were unable to work due to health problems, by ethnicity and
Hispanic subgroup: United States, 2010–2014
(http://www.cdc.gov/nchs/images/databriefs/251-
300/db251_fig4.png)
1
Significantly different from non-Hispanic U.S. population (
p
< 0.05).
2
Significantly different from Mexican (
p
< 0.05).
3
Significantly different from Puerto Rican (
p
< 0.05). NOTES: Age-adjusted by the direct method to the
2000 U.S. Census population using age groups: 18–44, 45–64,
65–74, and 75 and over.
Access data table for Figure 4
. SOURCE: NCHS, National Health Interview Survey, 2010–
2014.
Did the age-adjusted percentage of adults who had a social
participation restriction differ among Hispanic subgroups?
After age adjustment, Puerto Rican adults (6.3%) were more
likely than Central or South American (3.1%), Cuban (3.1%),
Mexican (4.7%), and non-Hispanic U.S. (3.9%) adults to have
had a social participation restriction (
Figure 5
).
Mexican adults were more likely than Cuban and Central or
South American adults to have had a social participation
restriction.
Hispanic adults (4.4%) were more likely than non-Hispanic U.S.
adults (3.9%) to have had a social participation restriction.
Central or South American (3.1%) and Cuban (3.1%) adults
were equally as likely to have had a social participation
restriction, and both groups were less likely than non-Hispanic
adults to have had a social participation restriction.
Figure 5. Age-adjusted percentage of adults aged 18 and over
who had a social participation restriction, by ethnicity and
Hispanic subgroup: United States, 2010–2014
(http://www.cdc.gov/nchs/images/databriefs/251-
300/db251_fig5.png)
1
Significantly different from non-Hispanic U.S. population (
p
< 0.05).
2
Significantly different from Mexican (
p
< 0.05).
3
Significantly different from Puerto Rican (
p
< 0.05). NOTES: Age-adjusted by the direct method to the
2000 U.S. Census population using age groups: 18–44, 45–64,
65–74, and 75 and over.
Access data table for Figure 5
. SOURCE: NCHS, National Health Interview Survey, 2010–
2014.
Summary
This report provides national estimates of fair or poor health,
multiple chronic conditions, serious psychological distress,
inability to work due to health reasons, and social participation
restrictions for four subgroups of Hispanic adults aged 18 and
over in the United States. Compared with non-Hispanic U.S.
adults, Hispanic adults had higher rates of fair or poor health,
social participation restrictions, and serious psychological
distress, but they had lower rates of being unable to work due to
health reasons and having multiple chronic conditions.
The U.S. Hispanic population consists of individuals originally
from various countries in North America, Central or South
America, the Caribbean, and Europe. Although the Hispanic
population in the United States may share a common language,
there is considerable variation among subgroups in terms of
cultural background, socioeconomic status, and care-seeking
behaviors.
These analyses showed that Central and South American adults
had similar or better health than the non-Hispanic U.S.
population, while Puerto Rican adults had worse health than the
non-Hispanic U.S. population. Puerto Rican adults were also
generally more likely to have poorer health compared with other
Hispanic subgroups, and Central or South American adults were
generally less likely to have poorer health compared with other
Hispanic subgroups. The findings in this report are consistent
with previous studies, which show disparities among Hispanic
subgroups (
3
,
4
), and highlight the importance of considering Hispanic
subgroups when examining Hispanic health.
Definitions
Fair or poor health status
: Family respondents were asked to assess the health of all
family members, specifically, whether their “health in general is
excellent, very good, good, fair, or poor?” When the sample
adult is not the family respondent, this information is reported
by a proxy.
Multiple chronic conditions
: Based on a positive response to two or more of the separate
survey questions that assess chronic conditions, including
whether adults had ever been told by a doctor or other health
professional that they had hypertension, coronary heart disease,
stroke, diabetes, cancer, arthritis, hepatitis, or emphysema; had
experienced weak or failing kidneys or chronic bronchitis
during the past 12 months; or currently had asthma (
5
).
Serious psychological distress
: Based on responses from six separate survey questions about
how often a respondent felt sad, nervous, restless, hopeless, that
everything was an effort, or worthless during the past 30
days.The response codes (0–4) for each of the six items are
summed to yield a scale with a 0–24 range. A value of 13 or
more for this scale is used here to define serious psychological
distress (
6
). Adults with missing data for any of the six psychological
distress questions were excluded from the calculation of the
serious psychological distress indicator for this analysis (about
1.5% of respondents from 2010 to 2014).
Unable to work
: Based on the questions, ‘‘Does a physical, mental, or
emotional problem now keep [family members 18 years of age
or older] from working at a job or business?’’ and for persons
not kept from working, ‘‘Are [family members 18 years of age
or older] limited in the kind or amount of work they can do
because of a physical, mental, or emotional problem?’’ For this
report, the age group is limited to those aged 18–64. When the
sample adult is not the family respondent, this information is
reported by a proxy.
Social participation restriction
: Respondents who reported “very difficult” or “can’t do at all”
to either of the following survey questions were defined as
having had social participation restriction: “By yourself, and
without using any special equipment, how difficult is it for you
to (a) go out to things like shopping, movies, or sporting events,
and (b) participate in social activities such as visiting friends,
attending clubs and meetings, or going to parties?”
Data source and methods
Data from the 2010–2014 National Health Interview Survey
(NHIS) were used for this analysis. NHIS data are collected
continuously throughout the year by the National Center for
Health Statistics. NHIS collects information about the health
and health care of the civilian noninstitutionalized U.S.
population. Interviews are conducted in respondents’ homes, but
follow-ups to complete interviews may be conducted by
telephone.
In 2010–2014, information was collected on a total of 165,950
sample adults aged 18 and over. There were 28,880 Hispanic
adults in the Sample Adult files, including 17,392 Mexican or
Mexican American, 4,723 Central or South American, 2,846
Puerto Rican, 1,484 Cuban, and 2,435 other Hispanic adults.
These groups comprise 60.2%, 16.4%, 10.0%, 5.0%, and 8.0%
of the Hispanic population, respectively. To control for
differences in age distributions within Hispanic subgroups and
the effect of age on the health characteristics studied here,
estimates were age-adjusted using the projected 2000 U.S.
population from the U.S. Census Bureau as the standard
population and the following age groups: 18–44, 45–64, 65–74,
and 75 and over. Estimates for adults aged 18–64 were age-
adjusted using age groups 18–24, 25–44, and 45–64.
Differences between percentages were evaluated using two-
sided significance tests at the
p
< 0.05 level. All differences reported are statistically
significant unless otherwise indicated. For further information
about NHIS, including the questionnaire, visit the
NHIS website
.
NHIS is designed to yield a nationally representative sample,
and this analysis used the sample adult weight to produce
national estimates. Data weighting procedures are described
elsewhere (
7
). Estimates for this analysis were calculated using SUDAAN
software (
8
).
About the authors
Jacqueline W. Lucas, Gulnur Freeman, and Patricia F. Adams
are with the National Center for Health Statistics, Division of
Health Interview Statistics.
References
U.S. Census Bureau. Facts for features: Hispanic Heritage
Month 2014: Sept. 15–Oct. 15
. Washington, D.C. 2014.
Daviglus ML, Talavera GA, Avilés-Santa ML, Allison M, Cai J,
Criqui MH, et.al. Prevalence of major cardiovascular risk
factors and cardiovascular diseases among Hispanic/Latino
individuals of diverse backgrounds in the United States. JAMA
308(17):1775–84. 2012.
Dominguez K, Penman-Aguilar A, Chang MH, et.al.
Vital signs: Leading causes of death, prevalence of diseases and
risk factors, and use of health services among Hispanics in the
United States—2009–2013
. MMWR Morb Mortal Wkly Rep 64(17):469–78. 2015.
Hajat A, Lucas JB, Kington R.
Health outcomes among Hispanic subgroups: United States,
1992–95
. Advance data from vital and health statistics; no. 310.
Hyattsville, Maryland: National Center for Health Statistics.
2000.
Goodman RA, Posner SF, Huang ES, et.al.
Defining and measuring chronic conditions: Imperatives for
research, policy, program, and practice
. Prev Chronic Dis. 2013.
Kessler RC, Barker PR, Colpe LJ, Epstein JF, Gfoerer JC,
Hiripi E, et al. Screening for serious mental illness in the
general population. Arch Gen Psychiatry 60(2):184–9. 2003.
Parsons VL, Moriarity CL, Jonas K, et al.
Design and estimation for the National Health Interview Survey,
2006–2015
. National Center for Health Statistics. Vital Health Stat 2(165).
2014.
RTI International. SUDAAN (Release 11.0.0) [computer
software]. 2012.
Suggested citation
Lucas JW, Freeman G, Adams PF. Health of Hispanic adults:
United States, 2010–2014. NCHS data brief, no 251.
Hyattsville, MD: National Center for Health Statistics. 2016.
Copyright information
All material appearing in this report is in the public domain and
may be reproduced or copied without permission; citation as to
source, however, is appreciated.
National Center for Health Statistics
Charles J. Rothwell, M.S., M.B.A.,
Director
Jennifer H. Madans, Ph.D.,
Associate Director for Science
Division of Health Interview Statistics
Marcie L. Cynamon,
Director
Stephen J. Blumberg, Ph.D.,
Associate Director for Science
Related Sites
Get E-mail Updates
(http://www.cdc.gov/nchs/govdelivery.htm)
Data Visualization Gallery
FastStats
(http://www.cdc.gov/nchs/fastats/default.htm)
NHIS Early Release Program
(http://www.cdc.gov/nchs/nhis/releases.htm)
MMWR QuickStats
(http://www.cdc.gov/nchs/pressroom/quickstats.htm)
Government Printing Office Bookstore
File Formats Help:
How do I view different file formats (PDF, DOC, PPT, MPEG)
on this site?
Adobe PDF file
Microsoft PowerPoint file
Microsoft Word file
Microsoft Excel file
Audio/Video file
Apple Quicktime file
RealPlayer file
Text file
Zip Archive file
SAS file
ePub file
RIS file
Page last reviewed:
June 17, 2016
Page last updated:
June 17, 2016
Content source:
Email
Recommend
Tweet
YouTube
Instagram
Listen
Watch
RSS
ABOUT
About CDC
Jobs
Funding
LEGAL
Policies
Privacy
FOIA
No Fear Act
OIG
1600 Clifton Road
Atlanta
,
GA
30329-4027
USA
800-CDC-INFO (800-232-4636)
,
TTY: 888-232-6348
Email CDC-INFO

More Related Content

Similar to Please go to the New York State Health Dept.httpswww.health.docx

POSTER JORGE PRADA LA NAHN 2015
POSTER JORGE PRADA LA  NAHN 2015 POSTER JORGE PRADA LA  NAHN 2015
POSTER JORGE PRADA LA NAHN 2015 Jorge Prada
 
Chapter15a
Chapter15aChapter15a
Chapter15aankit.rk
 
COMMENTARYMinority Group Status and Healthful AgingSoci
COMMENTARYMinority Group Status and Healthful AgingSociCOMMENTARYMinority Group Status and Healthful AgingSoci
COMMENTARYMinority Group Status and Healthful AgingSociLynellBull52
 
community health method.docx
community health method.docxcommunity health method.docx
community health method.docxstudywriters
 
Closing the Gap: Reducing Disparities & Achieving Health Equity
Closing the Gap: Reducing Disparities & Achieving Health EquityClosing the Gap: Reducing Disparities & Achieving Health Equity
Closing the Gap: Reducing Disparities & Achieving Health EquityNASHP HealthPolicy
 
Health and Health Care for Blacks in the United States - Updated January 2018
Health and Health Care for Blacks in the United States - Updated January 2018Health and Health Care for Blacks in the United States - Updated January 2018
Health and Health Care for Blacks in the United States - Updated January 2018KFF
 
State Health Access Report
State Health Access ReportState Health Access Report
State Health Access ReportJohn Stern
 
nutritionprofiles_california_101916
nutritionprofiles_california_101916nutritionprofiles_california_101916
nutritionprofiles_california_101916David Thomsen
 
1 Center for American Progress Fact Sheet Health Disparitie.docx
1 Center for American Progress  Fact Sheet Health Disparitie.docx1 Center for American Progress  Fact Sheet Health Disparitie.docx
1 Center for American Progress Fact Sheet Health Disparitie.docxhoney725342
 
the bmj BMJ 2021;373n1343 doi 10.1136bmj.n1343 1R E
the bmj  BMJ 2021;373n1343  doi 10.1136bmj.n1343 1R Ethe bmj  BMJ 2021;373n1343  doi 10.1136bmj.n1343 1R E
the bmj BMJ 2021;373n1343 doi 10.1136bmj.n1343 1R EGrazynaBroyles24
 
Global Medical Cures™ | USA Chartbook on HealthCare for Blacks
Global Medical Cures™ | USA Chartbook on HealthCare for BlacksGlobal Medical Cures™ | USA Chartbook on HealthCare for Blacks
Global Medical Cures™ | USA Chartbook on HealthCare for BlacksGlobal Medical Cures™
 
When assessing community health issues, it is important to identify .docx
When assessing community health issues, it is important to identify .docxWhen assessing community health issues, it is important to identify .docx
When assessing community health issues, it is important to identify .docxeubanksnefen
 
The Rules May Be Changing but the Games Is the Same
The Rules May Be Changing but the Games Is the SameThe Rules May Be Changing but the Games Is the Same
The Rules May Be Changing but the Games Is the SamePractical Playbook
 
Aetna Presentation Latino Demographics
Aetna Presentation Latino DemographicsAetna Presentation Latino Demographics
Aetna Presentation Latino DemographicsDanny Santibanez
 

Similar to Please go to the New York State Health Dept.httpswww.health.docx (20)

POSTER JORGE PRADA LA NAHN 2015
POSTER JORGE PRADA LA  NAHN 2015 POSTER JORGE PRADA LA  NAHN 2015
POSTER JORGE PRADA LA NAHN 2015
 
Chapter15a
Chapter15aChapter15a
Chapter15a
 
COMMENTARYMinority Group Status and Healthful AgingSoci
COMMENTARYMinority Group Status and Healthful AgingSociCOMMENTARYMinority Group Status and Healthful AgingSoci
COMMENTARYMinority Group Status and Healthful AgingSoci
 
community health method.docx
community health method.docxcommunity health method.docx
community health method.docx
 
CALPACT Webinar: Putting Culture Into Context: Communicating with Diverse Lat...
CALPACT Webinar: Putting Culture Into Context: Communicating with Diverse Lat...CALPACT Webinar: Putting Culture Into Context: Communicating with Diverse Lat...
CALPACT Webinar: Putting Culture Into Context: Communicating with Diverse Lat...
 
Closing the Gap: Reducing Disparities & Achieving Health Equity
Closing the Gap: Reducing Disparities & Achieving Health EquityClosing the Gap: Reducing Disparities & Achieving Health Equity
Closing the Gap: Reducing Disparities & Achieving Health Equity
 
Health and Health Care for Blacks in the United States - Updated January 2018
Health and Health Care for Blacks in the United States - Updated January 2018Health and Health Care for Blacks in the United States - Updated January 2018
Health and Health Care for Blacks in the United States - Updated January 2018
 
Paratransit Services Research
Paratransit Services ResearchParatransit Services Research
Paratransit Services Research
 
State Health Access Report
State Health Access ReportState Health Access Report
State Health Access Report
 
05 session ii_julianperez
05 session ii_julianperez05 session ii_julianperez
05 session ii_julianperez
 
Disproportionate Impact of Diabetes
Disproportionate Impact of DiabetesDisproportionate Impact of Diabetes
Disproportionate Impact of Diabetes
 
PublicHealthProject
PublicHealthProjectPublicHealthProject
PublicHealthProject
 
nutritionprofiles_california_101916
nutritionprofiles_california_101916nutritionprofiles_california_101916
nutritionprofiles_california_101916
 
1 Center for American Progress Fact Sheet Health Disparitie.docx
1 Center for American Progress  Fact Sheet Health Disparitie.docx1 Center for American Progress  Fact Sheet Health Disparitie.docx
1 Center for American Progress Fact Sheet Health Disparitie.docx
 
the bmj BMJ 2021;373n1343 doi 10.1136bmj.n1343 1R E
the bmj  BMJ 2021;373n1343  doi 10.1136bmj.n1343 1R Ethe bmj  BMJ 2021;373n1343  doi 10.1136bmj.n1343 1R E
the bmj BMJ 2021;373n1343 doi 10.1136bmj.n1343 1R E
 
Global Medical Cures™ | USA Chartbook on HealthCare for Blacks
Global Medical Cures™ | USA Chartbook on HealthCare for BlacksGlobal Medical Cures™ | USA Chartbook on HealthCare for Blacks
Global Medical Cures™ | USA Chartbook on HealthCare for Blacks
 
When assessing community health issues, it is important to identify .docx
When assessing community health issues, it is important to identify .docxWhen assessing community health issues, it is important to identify .docx
When assessing community health issues, it is important to identify .docx
 
Christina Arredondo
Christina ArredondoChristina Arredondo
Christina Arredondo
 
The Rules May Be Changing but the Games Is the Same
The Rules May Be Changing but the Games Is the SameThe Rules May Be Changing but the Games Is the Same
The Rules May Be Changing but the Games Is the Same
 
Aetna Presentation Latino Demographics
Aetna Presentation Latino DemographicsAetna Presentation Latino Demographics
Aetna Presentation Latino Demographics
 

More from janekahananbw

Please Read Below carefully, then answer all questions with orig.docx
Please Read Below carefully, then answer all questions with orig.docxPlease Read Below carefully, then answer all questions with orig.docx
Please Read Below carefully, then answer all questions with orig.docxjanekahananbw
 
Please read and view (where applicable) the following Learning Res.docx
Please read and view (where applicable) the following Learning Res.docxPlease read and view (where applicable) the following Learning Res.docx
Please read and view (where applicable) the following Learning Res.docxjanekahananbw
 
Please read and reference the following articlesPopa, M., & Salan.docx
Please read and reference the following articlesPopa, M., & Salan.docxPlease read and reference the following articlesPopa, M., & Salan.docx
Please read and reference the following articlesPopa, M., & Salan.docxjanekahananbw
 
Please read all  attached documents .. This ILab instructions are at.docx
Please read all  attached documents .. This ILab instructions are at.docxPlease read all  attached documents .. This ILab instructions are at.docx
Please read all  attached documents .. This ILab instructions are at.docxjanekahananbw
 
PLEASE READ BACKGROUND INFO BELOW.  TURNIT IN IS USEDModule 4 .docx
PLEASE READ BACKGROUND INFO BELOW.  TURNIT IN IS USEDModule 4 .docxPLEASE READ BACKGROUND INFO BELOW.  TURNIT IN IS USEDModule 4 .docx
PLEASE READ BACKGROUND INFO BELOW.  TURNIT IN IS USEDModule 4 .docxjanekahananbw
 
Please provide a short paper, is 2–3 pages, 600 words minimum, due.docx
Please provide a short paper, is 2–3 pages, 600 words minimum, due.docxPlease provide a short paper, is 2–3 pages, 600 words minimum, due.docx
Please provide a short paper, is 2–3 pages, 600 words minimum, due.docxjanekahananbw
 
Please provideOverall RecommendationsManagementSolutions.docx
Please provideOverall RecommendationsManagementSolutions.docxPlease provideOverall RecommendationsManagementSolutions.docx
Please provideOverall RecommendationsManagementSolutions.docxjanekahananbw
 
Please provide a comprehensive answer to the following two quest.docx
Please provide a comprehensive answer to the following two quest.docxPlease provide a comprehensive answer to the following two quest.docx
Please provide a comprehensive answer to the following two quest.docxjanekahananbw
 
Please pick 2 of the questions.  write 400 words each on the ones yo.docx
Please pick 2 of the questions.  write 400 words each on the ones yo.docxPlease pick 2 of the questions.  write 400 words each on the ones yo.docx
Please pick 2 of the questions.  write 400 words each on the ones yo.docxjanekahananbw
 
Please pay close  attention to the directions given in the templat.docx
Please pay close  attention to the directions given in the templat.docxPlease pay close  attention to the directions given in the templat.docx
Please pay close  attention to the directions given in the templat.docxjanekahananbw
 
Please list and describe three (3) categories of methods to prop.docx
Please list and describe three (3) categories of methods to prop.docxPlease list and describe three (3) categories of methods to prop.docx
Please list and describe three (3) categories of methods to prop.docxjanekahananbw
 
Please look through the following links and find something interesti.docx
Please look through the following links and find something interesti.docxPlease look through the following links and find something interesti.docx
Please look through the following links and find something interesti.docxjanekahananbw
 
please identify following termsContraceptive entrepreneur        .docx
please identify following termsContraceptive entrepreneur        .docxplease identify following termsContraceptive entrepreneur        .docx
please identify following termsContraceptive entrepreneur        .docxjanekahananbw
 
Please keep plagiarism at 22 or less assignment sent through Tu.docx
Please keep plagiarism at 22 or less assignment sent through Tu.docxPlease keep plagiarism at 22 or less assignment sent through Tu.docx
Please keep plagiarism at 22 or less assignment sent through Tu.docxjanekahananbw
 
Please let me know you will do this assignment. thanks for everythin.docx
Please let me know you will do this assignment. thanks for everythin.docxPlease let me know you will do this assignment. thanks for everythin.docx
Please let me know you will do this assignment. thanks for everythin.docxjanekahananbw
 
Please look at httplabor.mo.govsitesdefaultfilespubs_forms20.docx
Please look at httplabor.mo.govsitesdefaultfilespubs_forms20.docxPlease look at httplabor.mo.govsitesdefaultfilespubs_forms20.docx
Please look at httplabor.mo.govsitesdefaultfilespubs_forms20.docxjanekahananbw
 
Please help me write a 6-7 pages research about Pica in Iron Defici.docx
Please help me write a 6-7 pages research about Pica in Iron Defici.docxPlease help me write a 6-7 pages research about Pica in Iron Defici.docx
Please help me write a 6-7 pages research about Pica in Iron Defici.docxjanekahananbw
 
please i want to do a presnatation and write me the presntaion  in 2.docx
please i want to do a presnatation and write me the presntaion  in 2.docxplease i want to do a presnatation and write me the presntaion  in 2.docx
please i want to do a presnatation and write me the presntaion  in 2.docxjanekahananbw
 
Please follow the assignment below.  The example assignment will be .docx
Please follow the assignment below.  The example assignment will be .docxPlease follow the assignment below.  The example assignment will be .docx
Please follow the assignment below.  The example assignment will be .docxjanekahananbw
 
Please find the attached for instruction.Please carefully read t.docx
Please find the attached for instruction.Please carefully read t.docxPlease find the attached for instruction.Please carefully read t.docx
Please find the attached for instruction.Please carefully read t.docxjanekahananbw
 

More from janekahananbw (20)

Please Read Below carefully, then answer all questions with orig.docx
Please Read Below carefully, then answer all questions with orig.docxPlease Read Below carefully, then answer all questions with orig.docx
Please Read Below carefully, then answer all questions with orig.docx
 
Please read and view (where applicable) the following Learning Res.docx
Please read and view (where applicable) the following Learning Res.docxPlease read and view (where applicable) the following Learning Res.docx
Please read and view (where applicable) the following Learning Res.docx
 
Please read and reference the following articlesPopa, M., & Salan.docx
Please read and reference the following articlesPopa, M., & Salan.docxPlease read and reference the following articlesPopa, M., & Salan.docx
Please read and reference the following articlesPopa, M., & Salan.docx
 
Please read all  attached documents .. This ILab instructions are at.docx
Please read all  attached documents .. This ILab instructions are at.docxPlease read all  attached documents .. This ILab instructions are at.docx
Please read all  attached documents .. This ILab instructions are at.docx
 
PLEASE READ BACKGROUND INFO BELOW.  TURNIT IN IS USEDModule 4 .docx
PLEASE READ BACKGROUND INFO BELOW.  TURNIT IN IS USEDModule 4 .docxPLEASE READ BACKGROUND INFO BELOW.  TURNIT IN IS USEDModule 4 .docx
PLEASE READ BACKGROUND INFO BELOW.  TURNIT IN IS USEDModule 4 .docx
 
Please provide a short paper, is 2–3 pages, 600 words minimum, due.docx
Please provide a short paper, is 2–3 pages, 600 words minimum, due.docxPlease provide a short paper, is 2–3 pages, 600 words minimum, due.docx
Please provide a short paper, is 2–3 pages, 600 words minimum, due.docx
 
Please provideOverall RecommendationsManagementSolutions.docx
Please provideOverall RecommendationsManagementSolutions.docxPlease provideOverall RecommendationsManagementSolutions.docx
Please provideOverall RecommendationsManagementSolutions.docx
 
Please provide a comprehensive answer to the following two quest.docx
Please provide a comprehensive answer to the following two quest.docxPlease provide a comprehensive answer to the following two quest.docx
Please provide a comprehensive answer to the following two quest.docx
 
Please pick 2 of the questions.  write 400 words each on the ones yo.docx
Please pick 2 of the questions.  write 400 words each on the ones yo.docxPlease pick 2 of the questions.  write 400 words each on the ones yo.docx
Please pick 2 of the questions.  write 400 words each on the ones yo.docx
 
Please pay close  attention to the directions given in the templat.docx
Please pay close  attention to the directions given in the templat.docxPlease pay close  attention to the directions given in the templat.docx
Please pay close  attention to the directions given in the templat.docx
 
Please list and describe three (3) categories of methods to prop.docx
Please list and describe three (3) categories of methods to prop.docxPlease list and describe three (3) categories of methods to prop.docx
Please list and describe three (3) categories of methods to prop.docx
 
Please look through the following links and find something interesti.docx
Please look through the following links and find something interesti.docxPlease look through the following links and find something interesti.docx
Please look through the following links and find something interesti.docx
 
please identify following termsContraceptive entrepreneur        .docx
please identify following termsContraceptive entrepreneur        .docxplease identify following termsContraceptive entrepreneur        .docx
please identify following termsContraceptive entrepreneur        .docx
 
Please keep plagiarism at 22 or less assignment sent through Tu.docx
Please keep plagiarism at 22 or less assignment sent through Tu.docxPlease keep plagiarism at 22 or less assignment sent through Tu.docx
Please keep plagiarism at 22 or less assignment sent through Tu.docx
 
Please let me know you will do this assignment. thanks for everythin.docx
Please let me know you will do this assignment. thanks for everythin.docxPlease let me know you will do this assignment. thanks for everythin.docx
Please let me know you will do this assignment. thanks for everythin.docx
 
Please look at httplabor.mo.govsitesdefaultfilespubs_forms20.docx
Please look at httplabor.mo.govsitesdefaultfilespubs_forms20.docxPlease look at httplabor.mo.govsitesdefaultfilespubs_forms20.docx
Please look at httplabor.mo.govsitesdefaultfilespubs_forms20.docx
 
Please help me write a 6-7 pages research about Pica in Iron Defici.docx
Please help me write a 6-7 pages research about Pica in Iron Defici.docxPlease help me write a 6-7 pages research about Pica in Iron Defici.docx
Please help me write a 6-7 pages research about Pica in Iron Defici.docx
 
please i want to do a presnatation and write me the presntaion  in 2.docx
please i want to do a presnatation and write me the presntaion  in 2.docxplease i want to do a presnatation and write me the presntaion  in 2.docx
please i want to do a presnatation and write me the presntaion  in 2.docx
 
Please follow the assignment below.  The example assignment will be .docx
Please follow the assignment below.  The example assignment will be .docxPlease follow the assignment below.  The example assignment will be .docx
Please follow the assignment below.  The example assignment will be .docx
 
Please find the attached for instruction.Please carefully read t.docx
Please find the attached for instruction.Please carefully read t.docxPlease find the attached for instruction.Please carefully read t.docx
Please find the attached for instruction.Please carefully read t.docx
 

Recently uploaded

The Most Excellent Way | 1 Corinthians 13
The Most Excellent Way | 1 Corinthians 13The Most Excellent Way | 1 Corinthians 13
The Most Excellent Way | 1 Corinthians 13Steve Thomason
 
POINT- BIOCHEMISTRY SEM 2 ENZYMES UNIT 5.pptx
POINT- BIOCHEMISTRY SEM 2 ENZYMES UNIT 5.pptxPOINT- BIOCHEMISTRY SEM 2 ENZYMES UNIT 5.pptx
POINT- BIOCHEMISTRY SEM 2 ENZYMES UNIT 5.pptxSayali Powar
 
Presentation by Andreas Schleicher Tackling the School Absenteeism Crisis 30 ...
Presentation by Andreas Schleicher Tackling the School Absenteeism Crisis 30 ...Presentation by Andreas Schleicher Tackling the School Absenteeism Crisis 30 ...
Presentation by Andreas Schleicher Tackling the School Absenteeism Crisis 30 ...EduSkills OECD
 
18-04-UA_REPORT_MEDIALITERAСY_INDEX-DM_23-1-final-eng.pdf
18-04-UA_REPORT_MEDIALITERAСY_INDEX-DM_23-1-final-eng.pdf18-04-UA_REPORT_MEDIALITERAСY_INDEX-DM_23-1-final-eng.pdf
18-04-UA_REPORT_MEDIALITERAСY_INDEX-DM_23-1-final-eng.pdfssuser54595a
 
Concept of Vouching. B.Com(Hons) /B.Compdf
Concept of Vouching. B.Com(Hons) /B.CompdfConcept of Vouching. B.Com(Hons) /B.Compdf
Concept of Vouching. B.Com(Hons) /B.CompdfUmakantAnnand
 
microwave assisted reaction. General introduction
microwave assisted reaction. General introductionmicrowave assisted reaction. General introduction
microwave assisted reaction. General introductionMaksud Ahmed
 
Incoming and Outgoing Shipments in 1 STEP Using Odoo 17
Incoming and Outgoing Shipments in 1 STEP Using Odoo 17Incoming and Outgoing Shipments in 1 STEP Using Odoo 17
Incoming and Outgoing Shipments in 1 STEP Using Odoo 17Celine George
 
Contemporary philippine arts from the regions_PPT_Module_12 [Autosaved] (1).pptx
Contemporary philippine arts from the regions_PPT_Module_12 [Autosaved] (1).pptxContemporary philippine arts from the regions_PPT_Module_12 [Autosaved] (1).pptx
Contemporary philippine arts from the regions_PPT_Module_12 [Autosaved] (1).pptxRoyAbrique
 
Interactive Powerpoint_How to Master effective communication
Interactive Powerpoint_How to Master effective communicationInteractive Powerpoint_How to Master effective communication
Interactive Powerpoint_How to Master effective communicationnomboosow
 
How to Make a Pirate ship Primary Education.pptx
How to Make a Pirate ship Primary Education.pptxHow to Make a Pirate ship Primary Education.pptx
How to Make a Pirate ship Primary Education.pptxmanuelaromero2013
 
ECONOMIC CONTEXT - LONG FORM TV DRAMA - PPT
ECONOMIC CONTEXT - LONG FORM TV DRAMA - PPTECONOMIC CONTEXT - LONG FORM TV DRAMA - PPT
ECONOMIC CONTEXT - LONG FORM TV DRAMA - PPTiammrhaywood
 
Introduction to ArtificiaI Intelligence in Higher Education
Introduction to ArtificiaI Intelligence in Higher EducationIntroduction to ArtificiaI Intelligence in Higher Education
Introduction to ArtificiaI Intelligence in Higher Educationpboyjonauth
 
BASLIQ CURRENT LOOKBOOK LOOKBOOK(1) (1).pdf
BASLIQ CURRENT LOOKBOOK  LOOKBOOK(1) (1).pdfBASLIQ CURRENT LOOKBOOK  LOOKBOOK(1) (1).pdf
BASLIQ CURRENT LOOKBOOK LOOKBOOK(1) (1).pdfSoniaTolstoy
 
call girls in Kamla Market (DELHI) 🔝 >༒9953330565🔝 genuine Escort Service 🔝✔️✔️
call girls in Kamla Market (DELHI) 🔝 >༒9953330565🔝 genuine Escort Service 🔝✔️✔️call girls in Kamla Market (DELHI) 🔝 >༒9953330565🔝 genuine Escort Service 🔝✔️✔️
call girls in Kamla Market (DELHI) 🔝 >༒9953330565🔝 genuine Escort Service 🔝✔️✔️9953056974 Low Rate Call Girls In Saket, Delhi NCR
 
Class 11 Legal Studies Ch-1 Concept of State .pdf
Class 11 Legal Studies Ch-1 Concept of State .pdfClass 11 Legal Studies Ch-1 Concept of State .pdf
Class 11 Legal Studies Ch-1 Concept of State .pdfakmcokerachita
 
Alper Gobel In Media Res Media Component
Alper Gobel In Media Res Media ComponentAlper Gobel In Media Res Media Component
Alper Gobel In Media Res Media ComponentInMediaRes1
 

Recently uploaded (20)

The Most Excellent Way | 1 Corinthians 13
The Most Excellent Way | 1 Corinthians 13The Most Excellent Way | 1 Corinthians 13
The Most Excellent Way | 1 Corinthians 13
 
Código Creativo y Arte de Software | Unidad 1
Código Creativo y Arte de Software | Unidad 1Código Creativo y Arte de Software | Unidad 1
Código Creativo y Arte de Software | Unidad 1
 
Staff of Color (SOC) Retention Efforts DDSD
Staff of Color (SOC) Retention Efforts DDSDStaff of Color (SOC) Retention Efforts DDSD
Staff of Color (SOC) Retention Efforts DDSD
 
POINT- BIOCHEMISTRY SEM 2 ENZYMES UNIT 5.pptx
POINT- BIOCHEMISTRY SEM 2 ENZYMES UNIT 5.pptxPOINT- BIOCHEMISTRY SEM 2 ENZYMES UNIT 5.pptx
POINT- BIOCHEMISTRY SEM 2 ENZYMES UNIT 5.pptx
 
Presentation by Andreas Schleicher Tackling the School Absenteeism Crisis 30 ...
Presentation by Andreas Schleicher Tackling the School Absenteeism Crisis 30 ...Presentation by Andreas Schleicher Tackling the School Absenteeism Crisis 30 ...
Presentation by Andreas Schleicher Tackling the School Absenteeism Crisis 30 ...
 
18-04-UA_REPORT_MEDIALITERAСY_INDEX-DM_23-1-final-eng.pdf
18-04-UA_REPORT_MEDIALITERAСY_INDEX-DM_23-1-final-eng.pdf18-04-UA_REPORT_MEDIALITERAСY_INDEX-DM_23-1-final-eng.pdf
18-04-UA_REPORT_MEDIALITERAСY_INDEX-DM_23-1-final-eng.pdf
 
Concept of Vouching. B.Com(Hons) /B.Compdf
Concept of Vouching. B.Com(Hons) /B.CompdfConcept of Vouching. B.Com(Hons) /B.Compdf
Concept of Vouching. B.Com(Hons) /B.Compdf
 
microwave assisted reaction. General introduction
microwave assisted reaction. General introductionmicrowave assisted reaction. General introduction
microwave assisted reaction. General introduction
 
Incoming and Outgoing Shipments in 1 STEP Using Odoo 17
Incoming and Outgoing Shipments in 1 STEP Using Odoo 17Incoming and Outgoing Shipments in 1 STEP Using Odoo 17
Incoming and Outgoing Shipments in 1 STEP Using Odoo 17
 
Contemporary philippine arts from the regions_PPT_Module_12 [Autosaved] (1).pptx
Contemporary philippine arts from the regions_PPT_Module_12 [Autosaved] (1).pptxContemporary philippine arts from the regions_PPT_Module_12 [Autosaved] (1).pptx
Contemporary philippine arts from the regions_PPT_Module_12 [Autosaved] (1).pptx
 
Interactive Powerpoint_How to Master effective communication
Interactive Powerpoint_How to Master effective communicationInteractive Powerpoint_How to Master effective communication
Interactive Powerpoint_How to Master effective communication
 
How to Make a Pirate ship Primary Education.pptx
How to Make a Pirate ship Primary Education.pptxHow to Make a Pirate ship Primary Education.pptx
How to Make a Pirate ship Primary Education.pptx
 
Model Call Girl in Tilak Nagar Delhi reach out to us at 🔝9953056974🔝
Model Call Girl in Tilak Nagar Delhi reach out to us at 🔝9953056974🔝Model Call Girl in Tilak Nagar Delhi reach out to us at 🔝9953056974🔝
Model Call Girl in Tilak Nagar Delhi reach out to us at 🔝9953056974🔝
 
9953330565 Low Rate Call Girls In Rohini Delhi NCR
9953330565 Low Rate Call Girls In Rohini  Delhi NCR9953330565 Low Rate Call Girls In Rohini  Delhi NCR
9953330565 Low Rate Call Girls In Rohini Delhi NCR
 
ECONOMIC CONTEXT - LONG FORM TV DRAMA - PPT
ECONOMIC CONTEXT - LONG FORM TV DRAMA - PPTECONOMIC CONTEXT - LONG FORM TV DRAMA - PPT
ECONOMIC CONTEXT - LONG FORM TV DRAMA - PPT
 
Introduction to ArtificiaI Intelligence in Higher Education
Introduction to ArtificiaI Intelligence in Higher EducationIntroduction to ArtificiaI Intelligence in Higher Education
Introduction to ArtificiaI Intelligence in Higher Education
 
BASLIQ CURRENT LOOKBOOK LOOKBOOK(1) (1).pdf
BASLIQ CURRENT LOOKBOOK  LOOKBOOK(1) (1).pdfBASLIQ CURRENT LOOKBOOK  LOOKBOOK(1) (1).pdf
BASLIQ CURRENT LOOKBOOK LOOKBOOK(1) (1).pdf
 
call girls in Kamla Market (DELHI) 🔝 >༒9953330565🔝 genuine Escort Service 🔝✔️✔️
call girls in Kamla Market (DELHI) 🔝 >༒9953330565🔝 genuine Escort Service 🔝✔️✔️call girls in Kamla Market (DELHI) 🔝 >༒9953330565🔝 genuine Escort Service 🔝✔️✔️
call girls in Kamla Market (DELHI) 🔝 >༒9953330565🔝 genuine Escort Service 🔝✔️✔️
 
Class 11 Legal Studies Ch-1 Concept of State .pdf
Class 11 Legal Studies Ch-1 Concept of State .pdfClass 11 Legal Studies Ch-1 Concept of State .pdf
Class 11 Legal Studies Ch-1 Concept of State .pdf
 
Alper Gobel In Media Res Media Component
Alper Gobel In Media Res Media ComponentAlper Gobel In Media Res Media Component
Alper Gobel In Media Res Media Component
 

Please go to the New York State Health Dept.httpswww.health.docx

  • 1. Please go to the New York State Health Dept. https://www.health.ny.gov/statistics/vital_statistics/2013/ Census Bureau http://quickfacts.census.gov/qfd/states/36000.html Before you start the specific assignment you may want to examine the information available. Area I Area II Source of Data Population Birth Rate per 1000 Mortality Rate per 100,000 Major Causes of Death Top 3 in order Level of Education % high school grad % college grad % adv Level of Income Median household in $ Racial/Ethnic composition
  • 2. Use data from New York State Health Dept. and the Census Bureau to compare two communities of your choice. You may also want to try the Centers for Disease Prevention and Control CDC at www.cdc.gov. Another strategy to get information is to "google" your topic e.g. White Plains, New York demographic and mortality data. The communities may be counties, cities, states or any combination of the two: eg. Westchester and Rockland, White Plains and Yonkers, Overall Westchester and White Plains etc., Bronx and NYC, Brooklyn and Queens, Brooklyn and Statewide or Citywide, New York State and North Carolina etc. HINT Before you finalize the choice of community make sure that you are able to locate material on it. Please put the data in a table see above. Write a narrative -- a paragraph in length comparing the two areas. (I would suggest that online students prepare a paper copy for themselves). Be sure that your name appears on the report itself if you submit it as an attachment. Also, check that your data clearly indicates whether the number is a number, rate or percentage. If figure is a rate indicate the relevant population e.g. per 1,000, 10,000, per 100,000. See text for more information on rates. You may attach map(s) and data table from NY State Health Dept. and the Census Bureau to your report. However, the table must report the data. Grading-- A Complete report and comparison of two areas-- Thoughtful comparison of the two areas. Sources of information ( for each item of information) clearly indicated. Provides a useful profile of socio-economic and health profile for areas selected.
  • 3. B/B+ Good chart, good comparison. Sources of information clearly indicated. C Comparison missing items, narrative comparison brief D Assignment begun but not substantially completed F Did not do assignment Discussion Folder Open Email your answer to me in the course email before 6 p.m on the due date. Post your answer here after 6 p.m on the due date. Article on Puerto Rican in US See article. Has data from CDC National Center for Health Statistics Health of Hispanic Adults: US 2010-2014 Centers for Disease Control and Prevention. CDC twenty four seven. Saving Lives, Protecting People CDC A-Z Index MENU CDC A-Z SEARCH National Center for Health Statistics Publications and Information Products
  • 4. Data Briefs Health of Hispanic Adults: United States, 2010–2014 Health E-Stats Health, United States Life Tables National Health Statistics Reports National Vital Statistics Reports Vital and Health Statistics Series Vital Statistics Rapid Release Other Publications Bibliographies Available on the NCHS Website Citations for NCHS Publications and Electronic Media Errata List Listservs Ordering Printed Publications Related Sites Get E-mail Updates Data Visualization Gallery FastStats NHIS Early Release Program MMWR QuickStats Government Printing Office Bookstore CDC NCHS Publications and Information Products Data Briefs Health of Hispanic Adults: United States, 2010–2014 Recommend on Facebook Tweet Twitter Facebook
  • 5. Pinterest LinkedIn Email Digg Add this to your site On this Page Key findings Did the age-adjusted percentage of adults who were in fair or poor health vary among Hispanic subgroups? Did the age-adjusted percentage of adults with multiple chronic conditions differ among Hispanic subgroups? Did the age-adjusted percentage of adults with serious psychological distress vary among Hispanic subgroups? Did the age-adjusted percentage of adults who were unable to work due to health problems differ among Hispanic subgroups? Did the age-adjusted percentage of adults who had a social participation restriction differ among Hispanic subgroups? Summary Definitions Data source and methods About the authors References Suggested citation NCHS Data Brief No. 251, June 2016 PDF Version (http://www.cdc.gov/nchs/data/databriefs/db251.pdf) (388 KB) Jacqueline W. Lucas, M.P.H, Gulnur Freeman, M.P.A., and Patricia F. Adams Key findings Data from the National Health Interview Survey, 2010–2014 Overall, Puerto Rican adults consistently reported poorer health status than non-Hispanic adults.
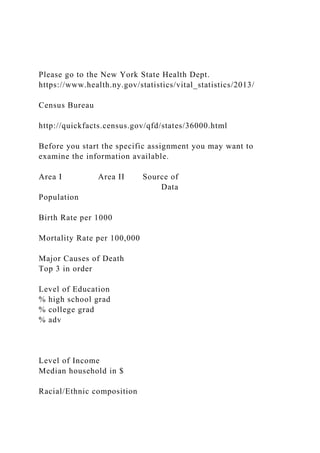
  • 6. Puerto Rican (19.2%) and Mexican (17.4%) adults were more likely than Central or South American (12.3%) and Cuban (14.7%) adults to be in fair or poor health. Puerto Rican adults (27.3%) were more likely than Central or South American adults (16.6%) to have had multiple chronic conditions. Puerto Rican adults (6.2%) were nearly twice as likely to report serious psychological distress in the past 30 days compared with Central or South American adults (3.3%). Puerto Rican adults (11.4%) were more likely than Central or South American (2.9%), Cuban (3.9%), and Mexican (4.8%) adults to be unable to work due to health problems. There are 54 million Hispanic persons living in the United States, making them the largest minority group in the country ( 1 ). Disaggregated data on Hispanic subgroups are needed to understand the health of Hispanic persons of diverse backgrounds ( 2 ). This report presents selected estimates of health measures for all Hispanic adults aged 18 and over and for the following four Hispanic subgroups: Central or South American, Cuban, Mexican, and Puerto Rican adults. Comparisons are also made across the subgroups and with the non-Hispanic U.S. adult population as a whole. Keywords : health status, chronic conditions, disparities, National Health Interview Survey Did the age-adjusted percentage of adults who were in fair or poor health vary among Hispanic subgroups? Puerto Rican (19.2%) and Mexican (17.4%) adults were more likely than Central or South American (12.3%) and Cuban (14.7%) adults to be in fair or poor health (
  • 7. Figure 1 ). The age-adjusted percentage of Hispanic adults (16.8%) with fair or poor health was higher compared with non-Hispanic U.S. adults (11.9%). Cuban, Mexican, and Puerto Rican adults were all more likely than non-Hispanic U.S. adults to be in fair or poor health. No significant difference was observed in the prevalence of fair or poor health between Central or South American adults and non-Hispanic U.S. adults. Figure 1. Age-adjusted percentage of adults aged 18 and over who were in fair or poor health, by ethnicity and Hispanic subgroup: United States, 2010–2014 (http://www.cdc.gov/nchs/images/databriefs/251- 300/db251_fig1.png) 1 Significantly different from non-Hispanic U.S. population ( p < 0.05). 2 Significantly different from Mexican ( p < 0.05). 3 Significantly different from Puerto Rican ( p < 0.05). 4 Significantly different from Central or South American ( p < 0.05). NOTES: Age-adjusted by the direct method to the 2000 U.S. Census population using age groups: 18–44, 45–64, 65–74, and 75 and over. Access data table for Figure 1 . SOURCE: NCHS, National Health Interview Survey, 2010–
  • 8. 2014. Did the age-adjusted percentage of adults with multiple chronic conditions differ among Hispanic subgroups? Puerto Rican (27.3%) and Mexican (20.8%) adults were more likely to have two or more chronic conditions—including hypertension, coronary heart disease, stroke, diabetes, cancer, arthritis, hepatitis, emphysema, weak or failing kidneys, or asthma—compared with Central or South American (16.6%) and Cuban (18.6%) adults ( Figure 2 ). The age-adjusted percentage of Hispanic adults (20.8%) who have had multiple chronic conditions was lower compared with non-Hispanic U.S. adults (24.6%). Central or South American, Cuban, and Mexican adults were less likely to have had multiple chronic conditions compared with non-Hispanic U.S. adults, but Puerto Rican adults were more likely than non-Hispanic U.S. adults to have had multiple chronic conditions. Figure 2. Age-adjusted percentage of adults aged 18 and over who had multiple chronic conditions, by ethnicity and Hispanic subgroup: United States, 2010–2014 (http://www.cdc.gov/nchs/images/databriefs/251- 300/db251_fig2.png) 1 Significantly different from non-Hispanic U.S. population ( p < 0.05). 2 Significantly different from Mexican ( p < 0.05). 3 Significantly different from Puerto Rican (
  • 9. p < 0.05). 4 Significantly different from Central or South American ( p < 0.05). NOTES: Age-adjusted by the direct method to the 2000 U.S. Census population using age groups: 18–44, 45–64, 65–74, and 75 and over. Access data table for Figure 2 . SOURCE: NCHS, National Health Interview Survey, 2010– 2014. Did the age-adjusted percentage of adults with serious psychological distress vary among Hispanic subgroups? The age-adjusted percentage of serious psychological distress in the past 30 days was higher among Puerto Rican adults (6.2%) compared with Central or South American (3.3%), Cuban (3.7%), and Mexican (3.9%) adults ( Figure 3 ). Puerto Rican adults (6.2%) were nearly twice as likely to report serious psychological distress in the past 30 days compared with Central or South American adults (3.3%). Hispanic adults (4.1%) were more likely to have had serious psychological distress in the past 30 days compared with non- Hispanic U.S. adults (3.2%). There were no significant differences in the age-adjusted percentages of adults with serious psychological distress among Central or South American, Cuban, and Mexican adults. There was also no significant difference between these groups and the non-Hispanic U.S. population. Figure 3. Age-adjusted percentage of adults aged 18 and over who had serious psychological distress, by ethnicity and Hispanic subgroup: United States, 2010–2014 (http://www.cdc.gov/nchs/images/databriefs/251-
  • 10. 300/db251_fig3.png) 1 Significantly different from non-Hispanic U.S. population ( p < 0.05). 2 Significantly different from Puerto Rican ( p < 0.05). NOTES: Age-adjusted by the direct method to the 2000 U.S. Census population using age groups: 18–44, 45–64, 65–74, and 75 and over. Access data table for Figure 3 . SOURCE: NCHS, National Health Interview Survey, 2010– 2014. Did the age-adjusted percentage of adults who were unable to work due to health problems differ among Hispanic subgroups? Puerto Rican adults (11.4%) were more likely than Central or South American (2.9%), Cuban (3.9%), Mexican (4.8%), and non-Hispanic U.S. (6.8%) adults to be unable to work due to health problems ( Figure 4 ). Mexican adults were more likely to be unable to work due to health problems compared with Central or South American adults. Hispanic adults (5.2%) were less likely than non-Hispanic U.S. adults (6.8%) to be unable to work due to health problems. Figure 4. Age-adjusted percentage of adults aged 18–64 who were unable to work due to health problems, by ethnicity and Hispanic subgroup: United States, 2010–2014 (http://www.cdc.gov/nchs/images/databriefs/251- 300/db251_fig4.png) 1 Significantly different from non-Hispanic U.S. population (
  • 11. p < 0.05). 2 Significantly different from Mexican ( p < 0.05). 3 Significantly different from Puerto Rican ( p < 0.05). NOTES: Age-adjusted by the direct method to the 2000 U.S. Census population using age groups: 18–44, 45–64, 65–74, and 75 and over. Access data table for Figure 4 . SOURCE: NCHS, National Health Interview Survey, 2010– 2014. Did the age-adjusted percentage of adults who had a social participation restriction differ among Hispanic subgroups? After age adjustment, Puerto Rican adults (6.3%) were more likely than Central or South American (3.1%), Cuban (3.1%), Mexican (4.7%), and non-Hispanic U.S. (3.9%) adults to have had a social participation restriction ( Figure 5 ). Mexican adults were more likely than Cuban and Central or South American adults to have had a social participation restriction. Hispanic adults (4.4%) were more likely than non-Hispanic U.S. adults (3.9%) to have had a social participation restriction. Central or South American (3.1%) and Cuban (3.1%) adults were equally as likely to have had a social participation restriction, and both groups were less likely than non-Hispanic adults to have had a social participation restriction. Figure 5. Age-adjusted percentage of adults aged 18 and over who had a social participation restriction, by ethnicity and
  • 12. Hispanic subgroup: United States, 2010–2014 (http://www.cdc.gov/nchs/images/databriefs/251- 300/db251_fig5.png) 1 Significantly different from non-Hispanic U.S. population ( p < 0.05). 2 Significantly different from Mexican ( p < 0.05). 3 Significantly different from Puerto Rican ( p < 0.05). NOTES: Age-adjusted by the direct method to the 2000 U.S. Census population using age groups: 18–44, 45–64, 65–74, and 75 and over. Access data table for Figure 5 . SOURCE: NCHS, National Health Interview Survey, 2010– 2014. Summary This report provides national estimates of fair or poor health, multiple chronic conditions, serious psychological distress, inability to work due to health reasons, and social participation restrictions for four subgroups of Hispanic adults aged 18 and over in the United States. Compared with non-Hispanic U.S. adults, Hispanic adults had higher rates of fair or poor health, social participation restrictions, and serious psychological distress, but they had lower rates of being unable to work due to health reasons and having multiple chronic conditions. The U.S. Hispanic population consists of individuals originally from various countries in North America, Central or South America, the Caribbean, and Europe. Although the Hispanic population in the United States may share a common language, there is considerable variation among subgroups in terms of
  • 13. cultural background, socioeconomic status, and care-seeking behaviors. These analyses showed that Central and South American adults had similar or better health than the non-Hispanic U.S. population, while Puerto Rican adults had worse health than the non-Hispanic U.S. population. Puerto Rican adults were also generally more likely to have poorer health compared with other Hispanic subgroups, and Central or South American adults were generally less likely to have poorer health compared with other Hispanic subgroups. The findings in this report are consistent with previous studies, which show disparities among Hispanic subgroups ( 3 , 4 ), and highlight the importance of considering Hispanic subgroups when examining Hispanic health. Definitions Fair or poor health status : Family respondents were asked to assess the health of all family members, specifically, whether their “health in general is excellent, very good, good, fair, or poor?” When the sample adult is not the family respondent, this information is reported by a proxy. Multiple chronic conditions : Based on a positive response to two or more of the separate survey questions that assess chronic conditions, including whether adults had ever been told by a doctor or other health professional that they had hypertension, coronary heart disease, stroke, diabetes, cancer, arthritis, hepatitis, or emphysema; had experienced weak or failing kidneys or chronic bronchitis during the past 12 months; or currently had asthma ( 5 ). Serious psychological distress
  • 14. : Based on responses from six separate survey questions about how often a respondent felt sad, nervous, restless, hopeless, that everything was an effort, or worthless during the past 30 days.The response codes (0–4) for each of the six items are summed to yield a scale with a 0–24 range. A value of 13 or more for this scale is used here to define serious psychological distress ( 6 ). Adults with missing data for any of the six psychological distress questions were excluded from the calculation of the serious psychological distress indicator for this analysis (about 1.5% of respondents from 2010 to 2014). Unable to work : Based on the questions, ‘‘Does a physical, mental, or emotional problem now keep [family members 18 years of age or older] from working at a job or business?’’ and for persons not kept from working, ‘‘Are [family members 18 years of age or older] limited in the kind or amount of work they can do because of a physical, mental, or emotional problem?’’ For this report, the age group is limited to those aged 18–64. When the sample adult is not the family respondent, this information is reported by a proxy. Social participation restriction : Respondents who reported “very difficult” or “can’t do at all” to either of the following survey questions were defined as having had social participation restriction: “By yourself, and without using any special equipment, how difficult is it for you to (a) go out to things like shopping, movies, or sporting events, and (b) participate in social activities such as visiting friends, attending clubs and meetings, or going to parties?” Data source and methods Data from the 2010–2014 National Health Interview Survey (NHIS) were used for this analysis. NHIS data are collected continuously throughout the year by the National Center for Health Statistics. NHIS collects information about the health
  • 15. and health care of the civilian noninstitutionalized U.S. population. Interviews are conducted in respondents’ homes, but follow-ups to complete interviews may be conducted by telephone. In 2010–2014, information was collected on a total of 165,950 sample adults aged 18 and over. There were 28,880 Hispanic adults in the Sample Adult files, including 17,392 Mexican or Mexican American, 4,723 Central or South American, 2,846 Puerto Rican, 1,484 Cuban, and 2,435 other Hispanic adults. These groups comprise 60.2%, 16.4%, 10.0%, 5.0%, and 8.0% of the Hispanic population, respectively. To control for differences in age distributions within Hispanic subgroups and the effect of age on the health characteristics studied here, estimates were age-adjusted using the projected 2000 U.S. population from the U.S. Census Bureau as the standard population and the following age groups: 18–44, 45–64, 65–74, and 75 and over. Estimates for adults aged 18–64 were age- adjusted using age groups 18–24, 25–44, and 45–64. Differences between percentages were evaluated using two- sided significance tests at the p < 0.05 level. All differences reported are statistically significant unless otherwise indicated. For further information about NHIS, including the questionnaire, visit the NHIS website . NHIS is designed to yield a nationally representative sample, and this analysis used the sample adult weight to produce national estimates. Data weighting procedures are described elsewhere ( 7 ). Estimates for this analysis were calculated using SUDAAN software ( 8 ).
  • 16. About the authors Jacqueline W. Lucas, Gulnur Freeman, and Patricia F. Adams are with the National Center for Health Statistics, Division of Health Interview Statistics. References U.S. Census Bureau. Facts for features: Hispanic Heritage Month 2014: Sept. 15–Oct. 15 . Washington, D.C. 2014. Daviglus ML, Talavera GA, Avilés-Santa ML, Allison M, Cai J, Criqui MH, et.al. Prevalence of major cardiovascular risk factors and cardiovascular diseases among Hispanic/Latino individuals of diverse backgrounds in the United States. JAMA 308(17):1775–84. 2012. Dominguez K, Penman-Aguilar A, Chang MH, et.al. Vital signs: Leading causes of death, prevalence of diseases and risk factors, and use of health services among Hispanics in the United States—2009–2013 . MMWR Morb Mortal Wkly Rep 64(17):469–78. 2015. Hajat A, Lucas JB, Kington R. Health outcomes among Hispanic subgroups: United States, 1992–95 . Advance data from vital and health statistics; no. 310. Hyattsville, Maryland: National Center for Health Statistics. 2000. Goodman RA, Posner SF, Huang ES, et.al. Defining and measuring chronic conditions: Imperatives for research, policy, program, and practice . Prev Chronic Dis. 2013. Kessler RC, Barker PR, Colpe LJ, Epstein JF, Gfoerer JC, Hiripi E, et al. Screening for serious mental illness in the general population. Arch Gen Psychiatry 60(2):184–9. 2003. Parsons VL, Moriarity CL, Jonas K, et al. Design and estimation for the National Health Interview Survey, 2006–2015 . National Center for Health Statistics. Vital Health Stat 2(165).
  • 17. 2014. RTI International. SUDAAN (Release 11.0.0) [computer software]. 2012. Suggested citation Lucas JW, Freeman G, Adams PF. Health of Hispanic adults: United States, 2010–2014. NCHS data brief, no 251. Hyattsville, MD: National Center for Health Statistics. 2016. Copyright information All material appearing in this report is in the public domain and may be reproduced or copied without permission; citation as to source, however, is appreciated. National Center for Health Statistics Charles J. Rothwell, M.S., M.B.A., Director Jennifer H. Madans, Ph.D., Associate Director for Science Division of Health Interview Statistics Marcie L. Cynamon, Director Stephen J. Blumberg, Ph.D., Associate Director for Science Related Sites Get E-mail Updates (http://www.cdc.gov/nchs/govdelivery.htm) Data Visualization Gallery FastStats (http://www.cdc.gov/nchs/fastats/default.htm) NHIS Early Release Program (http://www.cdc.gov/nchs/nhis/releases.htm) MMWR QuickStats (http://www.cdc.gov/nchs/pressroom/quickstats.htm) Government Printing Office Bookstore
  • 18. File Formats Help: How do I view different file formats (PDF, DOC, PPT, MPEG) on this site? Adobe PDF file Microsoft PowerPoint file Microsoft Word file Microsoft Excel file Audio/Video file Apple Quicktime file RealPlayer file Text file Zip Archive file SAS file ePub file RIS file Page last reviewed: June 17, 2016 Page last updated: June 17, 2016 Content source: Email Recommend Tweet YouTube Instagram Listen Watch RSS ABOUT About CDC Jobs Funding LEGAL
  • 19. Policies Privacy FOIA No Fear Act OIG 1600 Clifton Road Atlanta , GA 30329-4027 USA 800-CDC-INFO (800-232-4636) , TTY: 888-232-6348 Email CDC-INFO