SlideShare a Scribd company logo
HEAT RECOVERY DESIGN FOR
STARBUCKS STORE RETROFIT
LABORATORY BENCH TEST
April, 2016
Prepared By:
Dr. Thomas Bradley
Associate Professor
College of Engineering
Colorado State
University
Chris Anderson
Graduate Research
Assistant
College of Engineering
Colorado State
University
Becca Stock
Undergraduate
Research Assistant
College of Engineering
Colorado State
University
Stephanie Barr
Project Manager
Institute for the Built
Environment
Colorado State University
Prepared For:
Urano Robinson
Director– Global Innovation&Technology –Global R&D
Starbucks Coffee
1
CONTENTS
Executive Summary ............................................................................................................................3
Introduction.......................................................................................................................................4
Testing Model Assumptions ................................................................................................................4
Air Conditioning System Savings ......................................................................................................5
Total Waste Heat.........................................................................................................................5
Total Air Conditioning Hours........................................................................................................6
Hot Water Preheat..........................................................................................................................7
Refrigerator Efficiency.....................................................................................................................8
Part 1: Laboratory vs. In-Store Data Logging..................................................................................8
Part 2: Refrigeration Efficiency as a Function of Water Loop Temperature......................................9
Part 3: Water-Cooled vs. Fan-Cooled..........................................................................................10
System Energy Use........................................................................................................................12
Pump........................................................................................................................................13
Fan...........................................................................................................................................13
Costs............................................................................................................................................14
Updated Model................................................................................................................................14
Sensitivity Analysis............................................................................................................................15
Next steps........................................................................................................................................16
Areasfor further research.................................................................................................................16
Appendix..........................................................................................................................................17
Appendix A...................................................................................................................................17
Building Energy Model...............................................................................................................17
Appendix B...................................................................................................................................22
Heat Rejection Calculations........................................................................................................22
Appendix C...................................................................................................................................23
Fan Duty Cycle ..........................................................................................................................23
Appendix D...................................................................................................................................26
Refrigeration Efficiency..............................................................................................................26
Small Refrigeration Units (1 door refrigerator, 1 door freezer, 2 door refrigerator)........................26
Large Refrigeration Units(vertical food case, horizontal food case,ice machine) ..........................28
Refrigeration Load vs. Power Consumption.................................................................................30
Appendix E...................................................................................................................................31
2
3
EXECUTIVE SUMMARY
In accordance with task order #3 of the master research agreement between Colorado State University
and StarbucksCoffee Company,the teamfromColorado State Universitywasresponsible forperforming
a heat recovery and mechanical efficiency feasibility assessment. This assessment was completed on
December15,2015. Aspart of the feasibilityassessment,anaddendumtothe masterresearchagreement
was included. This addendum outlined a plan for preliminary laboratory testing of the water loop heat
recovery system prior to the installation of the final design in store #14944.
The objective of thisreportisto documentthe resultsof thislaboratorytestingandtomodifythe
systemperformance modelaccordingly.The followingfigureprovidesaside-by-sidecomparisonof the
valuesdetailedinthisreportandthe original modeledvalues:
Figure 1: Results from Laboratory Testing, Original Modeled Values
Reduced Air
Conditioning Load
13,050 kWh $2,870
Increased Heating
Load
-380 therms -$400
Hot Water Preheat 9,100 kWh $1,980
Refrigeration
Efficiency
-3,400 kWh -$750
System Energy Use
-4,660 kWh -$1,030
Equipment
Labor
System Costs
Simple Payback
2.8 years
Annual System Energy Savings
$4,200
$3,500
Reduced Air
Conditioning Load
15,000 kWh $3,300
Increased Heating
Load
- -
Hot Water Preheat 8,140 kWh $1,790
Refrigeration
Efficiency
2,700 kWh $600
System Energy Use -4,660 kWh -$1,030
Equipment
Labor
1.8 years
Annual System Energy Savings
System Costs
$4,800
$4,000
Simple Payback
Laboratory Tested Values Original Model Values
4
INTRODUCTION
The firstdesignreportsubmittedbythe teamfromCSU outlinedfouroriginaldesignoptions,and
providedadetailed feasibilityanalysisforthe designoptionselected.The final designoptionselected
was the waterloopheatrecoverysystem.Asperthe masterresearchand developmentagreement
betweenCSUandStarbucksCoffee Company,the final designwill be installed inStarbucksstore
#14944, locatedat 1708 S. College Avenue inFortCollins,CO.
As an addendumtothe masterresearchanddevelopmentagreement,itwasdeterminedthatpriorto
the actual in-store installation the systemshouldbe testedinalaboratoryto minimize financial risks
associatedwithuncertaintiessurroundingthe system’sperformance.Theseuncertaintiesincluded:
validationof waterloopeffectivenessproviding appropriatecondensercooling;heatoutputof each
refrigerationunitatdifferentoperatingconditions;refrigerationefficiencyvariationdue tochangesin
environmental conditions;andproposedsystemenergyconsumption.Thisreportoutlinesthe resultsof
the laboratorytestingdirectedtowardsaddressingeachof these uncertainties.
TESTING MODEL ASSUMPTIONS
A laboratorymockupof the proposedheatrecoverysystemwasdesignedtotestasmany components
of the systemaspossible inthe lab.A schematicof the systemisshownin Figure 2.
Figure 2: Lab Set-up Schematic
5
The refrigerationequipmentusedinthe labsetupwasprovidedbyStarbucksinthe standard air-cooled
conditionwiththe exceptionof the ice machine.A licensedrefrigerationcontractorwasusedto install
the watercooledcondensersoneachof the units. The condensingunitswerethenconnectedby¾”
PEX waterline.PVC“T”fittingswere usedtohouse watertemperature loggers.Theseloggerscould be
placedat any pointinthe cycle dependingonthe requirementsof eachindividualtest.The loopis
controlledbyatemperature sensorwhichcyclesthe fantomaintainasteadywater looptemperature.
There isalso a deaeratortankjustbefore the pump,whichisdesignedtopreventairbubblesinthe
system.This tankalsoallowswatertobe addedtofill the systemasthere isno waterconnectioninthe
lab.In the sectionsbelow,detailsof eachtestrun andthe resultsof eachare outlinedbelow bymodel
component.
Air Conditioning System Savings
There are twofactors that contribute tothe air conditioningsavingsof the system:the amountof waste
heatremovedbythe systemandthe numberof hoursperyear that the air conditioningsystemis
running.
Total Waste Heat
To understand how much waste heat each of the refrigerationunits was producing,
temperature before and after the condenser was measured. This allowedthe total
unit to be calculated as outlinedin Appendix B
Heat RejectionCalculations.The heatproducedbyeachunit isshownin Table 1.
Table 1: Waste Heat Produced by Unit
RefrigerationUnit
Waste Heat
(Btu/h)
1-Door Refrigerator 590
2-Door Refrigerator 1,060
1-Door Freezer 1,080
Vertical FoodCase 7,040
Horizontal FoodCase 3,390
Ice Machine 8,620
Total 21,780
To confirmthisdata, the total heatload of the systemwasmeasuredduringthe testrun. A sample of
the data is shownin Figure 3.
6
Figure 3: Total Waste Heat from Refrigeration Units
By comparingthe data derivedfromthese twomethods,the total waste heatcanbe confirmedtobe
about22,000 btuper hour.
Total Air Conditioning Hours
Since the laboratory set up couldn’t be used to determine to number of hours per
conditioning system is running, a simple building energy model was built. In this
gains from equipment and people were compared to estimated heat gains or losses
and the building walls and roof. If the total heat gains were larger than the losses,
system would be required to remove the excess heat. For details on the building
energy model see Appendix A
BuildingEnergyModel.The resultsof thismodel forastore withthe same layoutas the model store but
locatedinSan Diego,CA are shownin Figure 4.
0
5,000
10,000
15,000
20,000
25,000
30,000
35,000
13:22
13:24
13:26
13:28
13:30
13:32
13:34
13:36
13:39
13:41
13:43
13:45
13:47
13:49
13:51
13:53
13:55
13:57
13:59
14:01
14:04
14:06
14:08
14:10
14:12
14:14
14:16
14:18
Btu/h SystemHeat Output
7
Figure 4: Building Heat Loss/Gain
From thishistogram,we canestimate thatthe numberof hoursthe air conditioningsystemrunsfor
approximately 7,291 hoursper yearor about 10 monthsperyear.For the remaining1,469 hoursper
year,the buildingisinheatingmode.Thismeansthatthe systemactuallycausesthe heatingsystemto
use more energysince itisnot beingassistedbythe waste heatinthe building.
Usingthe waste heatvaluesfromourlab testingandthe buildingsystemmodel,the updatedestimate
of the air conditioning savingsisasfollows:
Air Conditioning Savings: 13,050 kWh per year
Additional Heating Costs: 380 therms per year
Hot Water Preheat
In the data presentedinDecember,the wateruse atthe model store hadbeenloggedandusedwiththe
efficiencydataof the heatexchangerto calculate the expectedheatrecoverypotential.These
calculationsusedawaterlooptemperature of 100°F. Duringlaboratorytestingitwasdeterminedthat
the refrigeratorsstopoperatingproperlywithwaterlooptemperaturesabove 100°F,so the heat
recovery calculationswere repeatedwiththe three looptesttemperatures:75°F,85°F, and 95°F. Due to
concernsaboutthe size of the indirecthot waterheaterforthe domestichotwaterpreheat, the heat
recoveryof the plate-and-frame heatexchangerwascalculatedforthisapplicationaswell.The results
are outlinedin Figure 5.
8
Figure 5: Preheat Savings by Loop Temperature
From these calculations,itwasdeterminedthatthe indirecthotwaterheatercanrecoverabout13%
more energywhenpreheatingwaterfor the domestichotwaterheaterthanthe plate-and-frame heat
exchanger.Giventhe space considerationsand consideringthatthe indirecthotwaterheaterisa larger
investmentthanthe plate-and-frameheatexchanger,itis recommendedthatthe plate-and-frame heat
exchangerbe usedforthe domestichotwaterpreheat aswell asthe coffee waterpreheat. By
comparingthese calculationstothe refrigerationefficiencydataitwasdeterminedthat95°F isthe
optimal looptemperaturetomaximizesavings.Thismeansthatthe estimatedtotal hotwaterpreheat
savingsisas follows:
Total Water Preheat Savings: 8,250 kWh per year
Refrigerator Efficiency
One of the mainobjectivesof the laboratorytestingwastoanalyze the effectof the water-cooled
condenserson the refrigerationefficiencyforeachunit.Thisstudycanbe dividedintothreemain
components:comparingthe laboratoryoperationtothe in-store operation,the refrigerationefficiency
changesat varyingwaterlooptemperatures,andcomparingthe air-cooledoperationtothe water-
cooledoperation.
Part 1: Laboratory vs. In-Store Data Logging
The goal of the firstpart of this studywas to determine arelationshipbetweenlaboratorydataandreal
worlddata.Due to space constraintsandissuesregardingthe disruptionof normal store operation,only
the three smaller,True Refrigeratorswere dataloggedinthe store.The powerdraw of the equivalent
refrigerationunitswere alsodataloggedinthe lab.A comparisonbetweenthe in-storedataandthe
laboratorydata forthese refrigeratorsisshownbelow:
0
1,000
2,000
3,000
4,000
5,000
6,000
75 80 85 90 95
EnergySavings(kWh/yr)
Water Loop temperature (°F)
DHW with Indirect Water
Heater
DHW with Plate and
Frame Heat Exchanger
Coffee Water
9
Table 2: In-Store Power Draw vs. Laboratory Power Draw
It isevidentthatthe in-store refrigeratorsoperateata much higheraverage power thanthe same units
inthe lab.There are several possiblereasonsforthis discrepancy.The firstpossibilityisthat the in-store
refrigeratorssee agreaterheatloadthan the laboratoryrefrigerators.The constantopeningandclosing
of the doorsallowsheatin,andultimatelyresultsinthe compressorworkingharderandlonger. There is
not an additional heatloaddue tothe foodstoredinthe refrigeratorsbecause itisall deliveredtothe
store cold.To account for the heatload discrepancy,the 14944 Starbucksstore was monitoredover the
course of a week,andthe numberof timeseachrefrigeratorwasopenedwascounted.Then,the
refrigeratorsinthe laboratorywere dataloggedagain,butthisincludingperiodicopeningsof the doors.
The resultsare shownbelow:
Table 3: Laboratory Testing, Simulated Store Operations
Thisstudydemonstratedthat loadconditions cannotaccountforthe discrepancybetweenrefrigerator
operationinthe laband inthe store. Anotherpossible cause isthe difference inthe ambientair
condition.The labiskeptat 70°F and the refrigeratorsare locatedinthe centerof a room where they
are well ventilated.Inthe store,the roomtemperature is setat68°F, but the refrigeratorsare located
againsta wall.It islikely thatthe airsurroundingthe condensersispoorlycirculatedandtherefore
significantlywarmerthanthe roomtemperature.Inaddition,the in-store refrigeratorsare olderand
may be sufferingfromwear-and-tearascomparedtothe newerlabunits. Instore testingwill be
requiredtoconfirmrefrigerationefficiencychangesundernormal operatingconditions.
Part 2: Refrigeration Efficiency as a Function of Water Loop Temperature
The secondpart of thisstudyfocusedonunderstandingthe effectof the waterlooptemperatureon the
efficiencyof the refrigerationunits. Several experimentswere conductedwhichinvolvedoperatingeach
refrigerator and data logging the entering water temperature for the condenser as well as the
refrigeratorpowerdraweachsecond overa periodof several hours.The temperaturewasincrementally
Unit
In-Store Average
Power Draw, W
Laboratory Average
Power Draw, W
1-Door Refrigerator 126.3 81.6
2-Door Refrigerator 460.2 182.3
1-Door Freezer 268.5 194
Unit
Number of
Openings per Hour
Resulting Laboratory
Average Power Draw, W
1-Door Refrigerator 0.33 75
2-Door Refrigerator 4.6 177
1-Door Freezer 1.8 209
10
varied to determine the refrigerator’s response to different water loop temperatures. The results are
shown in
Figure 6 below:
Figure 6: Refrigerator Power Consumption as a Function of Entering Water Temperature
For the three smallerrefrigerators,eachdatapointrepresentsanaveragedvalueoverone cycle of
refrigeration.Usingthe datapointsat each of the three temperature increments,anequationwas
11
developedforthe average powerof eachunitasa functionof the enteringwatertemperature tobe
usedformodelingpurposes.
For the two foodcases,eachpointrepresentsan averagedvalue overaperiodof aboutthree hoursof
operationata setwatertemperature.Forthe vertical foodcase, the compressorwasloadedduringthe
entire testinginterval forall testsof the water-cooledcondenser.Thisislikelyanindicationthatthe
condensercoil isundersized.
The ice machine wastreatedseparately.Accordingtomanufacturerspecifications,anice machine
operatingwithawater-cooledcondenserrequires4.3kilowatthoursper100 poundsof ice produced,or
0.043 kWh/lbof ice.Two water loop temperature incrementswere testedinlab,andinbothinstances,
the ice machine maintained anenergyconsumption within1% of manufacturerspecifications.
Therefore,itwasdeterminedthatwaterlooptemperature hadnegligible effectontotal power
consumption,butitwasnotedthat there wassome evidence of increasedbatchtimes,upto15%
longer,withhigherlooptemperatures.
Part 3: Water-Cooled vs. Fan-Cooled
Priorto installingthe water-cooledcondensers,all refrigerationunitswerefirsttestedwiththeir
standardair-cooledcondensers(excludingthe ice machine,whichwasshippedwithawater-cooled
condenser).
Duringlaboratorytesting describedinpart2, it was observedthatbothloadedpowerand dutycycle
were affectedbychangesinwaterlooptemperature.Consideringthe heatoutputof eachunitand the
workrequirementof the radiator,the operatingpointforthe waterlooptemperature tomaximize
energysavings is95°F. A comparisonof the average powerconsumptionof eachunitisshownbelow:
Table 4: Lab Testing, Air-Cooled at 70°F vs. Water-Cooled at 95°F
*The air-cooleddataforthe ice machine istakenfrommanufacturerspecifications.The ice machine
cooledbya water-cooledcondenserwastestedandcomparedtomanufacturerdata,andenergy
consumptionperpoundof ice waswithin1% of the quotedspecs.
In mostinstances,the water-cooledcase requiresslightlygreateraverage powerthanthe air-cooled
case,withthe exceptionof the ice machine.The vertical foodcase,however,seesasignificantincrease
inaverage power,almost475 Watts.Afteranalyzingthe data,inthe air-cooledcase,the unit’s
Unit
Air-Cooled Power
Draw, W
Water-Cooled Power
Draw, W
1-Door Refrigerator 81.6 89.1
2-Door Refrigerator 182.3 223.9
1-Door Freezer 194 230.1
Vertical Food Case 884.5 1,359
Horizontal Food Case 641 692
Ice Machine* 1,290 1,070
Total 3,273 3,664
12
compressorcycledasexpected.Butinthe water-cooledcase,the unit’scompressoroperated
constantly.
Thisdramatic reductioninefficiencymostlikelysuggeststhe needforalargerwater-cooledcondenser
coil. Asan example case todemonstrate the significanceof aproperlysizedcondensercoil versusan
improperlysizedcondensercoil,the 1doorfreezerwasinitiallyretrofittedwitha1/3 hp coaxial coil.
However,afteranalyzingthe powerloggeddataof the unit,itwas determinedthatthe freezer
experiencedadrasticreductionof efficiencywithincreasinglooptemperatures.The 1/3hp coaxial coil
was replacedwitha1 hpcoaxial coil.The following figure illustratesthe results.Due to time constraints,
additional retrofitswere notpossible.
Figure 7: Freezer Duty Cycle for Two Distinct Condenser Coil Sizes
From Figure 7, itis evidentthatthe dutycycle of the unitissignificantlyimpactedbythe size of the
condensercoil.Fora waterlooptemperature of 98°F,the freezerdutycycle usinganundersized
condensercoil isabout75%, as opposedtoabout53% for a properlysizedcoil.
A properly sized water-cooled condenser coil would likely reduce the modeled average power
consumption of theverticalfood casefrom1,359Wattsto around 884 Watts,a reduction of 475
Watts. This equates to a difference in annual energy consumption of 4,160 kWh. However,
becausethe lower numberhasnotbeen experimentally validated,themodel reflects the higher
value for average power.
There isan additional caveattothe sharp reductioninthe vertical foodcase efficiency.The air-cooled
vertical foodcase testedinlabdemonstratedmultiple on/off refrigerationcycles,butafterthe water-
cooledcondenserwasretrofitthe compressorranconsistently.Afterinspection,itwas discoveredthat
the vertical foodcase inthe 14944 store doesnot exhibitany compressorcycling,andinsteadruns
constantly.Itislikelythatthe average powerconsumptionof the labtestedvertical unitissignificantly
lowerthanthe average powerof the same unitoperatinginthe store.Thisdiscrepancyhassignificant
implicationsforthe model developedtopredictthe annual savingsof the system.
It is likely thatthe vertical unit tested in the lab with a water-cooled condenser,which seemsto
be operating inefficiently relative to the air-cooled case, is actually operating similar to the air-
13
cooled case in the store. If this is the case, it would negate the negativeeffectsof refrigeration
efficiency currently built into the model, a positive change of around 3,425 kWh per year.
Refrigeration Efficiency Decrease: 3,425 kWh per year
System Energy Use
To findthe netenergysavingsof the system, the total energyusedtorunthe systemneededtobe
determined.The laboratoryteststodetermine the electrical use forthe circulationpumpandthe
exteriorradiatorfansare outlinedbelow.
Pump
Due to the large pressure dropof the waterloop,a positive displacement
pumpwas chosen toprovide the necessaryflow rate andpressure.A
diagramof a positive displacementpumpisshownin Figure 7.In thisstyle
of pump,the watercominginfillsupthe compartmentandthenthe
rotationof the pumpmovesthatwasterto the outletside.Due tothe
designof thispumpthe flowrate is nearlyindependentof the pressure
beingproducedbythe pump.Thisisbecause a constantvolume of wateris
beingmovedfromthe inlettothe outletforeveryrotation of the motor
independentof anypressure changes.Onthe pumpcurve forthe chosen
pump,the flowrate variesfrom5.43 to 5.51 gallons-per-minute overa
pressure change of 50 to 250 psi.The onlydifference inoperationatthe
higheroperatingpressuresisthe higherpressuresrequire alargerinputof energyfromthe motor.
In the lab,the flowrate of the systemwasmeasuredtobe 5.5 gallons-per-minuteandthe powerof the
pumpwas loggedtobe 400-watts. The pumprunsconsistentlysothiscanbe usedtofindthe annual
energyuse of the pump.
Pump Energy Use: 3,500 kWh per year
Fan
To reject the waste heat outside, two radiator and fan pairs are used. The fan
a temperature sensor that cycle the fan on or off to maintain a constant water
step to determining the amount of time each fan will runwas to determine the heat
radiator withthe fan on and withthe fan off. To do this coldwater was run thought
temperature of the water was recorded before and after the radiator withthe fan on
these heat rejectionefficiencyvalues and the total measured waste heat from the
the fan duty cycle could be calculated as a function of outside air temperature. For
experiment and calculations see Appendix CFan DutyCycle.The fan dutycycle by outside airtemperature alongwiththe numberof hoursat that
temperature are shownin Figure 9.
Figure 8: Positive Displacement Pump
14
Figure 9: Fan Run Time Data
By multiplyingthe numberof hoursat each temperature withthe dutycycle atthat temperature,the
numberof hoursthe fanwill runperyear can be calculated.Inthe lab,the powerdraw of the fanwas
measuredtobe 160-watts, so the calculatedfanenergyuse is:
Fan Energy Use: 1,160 kWh/year
Costs
Total systemcostscan be dividedintomaterialcostsandlaborcosts. A complete listof equipmentis
providedin Appendix .Laborcostsinclude retrofittingthe water-cooledcondenserstoeach
refrigerationunitandinstallingthe systeminthe store.
For laboratorytestingof the units,the retrofitof the refrigeratorcondenserswasperformedintwo
phases,whichincreasedthe laborcostsforthe retrofit.Toestimate whatthe laborprice mightbe we
tookthe quotedcostto retrofitone unit,$520, andmultiplieditbysix units. Finally,the price of
installingthe systemhasanadditional 4hours of laborfor a plumberat $95/hr, or $380. Total system
costs are shownbelow:
EquipmentCost—$4,200
Labor Cost—$3,500
Total Cost—$7,700
UPDATED MODEL
From the laboratoryanalysisdescribedinthisreport,the savings model canbe updatedasshownin
Energy Savings Cost Savings
ReducedAir ConditioningLoad 13,050 kWh $2,870
0
100
200
300
400
500
600
700
800
0%
20%
40%
60%
80%
100%
120%
50 55 60 65 70 75
HoursPerYear
FanDutyCycle
Outside Air Temperature (F)
Outside Air Temperature Fan #1 Fan #2
15
IncreasedHeating Load -380 therms -$400
Hot WaterPreheat 8,250 kWh $1,820
RefrigerationEfficiencyChanges -3,420 kWh -$750
SystemEnergy Use -4,660 kWh -$1,030
Total Energy Savings 13,220 kWh
-380 therms
$2,520
EquipmentCosts $4,200
InstallationCosts $3,500
Total Installation Costs $7,700
Simple Payback 3 years
SENSITIVITY ANALYSIS
Due to the uncertaintyinherentintranslating the systemfromthe labtothe store,a sensitivityanalysis
was done todetermine the effectvariationsinthe inputsof the valuesonthe annual savings.Forthis
analysis,the valuesof annual airconditioningrunhours,refrigerationwasteheat,coffee wateruse,
domestichotwateruse,and refrigerationenergychangeswere variedby+/-25%.The effectthat
varyingeachof these componenthasonthe annual savingsisshownin Figure 10.
Figure 10: Sensitivity Analysis +/- 25% Current Estimates
From thisanalysis,itcanbe determinedthatthe airconditioninghoursandamountof waste heat
removed have the largestimpactonthe annual savings. Tounderstandhow the variationof eachof the
componentsinteract,aMonte Carlo simulation.Forthissimulation randomvalues foreachof the
variableswithin the range describedabovewere chosen andthe resultingannual savingswas
calculated.The simple paybackperiodof eachof the 150 simulationsare showninthe histogramin
Figure 11.
$1,500 $2,000 $2,500 $3,000 $3,500
Annual Savings
Air Conditioning Hours
Waste Heat Removed
DHW Use
Coffee Water Use
Refrigeration Energy
Changes
16
Figure 11: Monte Carlo Simulation
From thissimulationwe cansee thatthe simple paybackperiodof the installationof the systemis
below 5 years99% of the time and nearly50% of the simulationsresultedinasimple paybackperiodof
3 yearsor less.
NEXT STEPS
The purpose of the laboratorytestingwastovalidate the model originallydevelopedforthe waterloop
heatrecoverydesign,andtoverifythe system’sfunctionality.These objectiveshave beenmet.The next
stepinthe agreementbetweenCSUandStarbucksCoffee Companyisthe install the waterloopheat
recoverysysteminthe 14944 Starbucksstore.
The in-store implementationof the waterloopheatrecoverysystemwill provide real time dataforthe
system’seffectiveness,bothintermsof HVACsavingsaswell aswaterheatingsavings.The in-store
installationwilleliminate anyuncertaintiesassociatedwiththe differencesbetweenin-labandin-store
refrigerationperformance. The final resultsof the in-store installationswillbe usedtofinalize adecision
tool to be usedto determine the system’sperformance andpaybackperiodfordifferentStarbucks
storesaroundthe country.
AREAS FOR FURTHER RESEARCH
While the resultsfromthe labtestingshow thatthissystemiswell suitedforimplementationinstores
insouthernCalifornia,the followingare some ideastohelpincrease the efficiencyof the systemor
make it more applicable toawidervarietyof climates.
1. Addcontrolsto directheatback inside whenneededforcoolerclimates.
2. Investigate optionstoincrease heat rejectioninwarmerclimates suchasevaporative pre-
coolingor coolingtowers.
0%
10%
20%
30%
40%
50%
60%
70%
80%
90%
100%
0
2
4
6
8
10
12
14
16
18
20
2.1 2.3 2.4 2.6 2.8 3.0 3.2 3.4 3.6 3.8 3.9 4.1 4.3 4.5 4.7 4.9 5.1 5.3 5.4
Simple Payback(years)
17
3. ConsiderVFDcontrolsonthe pump to vary the flow rate rather thanthe fanduringcooler
weather.
4. Install time of daycontrols to lowerlooptemperatureovernighttoincrease refrigeration
efficiency whenhotwaternotrequired.
APPENDIX
Appendix A
Building Energy Model
To helpunderstandthe total hoursperyearthe airconditioningsystemisrunning,asimple building
energymodel wascreatedusingstore 14944. The firstcomponentof the store’sheatloadthat was
consideredwasthe contributionfromthe envelope.The valuesusedforthese calculations are outlined
inTable 5.
Table 5: Building Energy Model Values
Roof NorthWall WestWall SouthWall East Wall
Total Area(ft2
) 2,973 700 400 700 400
U (btu/h/ft2
/°F) 0.61
0.72
0.7 0.7 0.7
% AreaWindows 0% 0% 50% 50% 0%
U (btu/h/ft2
/°F) - - 0.53
0.5 -
ShadingCoefficient - - 0.444
0.44 -
To estimate the heatgainor lossthroughthe wallsandroof the followingequationwasused.
𝑄 = 𝑈 × 𝐴 × ( 𝑇𝑠 − 𝑇𝑖)
Where
Q = Total heatgainsor losses(Btu/h)
U = Heat transferrate of material (Btu/h/ft2
/°F)
A = Surface Area(ft2
)
Ts = Sol-airTemperature (see explanationbelow)
Ti = Indoortemperature setpoint(occupied:68°F/ Unoccupied:63°F)
The sol-airtemperature isatermusedto incorporate the heatgainsdue to solarradiationintothe
outdoorair temperature value.Tocalculate the sol-airtemperature,the amountof solarradiationthat
ishittingthe surface at a right angle mustbe determined.Thisvalue isafunctionof the time of day,the
latitude of the building,andthe surface orientationas showninthe followingequations:
𝑅𝑜𝑜𝑓: 𝑇𝑠 = 𝑇𝑜 +
(0.8) × 𝐺𝑠ℎ
30
𝐺𝑠ℎ = 𝐺 × [sin 𝛿 sin 𝜑 + cos 𝛿 cos 𝜑 cos 𝜔]
1 ASHRAE valuefor wood deck roofs
2 ASHRAE valuefor stud walls
3 ASHRAE valuefor doublepane windows
4 ASHRAE valuefor doublepane windows is 0.88;reduced by 50% to accountfor overhang shadingwindows
18
𝑊𝑎𝑙𝑙: 𝑇𝑠 = 𝑇𝑜 +
(0.8) × 𝐺𝑠𝑣
30
𝐺𝑠𝑣 = 𝐺 × [− sin 𝛿 cos 𝜑cos 𝛾 + cos 𝛿 sin 𝜑 cos 𝛾cos 𝜔 + cos 𝛿sin 𝛾 sin 𝜔]
𝛿 = 23.45 × 𝑠𝑖𝑛[360 +
𝑁 𝑑 + 284
365
]
𝜔 = (𝑡𝑖𝑚𝑒 − 12) ×
360
24
Where
To = Outside air temperature (°F)
G = Solar radiation at the earth’s surface (254 btu/h/ft2)
ϕ = Latitude
γ = Orientation of wall (south = 0, east = -90, west = 90)
Nd = Day number (between 1 and 365)
For example,the sol-airtemperature forthe southfacingwall atnoononJanuary 1st
in SanDiegowould
be calculatedas follows:
𝛿 = 23.45 × 𝑠𝑖𝑛 [360 +
1 + 284
365
] = −23
𝜔 = (12 − 12) ×
360
24
= 0
𝐺 𝑠𝑣 = 254 × [−sin(−23)cos(32.7)cos(0) + cos(−23)sin(32.7)cos(0)cos(0) + cos(−23)sin(0)sin(0)] = 210
𝑇𝑠 = 62 +
(0.8) × 210
30
= 68
Thisvalue is thenusedinthe heat gaincalculationtodetermine the heatgainorloss thoughthe wall
area forthishour. Continuingthe examplefromabove:
𝑄 = 0.7 × (700 𝑓𝑡2 × 50%) × (68 − 68) = 0
𝑏𝑡𝑢
ℎ
Since 50% of thiswall iscomprisedof windows,the heatgainorlossthroughthe windowsalsoneedsto
be calculated. Forwindows,boththe conductive heattransferthrough the windowsandthe solarheat
gainfrom radiationpassingthroughthe window mustbe takenintoaccount.Todo thisthe following
equationisused:
𝑄 = 𝐴[ 𝑈( 𝑇𝑜 − 𝑇𝑖) + 𝐺𝑠𝑣 𝐹𝑟𝑒𝑓 𝑆𝐶]
Where
Fref = Baseline radiation transmission value based on single pane windows, 0.87
SC = Shading coefficient to adjust for shading and different window types, 0.44
For the southfacingwall describedabove:
19
𝑄 = 700 × 50% × [0.7(62 − 68) + 210 × 0.87 × 0.44] = 26,600
𝑏𝑡𝑢
ℎ
These calculationsare done forthe roof and all fourwallsforeach hourof the year the determine the
heatloadof the buildingenvelope.The nextcomponentof the building’sheatloadisthe ventilation
load.The ventilationloadiscalculatedusingthe followingequation:
𝑄 = 𝑉̇ × 𝐴 × 𝑐 𝑝 × 𝜌 × ( 𝑇𝑜 − 𝑇𝑖)
Where
𝑉̇ = Volumetric flow rate, 0.5 CFM
A = Building Area, ft2
Cp = Heat capacity of air, 0.24 Btu/lbm/°F
ρ = Density of Air, 0.07 lbm/ft3
For the buildinginSanDiego atnoon onJanuary 1st
, the heatgain due to ventilationisgivenby:
𝑄 = 0.5 × 2,973 × 0.24 × 0.7 ×
60 𝑚𝑖𝑛
ℎ𝑜𝑢𝑟
× (62 − 68) = −8,990
𝑏𝑡𝑢
ℎ
Again,these calculationswere done foreveryhourof the yeartounderstandthe contributiontothe
building’sheatloadfromventilation.
The nextcomponentof the model isthe internal heatloaddue tothe employeesandthe customers.
The firststepwas to understandthe numberof people inthe store atvarioustimesinthe day.For this
estimate,we wenttoGoogle mapsandpulledthe graphsshowingthe busytimesof the day.The graph
for Monday’sisshownin Figure 12.
Figure 12: Number of Customers from Google Maps
By settingthe maximumheightfromanydayas 100%, each hourwas assignedapercentage basedon
the heightof the graph comparedto the largestbar. Usingthisdata an average businessateachhour
was determined.Basedoninstore observations,the numberof employeesatthe busiesttimesis 8and
there are approximately30customers. Since the employeesare standingandwalkingas theywork,itis
estimatedthattheyproduce 750 btu/hperperson.The customerstendtobe seated,sotheyare
producingabout350 btu/hperperson.Usingthe businessdatafromgoogle mapsandthe observed
occupant numberandactivitylevel,the average heatloaddue tothe people byhourcan be determined
and isshownin Figure 13.
20
Figure 13: Heat Load due to Customers and Employees
The final componentof the buildingenergymodelisthe loaddue tothe equipment.The total heat
producedfromeachpiece of equipmentwastakenfromStarbucksequipmentheatsurvey.The
equipmentisoutlinedin Table 6.
Table 6: Equipment Heat Load
Non-BusinessHours
(Btu/h)
BusinessHours
(Btu/h)
Machine,Espresso 0 9,628
Brewer - Digital dual 0 6,135
Oven Warming 0 22,726
SoftHeat Server 0 691
Blender 0 3,683
Scale 0 205
Grinder - Coffee 0 409
UnderCounterRefrigerator 942 942
Cooling UnderCounterRefrigerator 471 471
2 DoorUnderCounterRefrigerator 471 471
POS,compact 0 182
Computer/DataRack 1,364 1,364
Warewasher 0 9,760
Lighting 0 8,754
Total 3,248 65,420
Thistable doesnotinclude the 21,777 btu/hrfromthe refrigerationequipmentincludedinthis
experiment.
The heat loadfromthe envelope,ventilation,people,andequipmentare addedtogetherforeachhour
of the yearto determine whetherthe buildingisgainingheatandthe airconditioningsystemwouldbe
-
2,000
4,000
6,000
8,000
10,000
12,000
14,000
12:00:00 AM 6:00:00 AM 12:00:00 PM 6:00:00 PM 12:00:00 AM
HeatLoad(Btu/h)
21
runningor the buildingislosingheatandthe heatingsystemisrunning.Fromthisanalysis,itis
determinedthata buildingsimilarto14944 in San Diegowouldbe inairconditioningmode 7,193hours
peryear.
To testthe accuracy of the model,the same calculationsdescribedabove wererunforthe store in Fort
Collins.The resultsof thisanalysiswere comparedtothe utilitybills. Figure 14showsthe estimated
coolinghourspermonthcomparedto the electricbillsforthe store.The coolinghourspeakduringthe
same time as the electrical use peaksdue toairconditioninguse.
Figure 14: Fort Collins Cooling Hours vs. Electricity bills
The same procedure wasdone forthe natural gas bill andthe heatinghours.These resultsare shownin
Figure 15.
0
100
200
300
400
500
600
700
800
4,000
6,000
8,000
10,000
12,000
CoolingHoursperMonth
kWh
2014 Electrical Energy Use
22
Figure 15: Monthly Heating Hours vs. Natural Gas Bills
Againthe general profile of the heatinghoursfollowsthatof the natural gas use.There are many factors
that can affectthe energyuse of a buildingbesidesitsHVACloads,sothisdoesnotdefinitivelyprove
that the model iscorrect.It does,however,show thatthe model hascapturedthe energyuse trendsof
the building,andlikelyprovidesareasonablyaccurate estimate of the numberhoursthatthe air
conditioningsystemruns.
Appendix B
Heat Rejection Calculations
Each refrigeratorwastestedatthree temperature incrementsforaperiodof 3-5 hours.Duringthis
time,twotemperature loggerswere placedinthe system,one immediatelybefore the unit’scondenser
coil,andone immediatelyafter.Thissetupprovidedloggeddataforthe temperature increaseinthe
wateras a resultof the heatexchange betweenthe waterloopandthe unit’srefrigerant.Withthe
temperature increase known,the heatoutputof the unitwascalculatedasfollows:
𝑄̇ 𝑟𝑒𝑓𝑟𝑖𝑔𝑒𝑟𝑎𝑡𝑜𝑟 = 𝑚̇ 𝐶 𝑝∆𝑇
Sample data,explainhowmeasurednumber,variablesthatcouldeffectinstore (loading,efficiencydue
to air circulationproblems)
𝑄̇ 𝑟𝑒𝑓𝑟𝑖𝑔𝑒𝑟𝑎𝑡𝑜𝑟 = Heat outputof refrigerationunit,Btu/hr
𝑚̇ = Mass flow rate of waterthroughloop,lb/hr
𝐶 𝑝 = Specificheatcapacityof water,1.0 Btu/lb-°F
∆𝑇 = Temperature difference measuredbyloggers,°F
0
100
200
300
400
500
600
700
800
900
1,000
0
100
200
300
400
500
600
700
HeatingHoursperMonth
kWh
2014 NatualGas Use
23
The onlyvariable onthe righthand side of the equationthatisnot immediatelyknownisthe massflow
rate of the water.However,accordingtothe pumpcurve,the flow rate shouldbe between5.43and
5.51 gallonsperminute.A value of 5.5 gallonsperminute wasexperimentallyverifiedinthe lab.This
equatestoa mass flowrate of 2,752 lbs/hrof water. This value,aswell asthe specificheatcapacityof
water,are constant.Therefore,the heatoutputof eachrefrigeratorisafunctionof the temperature
difference loggedinthe experimental setup.The followingfigure displaysthe resultsof thistestingon
each unit:
Figure 16: Starbucks Refrigerators Heat Output
In general,the expectationwouldbe thatthe heatoutputof each refrigeratorwoulddecrease asthe
enteringtemperature of the waterincreased.Thisisbecause the higherenteringwater temperature
createsa smallertemperature differential betweenthe waterandthe refrigerant,whichtranslatestoa
reductioninheattransfer.Withthe exceptionof the vertical foodcase,all of the refrigeratorsabidedby
thisexpectation. The unexpectedbehaviorof the vertical foodcase islikelydue tothe undersized
condensercoil.
Appendix C
Fan Duty Cycle
The firststepin understandingthe amountof time thatthe exteriorradiatorfanswouldneedtorunis
measuringthe radiator’sheatrejection efficiency. Todo thiscoldwater wasrun thoughthe radiator
withthe fan onin a 70°F room andthe exitingwatertemperaturewasmeasured.Nextthe fanwas
turnedoff and the resultingwatertemperature waslogged.The resultsare shownin Figure 17.
24
Figure 17: Heat Rejection Efficiency Test Results
From thistest,we can determine the heatrejectionrate of the radiatorusingthe followingequation.
𝑈𝐴 =
𝑄
( 𝑇𝑎 − 𝑇 𝑤)
̇
Where
𝑄̇ = Heat Transfer Rate, Btu/h
UA = Heat Transfer Efficiency of the Radiator, Btu/h-°F
Ta = Average Air Temperature over Radiator, °F
Tw = Average Water Temperature through Radiator, °F
As discussedinAppendix B,the temperature change overthe radiatorcanbe usedto calculate the heat
transferoverthe radiatorwiththe fan on and withthe fanoff.
𝑄̇ 𝑓𝑎𝑛 𝑜𝑛 = 𝑚̇ 𝐶 𝑝∆𝑇 = (2752
𝑙𝑏𝑠
ℎ𝑟
) × (
1𝑏𝑡𝑢
𝑙𝑏 ∙ ℉
) × (6.5℉) = 17,916
𝐵𝑡𝑢
ℎ
𝑄̇ 𝑓𝑎𝑛 𝑜𝑓𝑓 = 𝑚̇ 𝐶 𝑝∆𝑇 = (2752
𝑙𝑏𝑠
ℎ𝑟
) × (
1𝑏𝑡𝑢
𝑙𝑏 ∙ ℉
) × (0.2℉) = 623
𝐵𝑡𝑢
ℎ
These twovaluescanbe inputintothe equationabove todetermine aUA value forthis radiator.
𝑈𝐴 𝑓𝑎𝑛 𝑜𝑛 =
17,916 𝑏𝑡𝑢/ℎ
(67.2 − 46.4)℉
= 860
𝑏𝑡𝑢
ℎ ∙ ℉
𝑈𝐴 𝑓𝑎𝑛 𝑜𝑓𝑓 =
623 𝑏𝑡𝑢/ℎ
(69.9 − 43.3)℉
= 20
𝑏𝑡𝑢
ℎ ∙ ℉
Usingthese values,the amountof heatthat the radiatorcan rejectat a givenoutside airtemperature is
calculated.Example calculationswithanoutside airtemperatureof 50°F isshownbelow.
0
1
2
3
4
5
6
7
2:58:34 PM 3:04:19 PM 3:10:05 PM 3:15:50 PM 3:21:36 PM 3:27:22 PM
TemperatureChange(F)
25
𝑄̇ 𝑓𝑎𝑛 𝑜𝑛 50℉ = 𝑈𝐴( 𝑇 𝑤 − 𝑇𝑎) = (860
𝑏𝑡𝑢
ℎ ∙ ℉
) × (95℉ − 50℉) = 38,780
𝐵𝑡𝑢
ℎ
𝑄̇ 𝑓𝑎𝑛 𝑜𝑓𝑓 50℉ = 𝑈𝐴( 𝑇 𝑤 − 𝑇𝑎) = (20
𝑏𝑡𝑢
ℎ ∙ ℉
) × (95℉ − 50℉) = 1,054
𝐵𝑡𝑢
ℎ
The amount of time that the fanwouldneedtorun to rejectthe 21,777 btu/hof waste heatproduced
by the refrigerationunitscanbe foundusingthe followingequation.
𝐷 =
(𝑊 − 𝑄̇ 𝑓𝑎𝑛 𝑜𝑓𝑓)
( 𝑄̇ 𝑓𝑎𝑛 𝑜𝑛 − 𝑄̇ 𝑓𝑎𝑛 𝑜𝑓𝑓)
Continuingthe example withanoutside airtemperature of 50°F:
𝐷 =
(21,777 − 38,780)
(38,780 − 1,054)
= 55%
Thiscalculationisdone foreach outside airtemperature.If the value isabove 100% thenthe same
calculationisdone forthe remainingheattofindthe dutycycle of the secondfan.The resultingduty
cyclesare thenmultipliedbythe numberof hoursin the year at that outside airtemperature togetthe
fan runtime.The calculationsforSanDiegoare shownin Table 7.
Table 7: Fan Duty Cycle Calculations
Outside Air
Temperature
(°F)
Hours per
Year
Fan #1
Duty Cycle
Fan #2
Duty Cycle
Fan #1 Run
Time
(hours)
Fan #1 Run
Time
(hours)
50 40 55% 0% 21.97 0
51 97 56% 0% 54.56 0
52 201 58% 0% 115.81 0
53 215 59% 0% 126.97 0
54 204 61% 0% 123.55 0
55 252 62% 0% 156.61 0
56 268 64% 0% 171.01 0
57 298 66% 0% 195.38 0
58 322 67% 0% 217.06 0
59 360 69% 0% 249.70 0
60 397 71% 0% 283.55 0
61 375 74% 0% 276.02 0
62 452 76% 0% 343.16 0
63 624 78% 0% 489.09 0
64 651 81% 0% 527.30 0
65 440 84% 0% 368.69 0
66 487 87% 0% 422.61 0
67 561 90% 0% 504.77 0
68 684 93% 0% 638.94 0
26
69 454 97% 0% 440.89 0
70 271 100% 0% 271.00 0
71 236 100% 3% 236.00 6.24
72 231 100% 7% 231.00 16.98
73 210 100% 12% 210.00 26.22
74 217 100% 18% 217.00 39.29
75 150 100% 24% 150.00 36.44
76 62 100% 31% 62.00 19.30
Total 7105 144
The resultingruntime isthensimplymultipliedbythe loggedpowerdraw of the fan,160-watts, to get
the annual energyuse of the fan,1,160 kWh peryear.
Note:The heattransferrate withthe fanoff is likelylowerinthe labthaninwill be undernormal
operatingconditionsdue towindincreasingairmovementoverthe radiator.Thismeansthatthe annual
fan runtime may be lowerthanestimated.
Appendix D
Refrigeration Efficiency
In additiontodata loggingthe heatoutputof eachrefrigeratoratdifferentwaterlooptemperatures,
the powerconsumptionof eachunitwasalsologged. Asmentionedpreviously,eachrefrigeratorwas
testedatthree temperature incrementsforaperiodof 3-5 hours.
Small Refrigeration Units (1 door refrigerator, 1 door freezer, 2 door refrigerator)
The followingfiguresillustrate twofull refrigerationcyclesforeachsmallerunitateachtestedwater
looptemperature:
Figure 18: 1 Door Freezer
27
Figure 19: 1 Door Refrigerator
Figure 20: 2 Door Refrigerator
In general,the refrigerationunitstendedtocycle more frequentlywhenair-cooledas opposedtowater-
cooled.However,more frequentcyclingdoesnotnecessarilyindicateagreaterdutycycle.At higher
waterlooptemperatures,the cyclestendedtobecome lessfrequent(exceptinthe case of the 1 door
freezer),butthe loadedpowerdurationalsoincreased.The followingfigure illustratesthe dutycycle of
each refrigerationunitatdifferentwaterlooptemperatures,alongwiththe air-cooleddutycycle:
28
Figure 21: Small Refrigeration Unit Duty Cycles
Figure 21 illustratesthe pointatwhicha water-cooledcondenserbecomeslessefficientthananair-
cooledcondenserforeachunit.Itshouldbe notedthatthe air-cooledcondenserdatawastakenat an
ambienttemperature of 70°F.
Large Refrigeration Units (vertical food case, horizontal food case, ice machine)
The followingfiguresillustrate arefrigerationcycle comparisonbetweenanair-cooledcondenseranda
water-cooledcondenserforeachlargerrefrigerationunit:
Figure 22: Horizontal Food Case
The horizontal foodcase performedasexpectedinthe lab.Tohelpinterpretthe figure,the average air-
cooledpowerconsumptionwas0.64 kW. Again,forthe air-cooledcase,ambientairwasat 70°F. This
can be comparedtothe followingwater-cooledaveragepowerconsumptions:
29
Table 8: Horizontal Food Case Average Power Consumption
The vertical foodcase didnot performas predicted,asseenbelow:
Figure 23: Vertical FoodCase air-cooledcase,the unitcycledasexpected.However,foreverywater-
cooledcase,the unitran constantly.Aspreviouslydescribed,thisisalikelyindicationthatthe
condensercoil isundersized.
The final refrigerationunittestedinthe labwasthe ice machine.Due toits significantlyhigherheat
output,a lowertemperature datapointforthe waterloop wasnot possible toobtain.The power
consumptionof the ice machine attwo temperature incrementsisshownbelow:
Figure 24: Ice Machine
Water Loop
Temperature, °F
Average Power
Consumption, kW
76 0.62
85 0.66
91 0.67
30
From Figure 24, it can be seenthata highertemperature inthe waterloopresultsinalonger
refrigerationcycle,whichtranslatestoa longertime requirementtoproduce the same amountof ice.
However,althoughthe cyclesare longer,the average powerconsumptionisloweratthe higher
temperature waterloop.
Accordingto the manufacturer,the ice machine requires0.43 kWh perpoundof ice produced,
regardlessof operatingconditions.Thisvalue wascorroboratedbythe experimental dataatboth water
looptemperature settings,within1%.Thisindicatesthatalthoughthe amountof ice thatcan be
producedina givendaymightbe affectedbychangingthe waterlooptemperature,the amountof
energyperbatch remainsconstant.
Refrigeration Load vs. Power Consumption
A controlledexperimentwassetupinwhicha five-gallonbucketof warmwaterwasplacedina
refrigeratortoact as a load.A temperature dataloggerwasplacedinside the buckettomonitorits
temperature.The powerconsumptionof the refrigerationunitwasloggedduringthe durationof the
experiment.The experimentwasperformedoverabouttwohours.Duringthistime period,the
refrigeratorcycledsix times.The followingfiguresdemonstrate the resultsof thisexperiment:
Figure 25: Refrigeration Load/Power Testing
The duty cycle of each refrigerationcycle wasdeterminedeasily.The refrigeratorload(figureonthe
right) wasdeterminedbythe change intemperature of the bucketof water.Frombothfigures,itis
evidentthatthe loadedpowerof the refrigeratorremainsconstant,despiteachangingload.Fromthis
experiment,itwashypothesizedthatthe loadona refrigeratorprimarilyaffectsthe dutycycle,andnot
the loadedpower(the average powerwouldbe affectedsimilartothe dutycycle).
If true, thishypothesiswasintendedtobe usedpredictivelytodetermine arefrigerator’soperating
condition.If the loadona refrigeratordoesnotaffectitsloadedpower,the onlyvariableaffecting
loadedpowerwouldbe the effectivenessof the condenser,which iscontrolledbythe waterloop
temperature forawater-cooledcondenserorambientairtemperature foranair-cooledcondenser.
However,furtherexperimentationdemonstratedthatsubstantial refrigerationloads(leavingthe doors
openforextendedperiods,forexample) canleadtoincreasedloadedpowerof the unit.
31
Appendix E
The followingtable providesadetailedlistof costsforthe system:
Table 9: System Component Costs
Description Number Cost Subtotal
1/3 HP Coaxial Coil 1 $67.50 $68
1/2 HP Coaxial Coil 2 $77.50 $155
1 HP Coaxial Coil 1 $137.50 $138
1 1/2 HP Coaxial Coil 2 $112.50 $225
Plate-and-Frame Heat Exchanger 2 $185.95 $372
5 GPMPositive Displacement Pump 1 $454.25 $454
1/3 HP Motor 1 $255 $255
24" x 24" Water-to-Air Radiator 2 $384 $768
1/4 HP Fan 2 $325 $650
Installation Accessories 1 $510 $510
Sensors and Controls 1 $640 $640
Total $4,234

More Related Content

What's hot

Escape 24 biomass power plant with integrated drying-effective utilization of...
Escape 24 biomass power plant with integrated drying-effective utilization of...Escape 24 biomass power plant with integrated drying-effective utilization of...
Escape 24 biomass power plant with integrated drying-effective utilization of...Tesfaldet Gebregerges
 
Assessment of boiler performance
Assessment of boiler performanceAssessment of boiler performance
Assessment of boiler performanceAshish Kumar Jain
 
Condensing Heat Recovery for Industrial Process Applications
Condensing Heat Recovery for Industrial Process ApplicationsCondensing Heat Recovery for Industrial Process Applications
Condensing Heat Recovery for Industrial Process ApplicationsThermal Energy International Inc.
 
Energy performance assessment of boilers
Energy performance assessment of boilersEnergy performance assessment of boilers
Energy performance assessment of boilersUtsav Jain
 
IRJET- A Review on Developing a Model that Uses Waste Heat from Condenser in ...
IRJET- A Review on Developing a Model that Uses Waste Heat from Condenser in ...IRJET- A Review on Developing a Model that Uses Waste Heat from Condenser in ...
IRJET- A Review on Developing a Model that Uses Waste Heat from Condenser in ...IRJET Journal
 
PLD-FINAL-REPORT
PLD-FINAL-REPORTPLD-FINAL-REPORT
PLD-FINAL-REPORTadnan malak
 
Feedwater heater control: Level
Feedwater heater control: LevelFeedwater heater control: Level
Feedwater heater control: LevelShari Worthington
 
Impact of Fouling on VCR System
Impact of Fouling on VCR SystemImpact of Fouling on VCR System
Impact of Fouling on VCR SystemShashank Pandey
 
Boiler Efficiency Improvement through Analysis of Losses
Boiler Efficiency Improvement through Analysis of LossesBoiler Efficiency Improvement through Analysis of Losses
Boiler Efficiency Improvement through Analysis of Lossesijsrd.com
 
A Study of Boiler Efficiency
A Study of Boiler EfficiencyA Study of Boiler Efficiency
A Study of Boiler EfficiencyEthan Grabill
 
Improving Efficiency for Boiler and Steam System
Improving Efficiency for Boiler and Steam SystemImproving Efficiency for Boiler and Steam System
Improving Efficiency for Boiler and Steam SystemKamlesh Hariyani
 
Thermodynamic Design of a Fire-Tube Steam Boiler
Thermodynamic Design of a Fire-Tube Steam BoilerThermodynamic Design of a Fire-Tube Steam Boiler
Thermodynamic Design of a Fire-Tube Steam BoilerJohn Walter
 
Evaluation of a Boiler performance
Evaluation of a Boiler performanceEvaluation of a Boiler performance
Evaluation of a Boiler performanceHashim Hasnain Hadi
 
Se prod thermo_examples_compressor
Se prod thermo_examples_compressorSe prod thermo_examples_compressor
Se prod thermo_examples_compressorVJTI Production
 
Presentation on Calculation of Line Pack of Natural Gas Pipe using Aspen PLUS...
Presentation on Calculation of Line Pack of Natural Gas Pipe using Aspen PLUS...Presentation on Calculation of Line Pack of Natural Gas Pipe using Aspen PLUS...
Presentation on Calculation of Line Pack of Natural Gas Pipe using Aspen PLUS...Waqas Manzoor
 
Final lab report for thermos 2(mech)
Final lab report for thermos 2(mech)Final lab report for thermos 2(mech)
Final lab report for thermos 2(mech)lizwi nyandu
 
As run boiler performance assessment for energy efficiency
As run boiler performance assessment for energy efficiencyAs run boiler performance assessment for energy efficiency
As run boiler performance assessment for energy efficiencyD.Pawan Kumar
 
Pinch analysis technique to optimize heat exchanger
Pinch analysis technique to optimize heat exchangerPinch analysis technique to optimize heat exchanger
Pinch analysis technique to optimize heat exchangerK Vivek Varkey
 

What's hot (20)

Escape 24 biomass power plant with integrated drying-effective utilization of...
Escape 24 biomass power plant with integrated drying-effective utilization of...Escape 24 biomass power plant with integrated drying-effective utilization of...
Escape 24 biomass power plant with integrated drying-effective utilization of...
 
Assessment of boiler performance
Assessment of boiler performanceAssessment of boiler performance
Assessment of boiler performance
 
Condensing Heat Recovery for Industrial Process Applications
Condensing Heat Recovery for Industrial Process ApplicationsCondensing Heat Recovery for Industrial Process Applications
Condensing Heat Recovery for Industrial Process Applications
 
Energy performance assessment of boilers
Energy performance assessment of boilersEnergy performance assessment of boilers
Energy performance assessment of boilers
 
IRJET- A Review on Developing a Model that Uses Waste Heat from Condenser in ...
IRJET- A Review on Developing a Model that Uses Waste Heat from Condenser in ...IRJET- A Review on Developing a Model that Uses Waste Heat from Condenser in ...
IRJET- A Review on Developing a Model that Uses Waste Heat from Condenser in ...
 
PLD-FINAL-REPORT
PLD-FINAL-REPORTPLD-FINAL-REPORT
PLD-FINAL-REPORT
 
Feedwater heater control: Level
Feedwater heater control: LevelFeedwater heater control: Level
Feedwater heater control: Level
 
Energy conservation
Energy conservationEnergy conservation
Energy conservation
 
Impact of Fouling on VCR System
Impact of Fouling on VCR SystemImpact of Fouling on VCR System
Impact of Fouling on VCR System
 
Boiler Efficiency Improvement through Analysis of Losses
Boiler Efficiency Improvement through Analysis of LossesBoiler Efficiency Improvement through Analysis of Losses
Boiler Efficiency Improvement through Analysis of Losses
 
A Study of Boiler Efficiency
A Study of Boiler EfficiencyA Study of Boiler Efficiency
A Study of Boiler Efficiency
 
Improving Efficiency for Boiler and Steam System
Improving Efficiency for Boiler and Steam SystemImproving Efficiency for Boiler and Steam System
Improving Efficiency for Boiler and Steam System
 
Thermodynamic Design of a Fire-Tube Steam Boiler
Thermodynamic Design of a Fire-Tube Steam BoilerThermodynamic Design of a Fire-Tube Steam Boiler
Thermodynamic Design of a Fire-Tube Steam Boiler
 
Evaluation of a Boiler performance
Evaluation of a Boiler performanceEvaluation of a Boiler performance
Evaluation of a Boiler performance
 
Se prod thermo_examples_compressor
Se prod thermo_examples_compressorSe prod thermo_examples_compressor
Se prod thermo_examples_compressor
 
Presentation on Calculation of Line Pack of Natural Gas Pipe using Aspen PLUS...
Presentation on Calculation of Line Pack of Natural Gas Pipe using Aspen PLUS...Presentation on Calculation of Line Pack of Natural Gas Pipe using Aspen PLUS...
Presentation on Calculation of Line Pack of Natural Gas Pipe using Aspen PLUS...
 
Gas power-09
Gas power-09Gas power-09
Gas power-09
 
Final lab report for thermos 2(mech)
Final lab report for thermos 2(mech)Final lab report for thermos 2(mech)
Final lab report for thermos 2(mech)
 
As run boiler performance assessment for energy efficiency
As run boiler performance assessment for energy efficiencyAs run boiler performance assessment for energy efficiency
As run boiler performance assessment for energy efficiency
 
Pinch analysis technique to optimize heat exchanger
Pinch analysis technique to optimize heat exchangerPinch analysis technique to optimize heat exchanger
Pinch analysis technique to optimize heat exchanger
 

Viewers also liked

порядок приема на обучение по образовательным программам дошкольного образования
порядок приема на обучение по образовательным программам дошкольного образованияпорядок приема на обучение по образовательным программам дошкольного образования
порядок приема на обучение по образовательным программам дошкольного образованияvirtualtaganrog
 
Printing10004.PDF
Printing10004.PDFPrinting10004.PDF
Printing10004.PDFAdam Deane
 

Viewers also liked (10)

Presentación1
Presentación1Presentación1
Presentación1
 
Danza
DanzaDanza
Danza
 
A Brave New World
A Brave New WorldA Brave New World
A Brave New World
 
порядок приема на обучение по образовательным программам дошкольного образования
порядок приема на обучение по образовательным программам дошкольного образованияпорядок приема на обучение по образовательным программам дошкольного образования
порядок приема на обучение по образовательным программам дошкольного образования
 
ZAC CV
ZAC CVZAC CV
ZAC CV
 
Printing10004.PDF
Printing10004.PDFPrinting10004.PDF
Printing10004.PDF
 
MoA_Ph16
MoA_Ph16MoA_Ph16
MoA_Ph16
 
Rohan
RohanRohan
Rohan
 
Abs system
Abs systemAbs system
Abs system
 
Anp011
Anp011Anp011
Anp011
 

Similar to Heat recovery design for starbucks store retrofit_BS

An Minh Tran - Case 3 - Cheg 407
An Minh Tran - Case 3 - Cheg 407An Minh Tran - Case 3 - Cheg 407
An Minh Tran - Case 3 - Cheg 407AN TRAN
 
Leveraging best practices & emerging technologies to optimize industrial proc...
Leveraging best practices & emerging technologies to optimize industrial proc...Leveraging best practices & emerging technologies to optimize industrial proc...
Leveraging best practices & emerging technologies to optimize industrial proc...TNenergy
 
Seminar Report on Automobile Air-Conditioning based on VAC using Exhaust Heat
Seminar Report on Automobile Air-Conditioning based on VAC using Exhaust HeatSeminar Report on Automobile Air-Conditioning based on VAC using Exhaust Heat
Seminar Report on Automobile Air-Conditioning based on VAC using Exhaust HeatBhagvat Wadekar
 
Senior Design Final Report (Fin)
Senior Design Final Report (Fin)Senior Design Final Report (Fin)
Senior Design Final Report (Fin)Damone Norwood
 
MECE4410U - Project Report (Final)
MECE4410U - Project Report (Final)MECE4410U - Project Report (Final)
MECE4410U - Project Report (Final)Tushar Karanwal
 
Solar oven ProjectReport
Solar oven ProjectReportSolar oven ProjectReport
Solar oven ProjectReportMohammad Molani
 
“SEMINAR REPORT ON SOLAR ASSISTED VAPOUR ADSORPTION REFRIGERATION SYSTEM”
“SEMINAR REPORT ON SOLAR  ASSISTED VAPOUR ADSORPTION REFRIGERATION SYSTEM”“SEMINAR REPORT ON SOLAR  ASSISTED VAPOUR ADSORPTION REFRIGERATION SYSTEM”
“SEMINAR REPORT ON SOLAR ASSISTED VAPOUR ADSORPTION REFRIGERATION SYSTEM”Bhagvat Wadekar
 
ME 490_HaydenYoungs_FinalReport.FinalCopy
ME 490_HaydenYoungs_FinalReport.FinalCopyME 490_HaydenYoungs_FinalReport.FinalCopy
ME 490_HaydenYoungs_FinalReport.FinalCopyHayden Youngs
 
Design and simulation of a multiple effect evaporator using vapor bleeding
Design and simulation of a multiple effect evaporator using vapor bleedingDesign and simulation of a multiple effect evaporator using vapor bleeding
Design and simulation of a multiple effect evaporator using vapor bleedingAhmed AL-Dallal
 
Inlet Air Cooling system from Ikeuchi Improve gas Turbine efficiency
Inlet Air Cooling system from Ikeuchi Improve gas Turbine efficiencyInlet Air Cooling system from Ikeuchi Improve gas Turbine efficiency
Inlet Air Cooling system from Ikeuchi Improve gas Turbine efficiencyH.Ikeuchi & Co.,Ltd
 
Development of a Bench-Top Air-to-Water Heat Pump Experimental Apparatus
Development of a Bench-Top Air-to-Water Heat Pump Experimental ApparatusDevelopment of a Bench-Top Air-to-Water Heat Pump Experimental Apparatus
Development of a Bench-Top Air-to-Water Heat Pump Experimental ApparatusCSCJournals
 
Case study Energy Audit for Chiller Plant
Case study Energy Audit for Chiller PlantCase study Energy Audit for Chiller Plant
Case study Energy Audit for Chiller PlantHina Gupta
 
An overview of diagnostic tools used in RESNET testing
An overview of diagnostic tools used in RESNET testingAn overview of diagnostic tools used in RESNET testing
An overview of diagnostic tools used in RESNET testingBill Spohn
 
Experimental investigation of waste heat recovery system for domestic refrige...
Experimental investigation of waste heat recovery system for domestic refrige...Experimental investigation of waste heat recovery system for domestic refrige...
Experimental investigation of waste heat recovery system for domestic refrige...IAEME Publication
 
Ian tuena (1) nrc presentation hpe2016
Ian tuena (1) nrc presentation hpe2016Ian tuena (1) nrc presentation hpe2016
Ian tuena (1) nrc presentation hpe2016ARAaus
 
AICHE Senior Design Project
AICHE Senior Design ProjectAICHE Senior Design Project
AICHE Senior Design ProjectJonathan Sherwin
 
Energy Efficiency in Thermal System - Case Studies from Nepal
Energy Efficiency in Thermal System - Case Studies from NepalEnergy Efficiency in Thermal System - Case Studies from Nepal
Energy Efficiency in Thermal System - Case Studies from Nepaleecfncci
 

Similar to Heat recovery design for starbucks store retrofit_BS (20)

An Minh Tran - Case 3 - Cheg 407
An Minh Tran - Case 3 - Cheg 407An Minh Tran - Case 3 - Cheg 407
An Minh Tran - Case 3 - Cheg 407
 
Leveraging best practices & emerging technologies to optimize industrial proc...
Leveraging best practices & emerging technologies to optimize industrial proc...Leveraging best practices & emerging technologies to optimize industrial proc...
Leveraging best practices & emerging technologies to optimize industrial proc...
 
Seminar Report on Automobile Air-Conditioning based on VAC using Exhaust Heat
Seminar Report on Automobile Air-Conditioning based on VAC using Exhaust HeatSeminar Report on Automobile Air-Conditioning based on VAC using Exhaust Heat
Seminar Report on Automobile Air-Conditioning based on VAC using Exhaust Heat
 
Senior Design Final Report (Fin)
Senior Design Final Report (Fin)Senior Design Final Report (Fin)
Senior Design Final Report (Fin)
 
MECE4410U - Project Report (Final)
MECE4410U - Project Report (Final)MECE4410U - Project Report (Final)
MECE4410U - Project Report (Final)
 
Solar oven ProjectReport
Solar oven ProjectReportSolar oven ProjectReport
Solar oven ProjectReport
 
“SEMINAR REPORT ON SOLAR ASSISTED VAPOUR ADSORPTION REFRIGERATION SYSTEM”
“SEMINAR REPORT ON SOLAR  ASSISTED VAPOUR ADSORPTION REFRIGERATION SYSTEM”“SEMINAR REPORT ON SOLAR  ASSISTED VAPOUR ADSORPTION REFRIGERATION SYSTEM”
“SEMINAR REPORT ON SOLAR ASSISTED VAPOUR ADSORPTION REFRIGERATION SYSTEM”
 
ME 490_HaydenYoungs_FinalReport.FinalCopy
ME 490_HaydenYoungs_FinalReport.FinalCopyME 490_HaydenYoungs_FinalReport.FinalCopy
ME 490_HaydenYoungs_FinalReport.FinalCopy
 
Design and simulation of a multiple effect evaporator using vapor bleeding
Design and simulation of a multiple effect evaporator using vapor bleedingDesign and simulation of a multiple effect evaporator using vapor bleeding
Design and simulation of a multiple effect evaporator using vapor bleeding
 
CBE480ProjectReport
CBE480ProjectReportCBE480ProjectReport
CBE480ProjectReport
 
Inlet Air Cooling system from Ikeuchi Improve gas Turbine efficiency
Inlet Air Cooling system from Ikeuchi Improve gas Turbine efficiencyInlet Air Cooling system from Ikeuchi Improve gas Turbine efficiency
Inlet Air Cooling system from Ikeuchi Improve gas Turbine efficiency
 
Development of a Bench-Top Air-to-Water Heat Pump Experimental Apparatus
Development of a Bench-Top Air-to-Water Heat Pump Experimental ApparatusDevelopment of a Bench-Top Air-to-Water Heat Pump Experimental Apparatus
Development of a Bench-Top Air-to-Water Heat Pump Experimental Apparatus
 
Case study Energy Audit for Chiller Plant
Case study Energy Audit for Chiller PlantCase study Energy Audit for Chiller Plant
Case study Energy Audit for Chiller Plant
 
An overview of diagnostic tools used in RESNET testing
An overview of diagnostic tools used in RESNET testingAn overview of diagnostic tools used in RESNET testing
An overview of diagnostic tools used in RESNET testing
 
Experimental investigation of waste heat recovery system for domestic refrige...
Experimental investigation of waste heat recovery system for domestic refrige...Experimental investigation of waste heat recovery system for domestic refrige...
Experimental investigation of waste heat recovery system for domestic refrige...
 
Condenser pg test
Condenser pg testCondenser pg test
Condenser pg test
 
Power Cycles
Power CyclesPower Cycles
Power Cycles
 
Ian tuena (1) nrc presentation hpe2016
Ian tuena (1) nrc presentation hpe2016Ian tuena (1) nrc presentation hpe2016
Ian tuena (1) nrc presentation hpe2016
 
AICHE Senior Design Project
AICHE Senior Design ProjectAICHE Senior Design Project
AICHE Senior Design Project
 
Energy Efficiency in Thermal System - Case Studies from Nepal
Energy Efficiency in Thermal System - Case Studies from NepalEnergy Efficiency in Thermal System - Case Studies from Nepal
Energy Efficiency in Thermal System - Case Studies from Nepal
 

Heat recovery design for starbucks store retrofit_BS

  • 1. HEAT RECOVERY DESIGN FOR STARBUCKS STORE RETROFIT LABORATORY BENCH TEST April, 2016 Prepared By: Dr. Thomas Bradley Associate Professor College of Engineering Colorado State University Chris Anderson Graduate Research Assistant College of Engineering Colorado State University Becca Stock Undergraduate Research Assistant College of Engineering Colorado State University Stephanie Barr Project Manager Institute for the Built Environment Colorado State University Prepared For: Urano Robinson Director– Global Innovation&Technology –Global R&D Starbucks Coffee
  • 2. 1 CONTENTS Executive Summary ............................................................................................................................3 Introduction.......................................................................................................................................4 Testing Model Assumptions ................................................................................................................4 Air Conditioning System Savings ......................................................................................................5 Total Waste Heat.........................................................................................................................5 Total Air Conditioning Hours........................................................................................................6 Hot Water Preheat..........................................................................................................................7 Refrigerator Efficiency.....................................................................................................................8 Part 1: Laboratory vs. In-Store Data Logging..................................................................................8 Part 2: Refrigeration Efficiency as a Function of Water Loop Temperature......................................9 Part 3: Water-Cooled vs. Fan-Cooled..........................................................................................10 System Energy Use........................................................................................................................12 Pump........................................................................................................................................13 Fan...........................................................................................................................................13 Costs............................................................................................................................................14 Updated Model................................................................................................................................14 Sensitivity Analysis............................................................................................................................15 Next steps........................................................................................................................................16 Areasfor further research.................................................................................................................16 Appendix..........................................................................................................................................17 Appendix A...................................................................................................................................17 Building Energy Model...............................................................................................................17 Appendix B...................................................................................................................................22 Heat Rejection Calculations........................................................................................................22 Appendix C...................................................................................................................................23 Fan Duty Cycle ..........................................................................................................................23 Appendix D...................................................................................................................................26 Refrigeration Efficiency..............................................................................................................26 Small Refrigeration Units (1 door refrigerator, 1 door freezer, 2 door refrigerator)........................26 Large Refrigeration Units(vertical food case, horizontal food case,ice machine) ..........................28 Refrigeration Load vs. Power Consumption.................................................................................30 Appendix E...................................................................................................................................31
  • 3. 2
  • 4. 3 EXECUTIVE SUMMARY In accordance with task order #3 of the master research agreement between Colorado State University and StarbucksCoffee Company,the teamfromColorado State Universitywasresponsible forperforming a heat recovery and mechanical efficiency feasibility assessment. This assessment was completed on December15,2015. Aspart of the feasibilityassessment,anaddendumtothe masterresearchagreement was included. This addendum outlined a plan for preliminary laboratory testing of the water loop heat recovery system prior to the installation of the final design in store #14944. The objective of thisreportisto documentthe resultsof thislaboratorytestingandtomodifythe systemperformance modelaccordingly.The followingfigureprovidesaside-by-sidecomparisonof the valuesdetailedinthisreportandthe original modeledvalues: Figure 1: Results from Laboratory Testing, Original Modeled Values Reduced Air Conditioning Load 13,050 kWh $2,870 Increased Heating Load -380 therms -$400 Hot Water Preheat 9,100 kWh $1,980 Refrigeration Efficiency -3,400 kWh -$750 System Energy Use -4,660 kWh -$1,030 Equipment Labor System Costs Simple Payback 2.8 years Annual System Energy Savings $4,200 $3,500 Reduced Air Conditioning Load 15,000 kWh $3,300 Increased Heating Load - - Hot Water Preheat 8,140 kWh $1,790 Refrigeration Efficiency 2,700 kWh $600 System Energy Use -4,660 kWh -$1,030 Equipment Labor 1.8 years Annual System Energy Savings System Costs $4,800 $4,000 Simple Payback Laboratory Tested Values Original Model Values
  • 5. 4 INTRODUCTION The firstdesignreportsubmittedbythe teamfromCSU outlinedfouroriginaldesignoptions,and providedadetailed feasibilityanalysisforthe designoptionselected.The final designoptionselected was the waterloopheatrecoverysystem.Asperthe masterresearchand developmentagreement betweenCSUandStarbucksCoffee Company,the final designwill be installed inStarbucksstore #14944, locatedat 1708 S. College Avenue inFortCollins,CO. As an addendumtothe masterresearchanddevelopmentagreement,itwasdeterminedthatpriorto the actual in-store installation the systemshouldbe testedinalaboratoryto minimize financial risks associatedwithuncertaintiessurroundingthe system’sperformance.Theseuncertaintiesincluded: validationof waterloopeffectivenessproviding appropriatecondensercooling;heatoutputof each refrigerationunitatdifferentoperatingconditions;refrigerationefficiencyvariationdue tochangesin environmental conditions;andproposedsystemenergyconsumption.Thisreportoutlinesthe resultsof the laboratorytestingdirectedtowardsaddressingeachof these uncertainties. TESTING MODEL ASSUMPTIONS A laboratorymockupof the proposedheatrecoverysystemwasdesignedtotestasmany components of the systemaspossible inthe lab.A schematicof the systemisshownin Figure 2. Figure 2: Lab Set-up Schematic
  • 6. 5 The refrigerationequipmentusedinthe labsetupwasprovidedbyStarbucksinthe standard air-cooled conditionwiththe exceptionof the ice machine.A licensedrefrigerationcontractorwasusedto install the watercooledcondensersoneachof the units. The condensingunitswerethenconnectedby¾” PEX waterline.PVC“T”fittingswere usedtohouse watertemperature loggers.Theseloggerscould be placedat any pointinthe cycle dependingonthe requirementsof eachindividualtest.The loopis controlledbyatemperature sensorwhichcyclesthe fantomaintainasteadywater looptemperature. There isalso a deaeratortankjustbefore the pump,whichisdesignedtopreventairbubblesinthe system.This tankalsoallowswatertobe addedtofill the systemasthere isno waterconnectioninthe lab.In the sectionsbelow,detailsof eachtestrun andthe resultsof eachare outlinedbelow bymodel component. Air Conditioning System Savings There are twofactors that contribute tothe air conditioningsavingsof the system:the amountof waste heatremovedbythe systemandthe numberof hoursperyear that the air conditioningsystemis running. Total Waste Heat To understand how much waste heat each of the refrigerationunits was producing, temperature before and after the condenser was measured. This allowedthe total unit to be calculated as outlinedin Appendix B Heat RejectionCalculations.The heatproducedbyeachunit isshownin Table 1. Table 1: Waste Heat Produced by Unit RefrigerationUnit Waste Heat (Btu/h) 1-Door Refrigerator 590 2-Door Refrigerator 1,060 1-Door Freezer 1,080 Vertical FoodCase 7,040 Horizontal FoodCase 3,390 Ice Machine 8,620 Total 21,780 To confirmthisdata, the total heatload of the systemwasmeasuredduringthe testrun. A sample of the data is shownin Figure 3.
  • 7. 6 Figure 3: Total Waste Heat from Refrigeration Units By comparingthe data derivedfromthese twomethods,the total waste heatcanbe confirmedtobe about22,000 btuper hour. Total Air Conditioning Hours Since the laboratory set up couldn’t be used to determine to number of hours per conditioning system is running, a simple building energy model was built. In this gains from equipment and people were compared to estimated heat gains or losses and the building walls and roof. If the total heat gains were larger than the losses, system would be required to remove the excess heat. For details on the building energy model see Appendix A BuildingEnergyModel.The resultsof thismodel forastore withthe same layoutas the model store but locatedinSan Diego,CA are shownin Figure 4. 0 5,000 10,000 15,000 20,000 25,000 30,000 35,000 13:22 13:24 13:26 13:28 13:30 13:32 13:34 13:36 13:39 13:41 13:43 13:45 13:47 13:49 13:51 13:53 13:55 13:57 13:59 14:01 14:04 14:06 14:08 14:10 14:12 14:14 14:16 14:18 Btu/h SystemHeat Output
  • 8. 7 Figure 4: Building Heat Loss/Gain From thishistogram,we canestimate thatthe numberof hoursthe air conditioningsystemrunsfor approximately 7,291 hoursper yearor about 10 monthsperyear.For the remaining1,469 hoursper year,the buildingisinheatingmode.Thismeansthatthe systemactuallycausesthe heatingsystemto use more energysince itisnot beingassistedbythe waste heatinthe building. Usingthe waste heatvaluesfromourlab testingandthe buildingsystemmodel,the updatedestimate of the air conditioning savingsisasfollows: Air Conditioning Savings: 13,050 kWh per year Additional Heating Costs: 380 therms per year Hot Water Preheat In the data presentedinDecember,the wateruse atthe model store hadbeenloggedandusedwiththe efficiencydataof the heatexchangerto calculate the expectedheatrecoverypotential.These calculationsusedawaterlooptemperature of 100°F. Duringlaboratorytestingitwasdeterminedthat the refrigeratorsstopoperatingproperlywithwaterlooptemperaturesabove 100°F,so the heat recovery calculationswere repeatedwiththe three looptesttemperatures:75°F,85°F, and 95°F. Due to concernsaboutthe size of the indirecthot waterheaterforthe domestichotwaterpreheat, the heat recoveryof the plate-and-frame heatexchangerwascalculatedforthisapplicationaswell.The results are outlinedin Figure 5.
  • 9. 8 Figure 5: Preheat Savings by Loop Temperature From these calculations,itwasdeterminedthatthe indirecthotwaterheatercanrecoverabout13% more energywhenpreheatingwaterfor the domestichotwaterheaterthanthe plate-and-frame heat exchanger.Giventhe space considerationsand consideringthatthe indirecthotwaterheaterisa larger investmentthanthe plate-and-frameheatexchanger,itis recommendedthatthe plate-and-frame heat exchangerbe usedforthe domestichotwaterpreheat aswell asthe coffee waterpreheat. By comparingthese calculationstothe refrigerationefficiencydataitwasdeterminedthat95°F isthe optimal looptemperaturetomaximizesavings.Thismeansthatthe estimatedtotal hotwaterpreheat savingsisas follows: Total Water Preheat Savings: 8,250 kWh per year Refrigerator Efficiency One of the mainobjectivesof the laboratorytestingwastoanalyze the effectof the water-cooled condenserson the refrigerationefficiencyforeachunit.Thisstudycanbe dividedintothreemain components:comparingthe laboratoryoperationtothe in-store operation,the refrigerationefficiency changesat varyingwaterlooptemperatures,andcomparingthe air-cooledoperationtothe water- cooledoperation. Part 1: Laboratory vs. In-Store Data Logging The goal of the firstpart of this studywas to determine arelationshipbetweenlaboratorydataandreal worlddata.Due to space constraintsandissuesregardingthe disruptionof normal store operation,only the three smaller,True Refrigeratorswere dataloggedinthe store.The powerdraw of the equivalent refrigerationunitswere alsodataloggedinthe lab.A comparisonbetweenthe in-storedataandthe laboratorydata forthese refrigeratorsisshownbelow: 0 1,000 2,000 3,000 4,000 5,000 6,000 75 80 85 90 95 EnergySavings(kWh/yr) Water Loop temperature (°F) DHW with Indirect Water Heater DHW with Plate and Frame Heat Exchanger Coffee Water
  • 10. 9 Table 2: In-Store Power Draw vs. Laboratory Power Draw It isevidentthatthe in-store refrigeratorsoperateata much higheraverage power thanthe same units inthe lab.There are several possiblereasonsforthis discrepancy.The firstpossibilityisthat the in-store refrigeratorssee agreaterheatloadthan the laboratoryrefrigerators.The constantopeningandclosing of the doorsallowsheatin,andultimatelyresultsinthe compressorworkingharderandlonger. There is not an additional heatloaddue tothe foodstoredinthe refrigeratorsbecause itisall deliveredtothe store cold.To account for the heatload discrepancy,the 14944 Starbucksstore was monitoredover the course of a week,andthe numberof timeseachrefrigeratorwasopenedwascounted.Then,the refrigeratorsinthe laboratorywere dataloggedagain,butthisincludingperiodicopeningsof the doors. The resultsare shownbelow: Table 3: Laboratory Testing, Simulated Store Operations Thisstudydemonstratedthat loadconditions cannotaccountforthe discrepancybetweenrefrigerator operationinthe laband inthe store. Anotherpossible cause isthe difference inthe ambientair condition.The labiskeptat 70°F and the refrigeratorsare locatedinthe centerof a room where they are well ventilated.Inthe store,the roomtemperature is setat68°F, but the refrigeratorsare located againsta wall.It islikely thatthe airsurroundingthe condensersispoorlycirculatedandtherefore significantlywarmerthanthe roomtemperature.Inaddition,the in-store refrigeratorsare olderand may be sufferingfromwear-and-tearascomparedtothe newerlabunits. Instore testingwill be requiredtoconfirmrefrigerationefficiencychangesundernormal operatingconditions. Part 2: Refrigeration Efficiency as a Function of Water Loop Temperature The secondpart of thisstudyfocusedonunderstandingthe effectof the waterlooptemperatureon the efficiencyof the refrigerationunits. Several experimentswere conductedwhichinvolvedoperatingeach refrigerator and data logging the entering water temperature for the condenser as well as the refrigeratorpowerdraweachsecond overa periodof several hours.The temperaturewasincrementally Unit In-Store Average Power Draw, W Laboratory Average Power Draw, W 1-Door Refrigerator 126.3 81.6 2-Door Refrigerator 460.2 182.3 1-Door Freezer 268.5 194 Unit Number of Openings per Hour Resulting Laboratory Average Power Draw, W 1-Door Refrigerator 0.33 75 2-Door Refrigerator 4.6 177 1-Door Freezer 1.8 209
  • 11. 10 varied to determine the refrigerator’s response to different water loop temperatures. The results are shown in Figure 6 below: Figure 6: Refrigerator Power Consumption as a Function of Entering Water Temperature For the three smallerrefrigerators,eachdatapointrepresentsanaveragedvalueoverone cycle of refrigeration.Usingthe datapointsat each of the three temperature increments,anequationwas
  • 12. 11 developedforthe average powerof eachunitasa functionof the enteringwatertemperature tobe usedformodelingpurposes. For the two foodcases,eachpointrepresentsan averagedvalue overaperiodof aboutthree hoursof operationata setwatertemperature.Forthe vertical foodcase, the compressorwasloadedduringthe entire testinginterval forall testsof the water-cooledcondenser.Thisislikelyanindicationthatthe condensercoil isundersized. The ice machine wastreatedseparately.Accordingtomanufacturerspecifications,anice machine operatingwithawater-cooledcondenserrequires4.3kilowatthoursper100 poundsof ice produced,or 0.043 kWh/lbof ice.Two water loop temperature incrementswere testedinlab,andinbothinstances, the ice machine maintained anenergyconsumption within1% of manufacturerspecifications. Therefore,itwasdeterminedthatwaterlooptemperature hadnegligible effectontotal power consumption,butitwasnotedthat there wassome evidence of increasedbatchtimes,upto15% longer,withhigherlooptemperatures. Part 3: Water-Cooled vs. Fan-Cooled Priorto installingthe water-cooledcondensers,all refrigerationunitswerefirsttestedwiththeir standardair-cooledcondensers(excludingthe ice machine,whichwasshippedwithawater-cooled condenser). Duringlaboratorytesting describedinpart2, it was observedthatbothloadedpowerand dutycycle were affectedbychangesinwaterlooptemperature.Consideringthe heatoutputof eachunitand the workrequirementof the radiator,the operatingpointforthe waterlooptemperature tomaximize energysavings is95°F. A comparisonof the average powerconsumptionof eachunitisshownbelow: Table 4: Lab Testing, Air-Cooled at 70°F vs. Water-Cooled at 95°F *The air-cooleddataforthe ice machine istakenfrommanufacturerspecifications.The ice machine cooledbya water-cooledcondenserwastestedandcomparedtomanufacturerdata,andenergy consumptionperpoundof ice waswithin1% of the quotedspecs. In mostinstances,the water-cooledcase requiresslightlygreateraverage powerthanthe air-cooled case,withthe exceptionof the ice machine.The vertical foodcase,however,seesasignificantincrease inaverage power,almost475 Watts.Afteranalyzingthe data,inthe air-cooledcase,the unit’s Unit Air-Cooled Power Draw, W Water-Cooled Power Draw, W 1-Door Refrigerator 81.6 89.1 2-Door Refrigerator 182.3 223.9 1-Door Freezer 194 230.1 Vertical Food Case 884.5 1,359 Horizontal Food Case 641 692 Ice Machine* 1,290 1,070 Total 3,273 3,664
  • 13. 12 compressorcycledasexpected.Butinthe water-cooledcase,the unit’scompressoroperated constantly. Thisdramatic reductioninefficiencymostlikelysuggeststhe needforalargerwater-cooledcondenser coil. Asan example case todemonstrate the significanceof aproperlysizedcondensercoil versusan improperlysizedcondensercoil,the 1doorfreezerwasinitiallyretrofittedwitha1/3 hp coaxial coil. However,afteranalyzingthe powerloggeddataof the unit,itwas determinedthatthe freezer experiencedadrasticreductionof efficiencywithincreasinglooptemperatures.The 1/3hp coaxial coil was replacedwitha1 hpcoaxial coil.The following figure illustratesthe results.Due to time constraints, additional retrofitswere notpossible. Figure 7: Freezer Duty Cycle for Two Distinct Condenser Coil Sizes From Figure 7, itis evidentthatthe dutycycle of the unitissignificantlyimpactedbythe size of the condensercoil.Fora waterlooptemperature of 98°F,the freezerdutycycle usinganundersized condensercoil isabout75%, as opposedtoabout53% for a properlysizedcoil. A properly sized water-cooled condenser coil would likely reduce the modeled average power consumption of theverticalfood casefrom1,359Wattsto around 884 Watts,a reduction of 475 Watts. This equates to a difference in annual energy consumption of 4,160 kWh. However, becausethe lower numberhasnotbeen experimentally validated,themodel reflects the higher value for average power. There isan additional caveattothe sharp reductioninthe vertical foodcase efficiency.The air-cooled vertical foodcase testedinlabdemonstratedmultiple on/off refrigerationcycles,butafterthe water- cooledcondenserwasretrofitthe compressorranconsistently.Afterinspection,itwas discoveredthat the vertical foodcase inthe 14944 store doesnot exhibitany compressorcycling,andinsteadruns constantly.Itislikelythatthe average powerconsumptionof the labtestedvertical unitissignificantly lowerthanthe average powerof the same unitoperatinginthe store.Thisdiscrepancyhassignificant implicationsforthe model developedtopredictthe annual savingsof the system. It is likely thatthe vertical unit tested in the lab with a water-cooled condenser,which seemsto be operating inefficiently relative to the air-cooled case, is actually operating similar to the air-
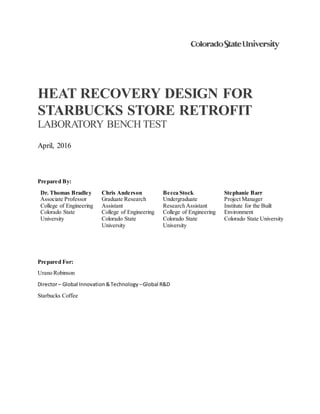
  • 14. 13 cooled case in the store. If this is the case, it would negate the negativeeffectsof refrigeration efficiency currently built into the model, a positive change of around 3,425 kWh per year. Refrigeration Efficiency Decrease: 3,425 kWh per year System Energy Use To findthe netenergysavingsof the system, the total energyusedtorunthe systemneededtobe determined.The laboratoryteststodetermine the electrical use forthe circulationpumpandthe exteriorradiatorfansare outlinedbelow. Pump Due to the large pressure dropof the waterloop,a positive displacement pumpwas chosen toprovide the necessaryflow rate andpressure.A diagramof a positive displacementpumpisshownin Figure 7.In thisstyle of pump,the watercominginfillsupthe compartmentandthenthe rotationof the pumpmovesthatwasterto the outletside.Due tothe designof thispumpthe flowrate is nearlyindependentof the pressure beingproducedbythe pump.Thisisbecause a constantvolume of wateris beingmovedfromthe inlettothe outletforeveryrotation of the motor independentof anypressure changes.Onthe pumpcurve forthe chosen pump,the flowrate variesfrom5.43 to 5.51 gallons-per-minute overa pressure change of 50 to 250 psi.The onlydifference inoperationatthe higheroperatingpressuresisthe higherpressuresrequire alargerinputof energyfromthe motor. In the lab,the flowrate of the systemwasmeasuredtobe 5.5 gallons-per-minuteandthe powerof the pumpwas loggedtobe 400-watts. The pumprunsconsistentlysothiscanbe usedtofindthe annual energyuse of the pump. Pump Energy Use: 3,500 kWh per year Fan To reject the waste heat outside, two radiator and fan pairs are used. The fan a temperature sensor that cycle the fan on or off to maintain a constant water step to determining the amount of time each fan will runwas to determine the heat radiator withthe fan on and withthe fan off. To do this coldwater was run thought temperature of the water was recorded before and after the radiator withthe fan on these heat rejectionefficiencyvalues and the total measured waste heat from the the fan duty cycle could be calculated as a function of outside air temperature. For experiment and calculations see Appendix CFan DutyCycle.The fan dutycycle by outside airtemperature alongwiththe numberof hoursat that temperature are shownin Figure 9. Figure 8: Positive Displacement Pump
  • 15. 14 Figure 9: Fan Run Time Data By multiplyingthe numberof hoursat each temperature withthe dutycycle atthat temperature,the numberof hoursthe fanwill runperyear can be calculated.Inthe lab,the powerdraw of the fanwas measuredtobe 160-watts, so the calculatedfanenergyuse is: Fan Energy Use: 1,160 kWh/year Costs Total systemcostscan be dividedintomaterialcostsandlaborcosts. A complete listof equipmentis providedin Appendix .Laborcostsinclude retrofittingthe water-cooledcondenserstoeach refrigerationunitandinstallingthe systeminthe store. For laboratorytestingof the units,the retrofitof the refrigeratorcondenserswasperformedintwo phases,whichincreasedthe laborcostsforthe retrofit.Toestimate whatthe laborprice mightbe we tookthe quotedcostto retrofitone unit,$520, andmultiplieditbysix units. Finally,the price of installingthe systemhasanadditional 4hours of laborfor a plumberat $95/hr, or $380. Total system costs are shownbelow: EquipmentCost—$4,200 Labor Cost—$3,500 Total Cost—$7,700 UPDATED MODEL From the laboratoryanalysisdescribedinthisreport,the savings model canbe updatedasshownin Energy Savings Cost Savings ReducedAir ConditioningLoad 13,050 kWh $2,870 0 100 200 300 400 500 600 700 800 0% 20% 40% 60% 80% 100% 120% 50 55 60 65 70 75 HoursPerYear FanDutyCycle Outside Air Temperature (F) Outside Air Temperature Fan #1 Fan #2
  • 16. 15 IncreasedHeating Load -380 therms -$400 Hot WaterPreheat 8,250 kWh $1,820 RefrigerationEfficiencyChanges -3,420 kWh -$750 SystemEnergy Use -4,660 kWh -$1,030 Total Energy Savings 13,220 kWh -380 therms $2,520 EquipmentCosts $4,200 InstallationCosts $3,500 Total Installation Costs $7,700 Simple Payback 3 years SENSITIVITY ANALYSIS Due to the uncertaintyinherentintranslating the systemfromthe labtothe store,a sensitivityanalysis was done todetermine the effectvariationsinthe inputsof the valuesonthe annual savings.Forthis analysis,the valuesof annual airconditioningrunhours,refrigerationwasteheat,coffee wateruse, domestichotwateruse,and refrigerationenergychangeswere variedby+/-25%.The effectthat varyingeachof these componenthasonthe annual savingsisshownin Figure 10. Figure 10: Sensitivity Analysis +/- 25% Current Estimates From thisanalysis,itcanbe determinedthatthe airconditioninghoursandamountof waste heat removed have the largestimpactonthe annual savings. Tounderstandhow the variationof eachof the componentsinteract,aMonte Carlo simulation.Forthissimulation randomvalues foreachof the variableswithin the range describedabovewere chosen andthe resultingannual savingswas calculated.The simple paybackperiodof eachof the 150 simulationsare showninthe histogramin Figure 11. $1,500 $2,000 $2,500 $3,000 $3,500 Annual Savings Air Conditioning Hours Waste Heat Removed DHW Use Coffee Water Use Refrigeration Energy Changes
  • 17. 16 Figure 11: Monte Carlo Simulation From thissimulationwe cansee thatthe simple paybackperiodof the installationof the systemis below 5 years99% of the time and nearly50% of the simulationsresultedinasimple paybackperiodof 3 yearsor less. NEXT STEPS The purpose of the laboratorytestingwastovalidate the model originallydevelopedforthe waterloop heatrecoverydesign,andtoverifythe system’sfunctionality.These objectiveshave beenmet.The next stepinthe agreementbetweenCSUandStarbucksCoffee Companyisthe install the waterloopheat recoverysysteminthe 14944 Starbucksstore. The in-store implementationof the waterloopheatrecoverysystemwill provide real time dataforthe system’seffectiveness,bothintermsof HVACsavingsaswell aswaterheatingsavings.The in-store installationwilleliminate anyuncertaintiesassociatedwiththe differencesbetweenin-labandin-store refrigerationperformance. The final resultsof the in-store installationswillbe usedtofinalize adecision tool to be usedto determine the system’sperformance andpaybackperiodfordifferentStarbucks storesaroundthe country. AREAS FOR FURTHER RESEARCH While the resultsfromthe labtestingshow thatthissystemiswell suitedforimplementationinstores insouthernCalifornia,the followingare some ideastohelpincrease the efficiencyof the systemor make it more applicable toawidervarietyof climates. 1. Addcontrolsto directheatback inside whenneededforcoolerclimates. 2. Investigate optionstoincrease heat rejectioninwarmerclimates suchasevaporative pre- coolingor coolingtowers. 0% 10% 20% 30% 40% 50% 60% 70% 80% 90% 100% 0 2 4 6 8 10 12 14 16 18 20 2.1 2.3 2.4 2.6 2.8 3.0 3.2 3.4 3.6 3.8 3.9 4.1 4.3 4.5 4.7 4.9 5.1 5.3 5.4 Simple Payback(years)
  • 18. 17 3. ConsiderVFDcontrolsonthe pump to vary the flow rate rather thanthe fanduringcooler weather. 4. Install time of daycontrols to lowerlooptemperatureovernighttoincrease refrigeration efficiency whenhotwaternotrequired. APPENDIX Appendix A Building Energy Model To helpunderstandthe total hoursperyearthe airconditioningsystemisrunning,asimple building energymodel wascreatedusingstore 14944. The firstcomponentof the store’sheatloadthat was consideredwasthe contributionfromthe envelope.The valuesusedforthese calculations are outlined inTable 5. Table 5: Building Energy Model Values Roof NorthWall WestWall SouthWall East Wall Total Area(ft2 ) 2,973 700 400 700 400 U (btu/h/ft2 /°F) 0.61 0.72 0.7 0.7 0.7 % AreaWindows 0% 0% 50% 50% 0% U (btu/h/ft2 /°F) - - 0.53 0.5 - ShadingCoefficient - - 0.444 0.44 - To estimate the heatgainor lossthroughthe wallsandroof the followingequationwasused. 𝑄 = 𝑈 × 𝐴 × ( 𝑇𝑠 − 𝑇𝑖) Where Q = Total heatgainsor losses(Btu/h) U = Heat transferrate of material (Btu/h/ft2 /°F) A = Surface Area(ft2 ) Ts = Sol-airTemperature (see explanationbelow) Ti = Indoortemperature setpoint(occupied:68°F/ Unoccupied:63°F) The sol-airtemperature isatermusedto incorporate the heatgainsdue to solarradiationintothe outdoorair temperature value.Tocalculate the sol-airtemperature,the amountof solarradiationthat ishittingthe surface at a right angle mustbe determined.Thisvalue isafunctionof the time of day,the latitude of the building,andthe surface orientationas showninthe followingequations: 𝑅𝑜𝑜𝑓: 𝑇𝑠 = 𝑇𝑜 + (0.8) × 𝐺𝑠ℎ 30 𝐺𝑠ℎ = 𝐺 × [sin 𝛿 sin 𝜑 + cos 𝛿 cos 𝜑 cos 𝜔] 1 ASHRAE valuefor wood deck roofs 2 ASHRAE valuefor stud walls 3 ASHRAE valuefor doublepane windows 4 ASHRAE valuefor doublepane windows is 0.88;reduced by 50% to accountfor overhang shadingwindows
  • 19. 18 𝑊𝑎𝑙𝑙: 𝑇𝑠 = 𝑇𝑜 + (0.8) × 𝐺𝑠𝑣 30 𝐺𝑠𝑣 = 𝐺 × [− sin 𝛿 cos 𝜑cos 𝛾 + cos 𝛿 sin 𝜑 cos 𝛾cos 𝜔 + cos 𝛿sin 𝛾 sin 𝜔] 𝛿 = 23.45 × 𝑠𝑖𝑛[360 + 𝑁 𝑑 + 284 365 ] 𝜔 = (𝑡𝑖𝑚𝑒 − 12) × 360 24 Where To = Outside air temperature (°F) G = Solar radiation at the earth’s surface (254 btu/h/ft2) ϕ = Latitude γ = Orientation of wall (south = 0, east = -90, west = 90) Nd = Day number (between 1 and 365) For example,the sol-airtemperature forthe southfacingwall atnoononJanuary 1st in SanDiegowould be calculatedas follows: 𝛿 = 23.45 × 𝑠𝑖𝑛 [360 + 1 + 284 365 ] = −23 𝜔 = (12 − 12) × 360 24 = 0 𝐺 𝑠𝑣 = 254 × [−sin(−23)cos(32.7)cos(0) + cos(−23)sin(32.7)cos(0)cos(0) + cos(−23)sin(0)sin(0)] = 210 𝑇𝑠 = 62 + (0.8) × 210 30 = 68 Thisvalue is thenusedinthe heat gaincalculationtodetermine the heatgainorloss thoughthe wall area forthishour. Continuingthe examplefromabove: 𝑄 = 0.7 × (700 𝑓𝑡2 × 50%) × (68 − 68) = 0 𝑏𝑡𝑢 ℎ Since 50% of thiswall iscomprisedof windows,the heatgainorlossthroughthe windowsalsoneedsto be calculated. Forwindows,boththe conductive heattransferthrough the windowsandthe solarheat gainfrom radiationpassingthroughthe window mustbe takenintoaccount.Todo thisthe following equationisused: 𝑄 = 𝐴[ 𝑈( 𝑇𝑜 − 𝑇𝑖) + 𝐺𝑠𝑣 𝐹𝑟𝑒𝑓 𝑆𝐶] Where Fref = Baseline radiation transmission value based on single pane windows, 0.87 SC = Shading coefficient to adjust for shading and different window types, 0.44 For the southfacingwall describedabove:
  • 20. 19 𝑄 = 700 × 50% × [0.7(62 − 68) + 210 × 0.87 × 0.44] = 26,600 𝑏𝑡𝑢 ℎ These calculationsare done forthe roof and all fourwallsforeach hourof the year the determine the heatloadof the buildingenvelope.The nextcomponentof the building’sheatloadisthe ventilation load.The ventilationloadiscalculatedusingthe followingequation: 𝑄 = 𝑉̇ × 𝐴 × 𝑐 𝑝 × 𝜌 × ( 𝑇𝑜 − 𝑇𝑖) Where 𝑉̇ = Volumetric flow rate, 0.5 CFM A = Building Area, ft2 Cp = Heat capacity of air, 0.24 Btu/lbm/°F ρ = Density of Air, 0.07 lbm/ft3 For the buildinginSanDiego atnoon onJanuary 1st , the heatgain due to ventilationisgivenby: 𝑄 = 0.5 × 2,973 × 0.24 × 0.7 × 60 𝑚𝑖𝑛 ℎ𝑜𝑢𝑟 × (62 − 68) = −8,990 𝑏𝑡𝑢 ℎ Again,these calculationswere done foreveryhourof the yeartounderstandthe contributiontothe building’sheatloadfromventilation. The nextcomponentof the model isthe internal heatloaddue tothe employeesandthe customers. The firststepwas to understandthe numberof people inthe store atvarioustimesinthe day.For this estimate,we wenttoGoogle mapsandpulledthe graphsshowingthe busytimesof the day.The graph for Monday’sisshownin Figure 12. Figure 12: Number of Customers from Google Maps By settingthe maximumheightfromanydayas 100%, each hourwas assignedapercentage basedon the heightof the graph comparedto the largestbar. Usingthisdata an average businessateachhour was determined.Basedoninstore observations,the numberof employeesatthe busiesttimesis 8and there are approximately30customers. Since the employeesare standingandwalkingas theywork,itis estimatedthattheyproduce 750 btu/hperperson.The customerstendtobe seated,sotheyare producingabout350 btu/hperperson.Usingthe businessdatafromgoogle mapsandthe observed occupant numberandactivitylevel,the average heatloaddue tothe people byhourcan be determined and isshownin Figure 13.
  • 21. 20 Figure 13: Heat Load due to Customers and Employees The final componentof the buildingenergymodelisthe loaddue tothe equipment.The total heat producedfromeachpiece of equipmentwastakenfromStarbucksequipmentheatsurvey.The equipmentisoutlinedin Table 6. Table 6: Equipment Heat Load Non-BusinessHours (Btu/h) BusinessHours (Btu/h) Machine,Espresso 0 9,628 Brewer - Digital dual 0 6,135 Oven Warming 0 22,726 SoftHeat Server 0 691 Blender 0 3,683 Scale 0 205 Grinder - Coffee 0 409 UnderCounterRefrigerator 942 942 Cooling UnderCounterRefrigerator 471 471 2 DoorUnderCounterRefrigerator 471 471 POS,compact 0 182 Computer/DataRack 1,364 1,364 Warewasher 0 9,760 Lighting 0 8,754 Total 3,248 65,420 Thistable doesnotinclude the 21,777 btu/hrfromthe refrigerationequipmentincludedinthis experiment. The heat loadfromthe envelope,ventilation,people,andequipmentare addedtogetherforeachhour of the yearto determine whetherthe buildingisgainingheatandthe airconditioningsystemwouldbe - 2,000 4,000 6,000 8,000 10,000 12,000 14,000 12:00:00 AM 6:00:00 AM 12:00:00 PM 6:00:00 PM 12:00:00 AM HeatLoad(Btu/h)
  • 22. 21 runningor the buildingislosingheatandthe heatingsystemisrunning.Fromthisanalysis,itis determinedthata buildingsimilarto14944 in San Diegowouldbe inairconditioningmode 7,193hours peryear. To testthe accuracy of the model,the same calculationsdescribedabove wererunforthe store in Fort Collins.The resultsof thisanalysiswere comparedtothe utilitybills. Figure 14showsthe estimated coolinghourspermonthcomparedto the electricbillsforthe store.The coolinghourspeakduringthe same time as the electrical use peaksdue toairconditioninguse. Figure 14: Fort Collins Cooling Hours vs. Electricity bills The same procedure wasdone forthe natural gas bill andthe heatinghours.These resultsare shownin Figure 15. 0 100 200 300 400 500 600 700 800 4,000 6,000 8,000 10,000 12,000 CoolingHoursperMonth kWh 2014 Electrical Energy Use
  • 23. 22 Figure 15: Monthly Heating Hours vs. Natural Gas Bills Againthe general profile of the heatinghoursfollowsthatof the natural gas use.There are many factors that can affectthe energyuse of a buildingbesidesitsHVACloads,sothisdoesnotdefinitivelyprove that the model iscorrect.It does,however,show thatthe model hascapturedthe energyuse trendsof the building,andlikelyprovidesareasonablyaccurate estimate of the numberhoursthatthe air conditioningsystemruns. Appendix B Heat Rejection Calculations Each refrigeratorwastestedatthree temperature incrementsforaperiodof 3-5 hours.Duringthis time,twotemperature loggerswere placedinthe system,one immediatelybefore the unit’scondenser coil,andone immediatelyafter.Thissetupprovidedloggeddataforthe temperature increaseinthe wateras a resultof the heatexchange betweenthe waterloopandthe unit’srefrigerant.Withthe temperature increase known,the heatoutputof the unitwascalculatedasfollows: 𝑄̇ 𝑟𝑒𝑓𝑟𝑖𝑔𝑒𝑟𝑎𝑡𝑜𝑟 = 𝑚̇ 𝐶 𝑝∆𝑇 Sample data,explainhowmeasurednumber,variablesthatcouldeffectinstore (loading,efficiencydue to air circulationproblems) 𝑄̇ 𝑟𝑒𝑓𝑟𝑖𝑔𝑒𝑟𝑎𝑡𝑜𝑟 = Heat outputof refrigerationunit,Btu/hr 𝑚̇ = Mass flow rate of waterthroughloop,lb/hr 𝐶 𝑝 = Specificheatcapacityof water,1.0 Btu/lb-°F ∆𝑇 = Temperature difference measuredbyloggers,°F 0 100 200 300 400 500 600 700 800 900 1,000 0 100 200 300 400 500 600 700 HeatingHoursperMonth kWh 2014 NatualGas Use
  • 24. 23 The onlyvariable onthe righthand side of the equationthatisnot immediatelyknownisthe massflow rate of the water.However,accordingtothe pumpcurve,the flow rate shouldbe between5.43and 5.51 gallonsperminute.A value of 5.5 gallonsperminute wasexperimentallyverifiedinthe lab.This equatestoa mass flowrate of 2,752 lbs/hrof water. This value,aswell asthe specificheatcapacityof water,are constant.Therefore,the heatoutputof eachrefrigeratorisafunctionof the temperature difference loggedinthe experimental setup.The followingfigure displaysthe resultsof thistestingon each unit: Figure 16: Starbucks Refrigerators Heat Output In general,the expectationwouldbe thatthe heatoutputof each refrigeratorwoulddecrease asthe enteringtemperature of the waterincreased.Thisisbecause the higherenteringwater temperature createsa smallertemperature differential betweenthe waterandthe refrigerant,whichtranslatestoa reductioninheattransfer.Withthe exceptionof the vertical foodcase,all of the refrigeratorsabidedby thisexpectation. The unexpectedbehaviorof the vertical foodcase islikelydue tothe undersized condensercoil. Appendix C Fan Duty Cycle The firststepin understandingthe amountof time thatthe exteriorradiatorfanswouldneedtorunis measuringthe radiator’sheatrejection efficiency. Todo thiscoldwater wasrun thoughthe radiator withthe fan onin a 70°F room andthe exitingwatertemperaturewasmeasured.Nextthe fanwas turnedoff and the resultingwatertemperature waslogged.The resultsare shownin Figure 17.
  • 25. 24 Figure 17: Heat Rejection Efficiency Test Results From thistest,we can determine the heatrejectionrate of the radiatorusingthe followingequation. 𝑈𝐴 = 𝑄 ( 𝑇𝑎 − 𝑇 𝑤) ̇ Where 𝑄̇ = Heat Transfer Rate, Btu/h UA = Heat Transfer Efficiency of the Radiator, Btu/h-°F Ta = Average Air Temperature over Radiator, °F Tw = Average Water Temperature through Radiator, °F As discussedinAppendix B,the temperature change overthe radiatorcanbe usedto calculate the heat transferoverthe radiatorwiththe fan on and withthe fanoff. 𝑄̇ 𝑓𝑎𝑛 𝑜𝑛 = 𝑚̇ 𝐶 𝑝∆𝑇 = (2752 𝑙𝑏𝑠 ℎ𝑟 ) × ( 1𝑏𝑡𝑢 𝑙𝑏 ∙ ℉ ) × (6.5℉) = 17,916 𝐵𝑡𝑢 ℎ 𝑄̇ 𝑓𝑎𝑛 𝑜𝑓𝑓 = 𝑚̇ 𝐶 𝑝∆𝑇 = (2752 𝑙𝑏𝑠 ℎ𝑟 ) × ( 1𝑏𝑡𝑢 𝑙𝑏 ∙ ℉ ) × (0.2℉) = 623 𝐵𝑡𝑢 ℎ These twovaluescanbe inputintothe equationabove todetermine aUA value forthis radiator. 𝑈𝐴 𝑓𝑎𝑛 𝑜𝑛 = 17,916 𝑏𝑡𝑢/ℎ (67.2 − 46.4)℉ = 860 𝑏𝑡𝑢 ℎ ∙ ℉ 𝑈𝐴 𝑓𝑎𝑛 𝑜𝑓𝑓 = 623 𝑏𝑡𝑢/ℎ (69.9 − 43.3)℉ = 20 𝑏𝑡𝑢 ℎ ∙ ℉ Usingthese values,the amountof heatthat the radiatorcan rejectat a givenoutside airtemperature is calculated.Example calculationswithanoutside airtemperatureof 50°F isshownbelow. 0 1 2 3 4 5 6 7 2:58:34 PM 3:04:19 PM 3:10:05 PM 3:15:50 PM 3:21:36 PM 3:27:22 PM TemperatureChange(F)
  • 26. 25 𝑄̇ 𝑓𝑎𝑛 𝑜𝑛 50℉ = 𝑈𝐴( 𝑇 𝑤 − 𝑇𝑎) = (860 𝑏𝑡𝑢 ℎ ∙ ℉ ) × (95℉ − 50℉) = 38,780 𝐵𝑡𝑢 ℎ 𝑄̇ 𝑓𝑎𝑛 𝑜𝑓𝑓 50℉ = 𝑈𝐴( 𝑇 𝑤 − 𝑇𝑎) = (20 𝑏𝑡𝑢 ℎ ∙ ℉ ) × (95℉ − 50℉) = 1,054 𝐵𝑡𝑢 ℎ The amount of time that the fanwouldneedtorun to rejectthe 21,777 btu/hof waste heatproduced by the refrigerationunitscanbe foundusingthe followingequation. 𝐷 = (𝑊 − 𝑄̇ 𝑓𝑎𝑛 𝑜𝑓𝑓) ( 𝑄̇ 𝑓𝑎𝑛 𝑜𝑛 − 𝑄̇ 𝑓𝑎𝑛 𝑜𝑓𝑓) Continuingthe example withanoutside airtemperature of 50°F: 𝐷 = (21,777 − 38,780) (38,780 − 1,054) = 55% Thiscalculationisdone foreach outside airtemperature.If the value isabove 100% thenthe same calculationisdone forthe remainingheattofindthe dutycycle of the secondfan.The resultingduty cyclesare thenmultipliedbythe numberof hoursin the year at that outside airtemperature togetthe fan runtime.The calculationsforSanDiegoare shownin Table 7. Table 7: Fan Duty Cycle Calculations Outside Air Temperature (°F) Hours per Year Fan #1 Duty Cycle Fan #2 Duty Cycle Fan #1 Run Time (hours) Fan #1 Run Time (hours) 50 40 55% 0% 21.97 0 51 97 56% 0% 54.56 0 52 201 58% 0% 115.81 0 53 215 59% 0% 126.97 0 54 204 61% 0% 123.55 0 55 252 62% 0% 156.61 0 56 268 64% 0% 171.01 0 57 298 66% 0% 195.38 0 58 322 67% 0% 217.06 0 59 360 69% 0% 249.70 0 60 397 71% 0% 283.55 0 61 375 74% 0% 276.02 0 62 452 76% 0% 343.16 0 63 624 78% 0% 489.09 0 64 651 81% 0% 527.30 0 65 440 84% 0% 368.69 0 66 487 87% 0% 422.61 0 67 561 90% 0% 504.77 0 68 684 93% 0% 638.94 0
  • 27. 26 69 454 97% 0% 440.89 0 70 271 100% 0% 271.00 0 71 236 100% 3% 236.00 6.24 72 231 100% 7% 231.00 16.98 73 210 100% 12% 210.00 26.22 74 217 100% 18% 217.00 39.29 75 150 100% 24% 150.00 36.44 76 62 100% 31% 62.00 19.30 Total 7105 144 The resultingruntime isthensimplymultipliedbythe loggedpowerdraw of the fan,160-watts, to get the annual energyuse of the fan,1,160 kWh peryear. Note:The heattransferrate withthe fanoff is likelylowerinthe labthaninwill be undernormal operatingconditionsdue towindincreasingairmovementoverthe radiator.Thismeansthatthe annual fan runtime may be lowerthanestimated. Appendix D Refrigeration Efficiency In additiontodata loggingthe heatoutputof eachrefrigeratoratdifferentwaterlooptemperatures, the powerconsumptionof eachunitwasalsologged. Asmentionedpreviously,eachrefrigeratorwas testedatthree temperature incrementsforaperiodof 3-5 hours. Small Refrigeration Units (1 door refrigerator, 1 door freezer, 2 door refrigerator) The followingfiguresillustrate twofull refrigerationcyclesforeachsmallerunitateachtestedwater looptemperature: Figure 18: 1 Door Freezer
  • 28. 27 Figure 19: 1 Door Refrigerator Figure 20: 2 Door Refrigerator In general,the refrigerationunitstendedtocycle more frequentlywhenair-cooledas opposedtowater- cooled.However,more frequentcyclingdoesnotnecessarilyindicateagreaterdutycycle.At higher waterlooptemperatures,the cyclestendedtobecome lessfrequent(exceptinthe case of the 1 door freezer),butthe loadedpowerdurationalsoincreased.The followingfigure illustratesthe dutycycle of each refrigerationunitatdifferentwaterlooptemperatures,alongwiththe air-cooleddutycycle:
  • 29. 28 Figure 21: Small Refrigeration Unit Duty Cycles Figure 21 illustratesthe pointatwhicha water-cooledcondenserbecomeslessefficientthananair- cooledcondenserforeachunit.Itshouldbe notedthatthe air-cooledcondenserdatawastakenat an ambienttemperature of 70°F. Large Refrigeration Units (vertical food case, horizontal food case, ice machine) The followingfiguresillustrate arefrigerationcycle comparisonbetweenanair-cooledcondenseranda water-cooledcondenserforeachlargerrefrigerationunit: Figure 22: Horizontal Food Case The horizontal foodcase performedasexpectedinthe lab.Tohelpinterpretthe figure,the average air- cooledpowerconsumptionwas0.64 kW. Again,forthe air-cooledcase,ambientairwasat 70°F. This can be comparedtothe followingwater-cooledaveragepowerconsumptions:
  • 30. 29 Table 8: Horizontal Food Case Average Power Consumption The vertical foodcase didnot performas predicted,asseenbelow: Figure 23: Vertical FoodCase air-cooledcase,the unitcycledasexpected.However,foreverywater- cooledcase,the unitran constantly.Aspreviouslydescribed,thisisalikelyindicationthatthe condensercoil isundersized. The final refrigerationunittestedinthe labwasthe ice machine.Due toits significantlyhigherheat output,a lowertemperature datapointforthe waterloop wasnot possible toobtain.The power consumptionof the ice machine attwo temperature incrementsisshownbelow: Figure 24: Ice Machine Water Loop Temperature, °F Average Power Consumption, kW 76 0.62 85 0.66 91 0.67
  • 31. 30 From Figure 24, it can be seenthata highertemperature inthe waterloopresultsinalonger refrigerationcycle,whichtranslatestoa longertime requirementtoproduce the same amountof ice. However,althoughthe cyclesare longer,the average powerconsumptionisloweratthe higher temperature waterloop. Accordingto the manufacturer,the ice machine requires0.43 kWh perpoundof ice produced, regardlessof operatingconditions.Thisvalue wascorroboratedbythe experimental dataatboth water looptemperature settings,within1%.Thisindicatesthatalthoughthe amountof ice thatcan be producedina givendaymightbe affectedbychangingthe waterlooptemperature,the amountof energyperbatch remainsconstant. Refrigeration Load vs. Power Consumption A controlledexperimentwassetupinwhicha five-gallonbucketof warmwaterwasplacedina refrigeratortoact as a load.A temperature dataloggerwasplacedinside the buckettomonitorits temperature.The powerconsumptionof the refrigerationunitwasloggedduringthe durationof the experiment.The experimentwasperformedoverabouttwohours.Duringthistime period,the refrigeratorcycledsix times.The followingfiguresdemonstrate the resultsof thisexperiment: Figure 25: Refrigeration Load/Power Testing The duty cycle of each refrigerationcycle wasdeterminedeasily.The refrigeratorload(figureonthe right) wasdeterminedbythe change intemperature of the bucketof water.Frombothfigures,itis evidentthatthe loadedpowerof the refrigeratorremainsconstant,despiteachangingload.Fromthis experiment,itwashypothesizedthatthe loadona refrigeratorprimarilyaffectsthe dutycycle,andnot the loadedpower(the average powerwouldbe affectedsimilartothe dutycycle). If true, thishypothesiswasintendedtobe usedpredictivelytodetermine arefrigerator’soperating condition.If the loadona refrigeratordoesnotaffectitsloadedpower,the onlyvariableaffecting loadedpowerwouldbe the effectivenessof the condenser,which iscontrolledbythe waterloop temperature forawater-cooledcondenserorambientairtemperature foranair-cooledcondenser. However,furtherexperimentationdemonstratedthatsubstantial refrigerationloads(leavingthe doors openforextendedperiods,forexample) canleadtoincreasedloadedpowerof the unit.
  • 32. 31 Appendix E The followingtable providesadetailedlistof costsforthe system: Table 9: System Component Costs Description Number Cost Subtotal 1/3 HP Coaxial Coil 1 $67.50 $68 1/2 HP Coaxial Coil 2 $77.50 $155 1 HP Coaxial Coil 1 $137.50 $138 1 1/2 HP Coaxial Coil 2 $112.50 $225 Plate-and-Frame Heat Exchanger 2 $185.95 $372 5 GPMPositive Displacement Pump 1 $454.25 $454 1/3 HP Motor 1 $255 $255 24" x 24" Water-to-Air Radiator 2 $384 $768 1/4 HP Fan 2 $325 $650 Installation Accessories 1 $510 $510 Sensors and Controls 1 $640 $640 Total $4,234