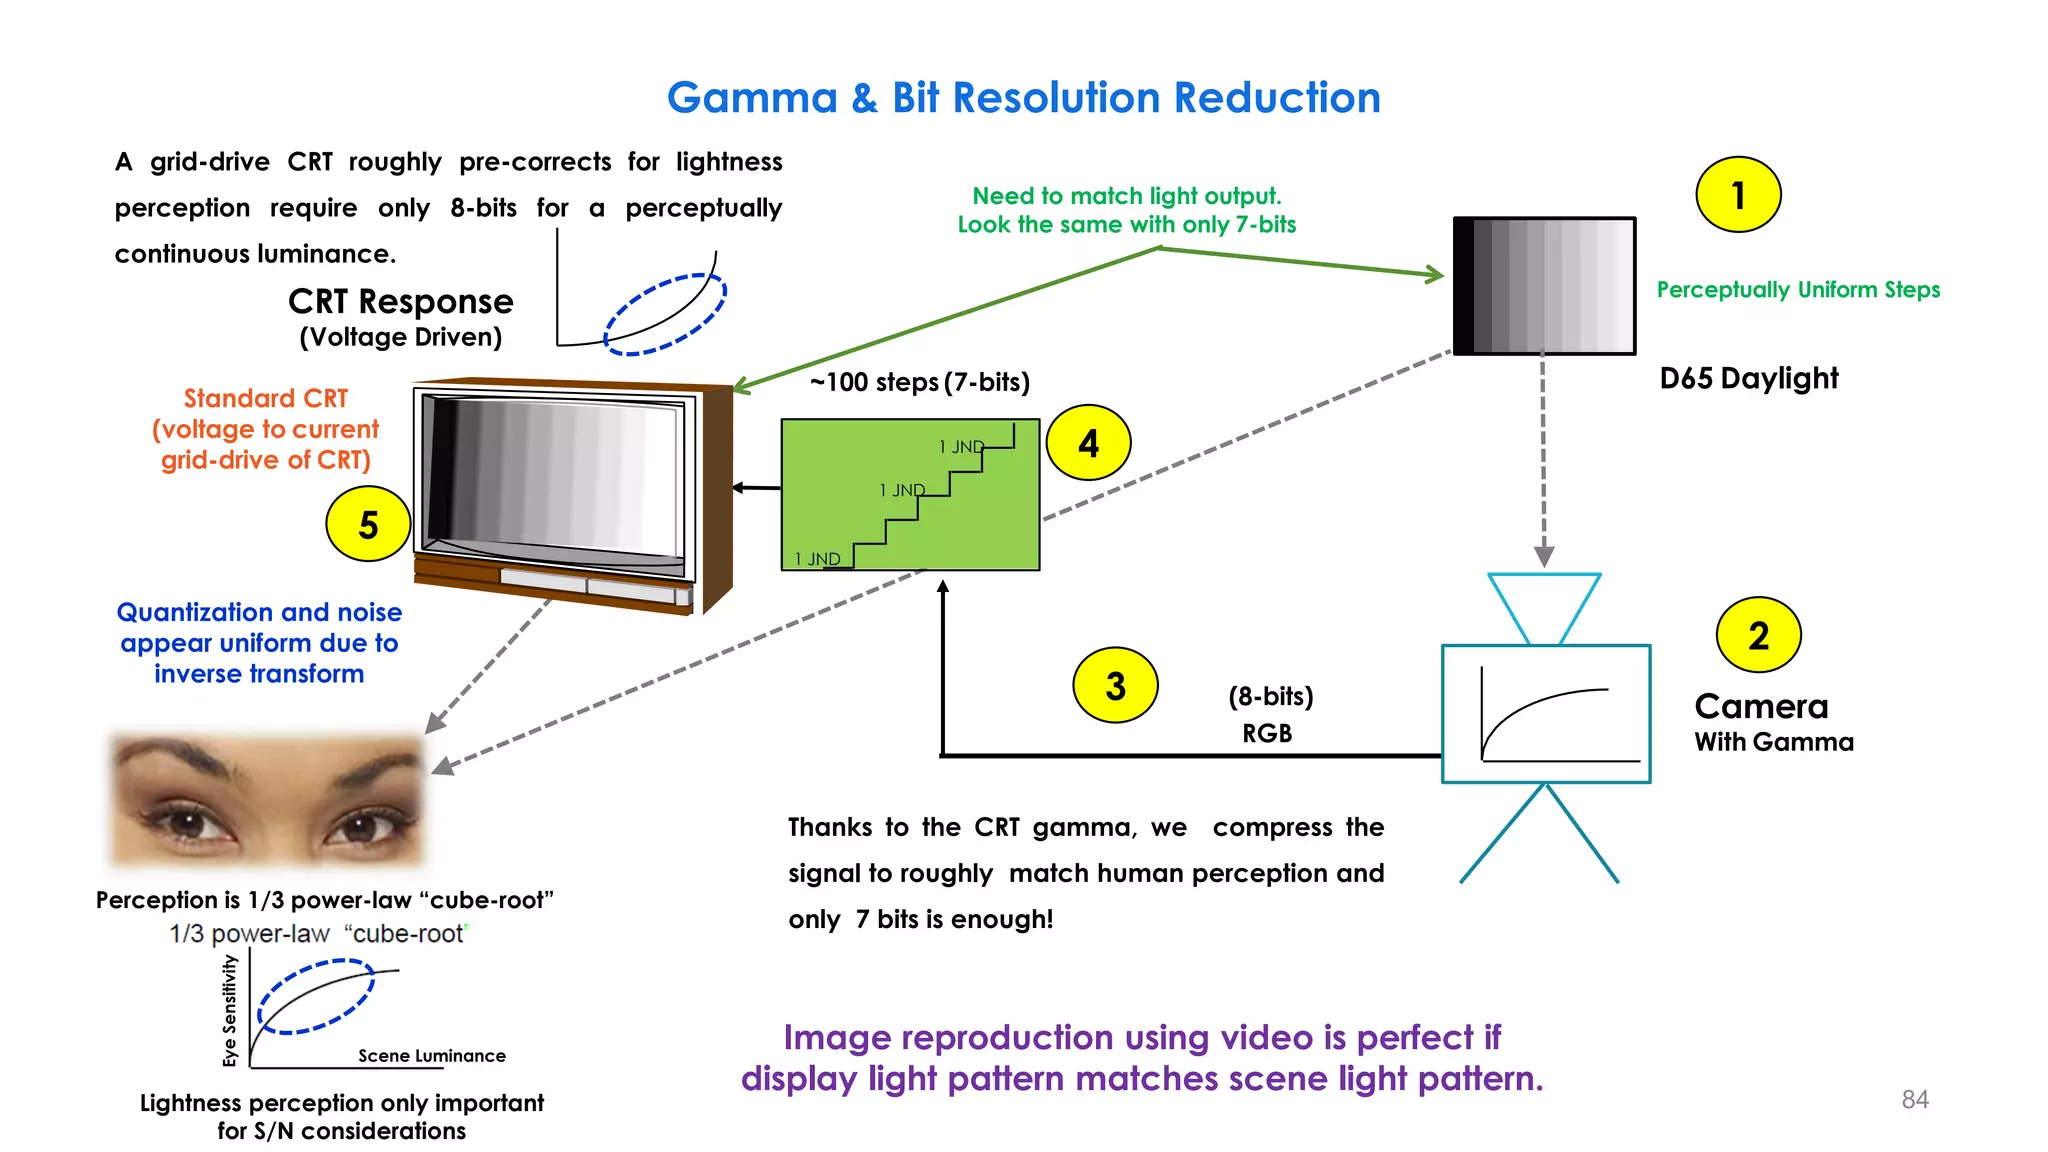
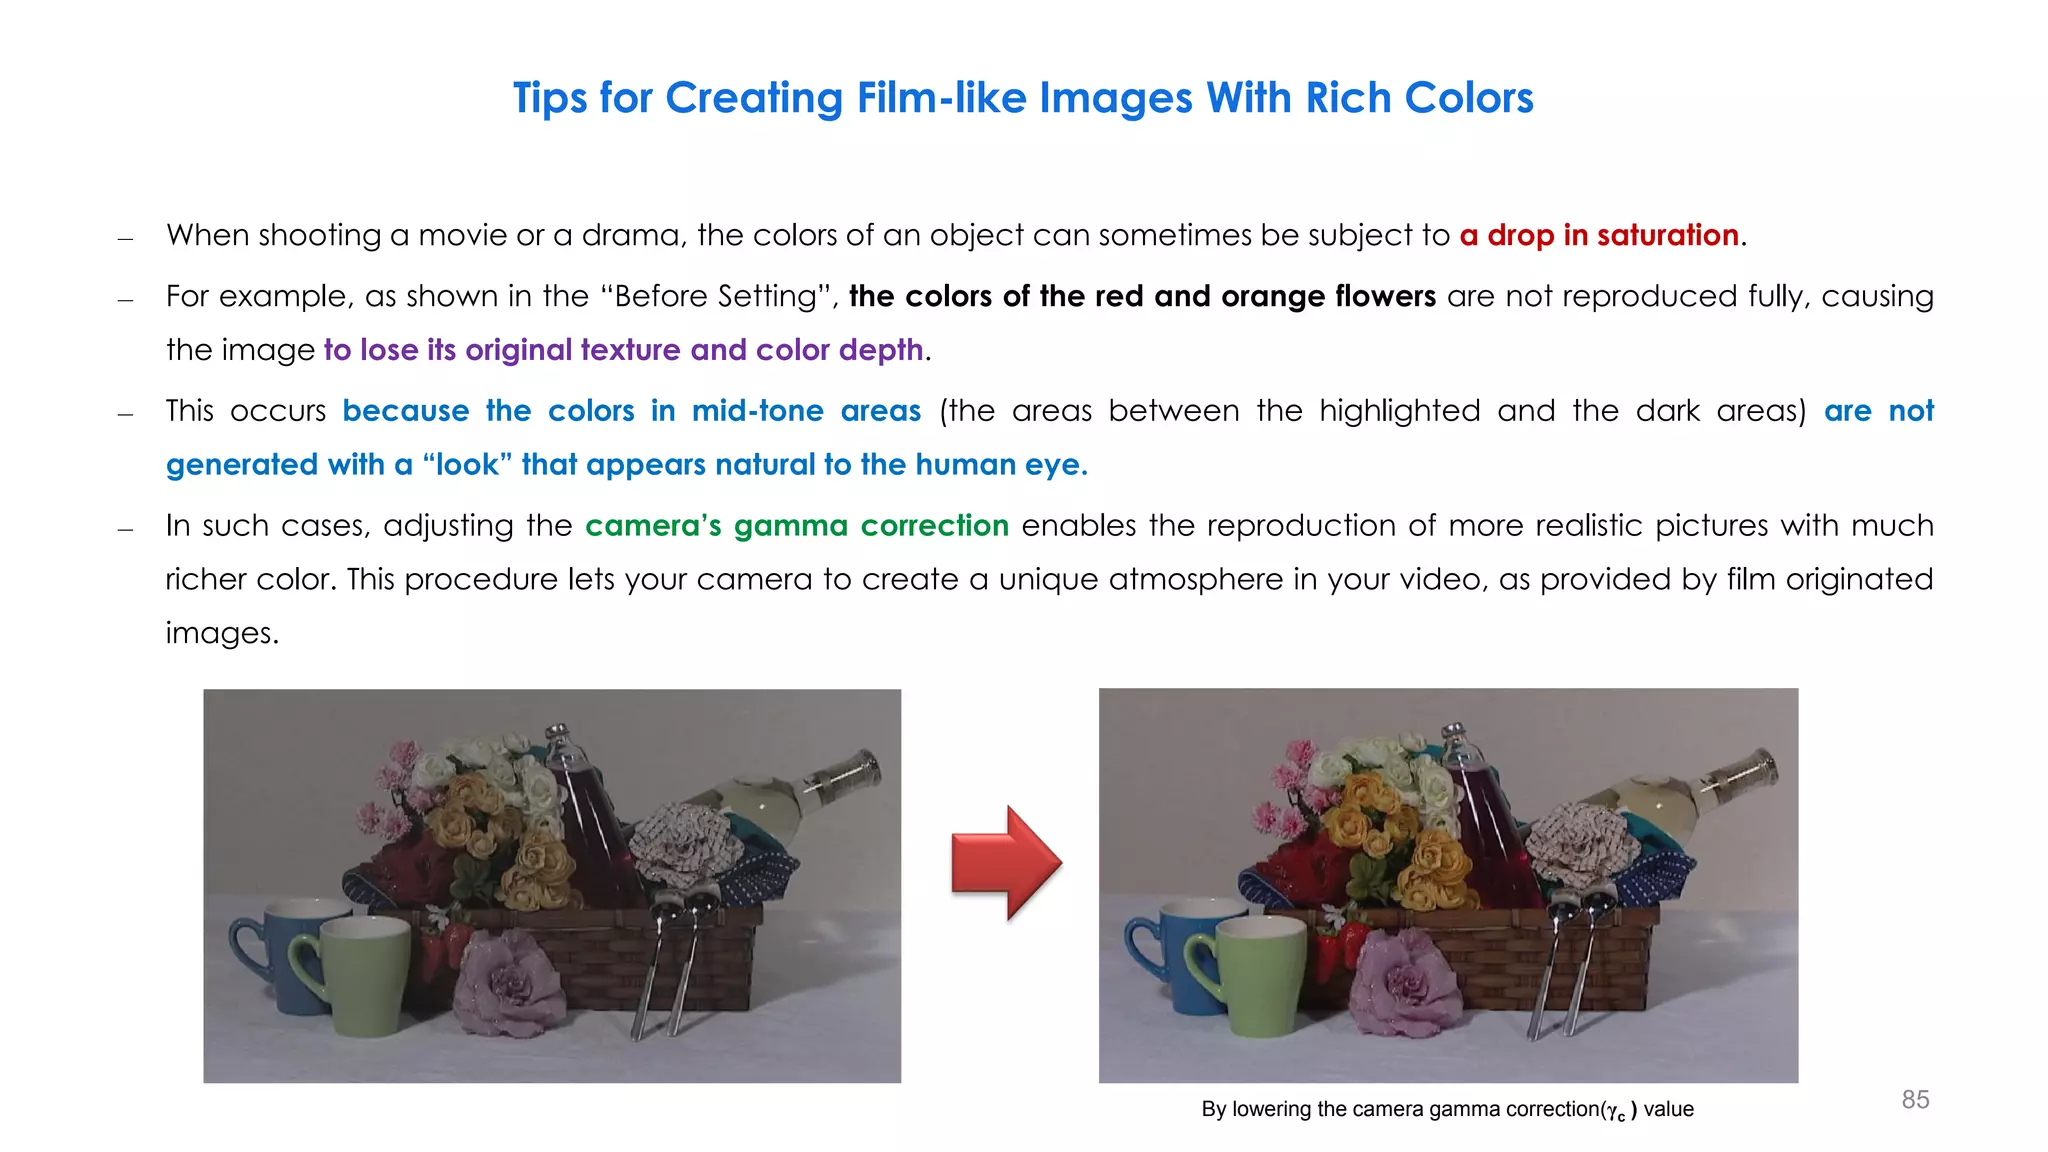
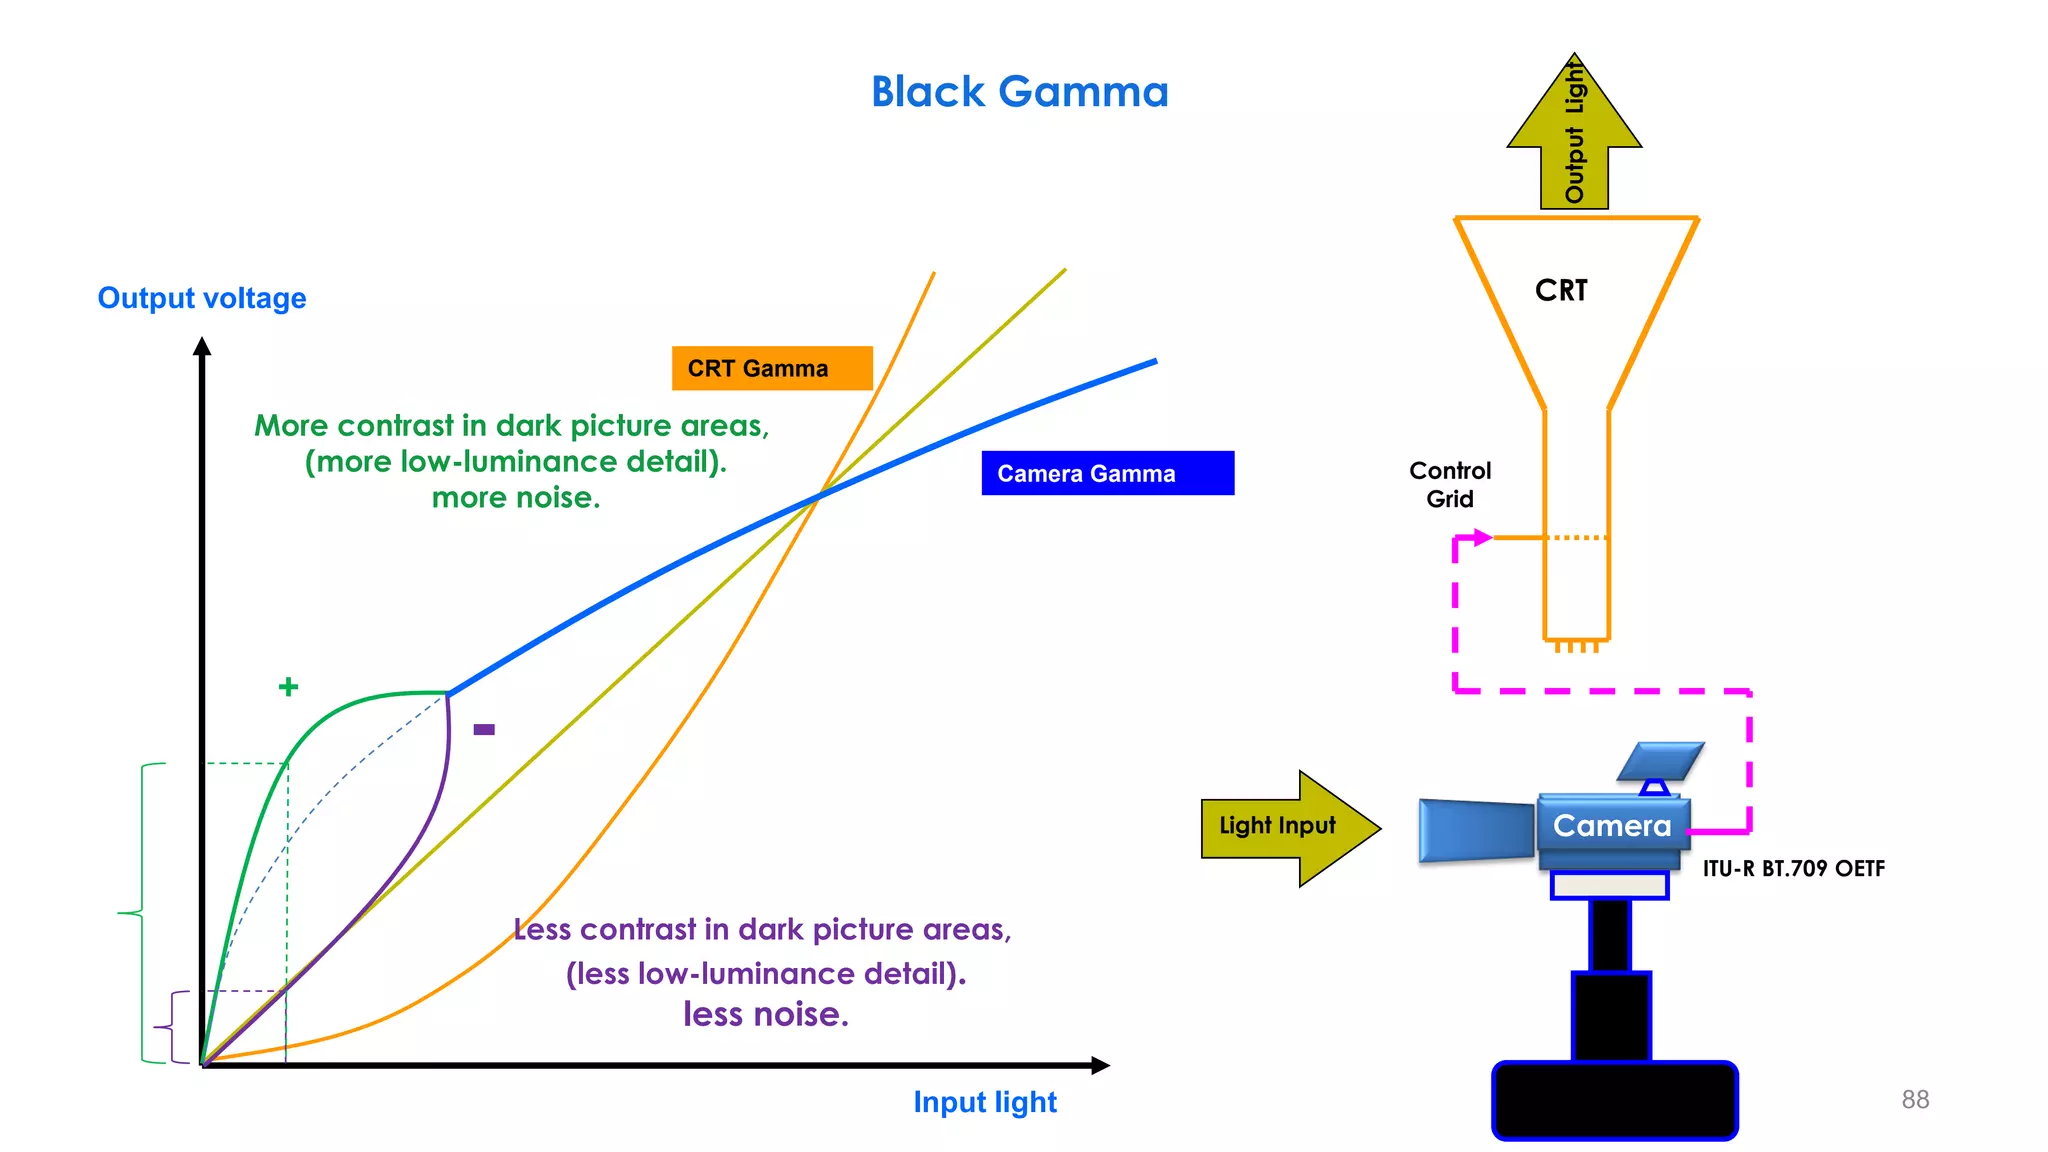
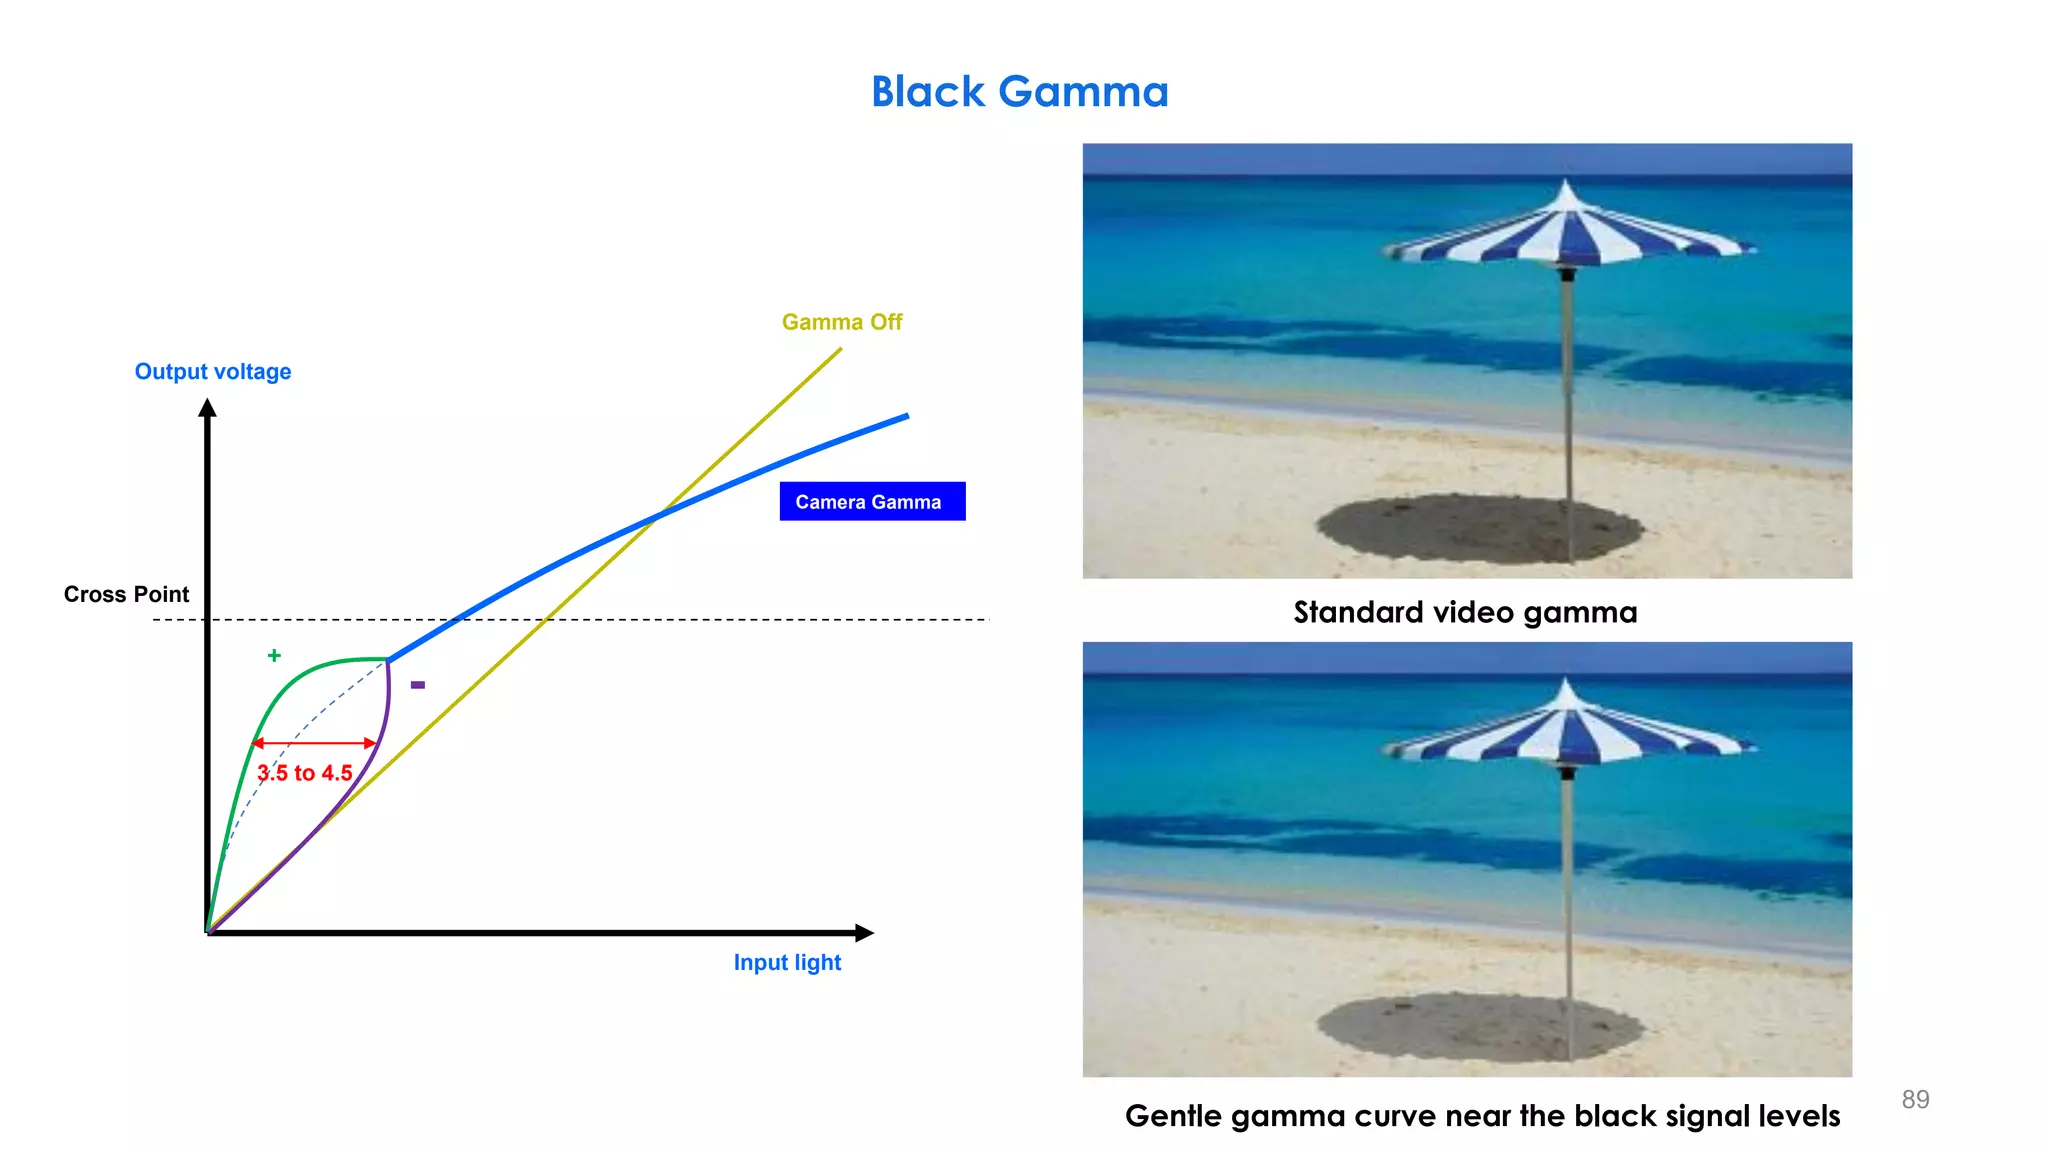
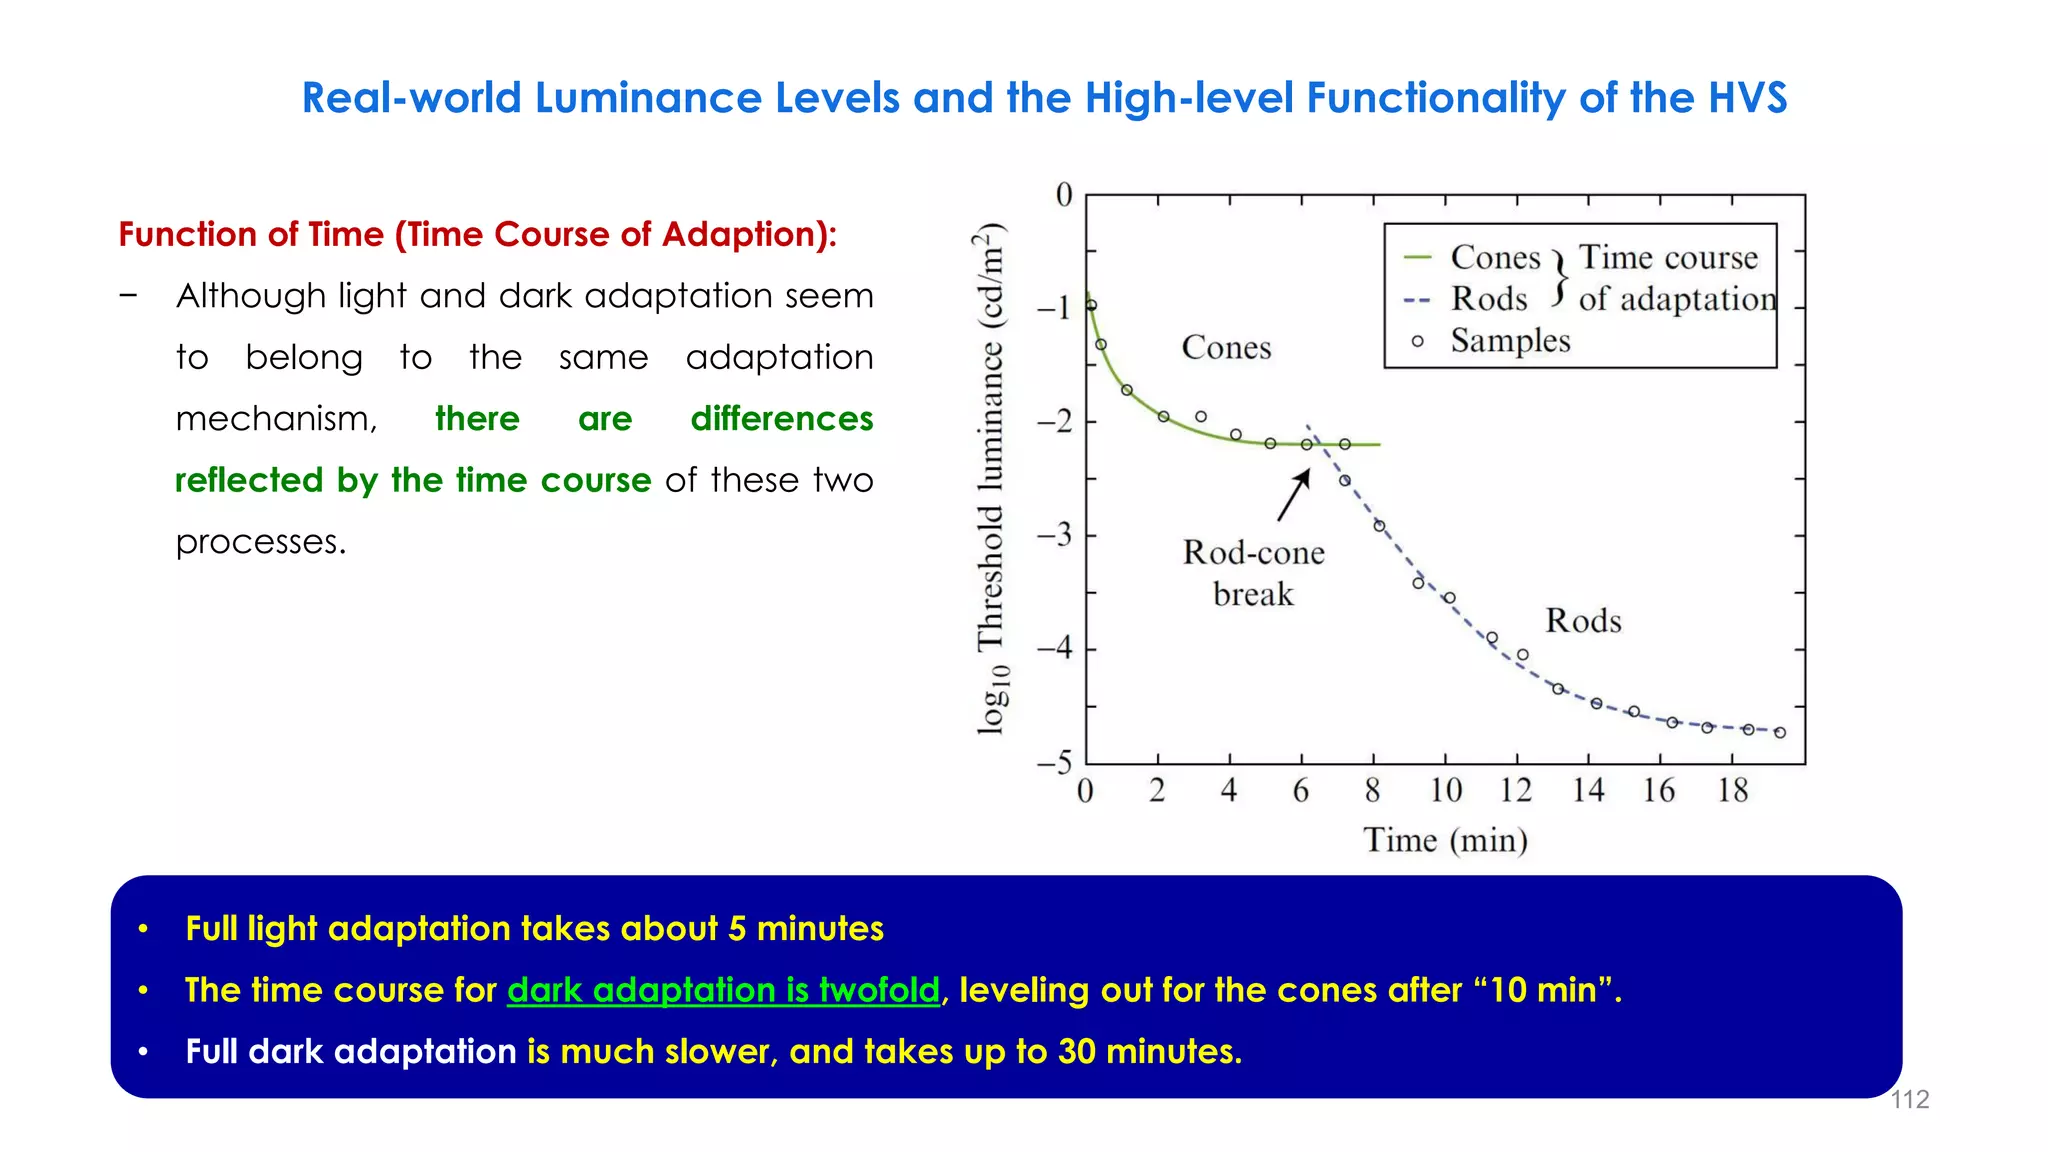
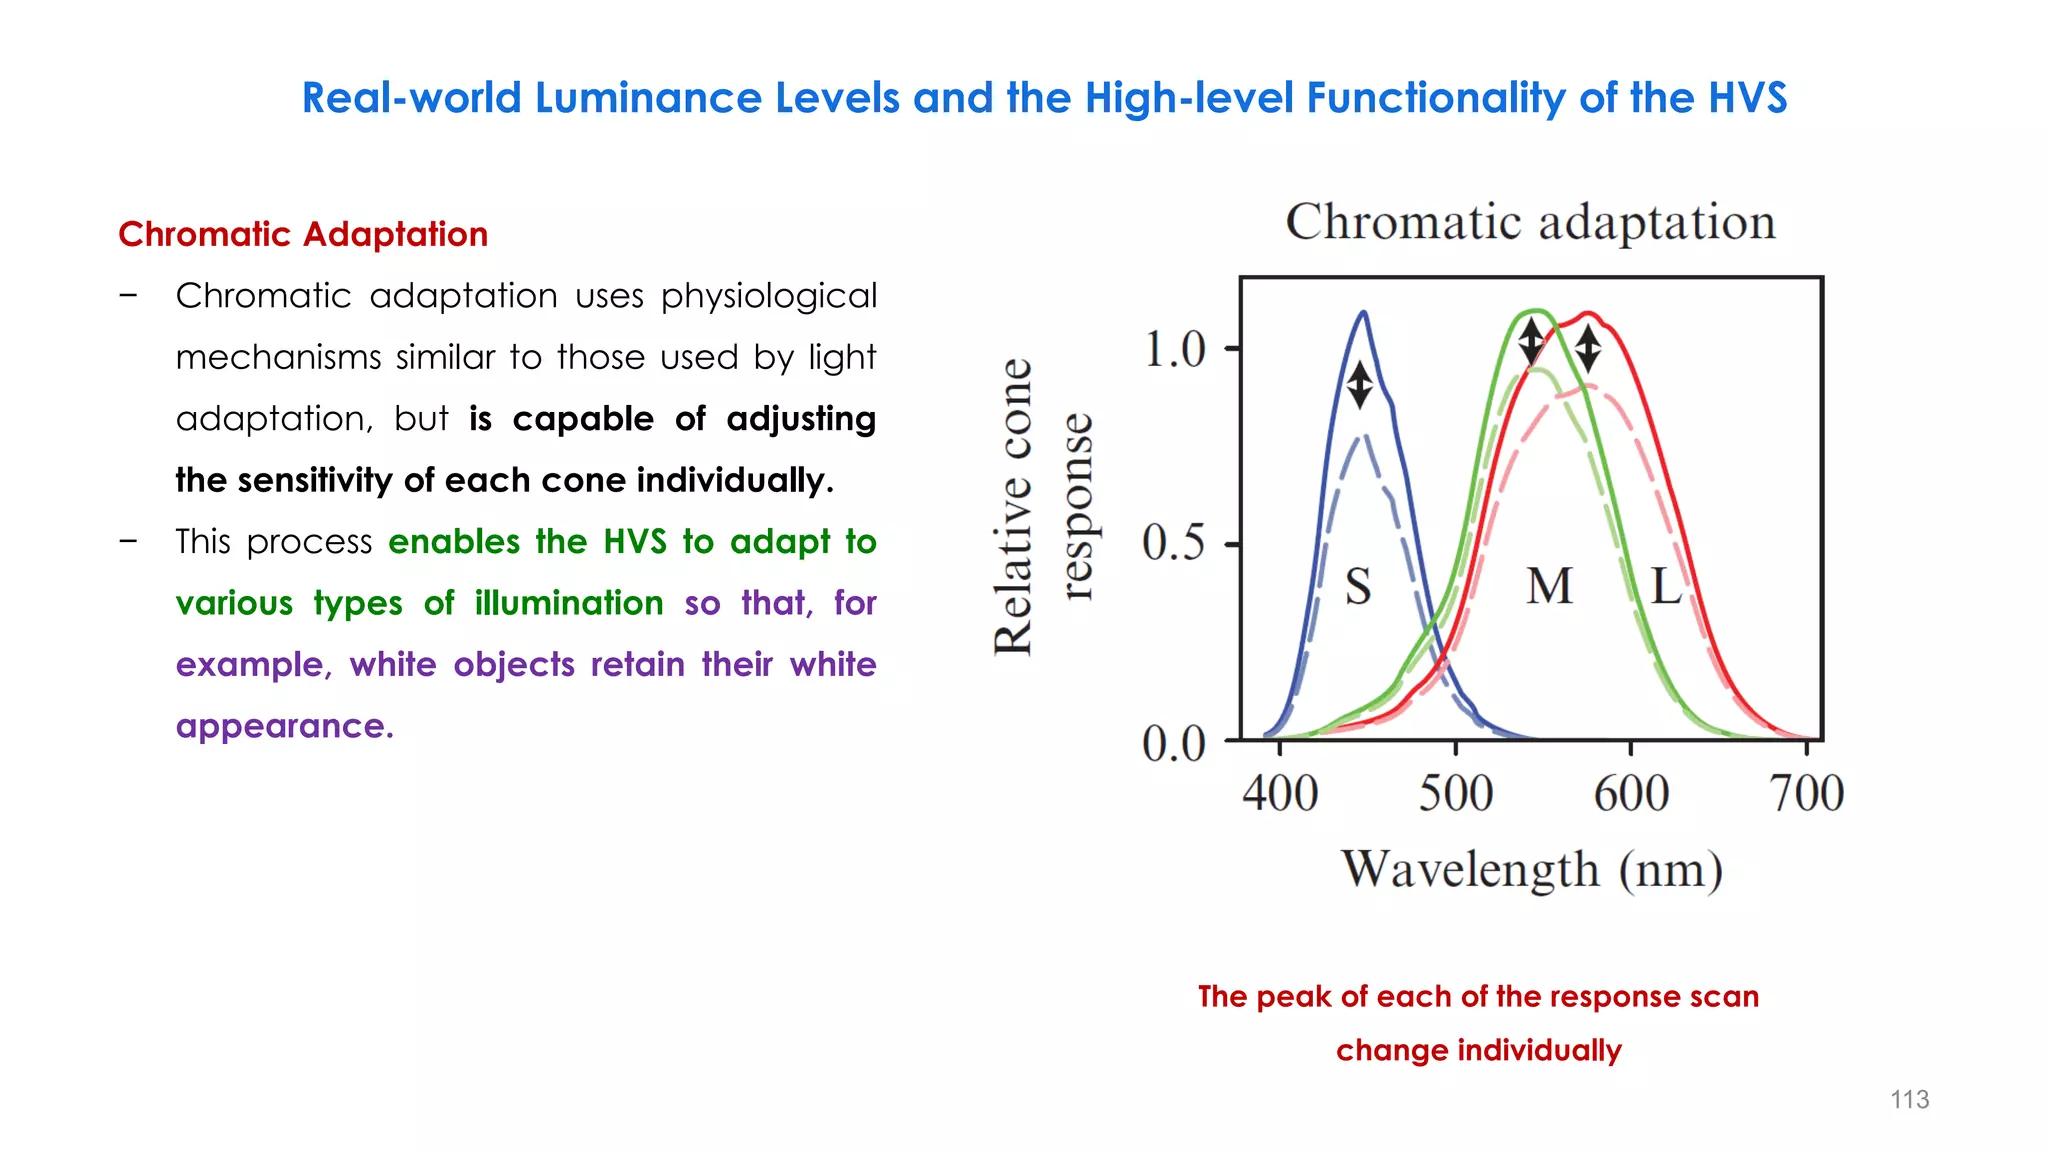
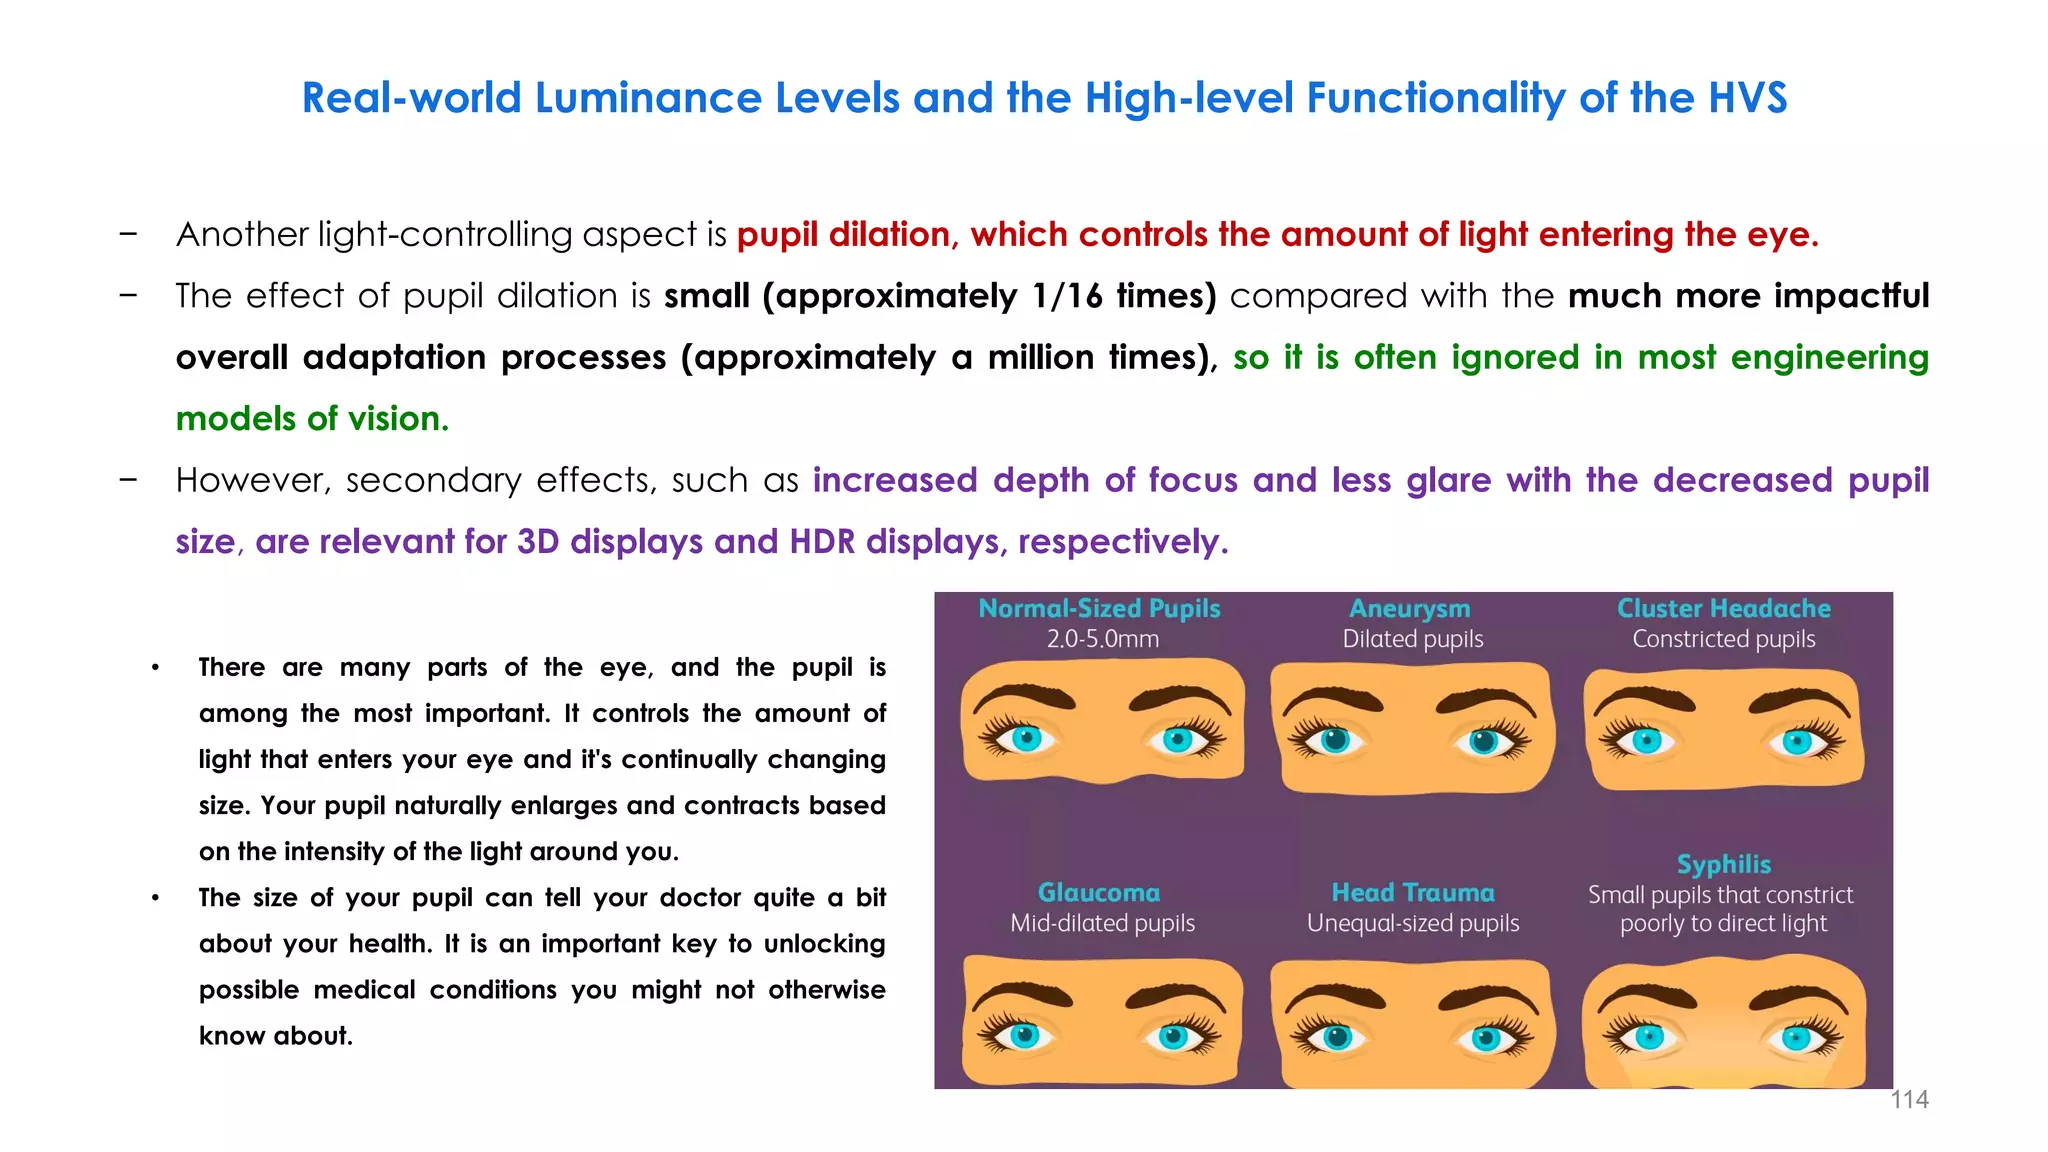
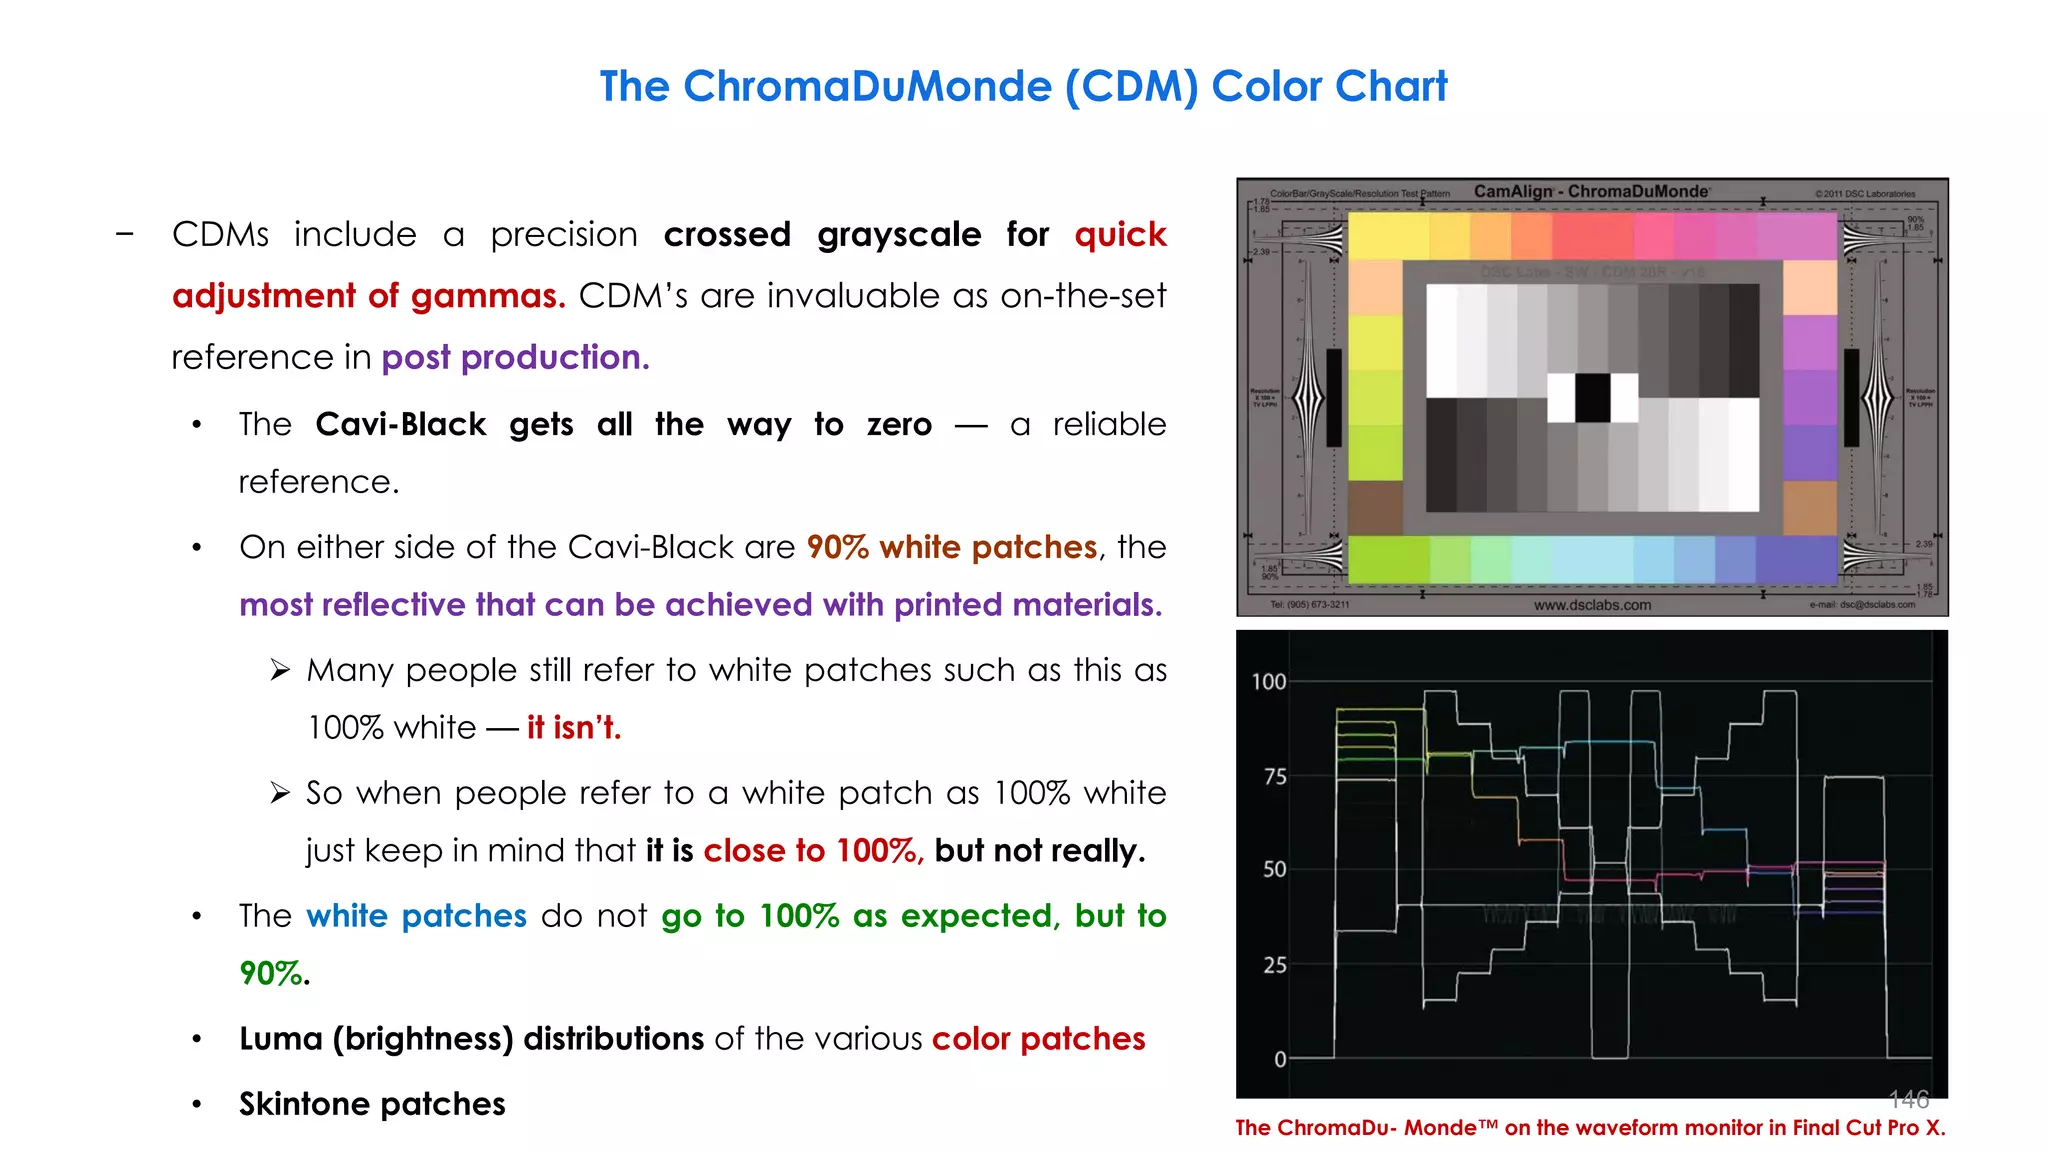
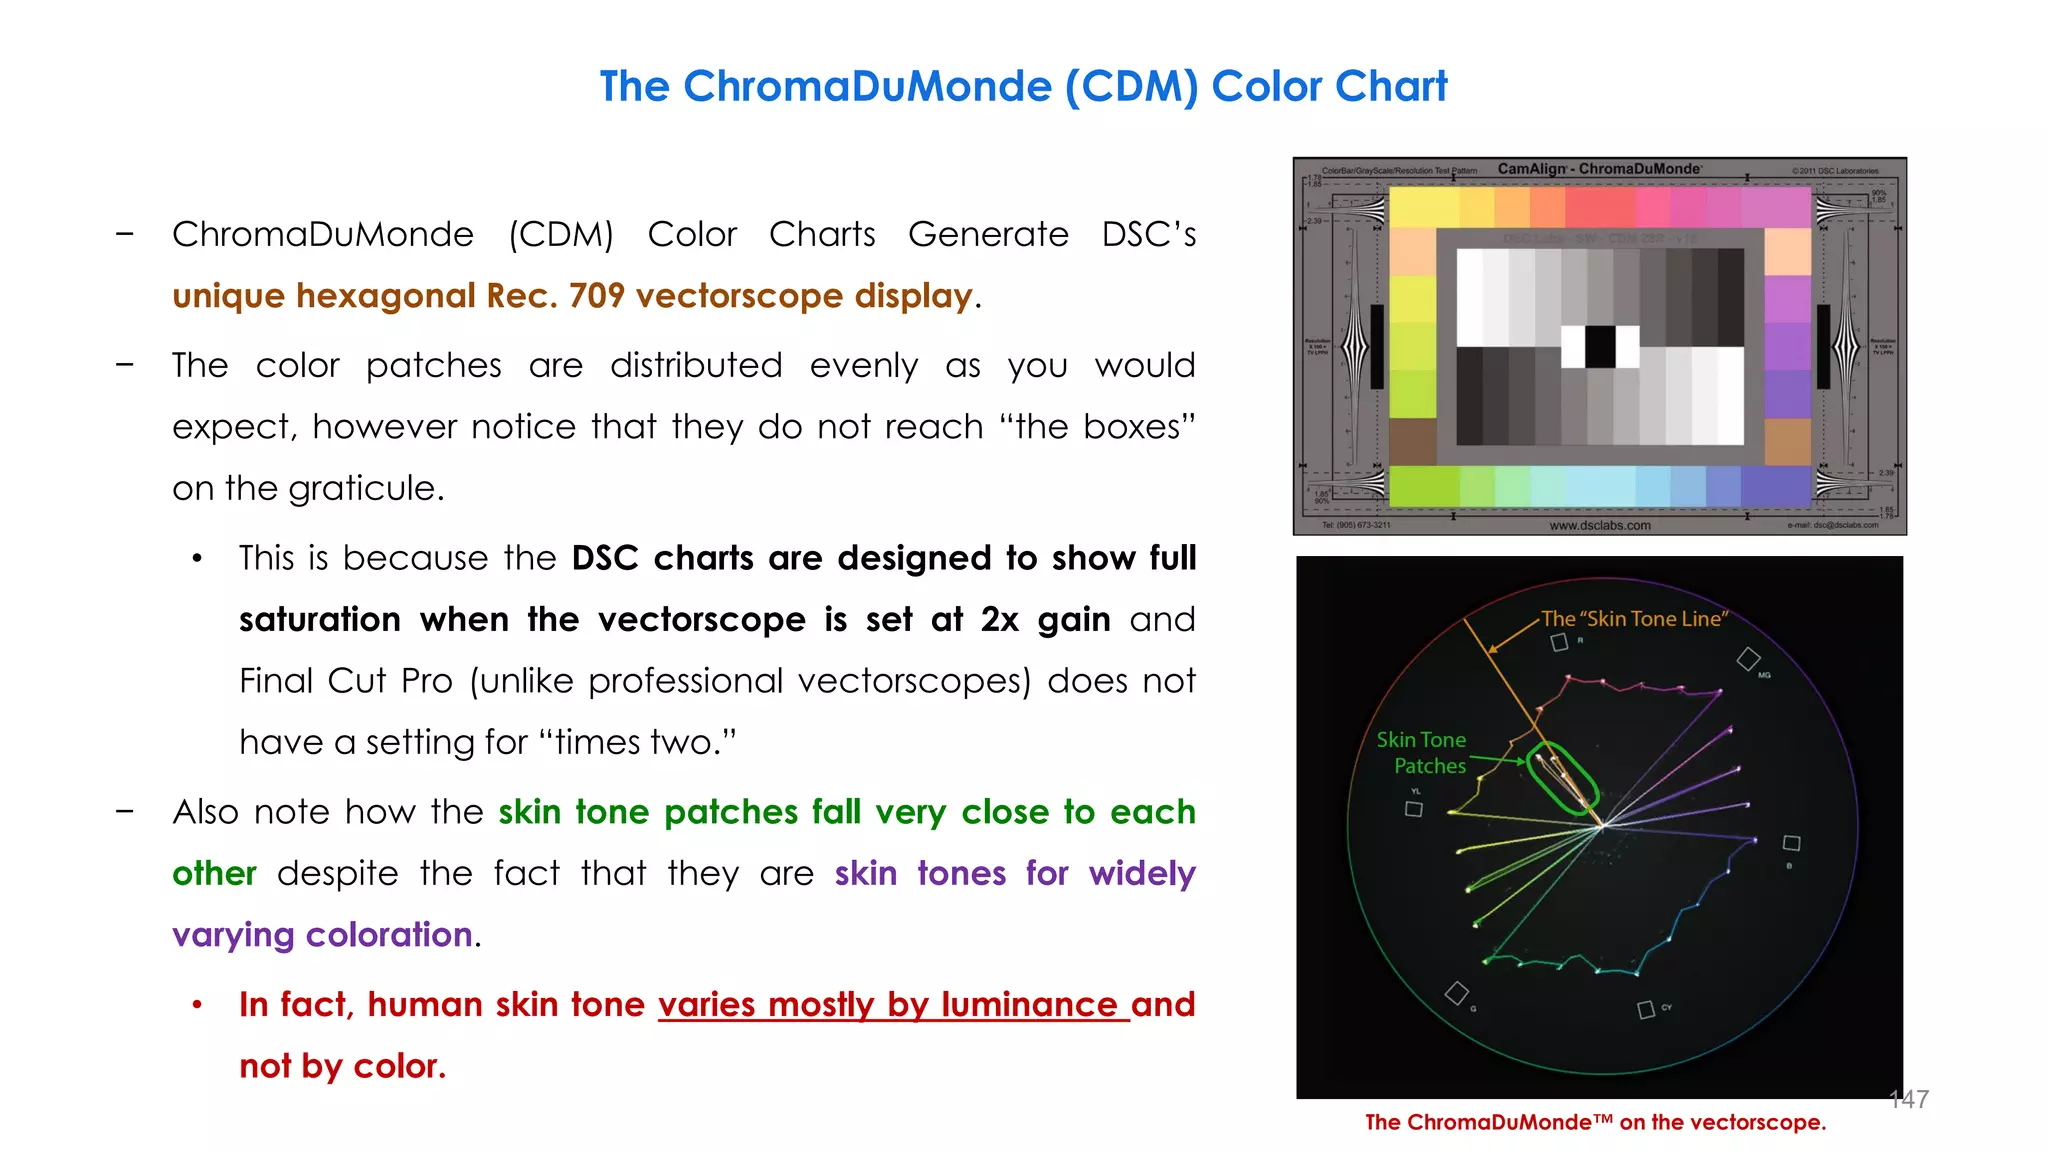
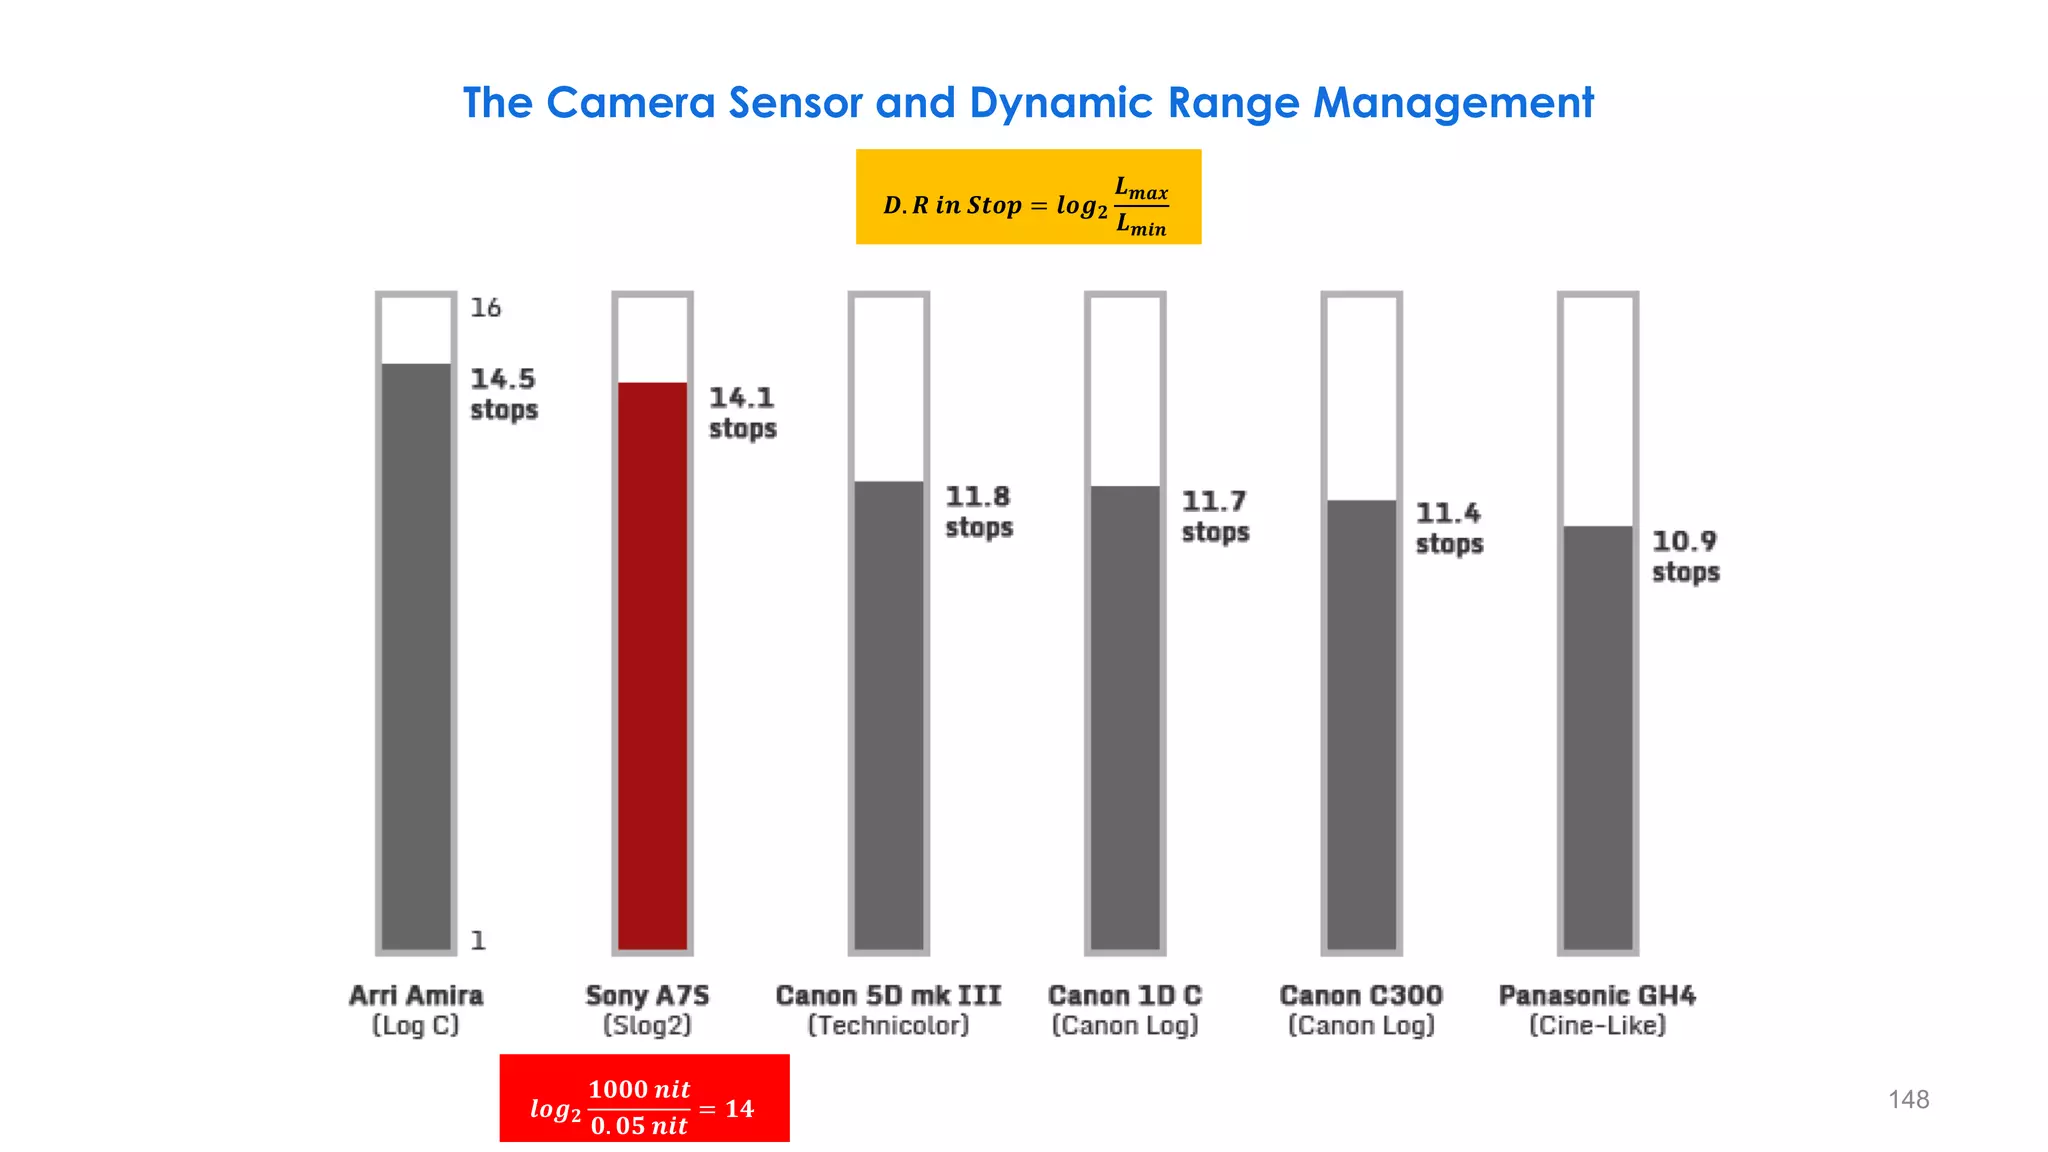
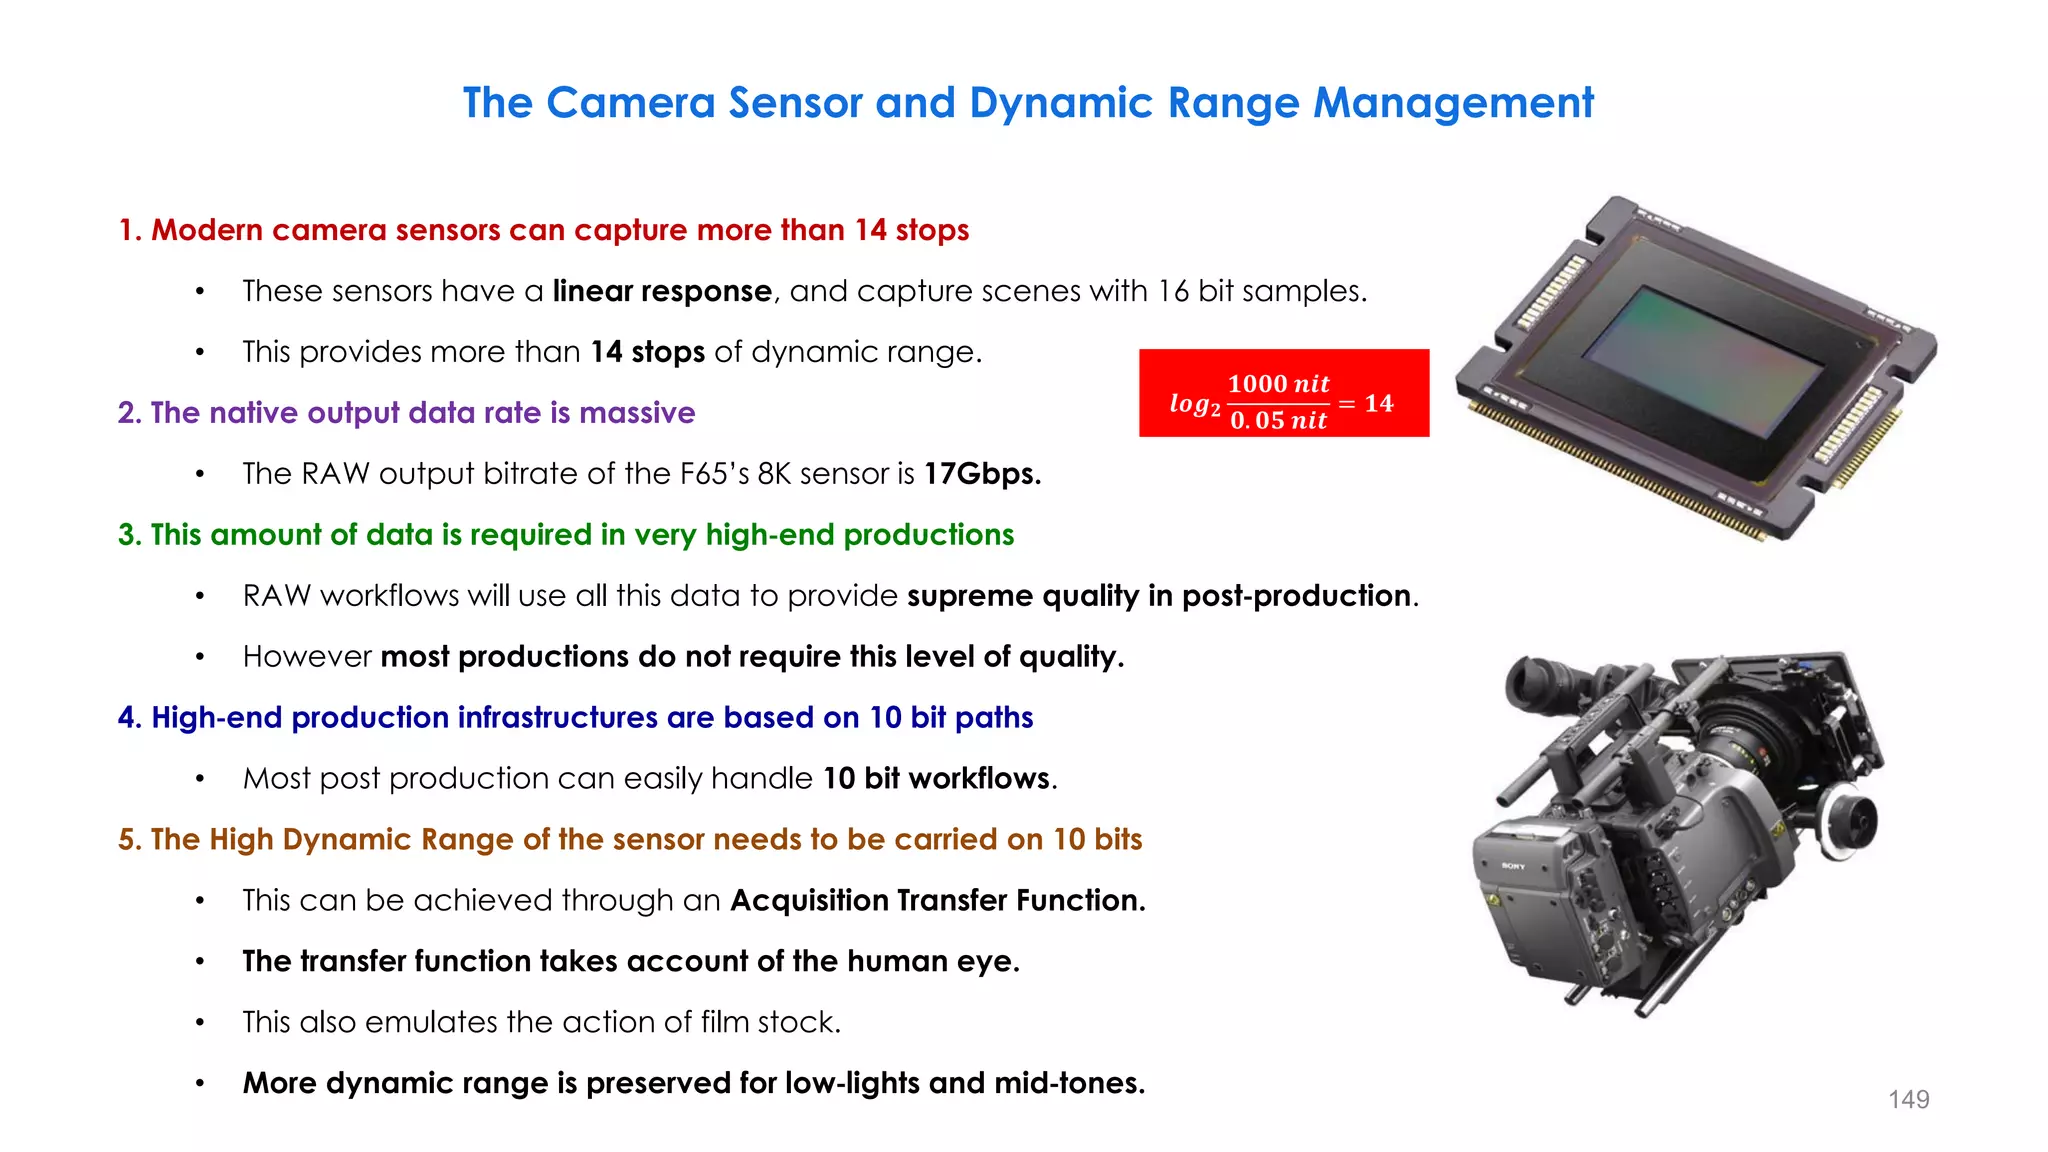
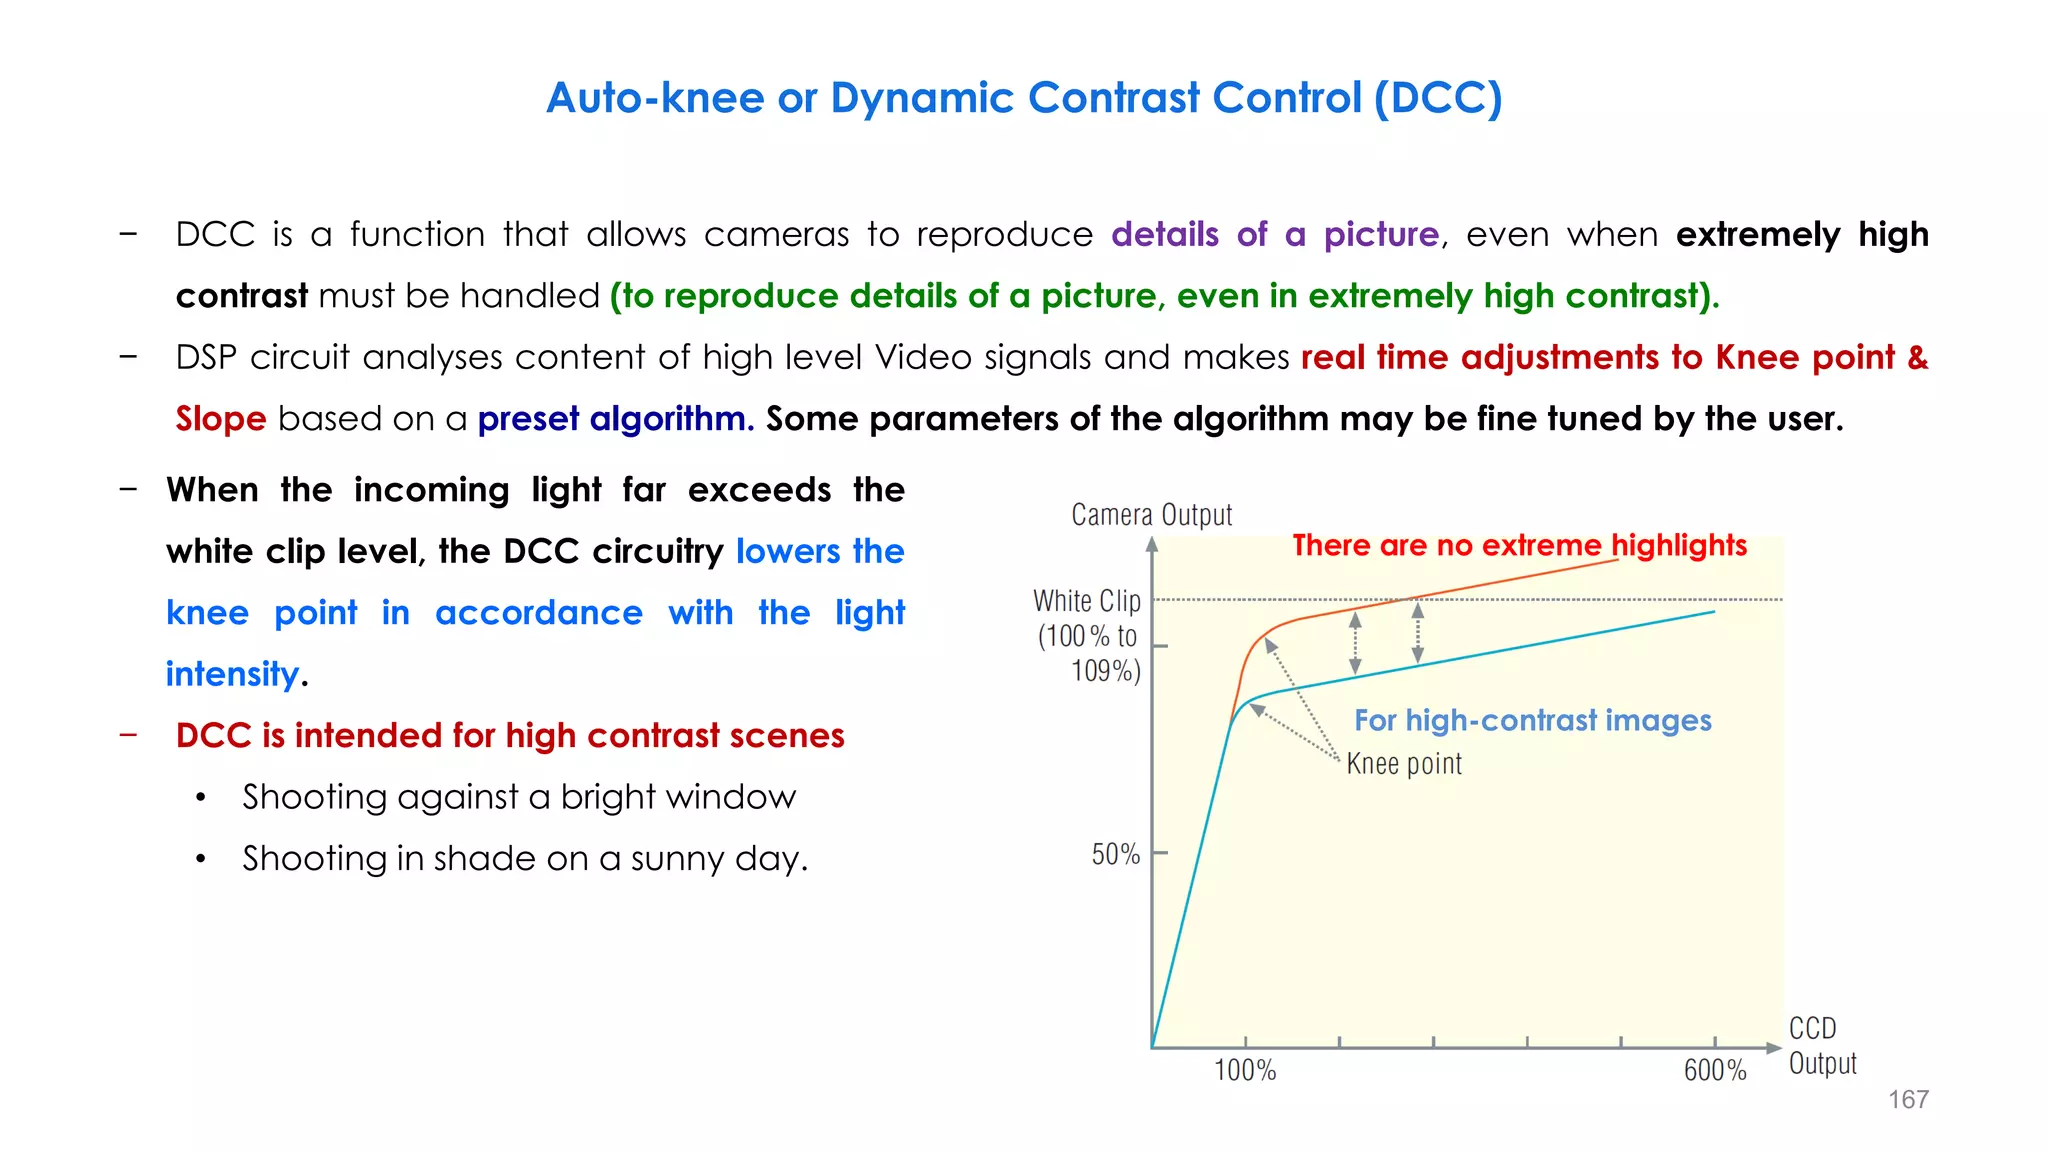
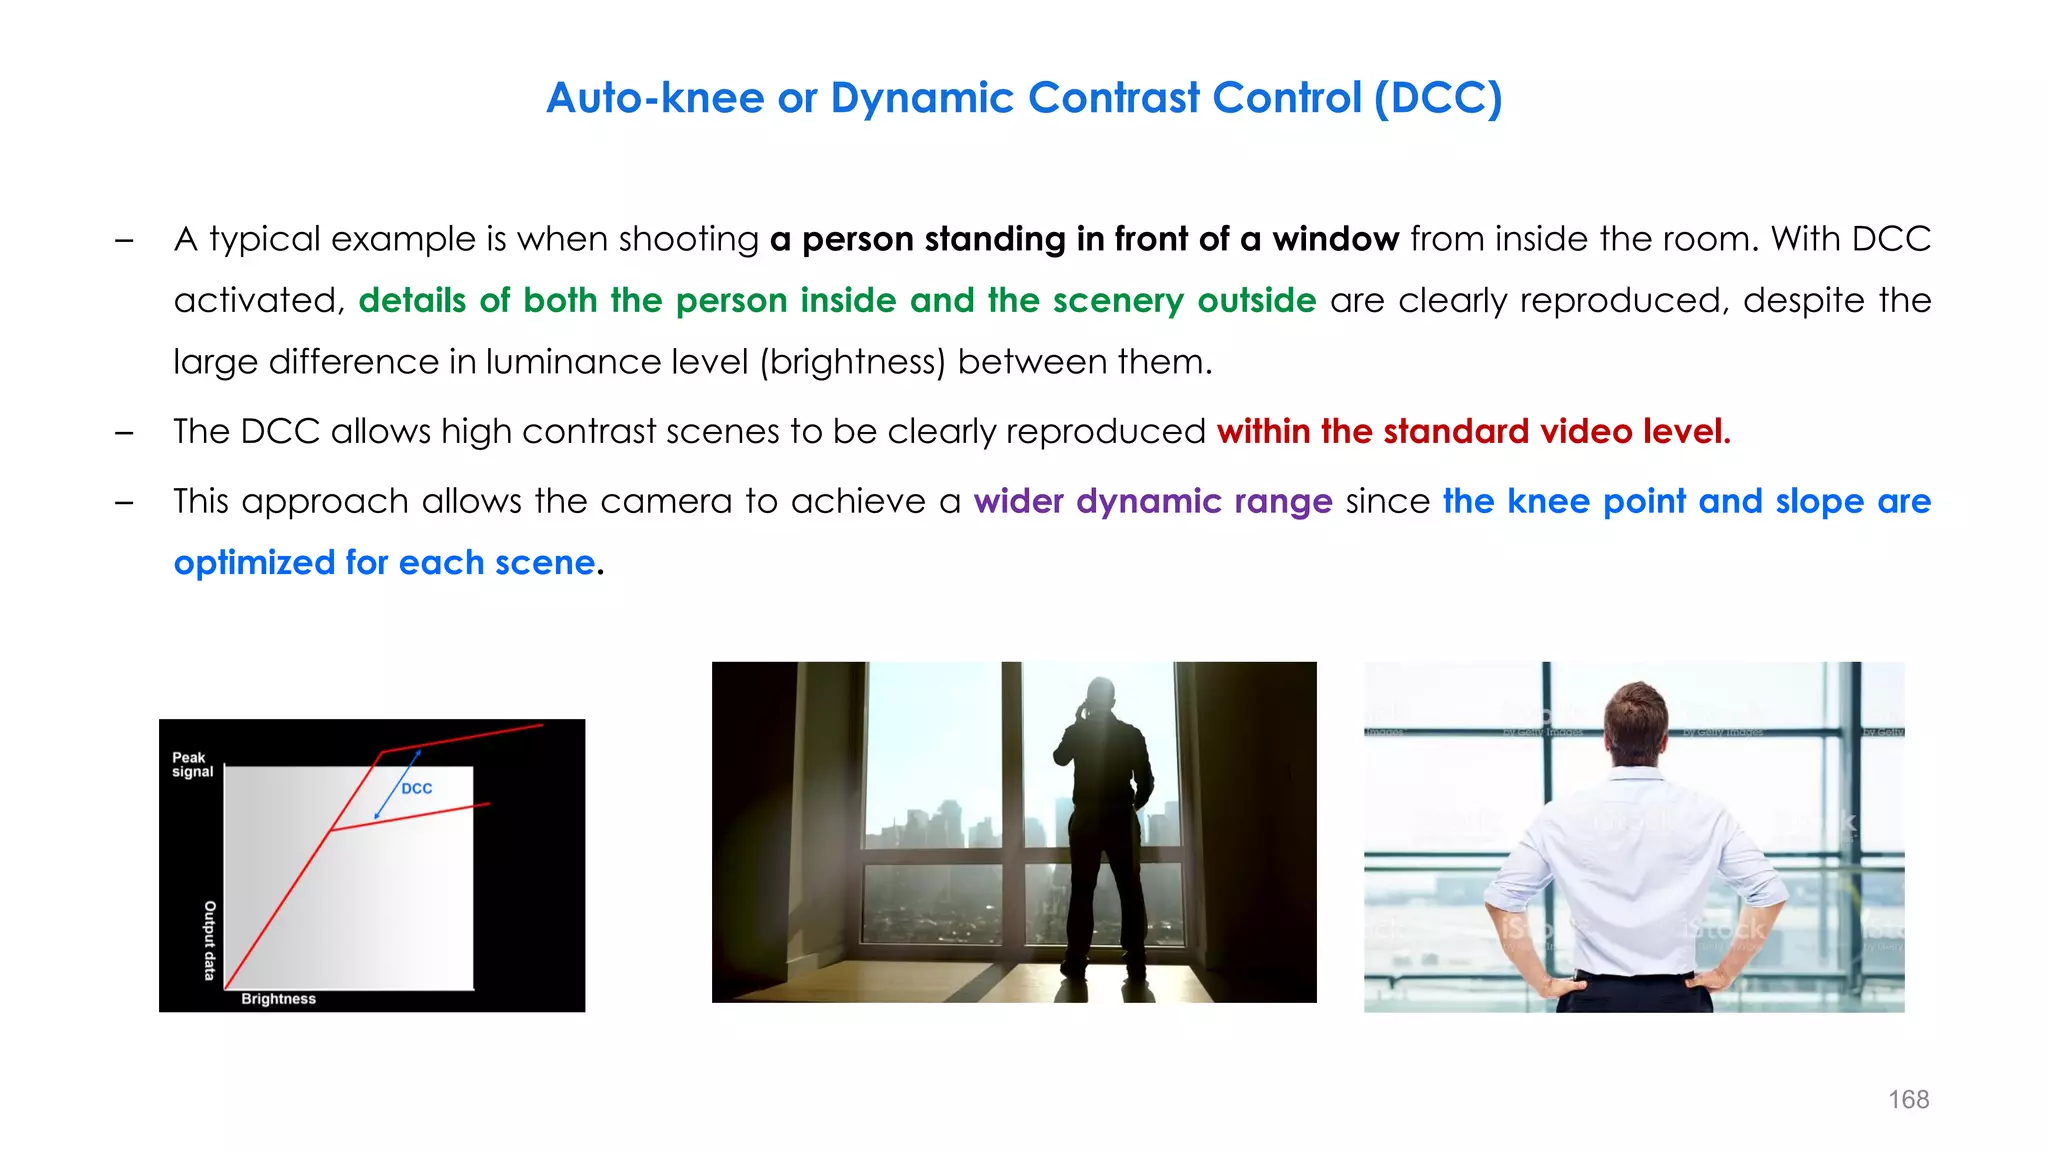
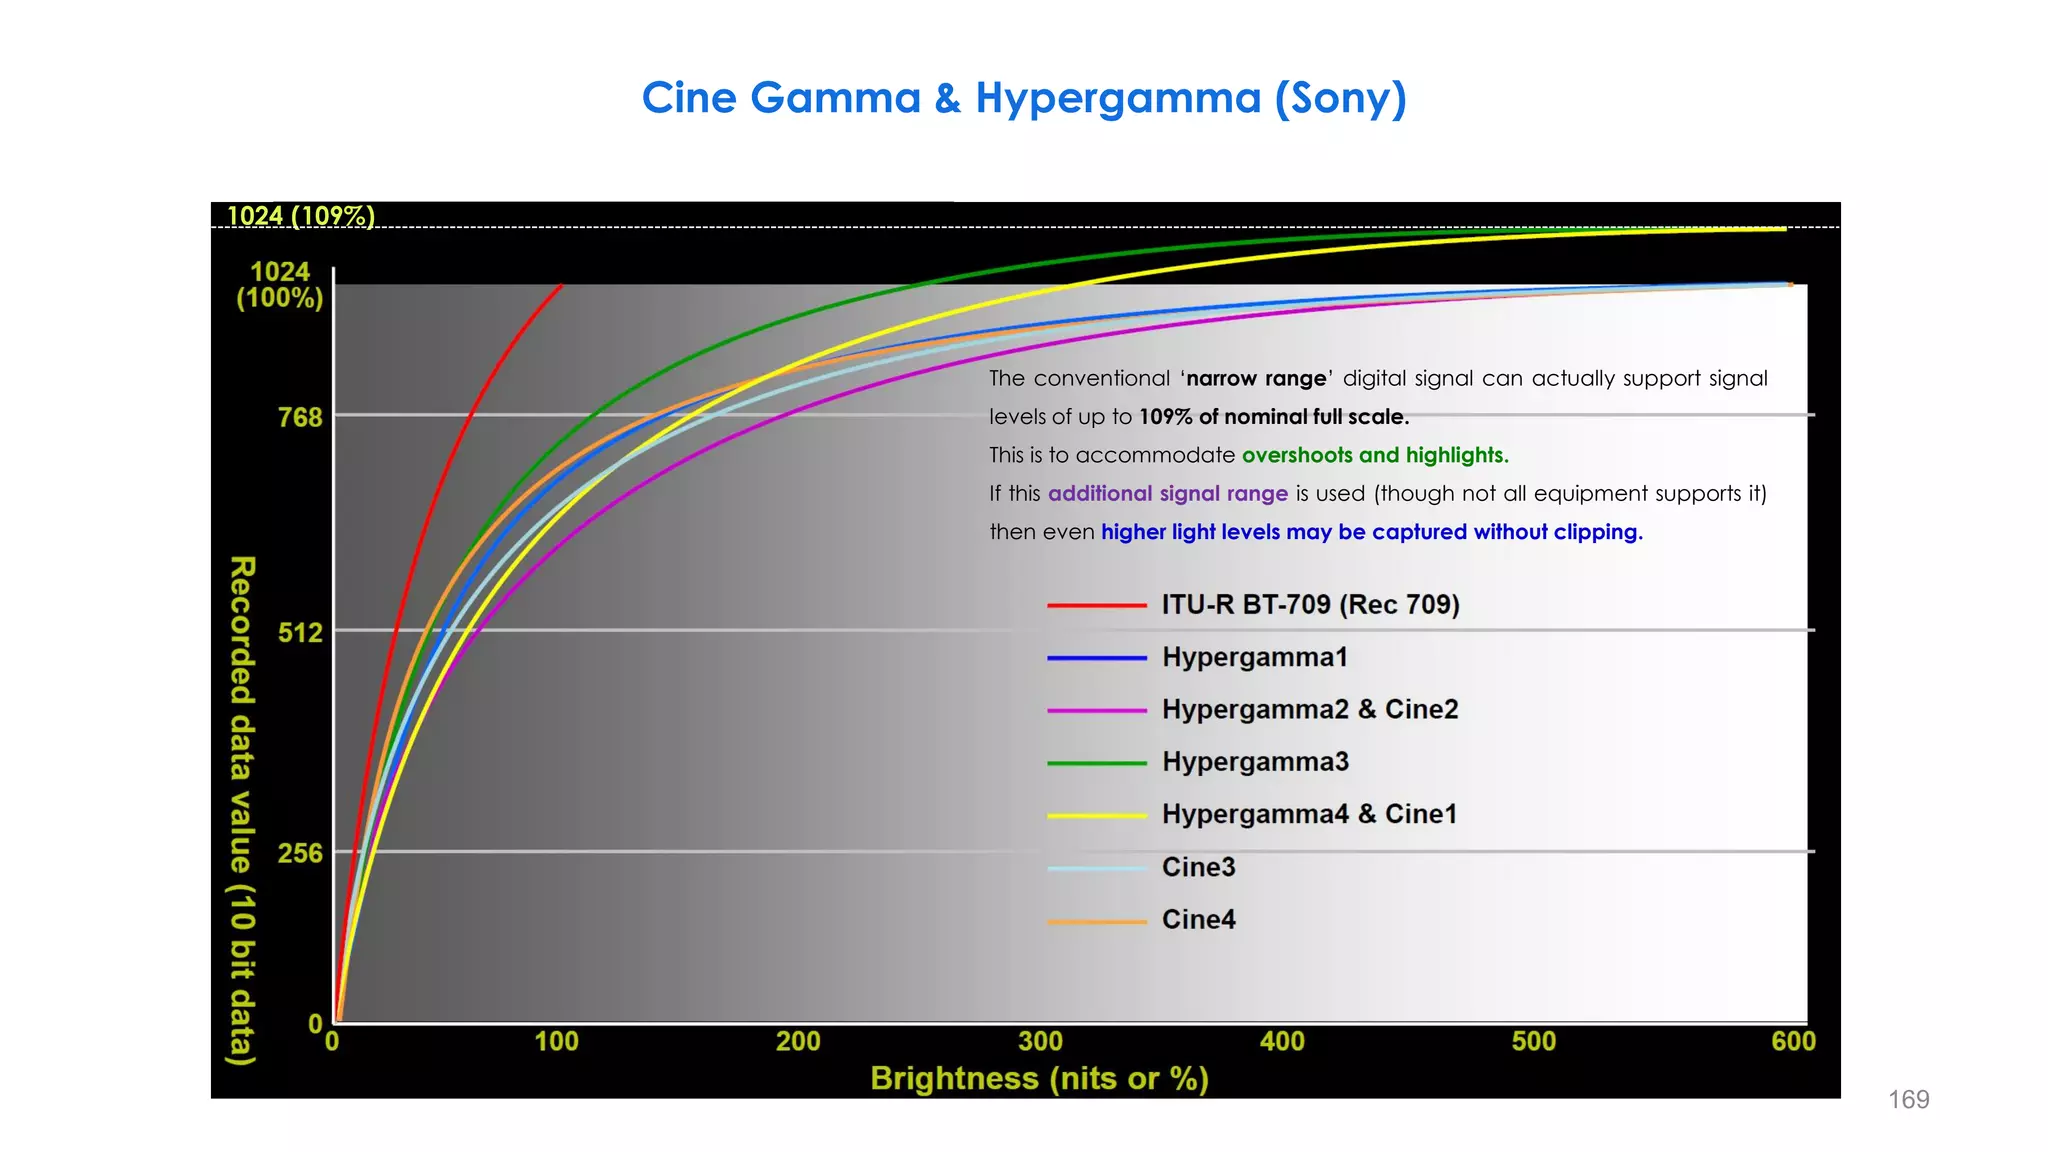
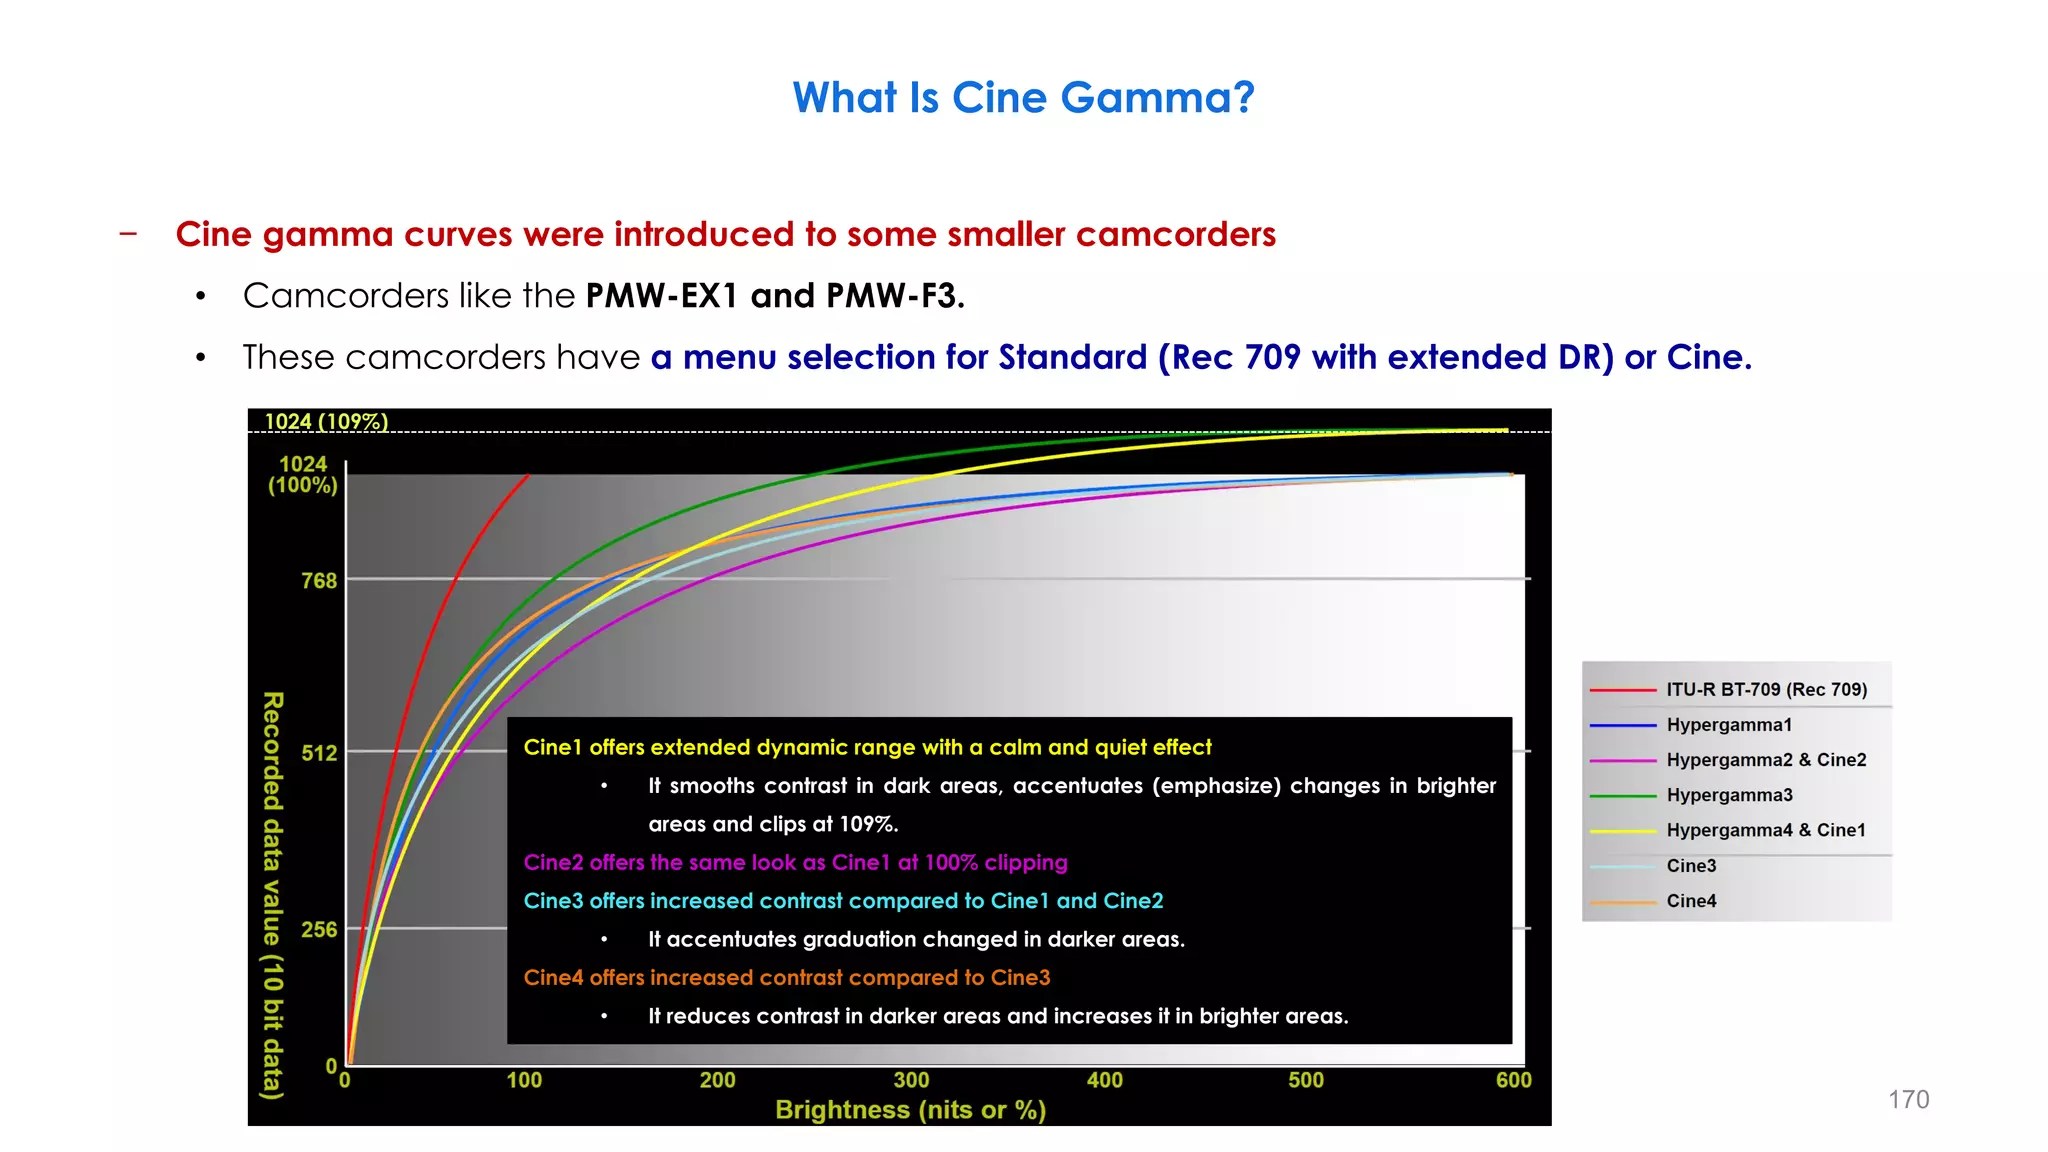
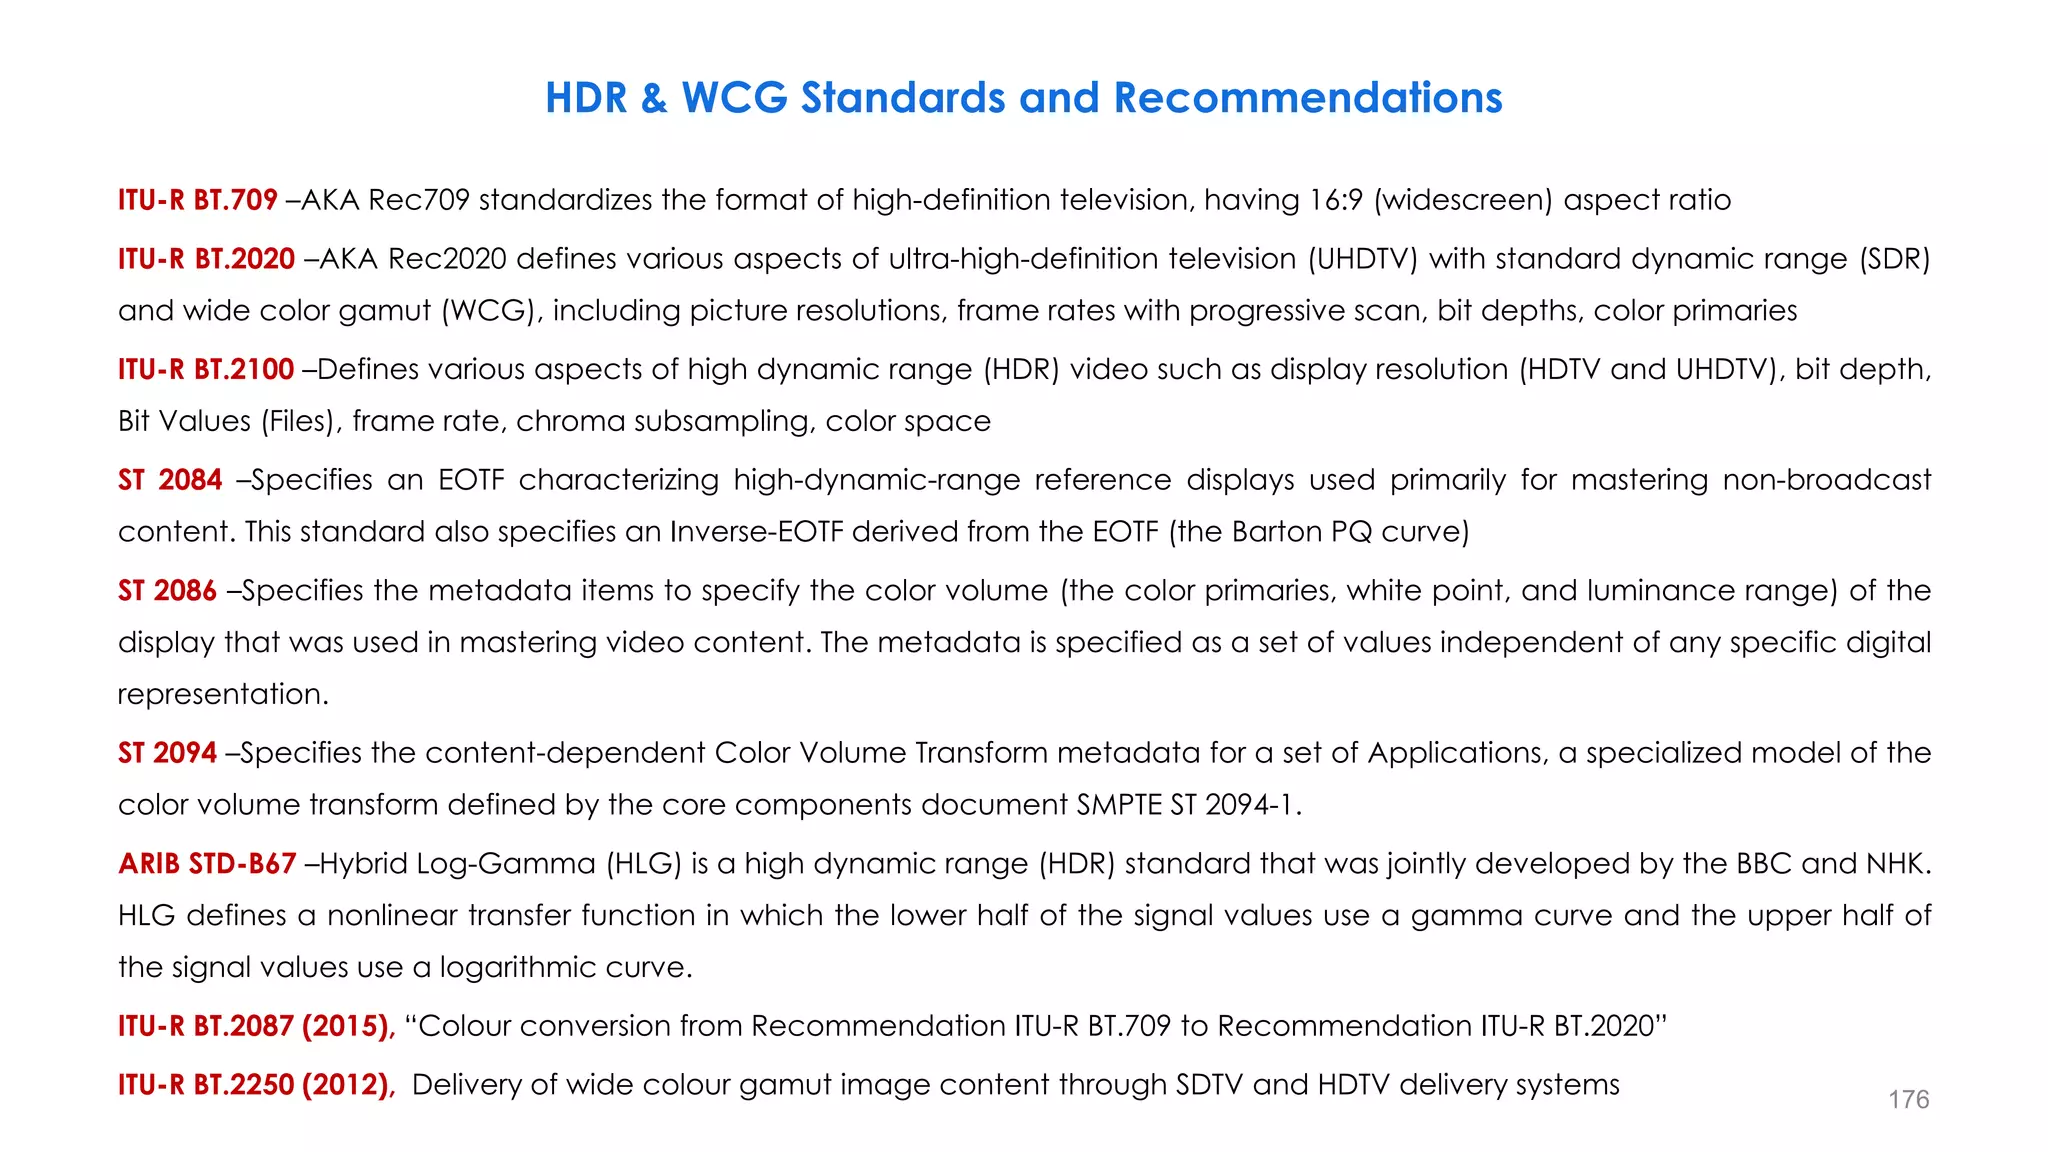
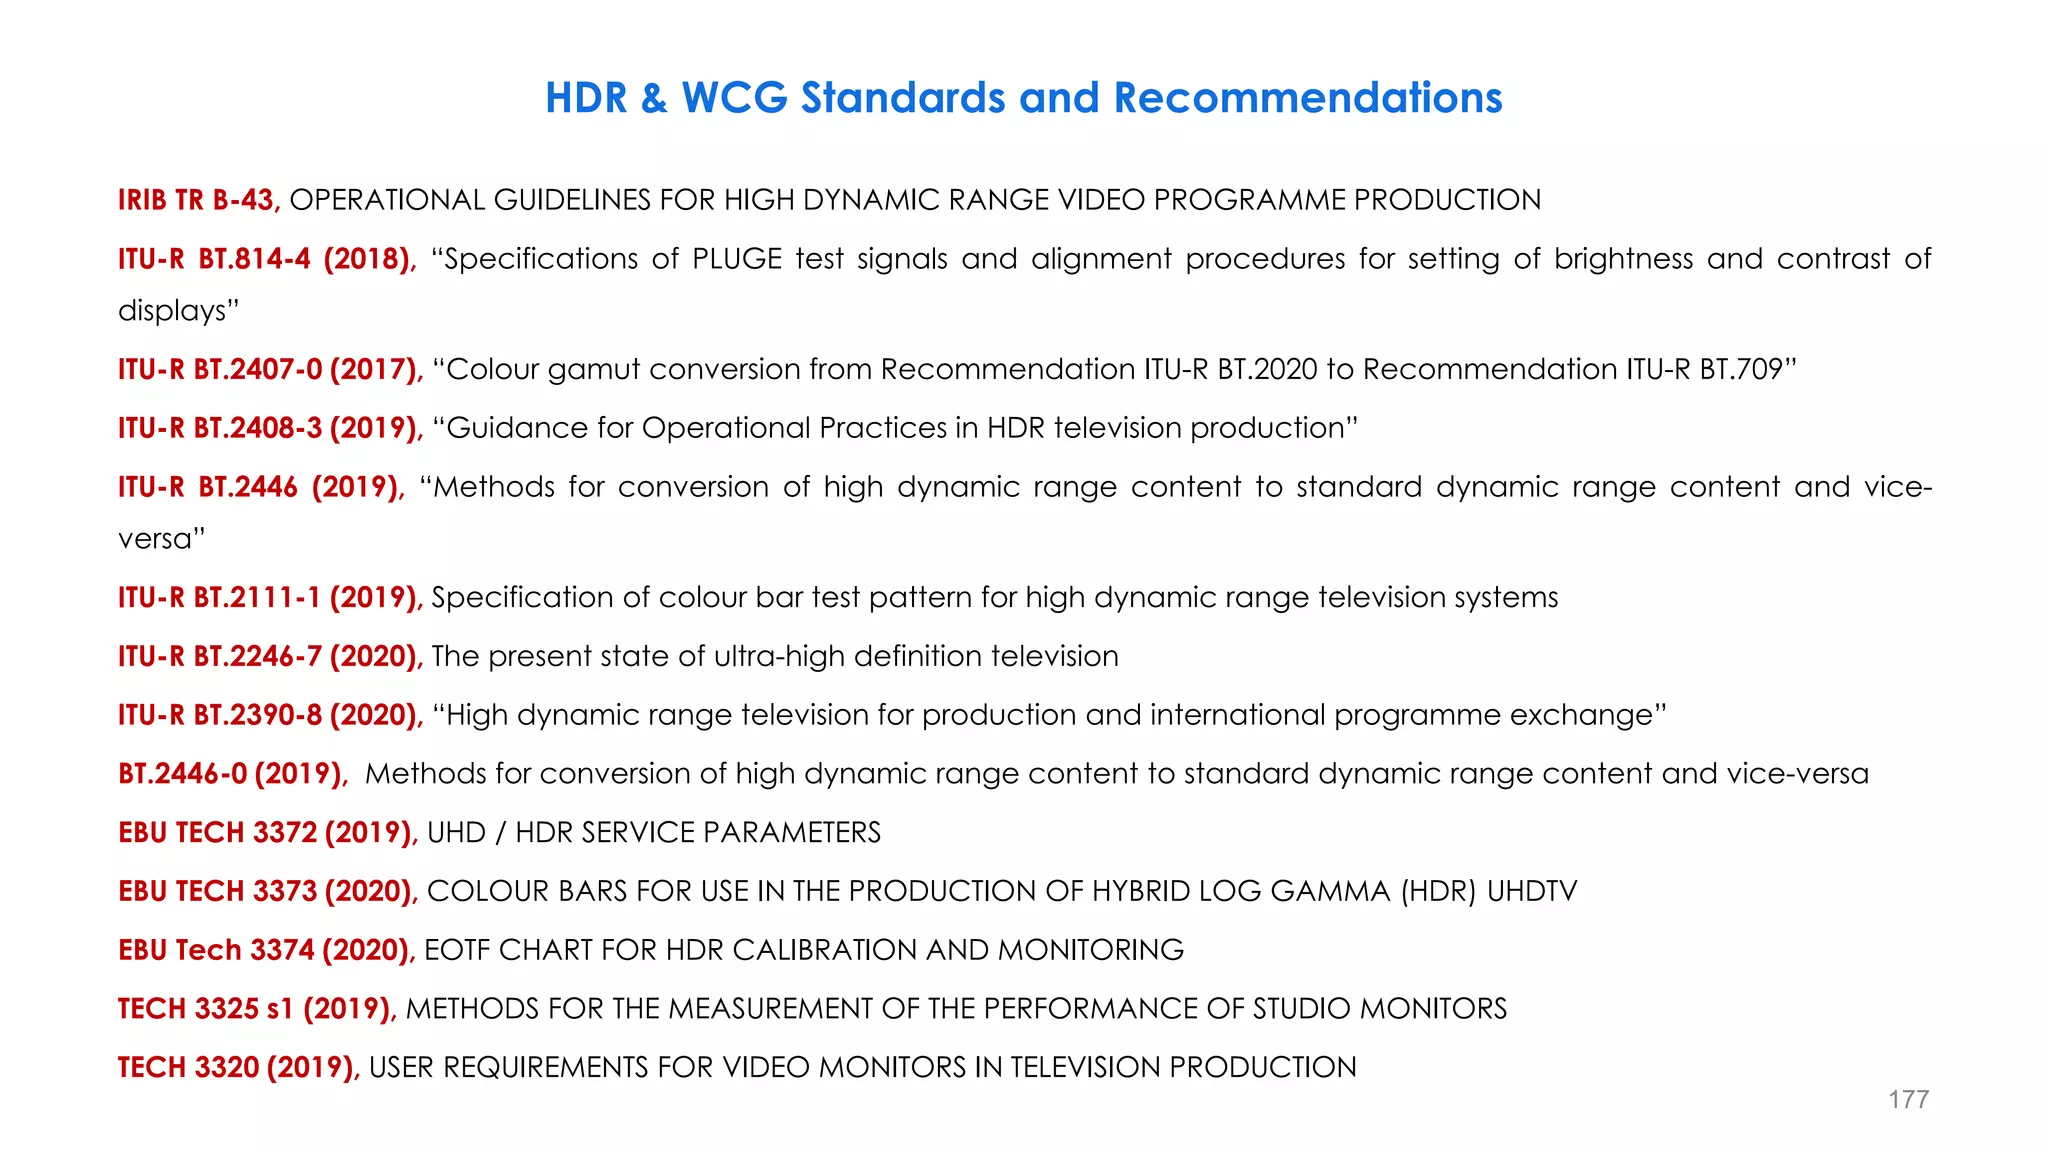
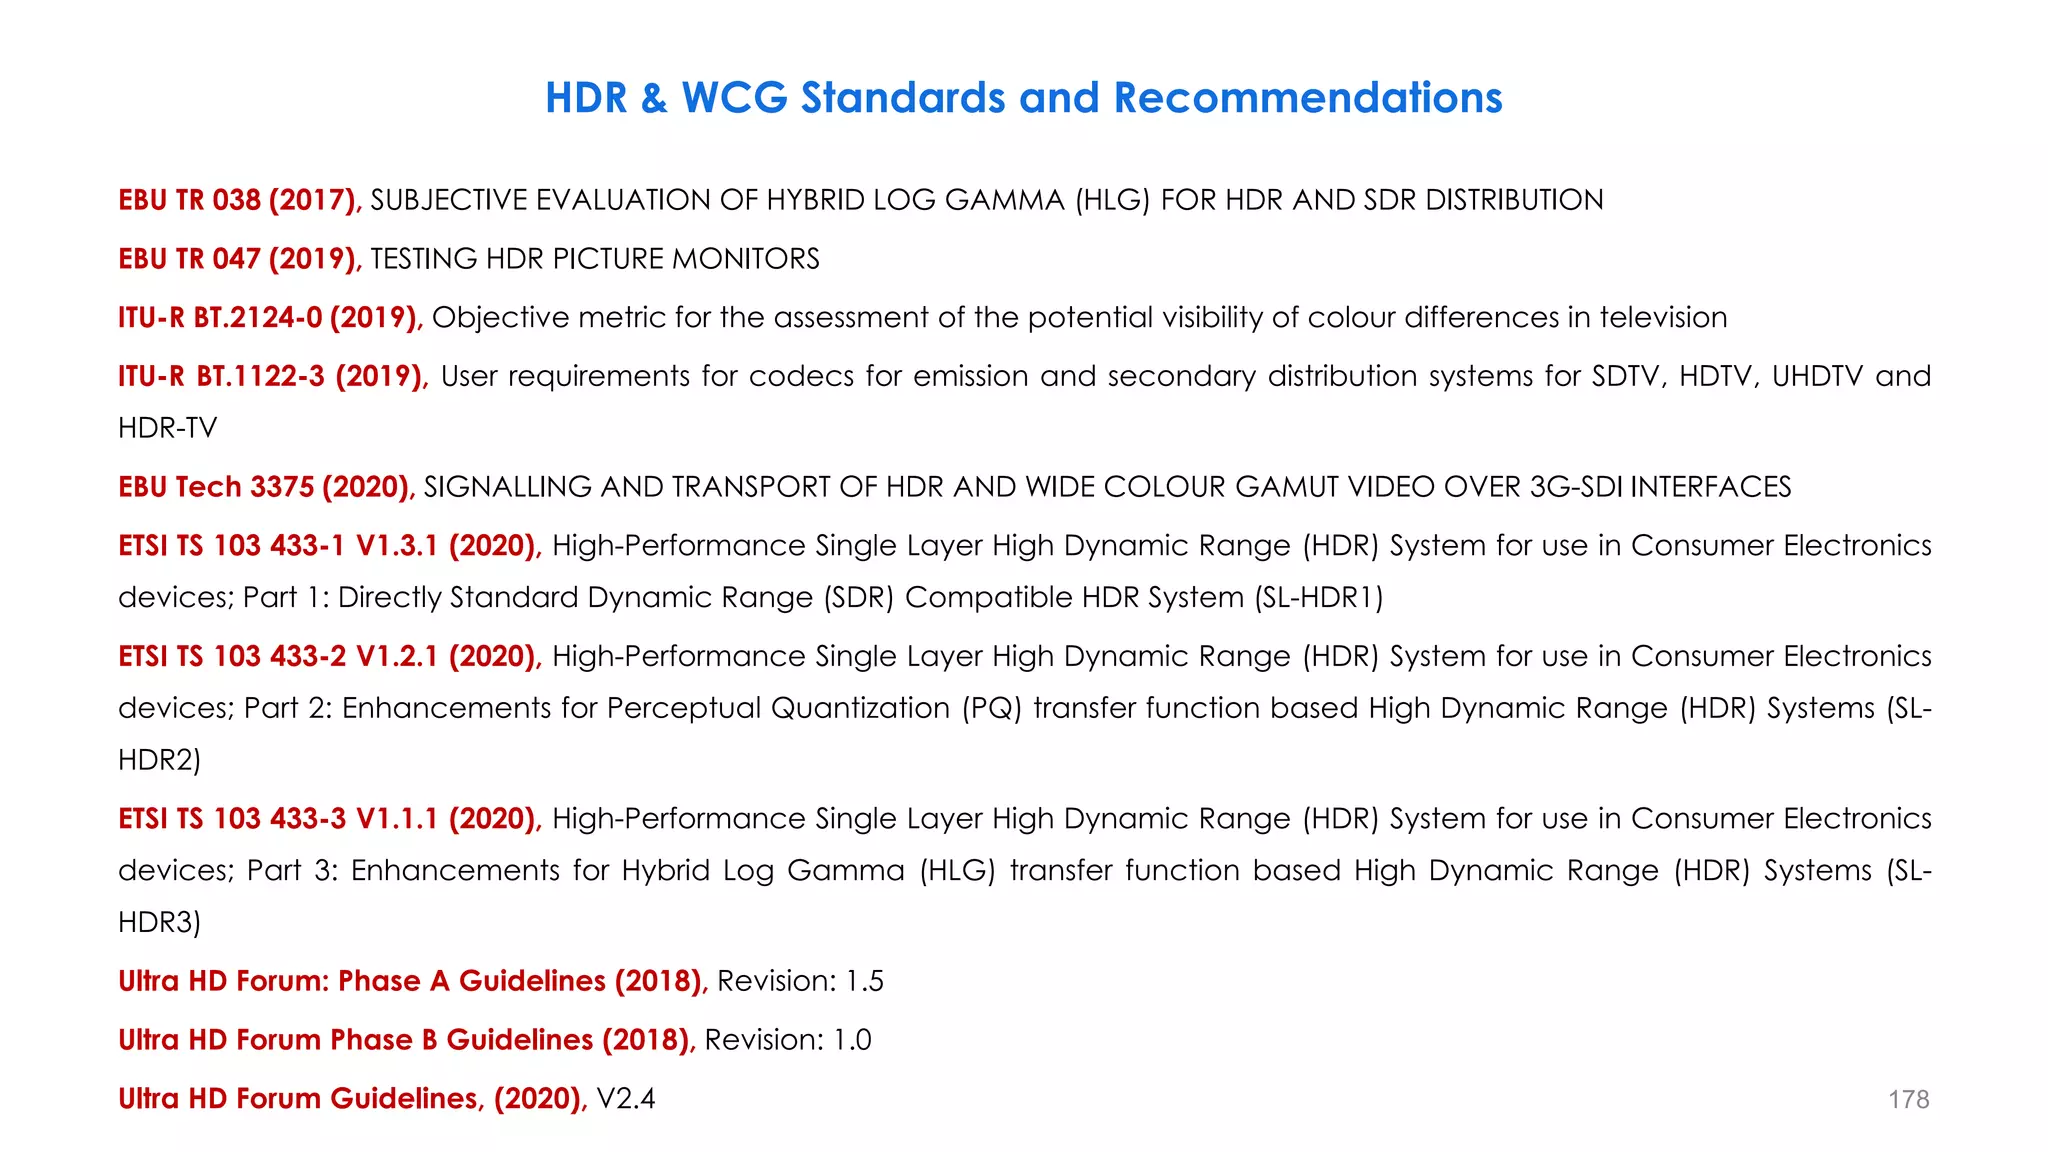
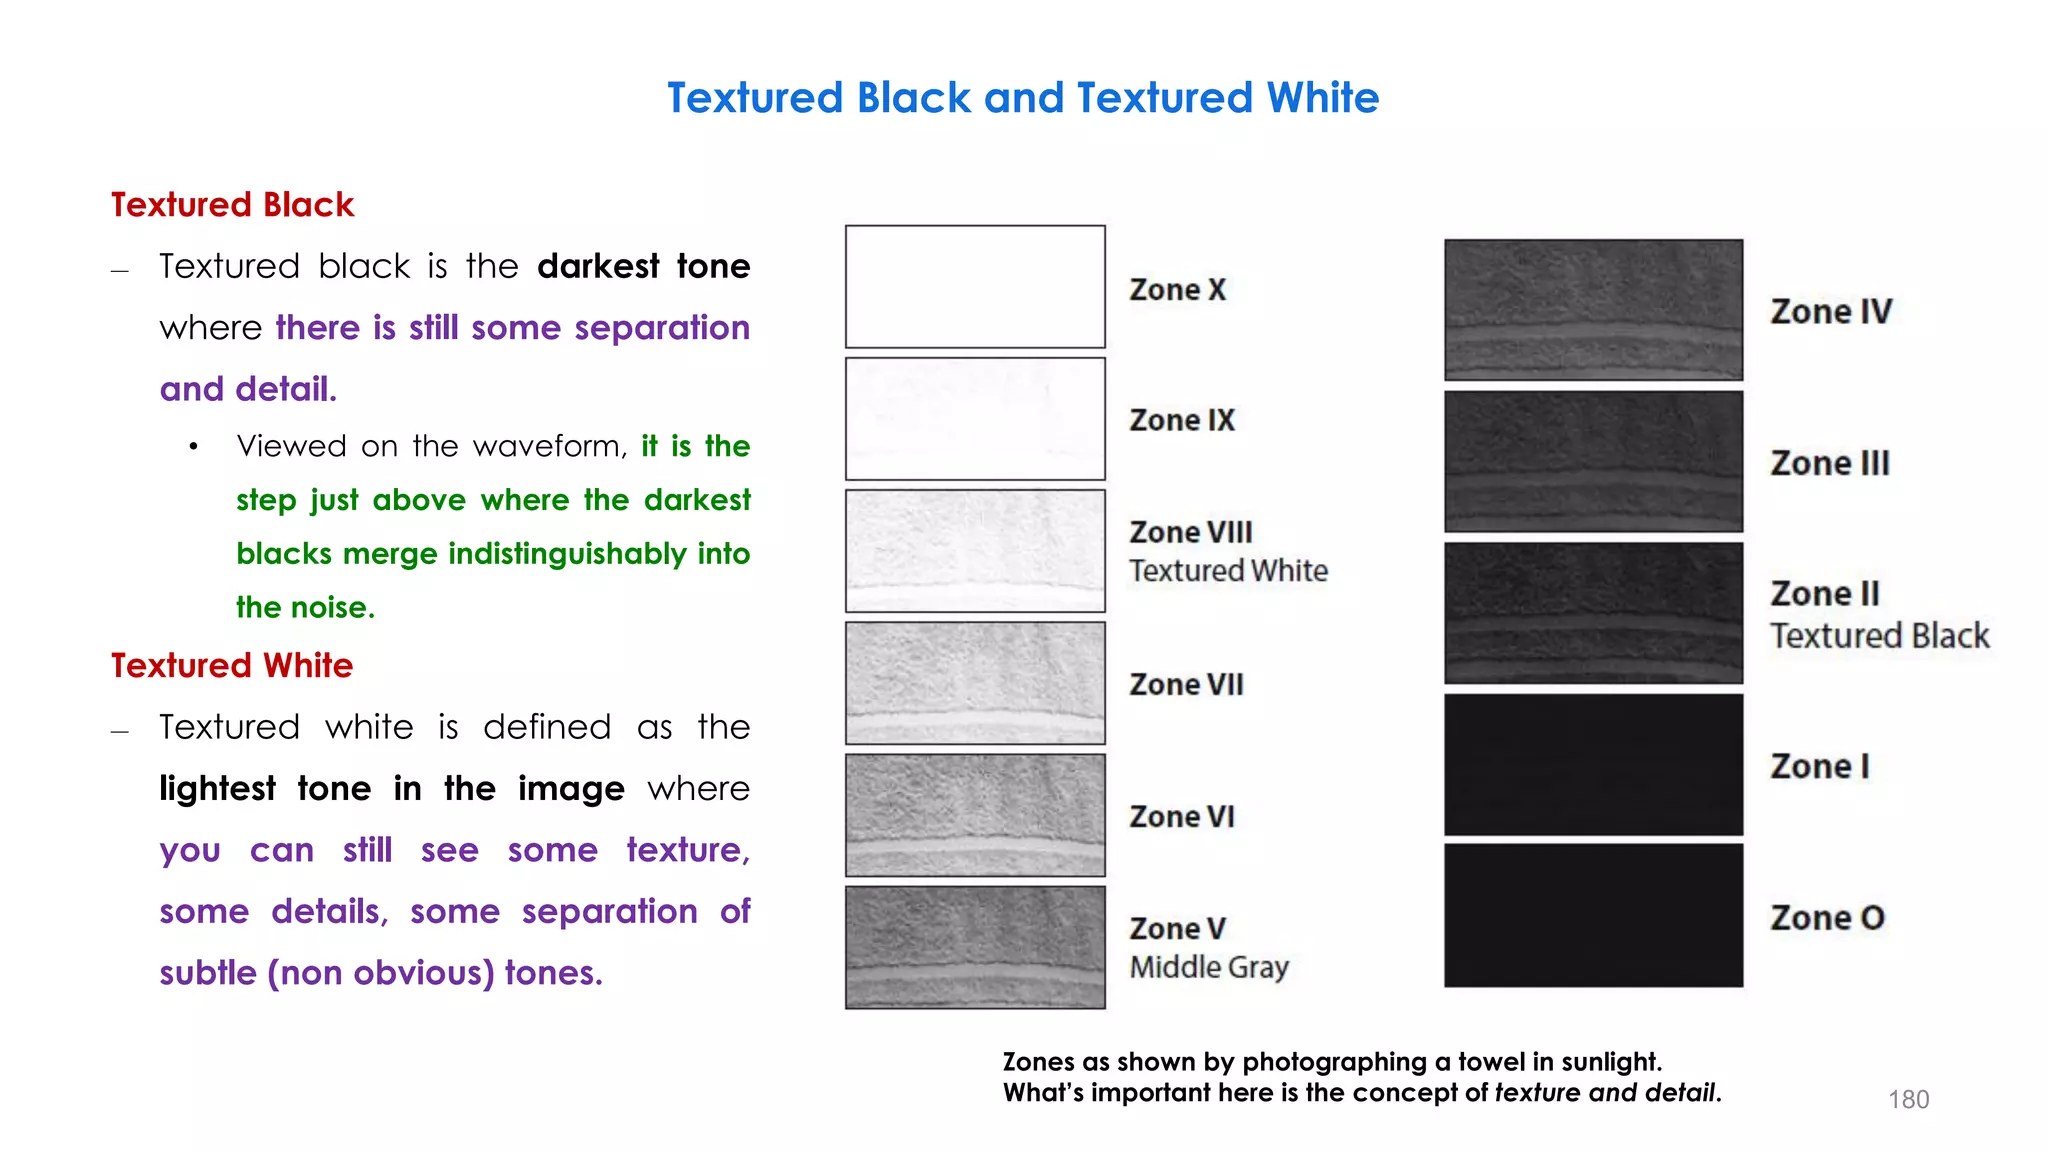
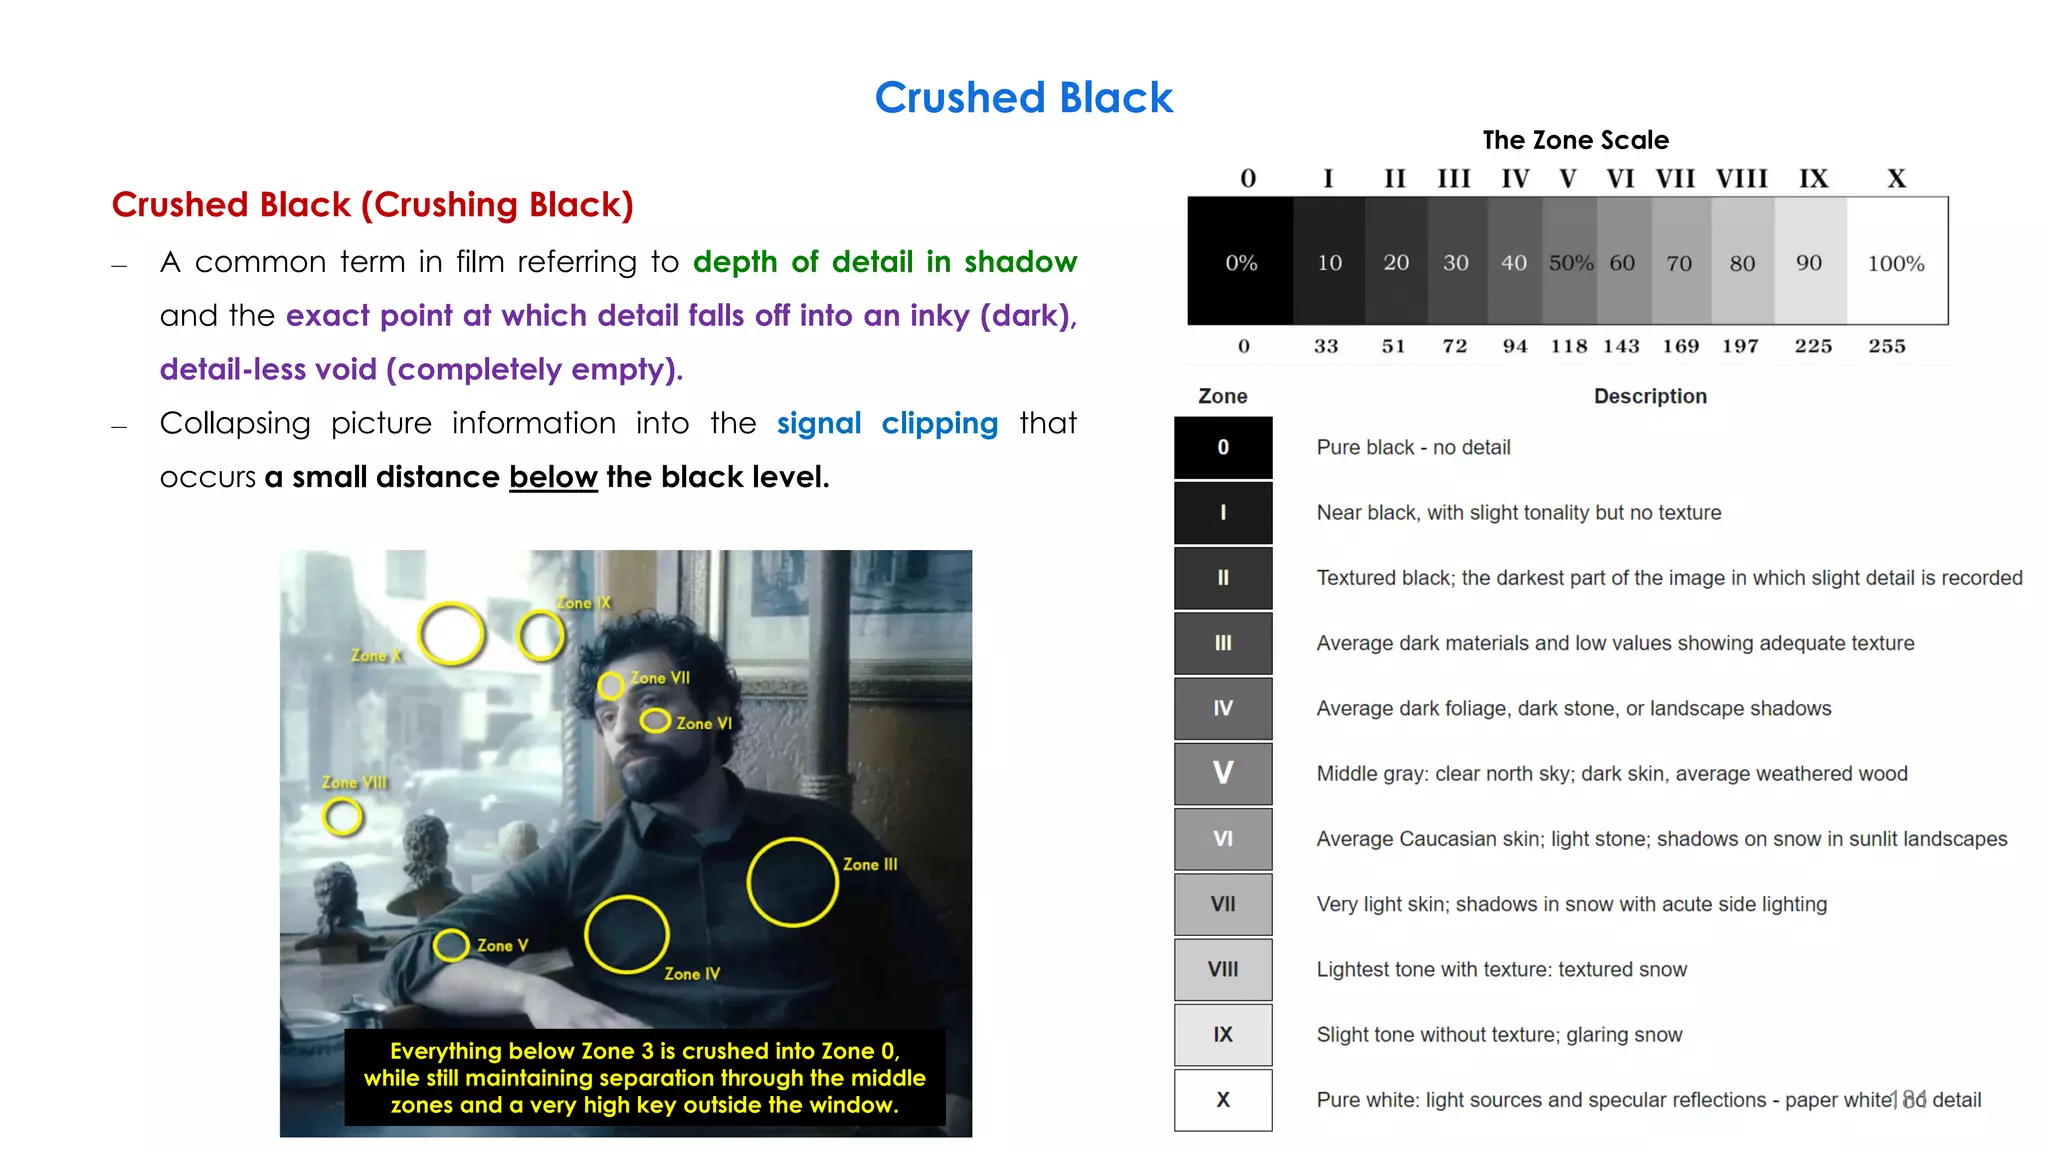
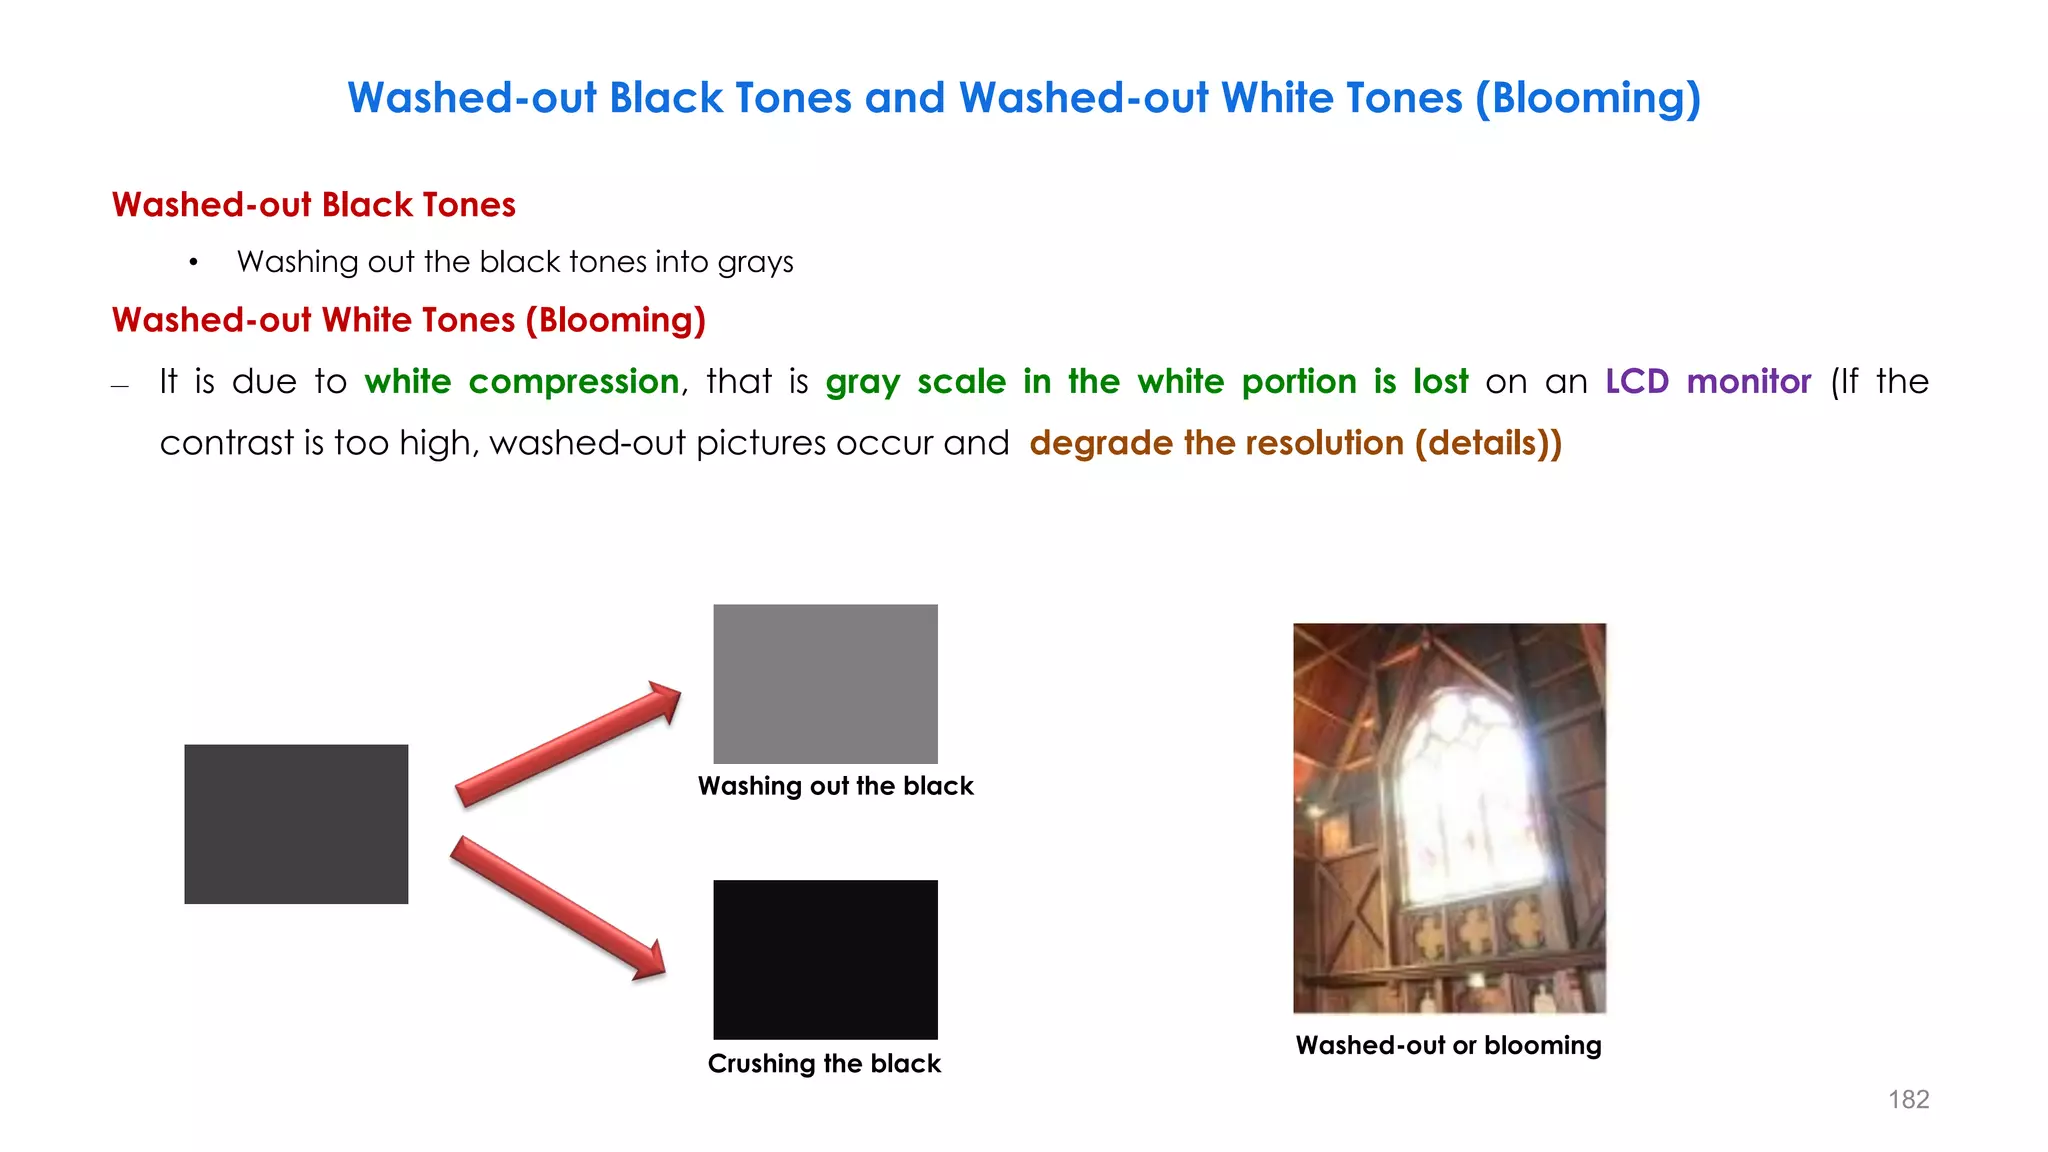
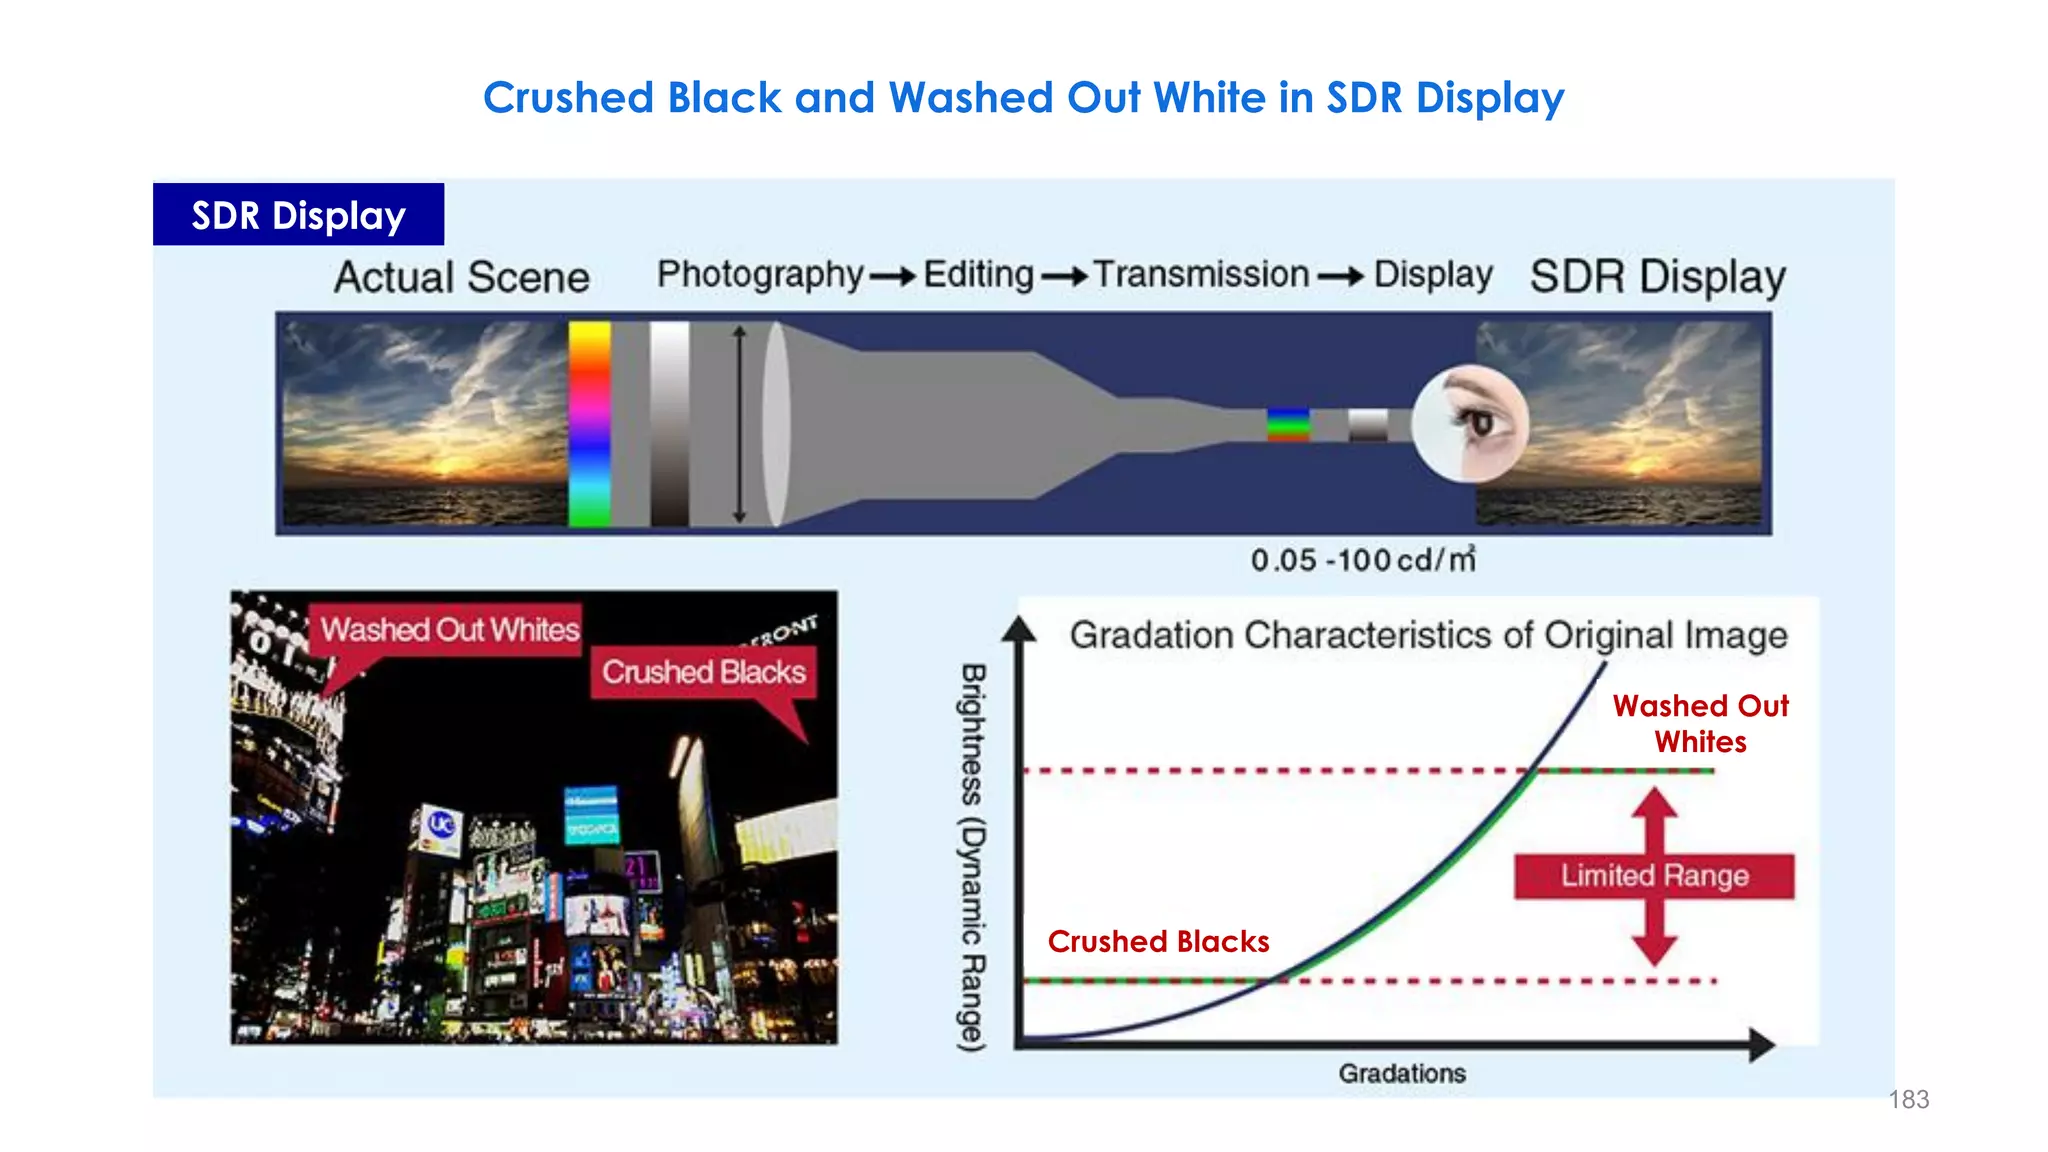
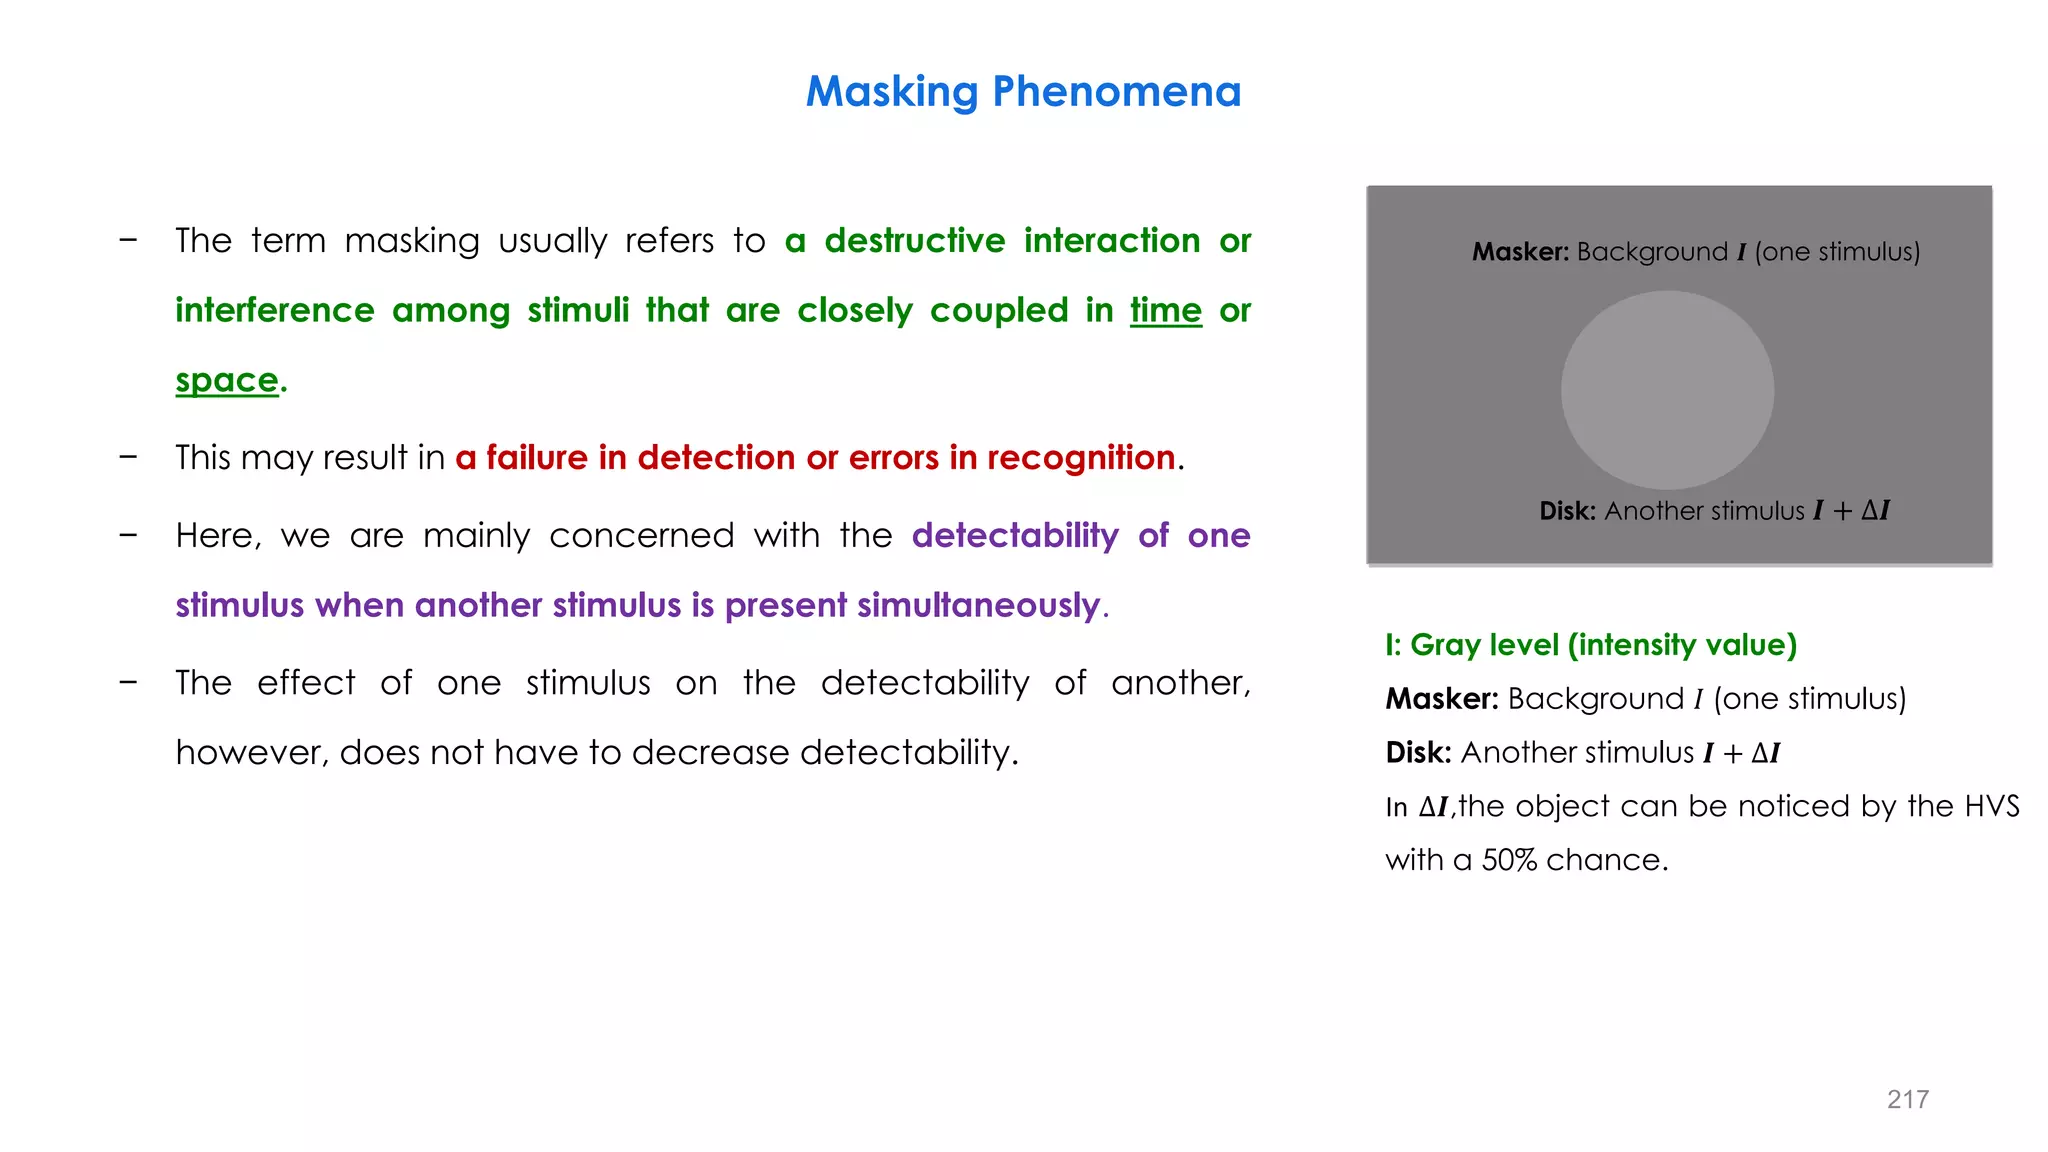
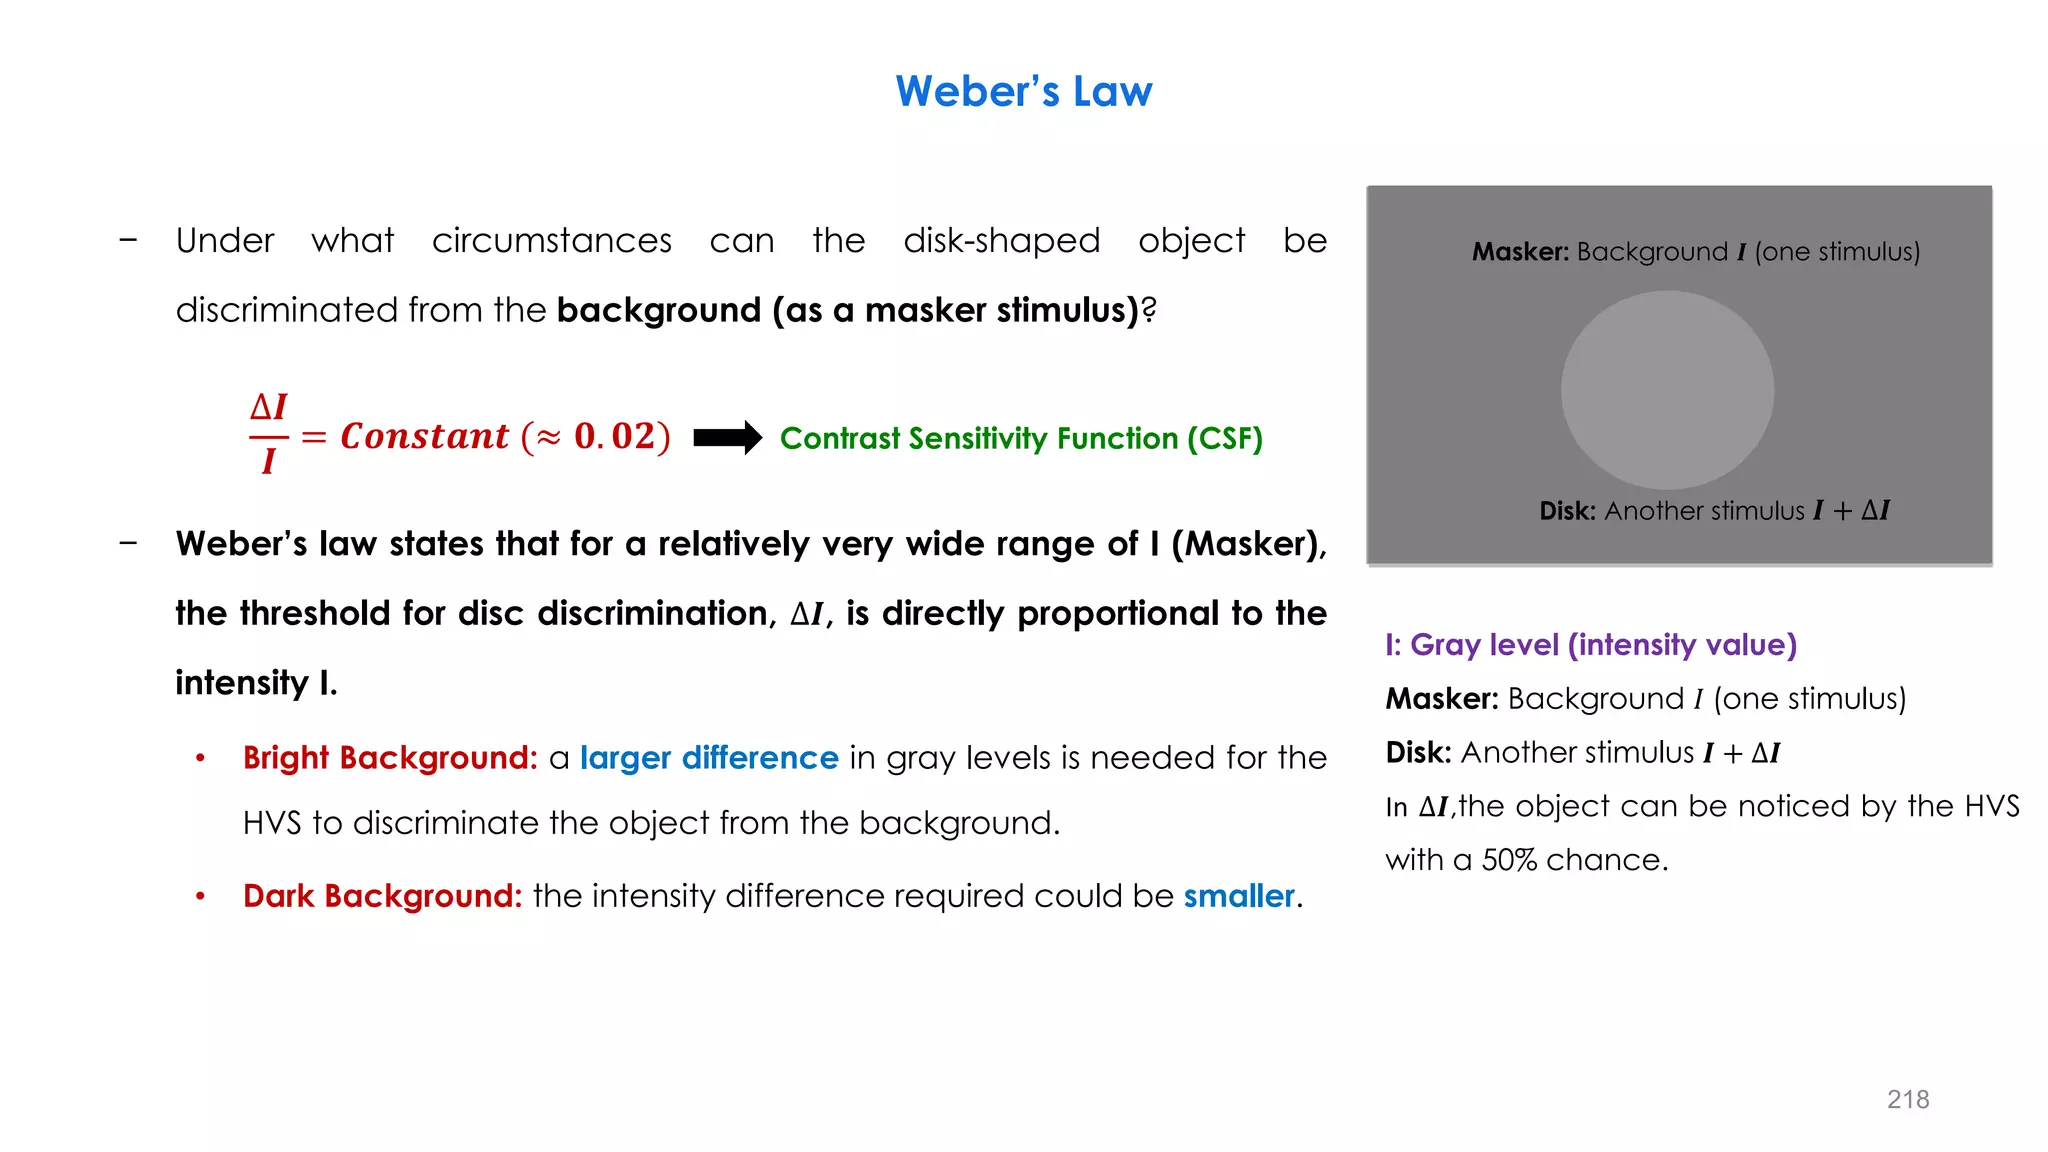
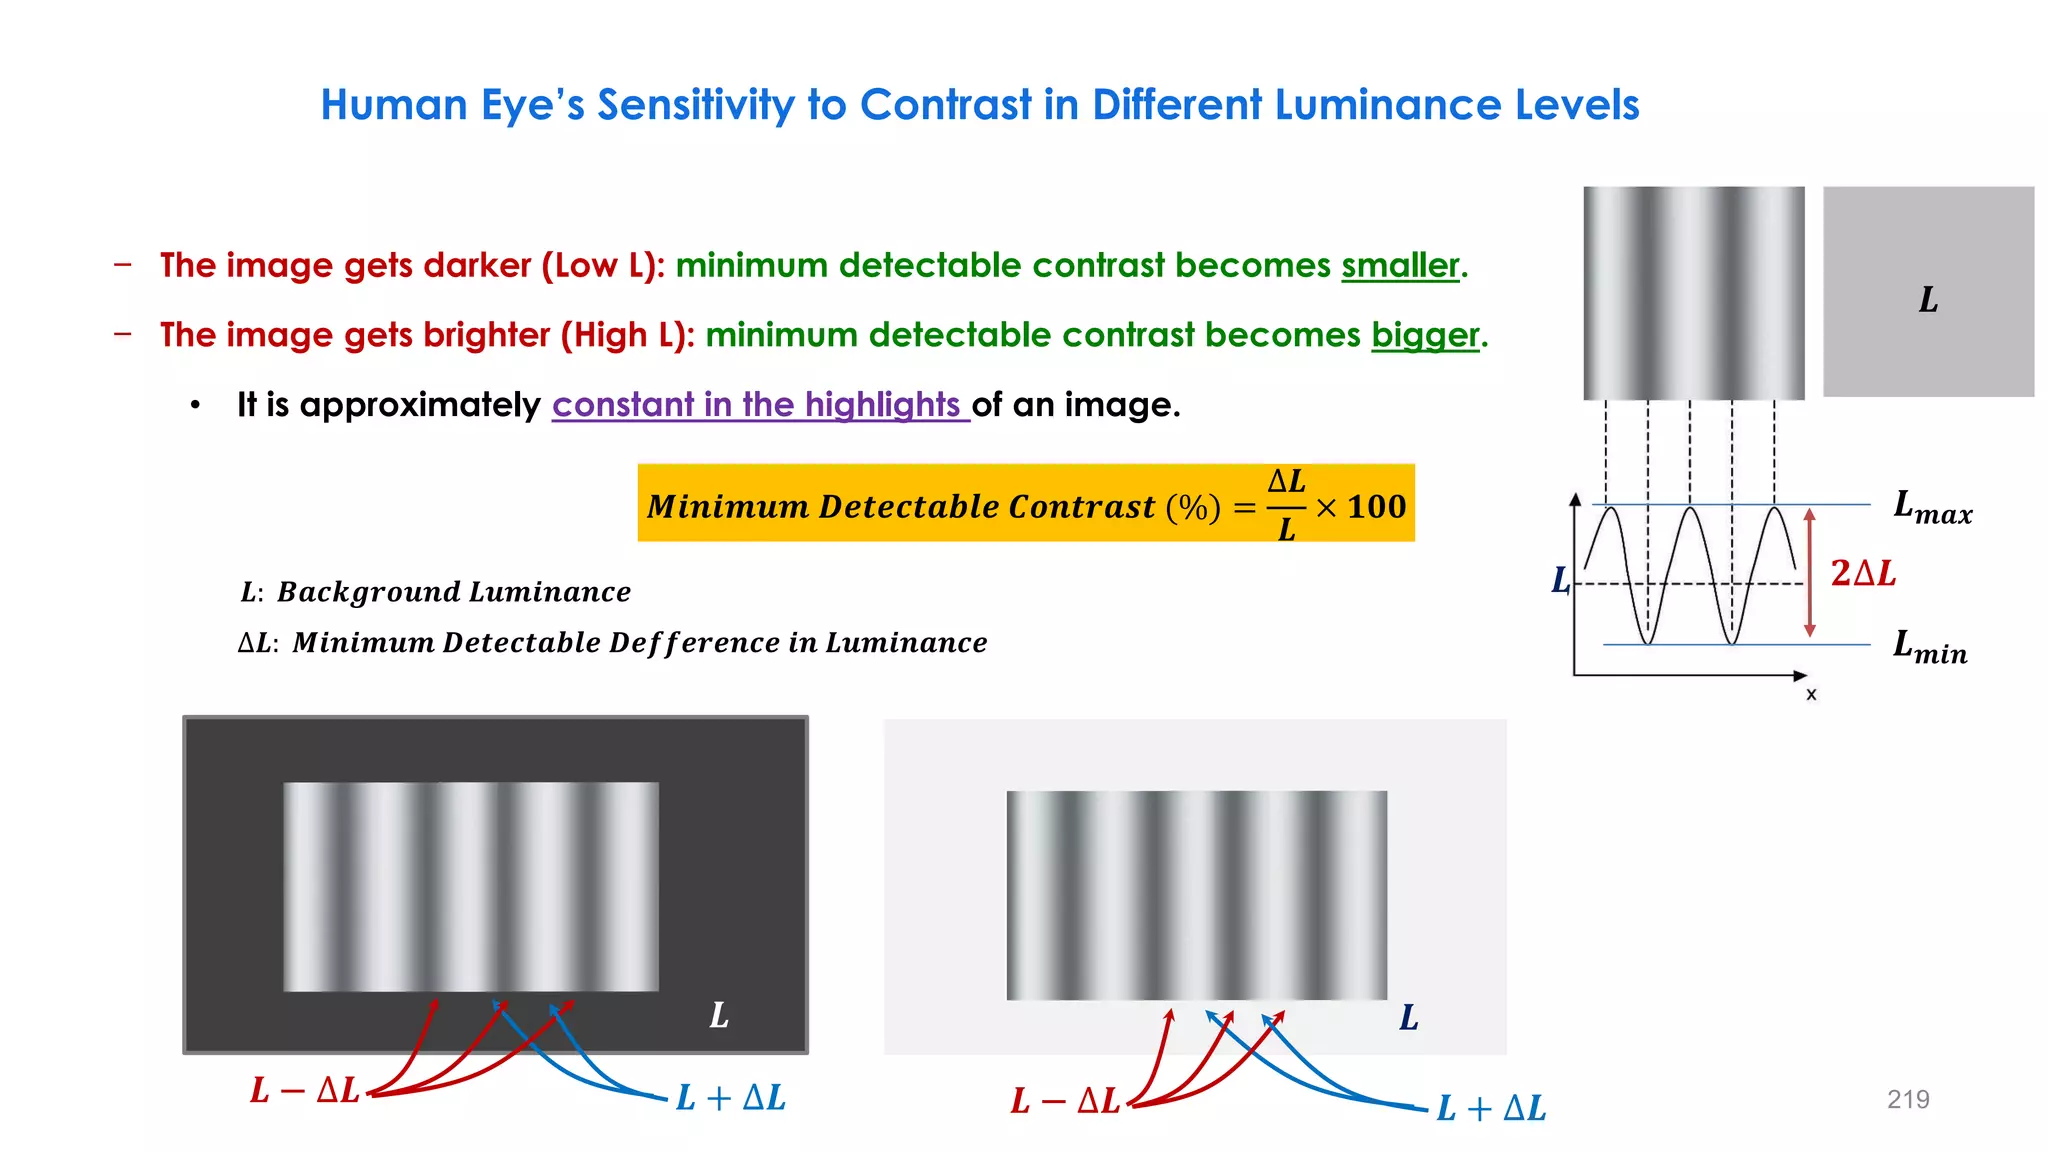
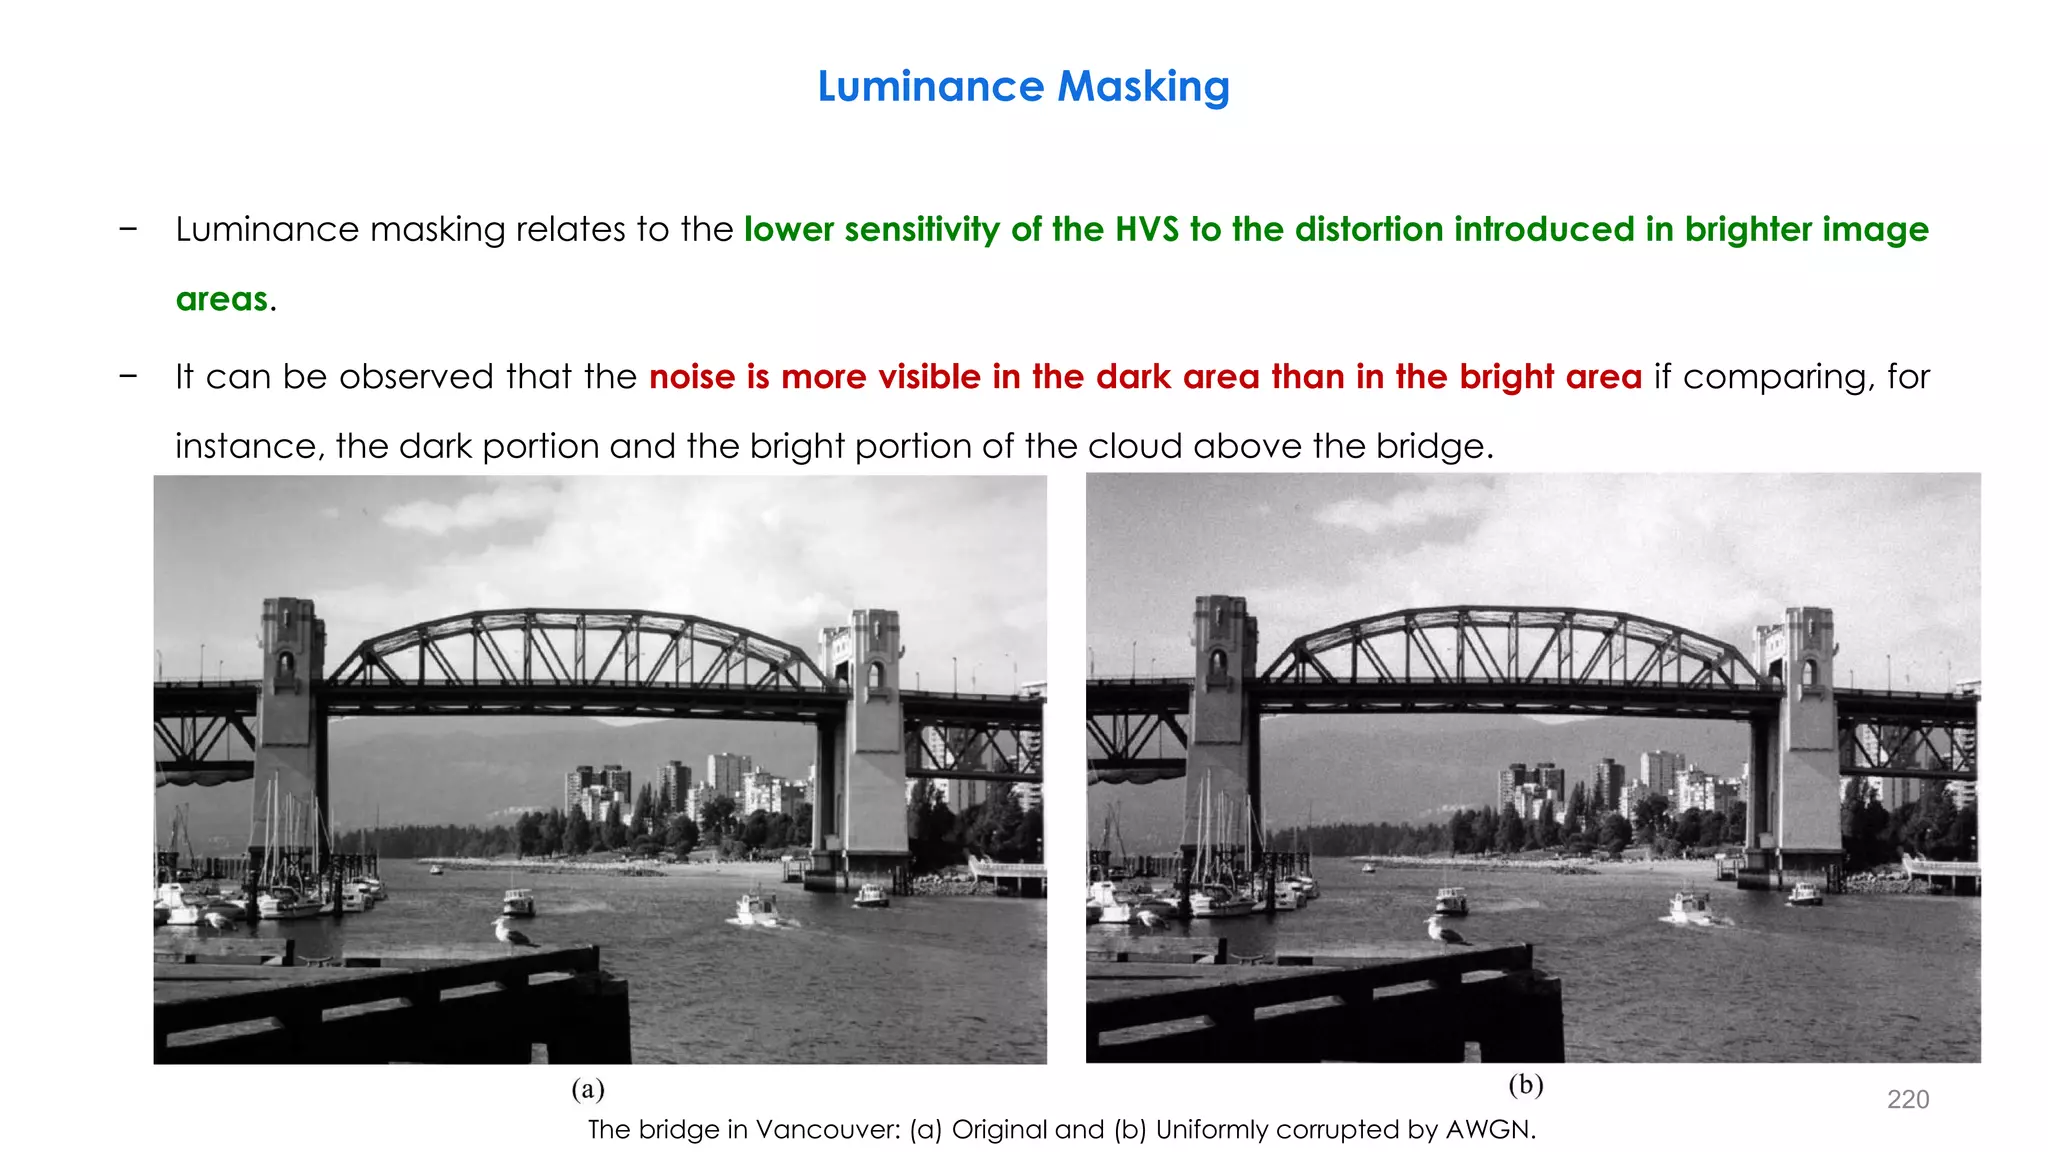
Download as PDF, PPTX


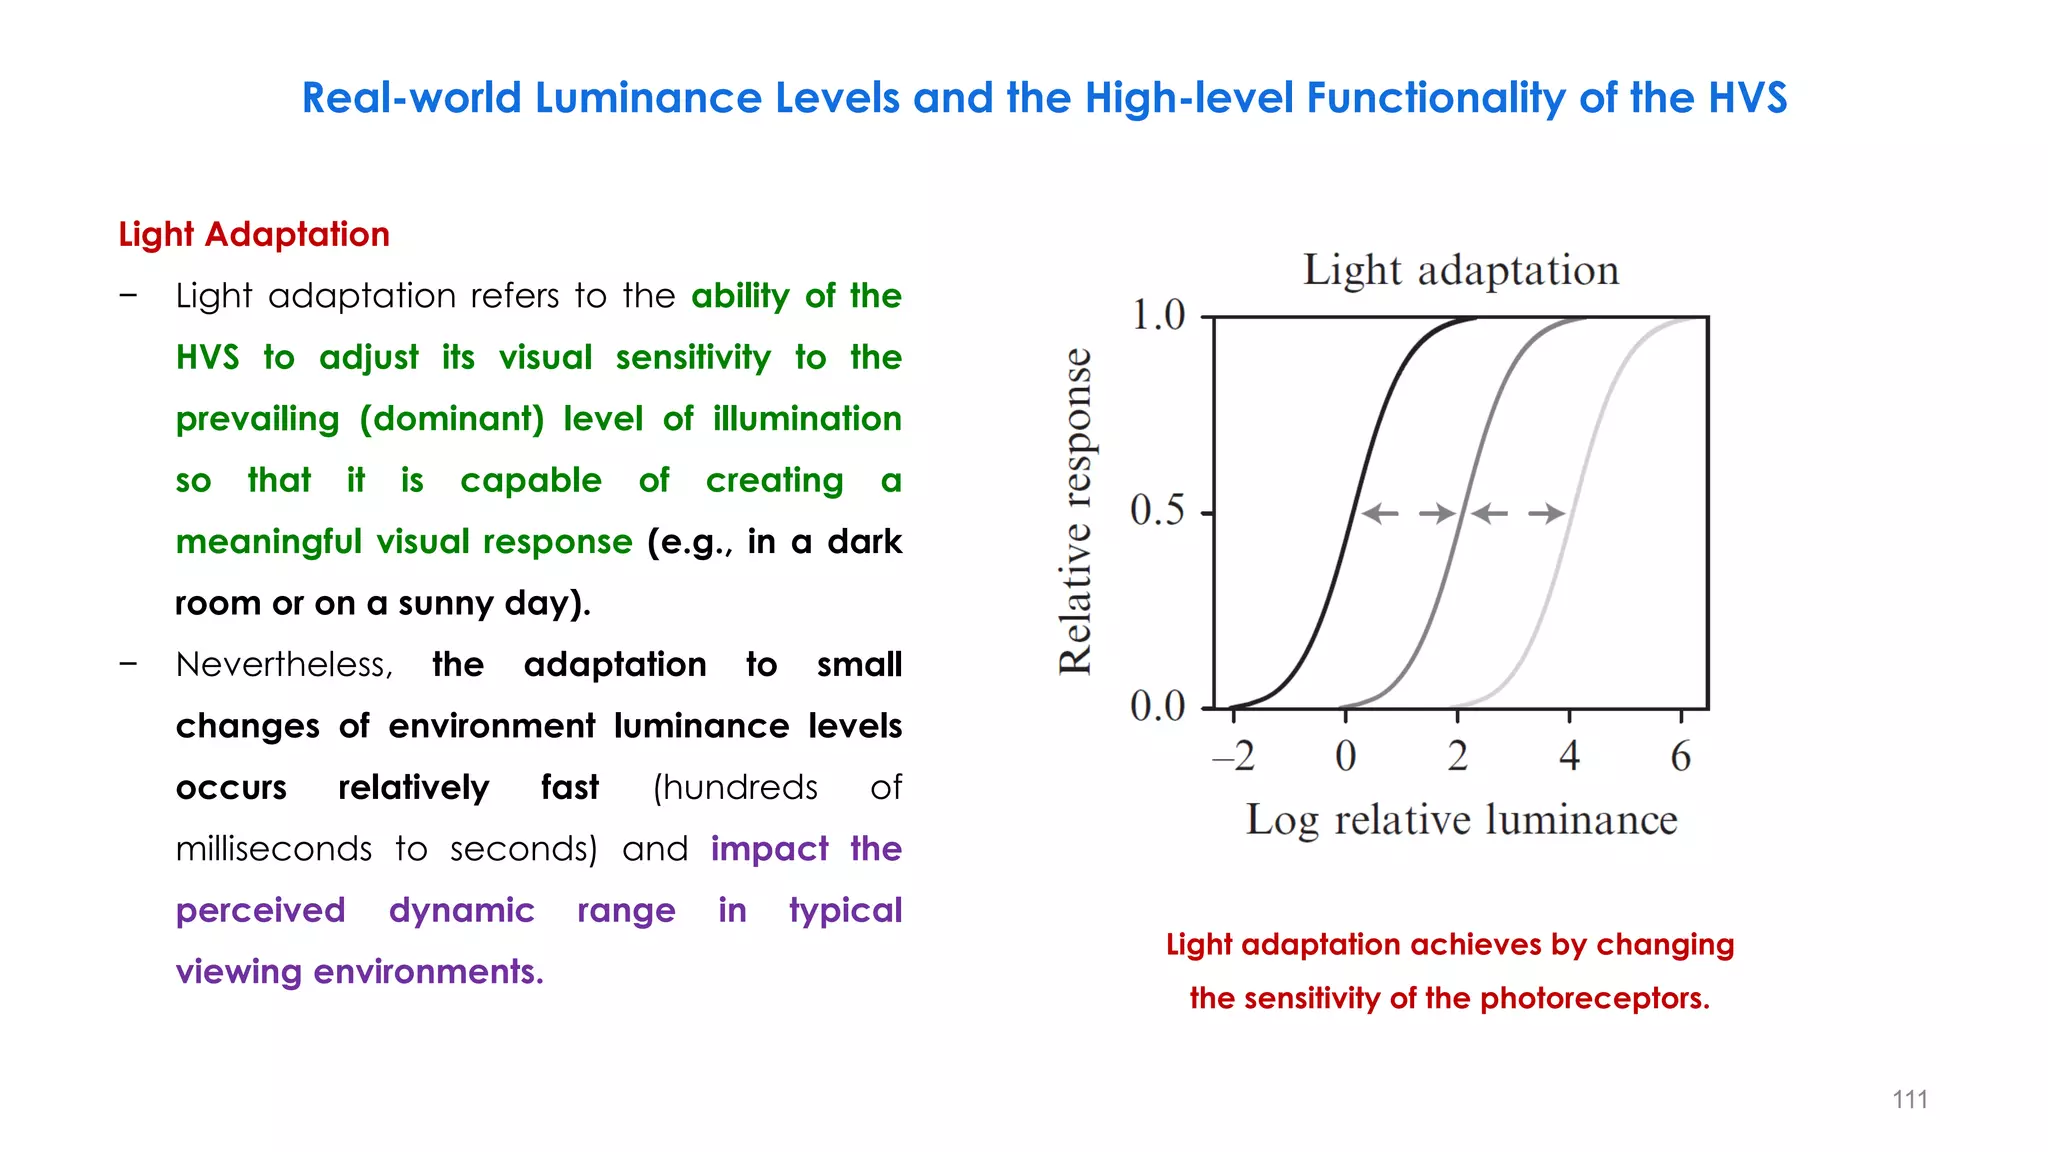
![𝑠 = 𝑐. 𝑟𝛾
𝜸 < 𝟏
It maps a narrow range of
dark input values into a wide
range of output values and
vice versa.
Brighter Image
𝜸 > 𝟏
It maps a narrow range of
bright input values into a wide
range of output values and
vice versa.
Darker Image
r = [1 10 20 30 40 210 220 230 240 250 255]
s( =0.4) = [28 70 92 108 122 236 240 245 249 253 255]
s( = 2.5) = [0 0 0 1 2 157 176 197 219 243 255]
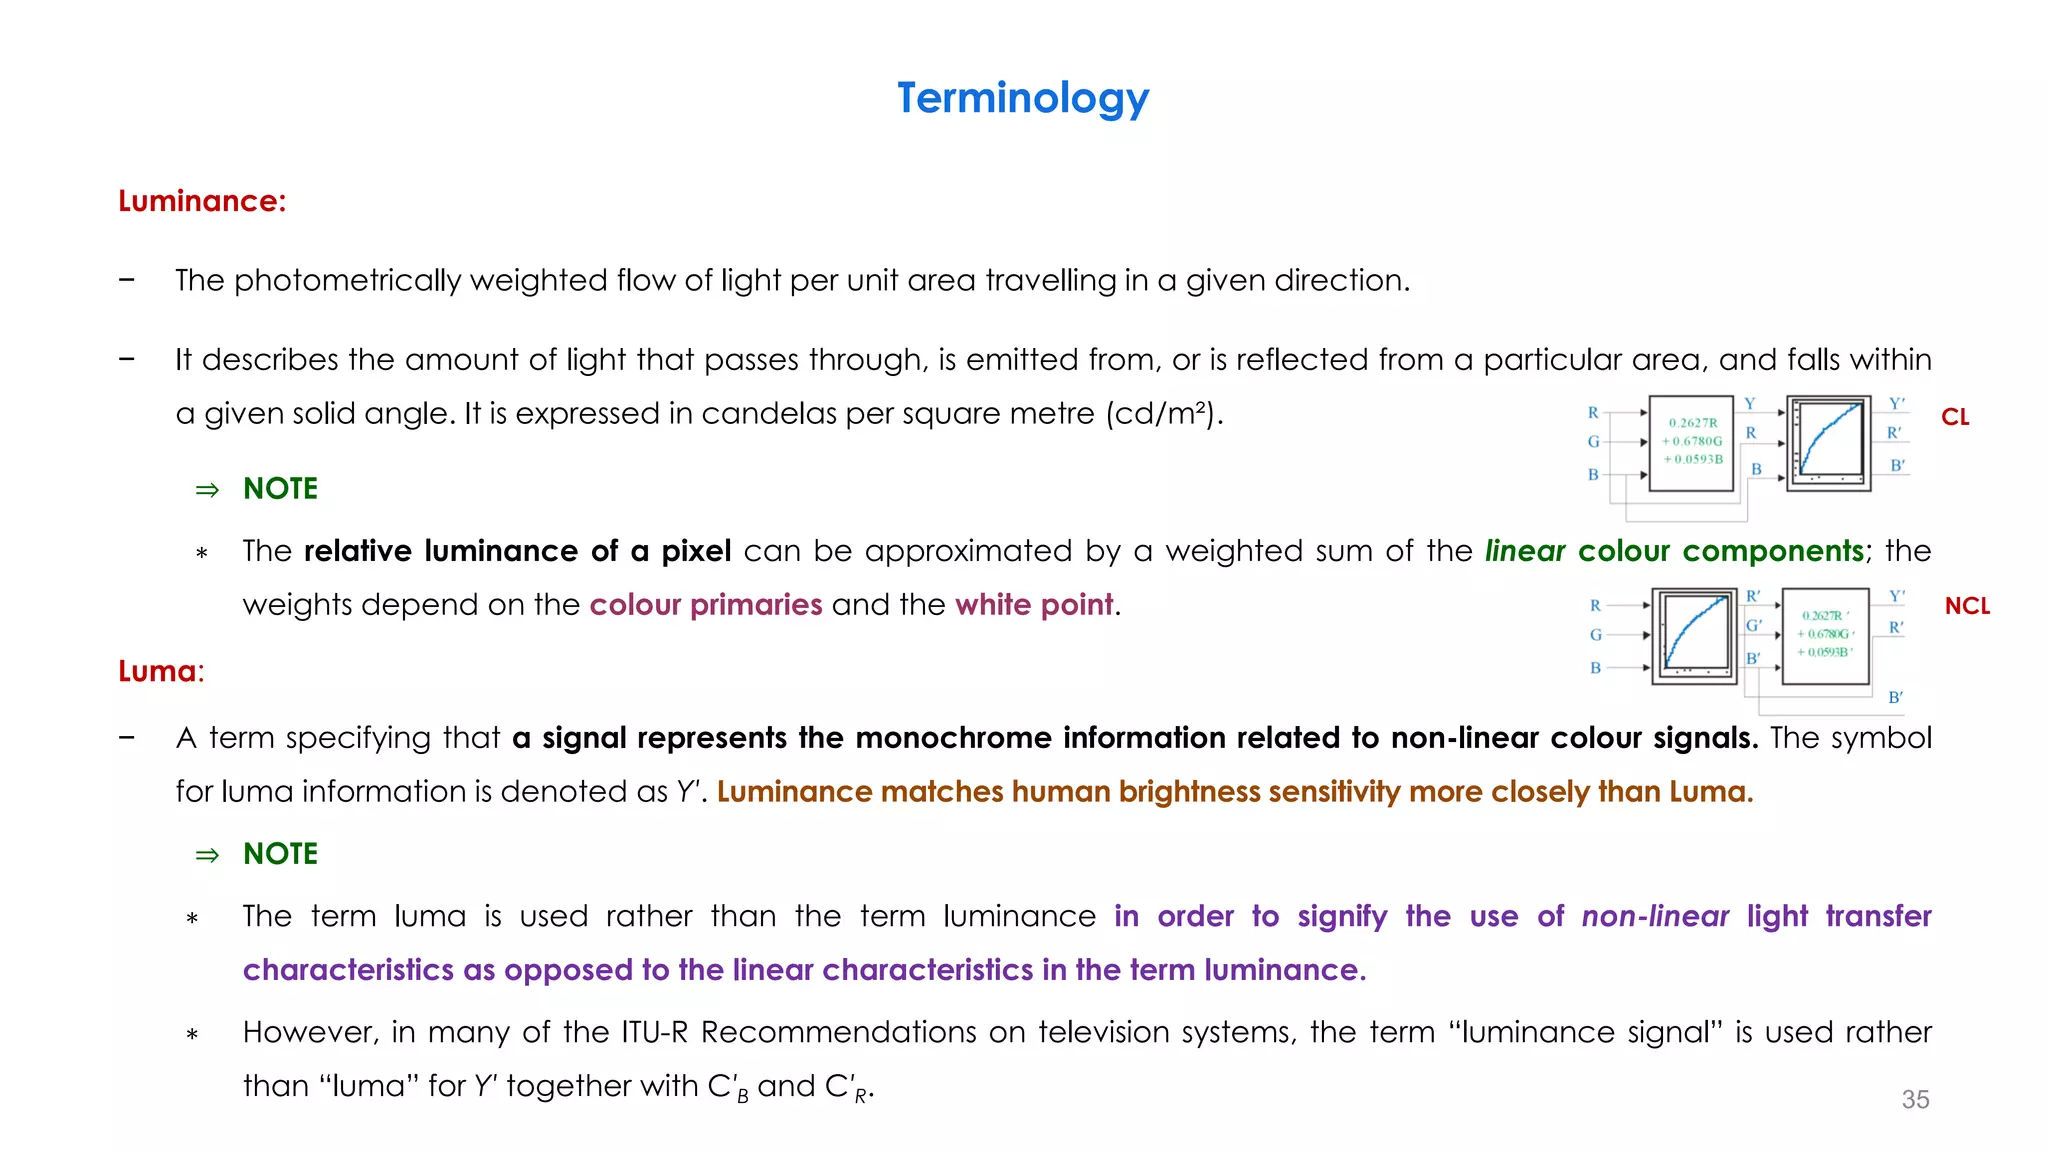
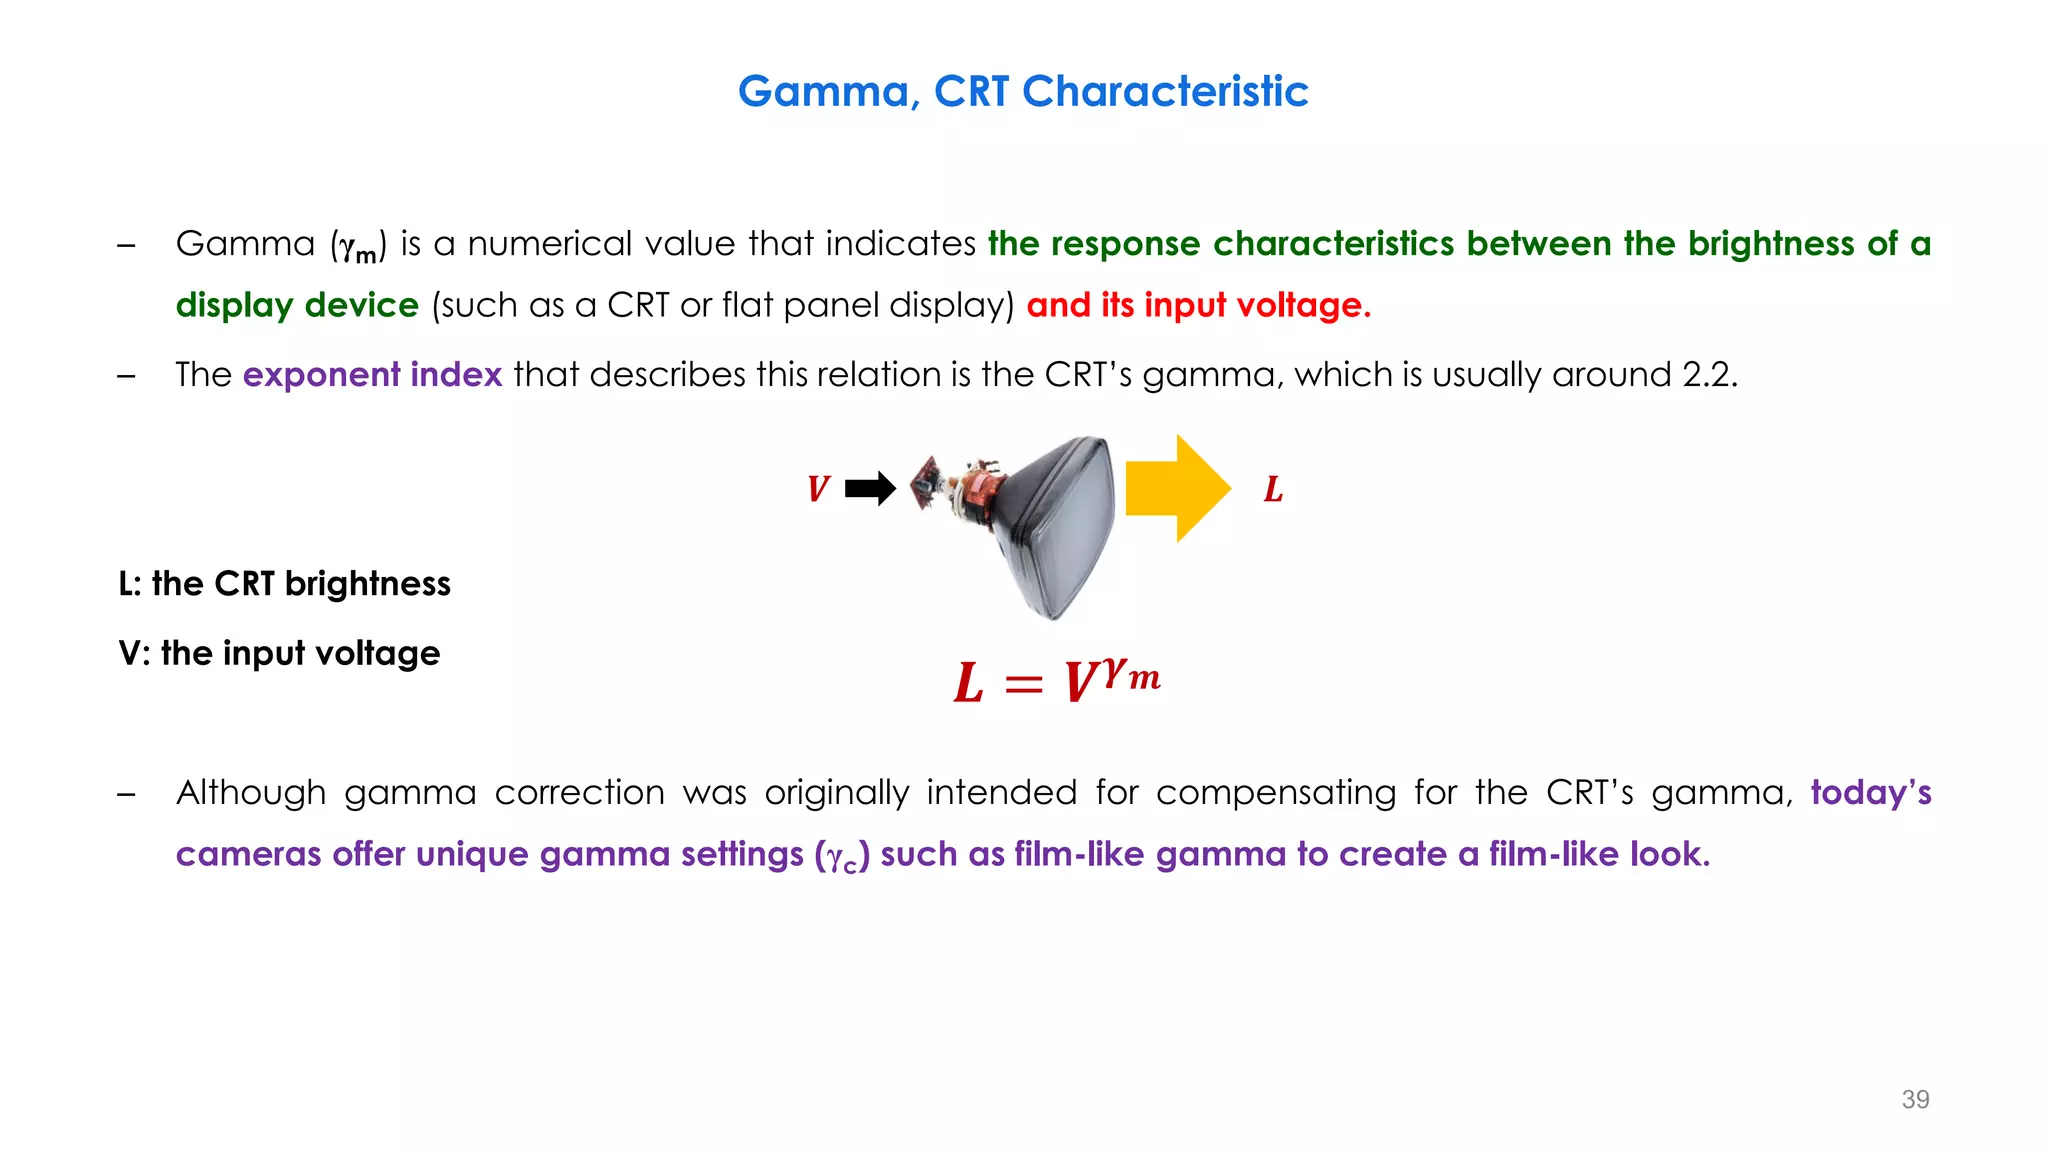
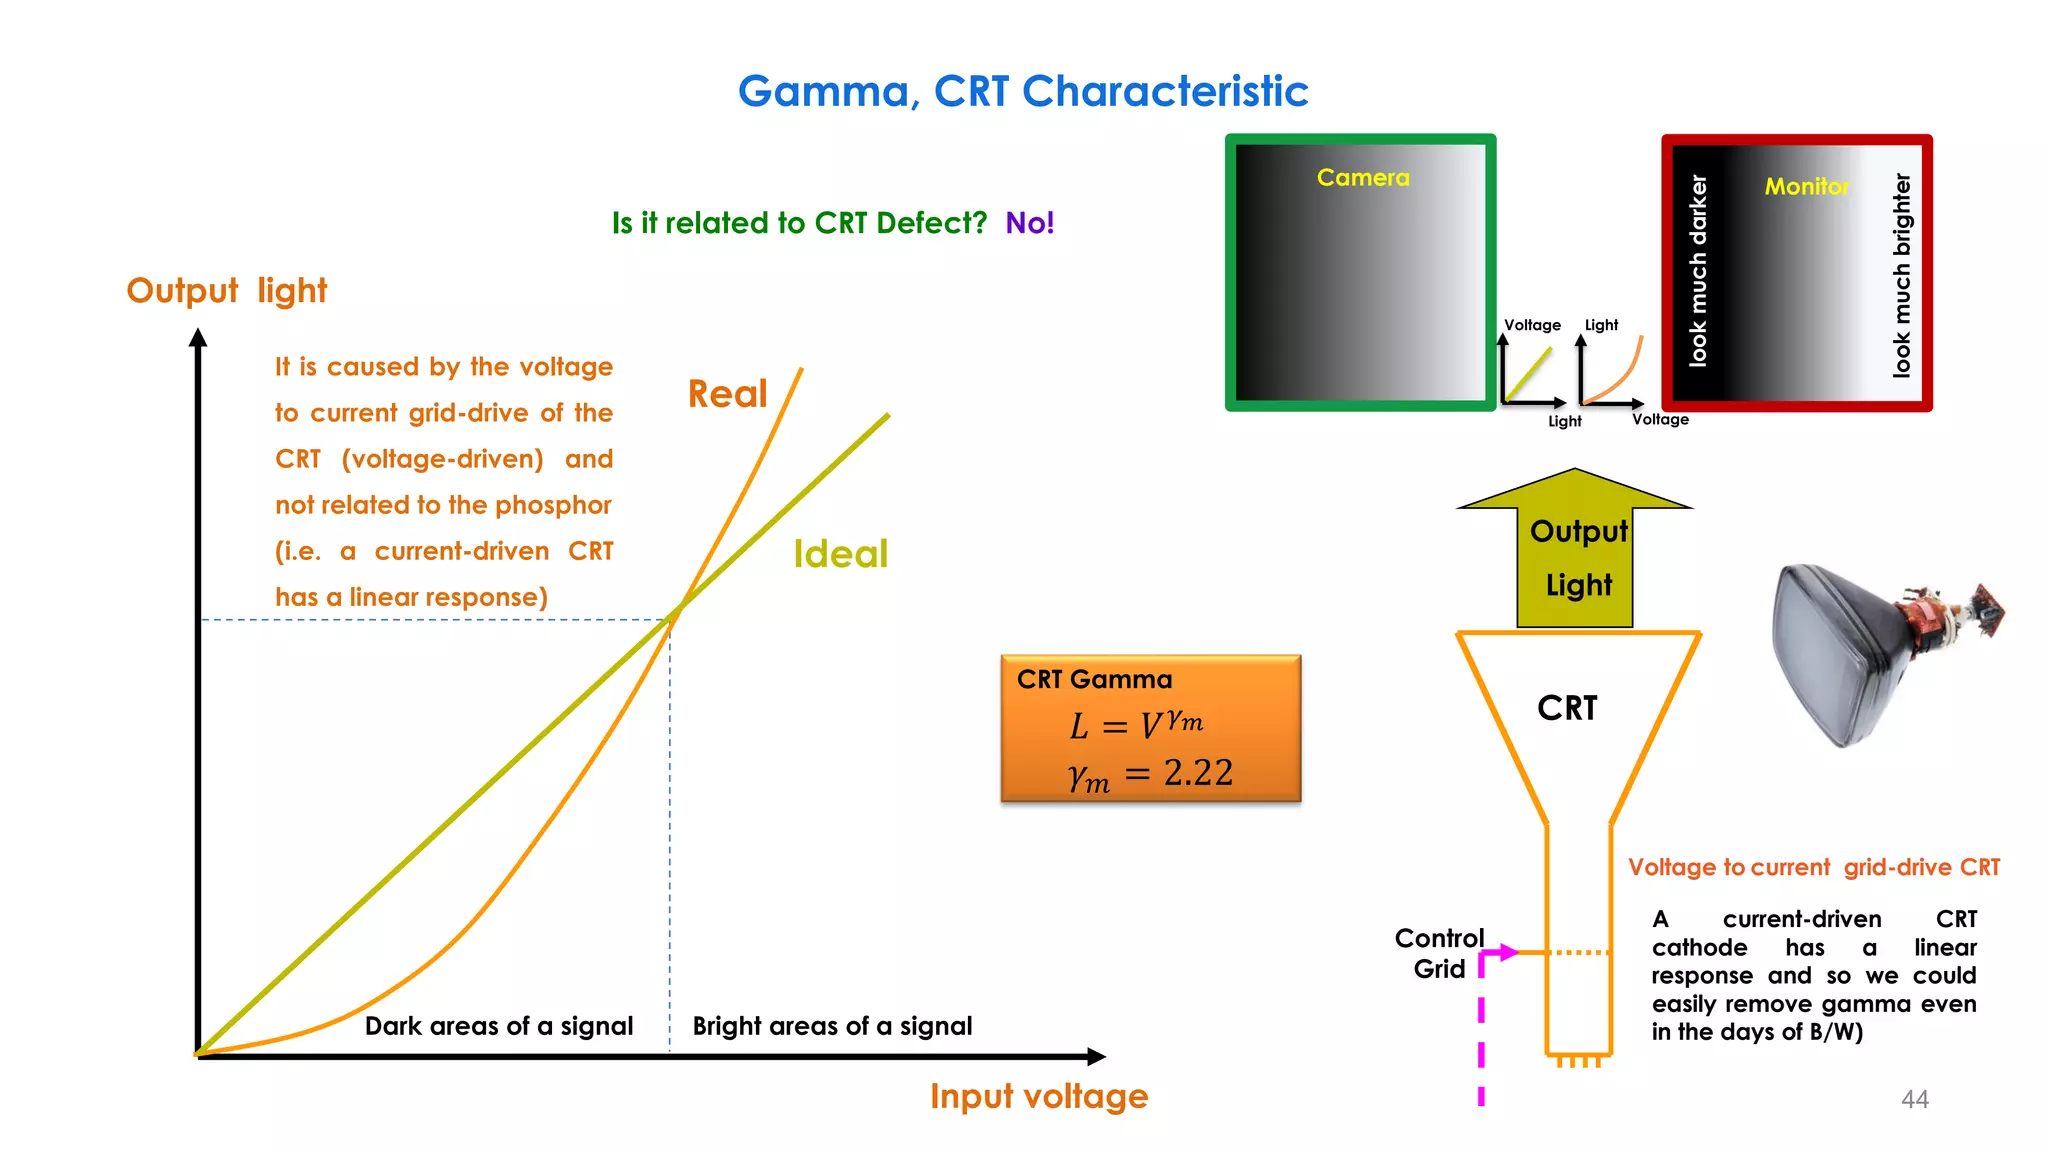
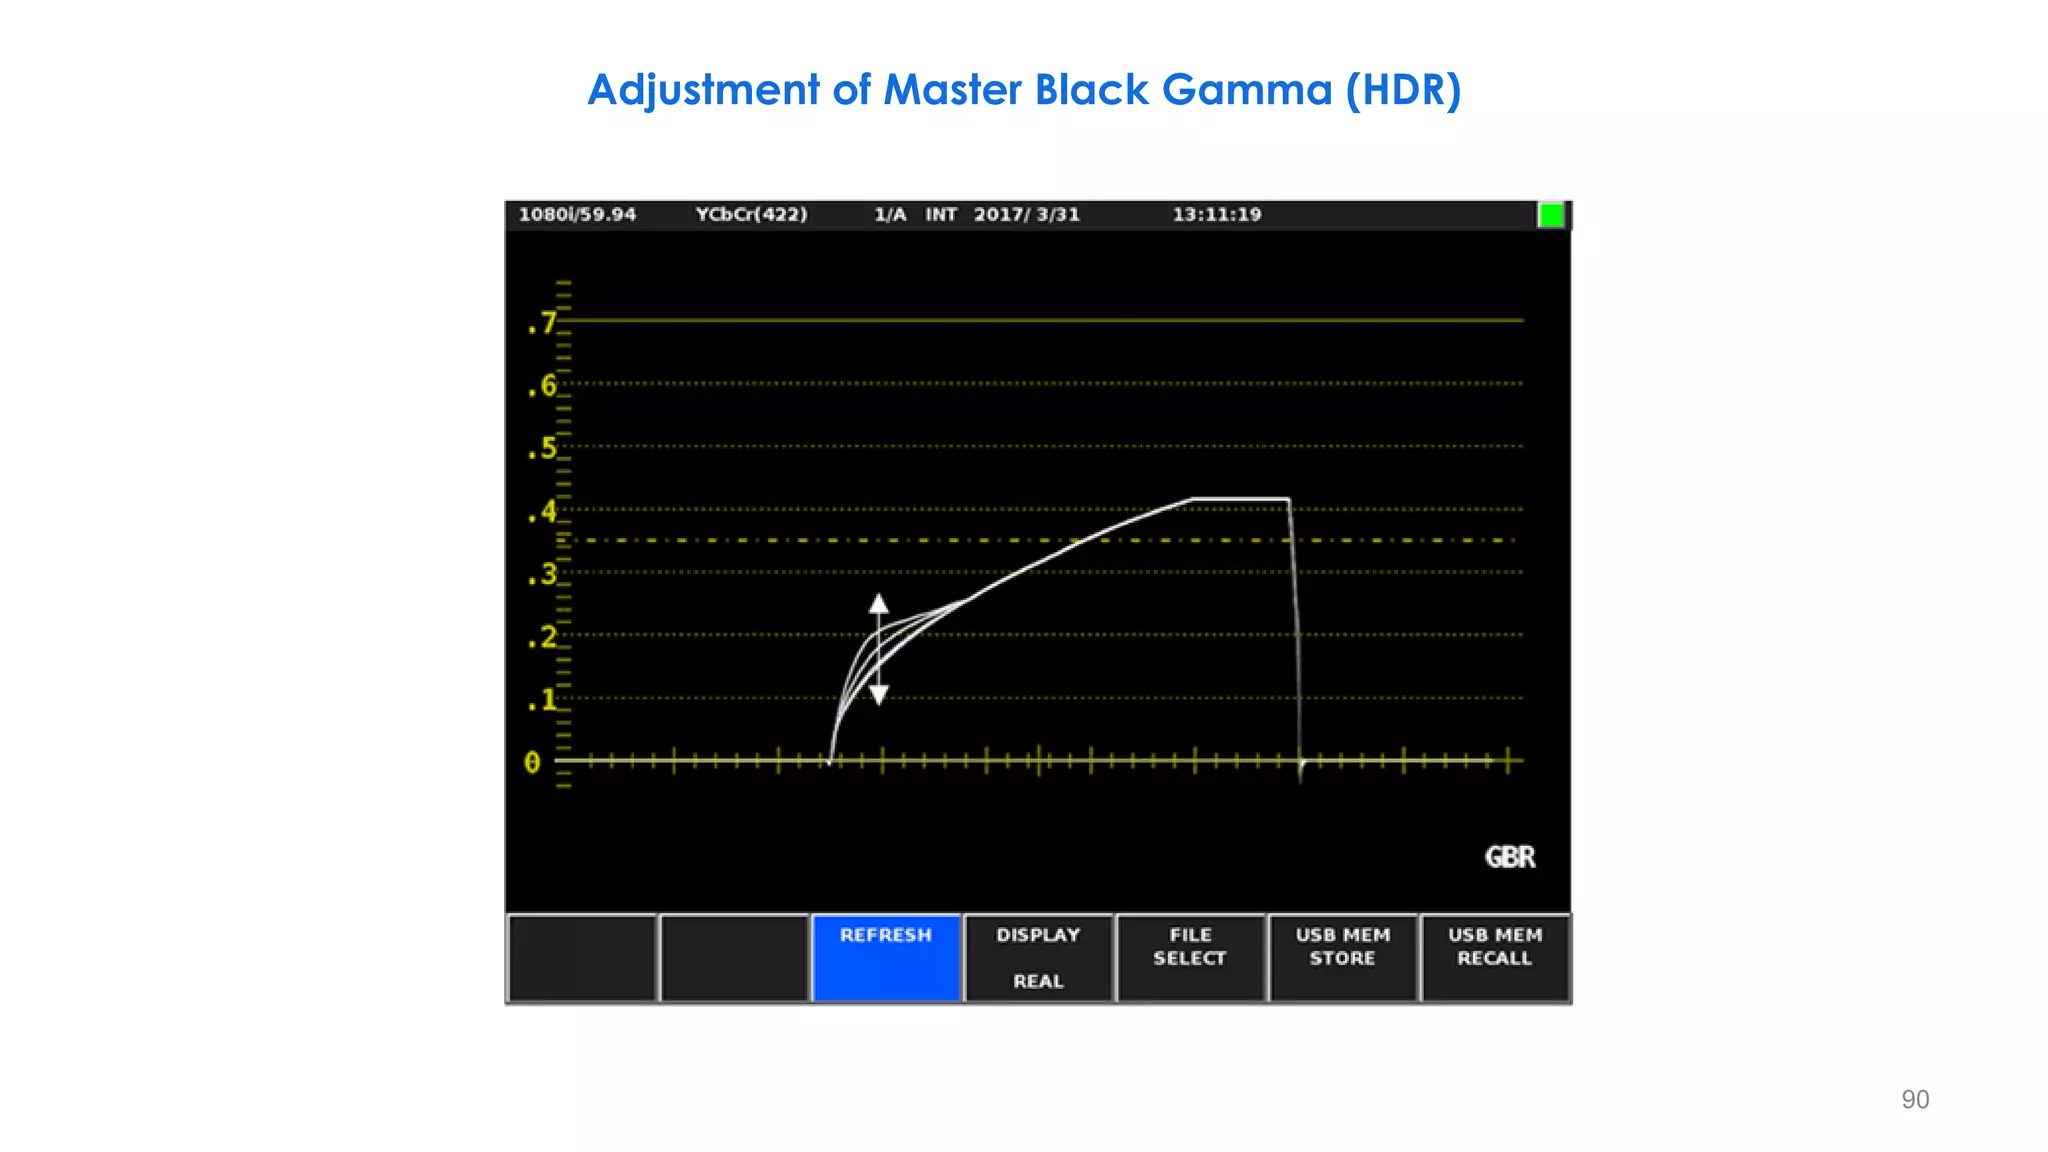
Gamma, CRT Characteristic
− Plots of the gamma
equation 𝑠 = 𝑐. 𝑟𝛾
for
various values of g (c =
1 in all cases).
− Each curve was scaled
independently so that
all curves would fit in
the same graph.
− Our interest here is on
the shapes of the
curves, not on their
relative values. 0 1
1
41](https://image.slidesharecdn.com/hdrandwcgprinciplespart1-210615182237/75/HDR-and-WCG-Principles-Part-1-41-2048.jpg)
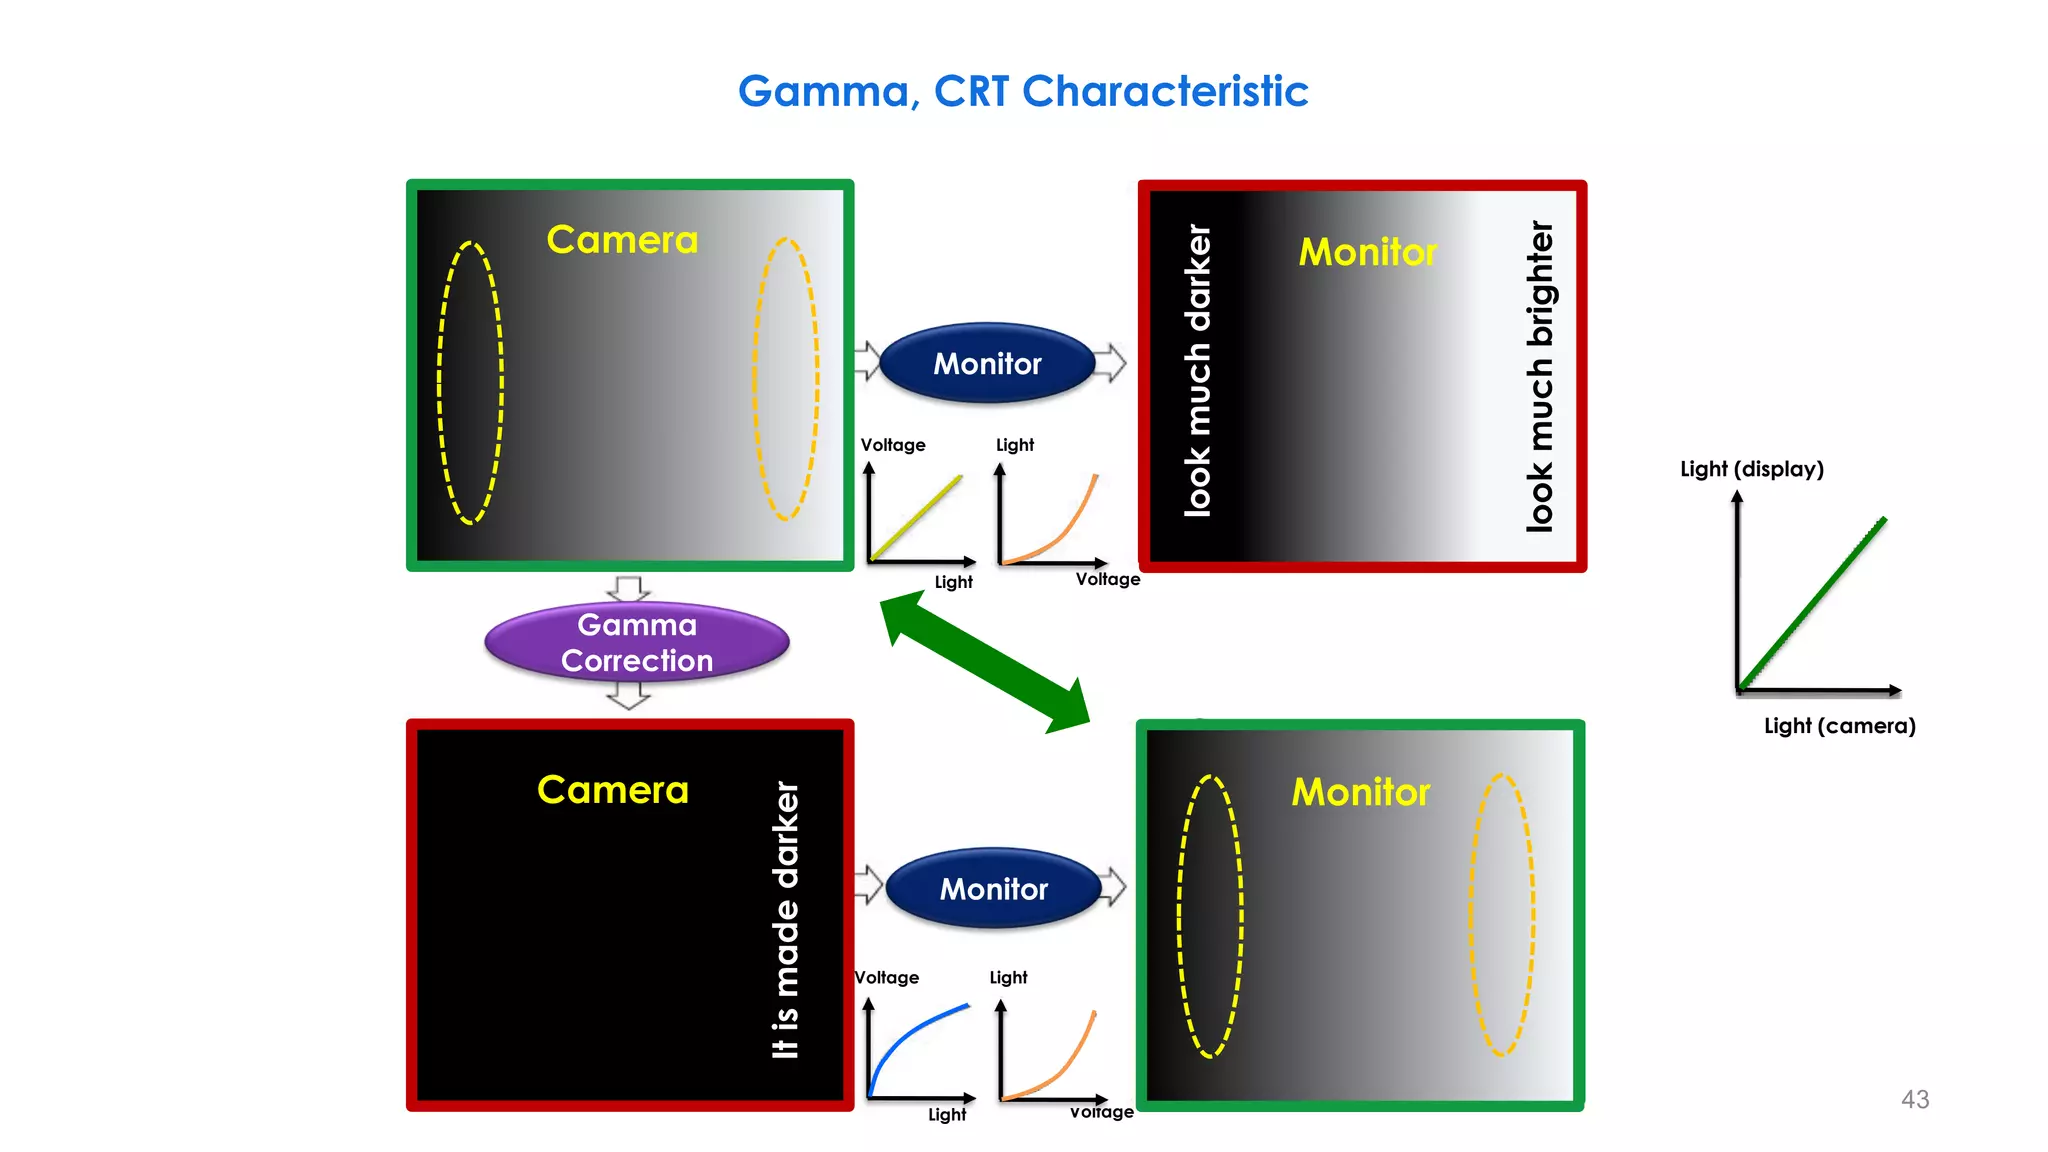
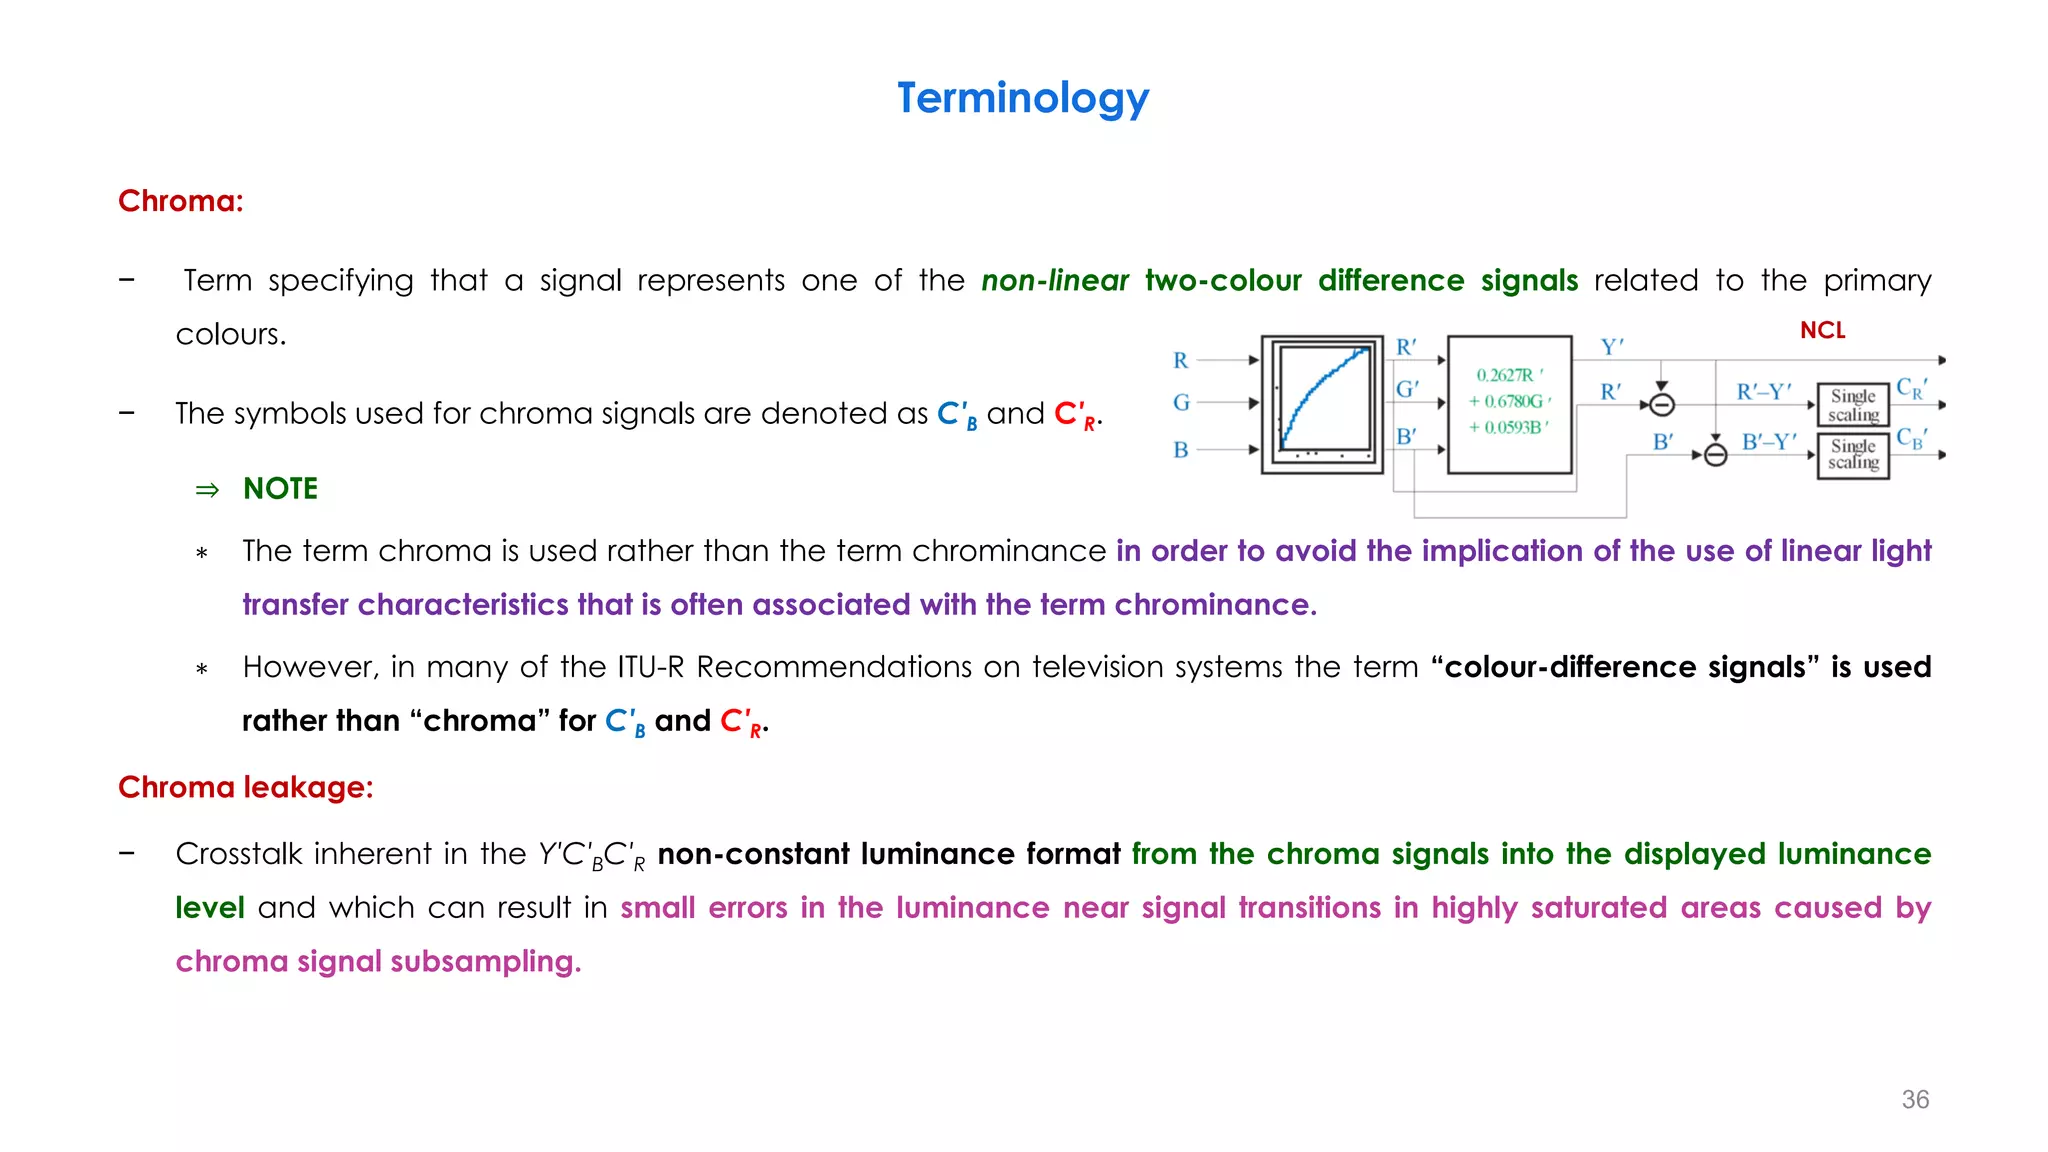
![CRT
Control
Grid
Light Input
Input voltage
Output light
Camera
Output
Light
Output voltage
Input light
Input light
Output light
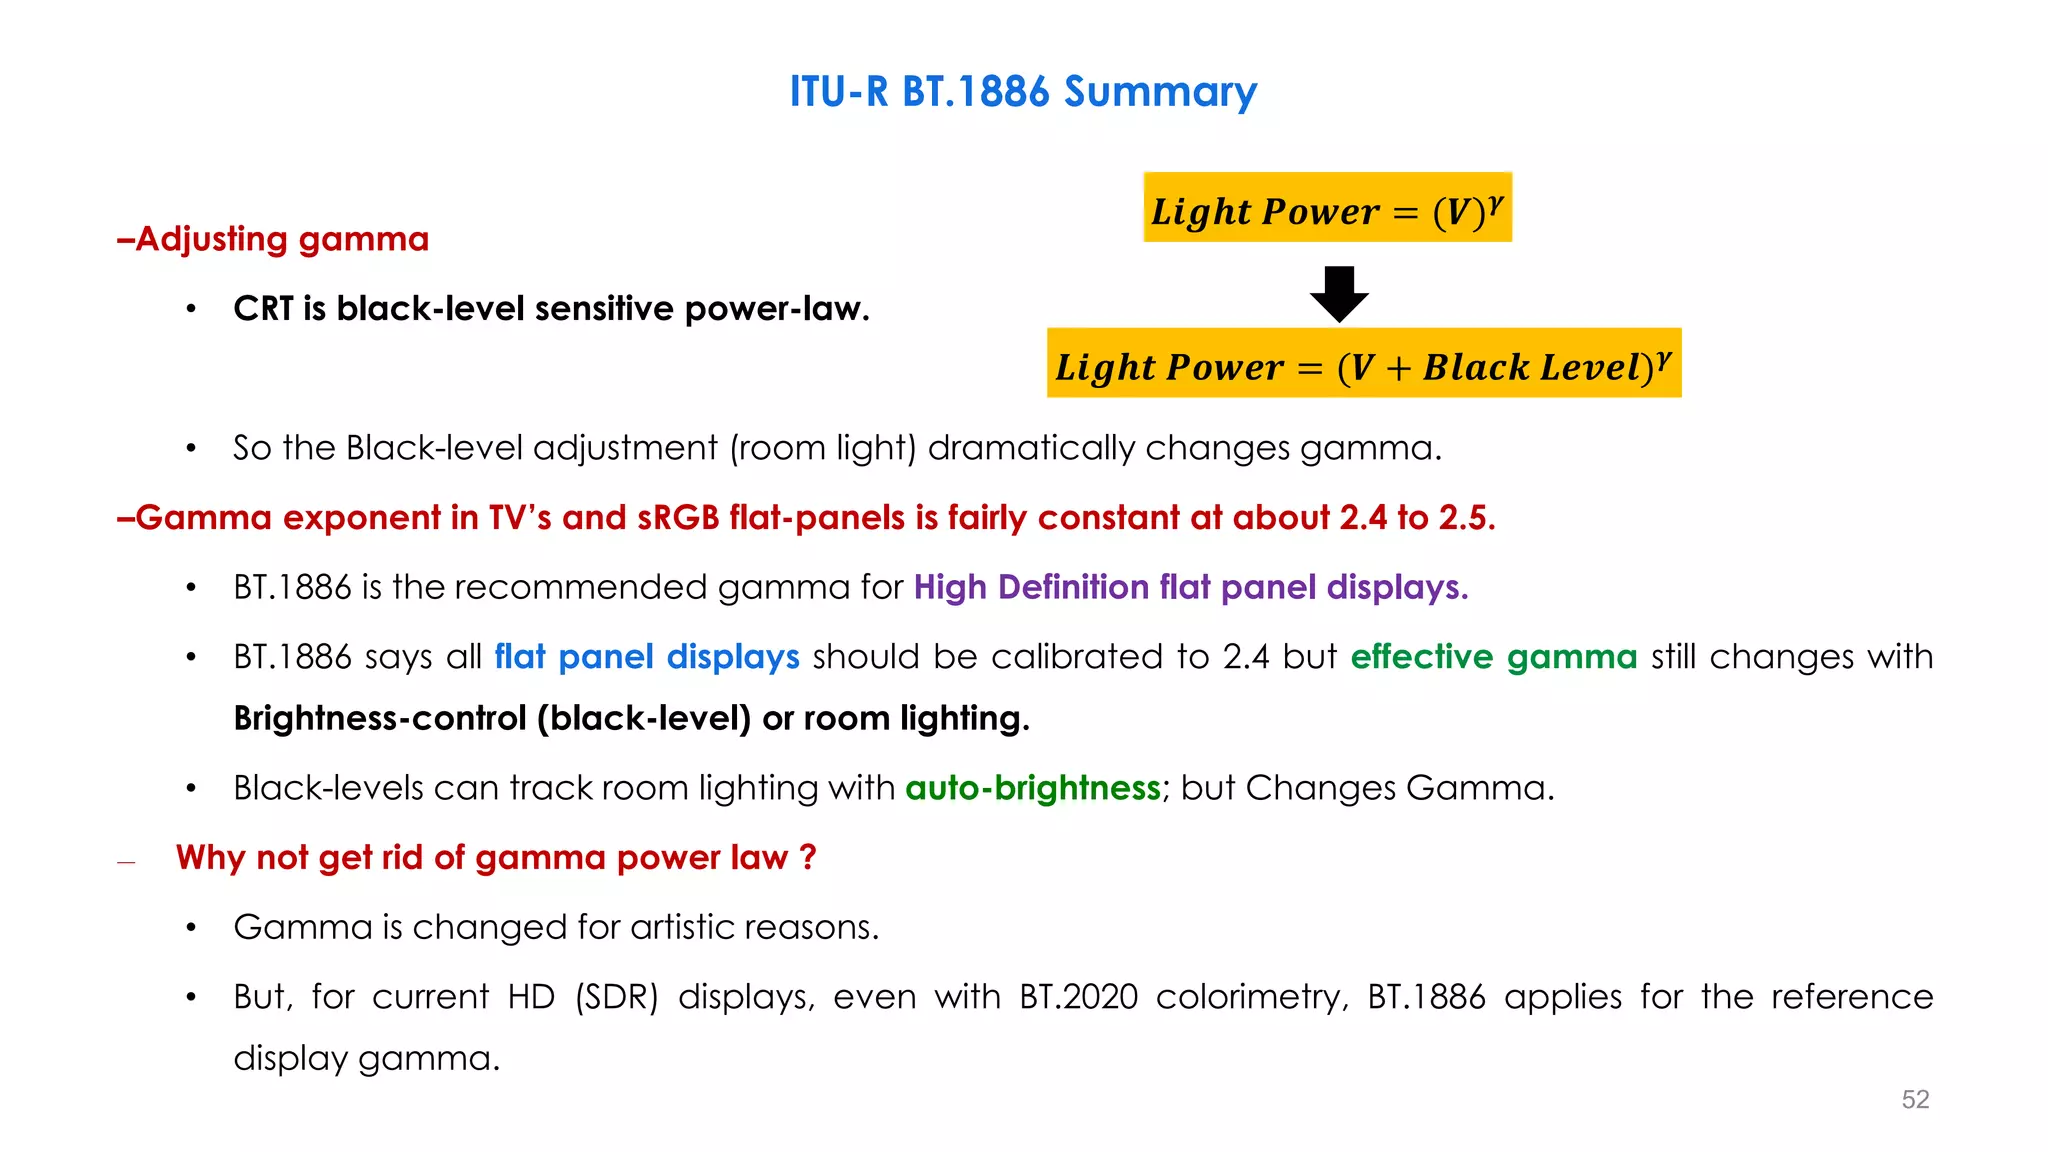
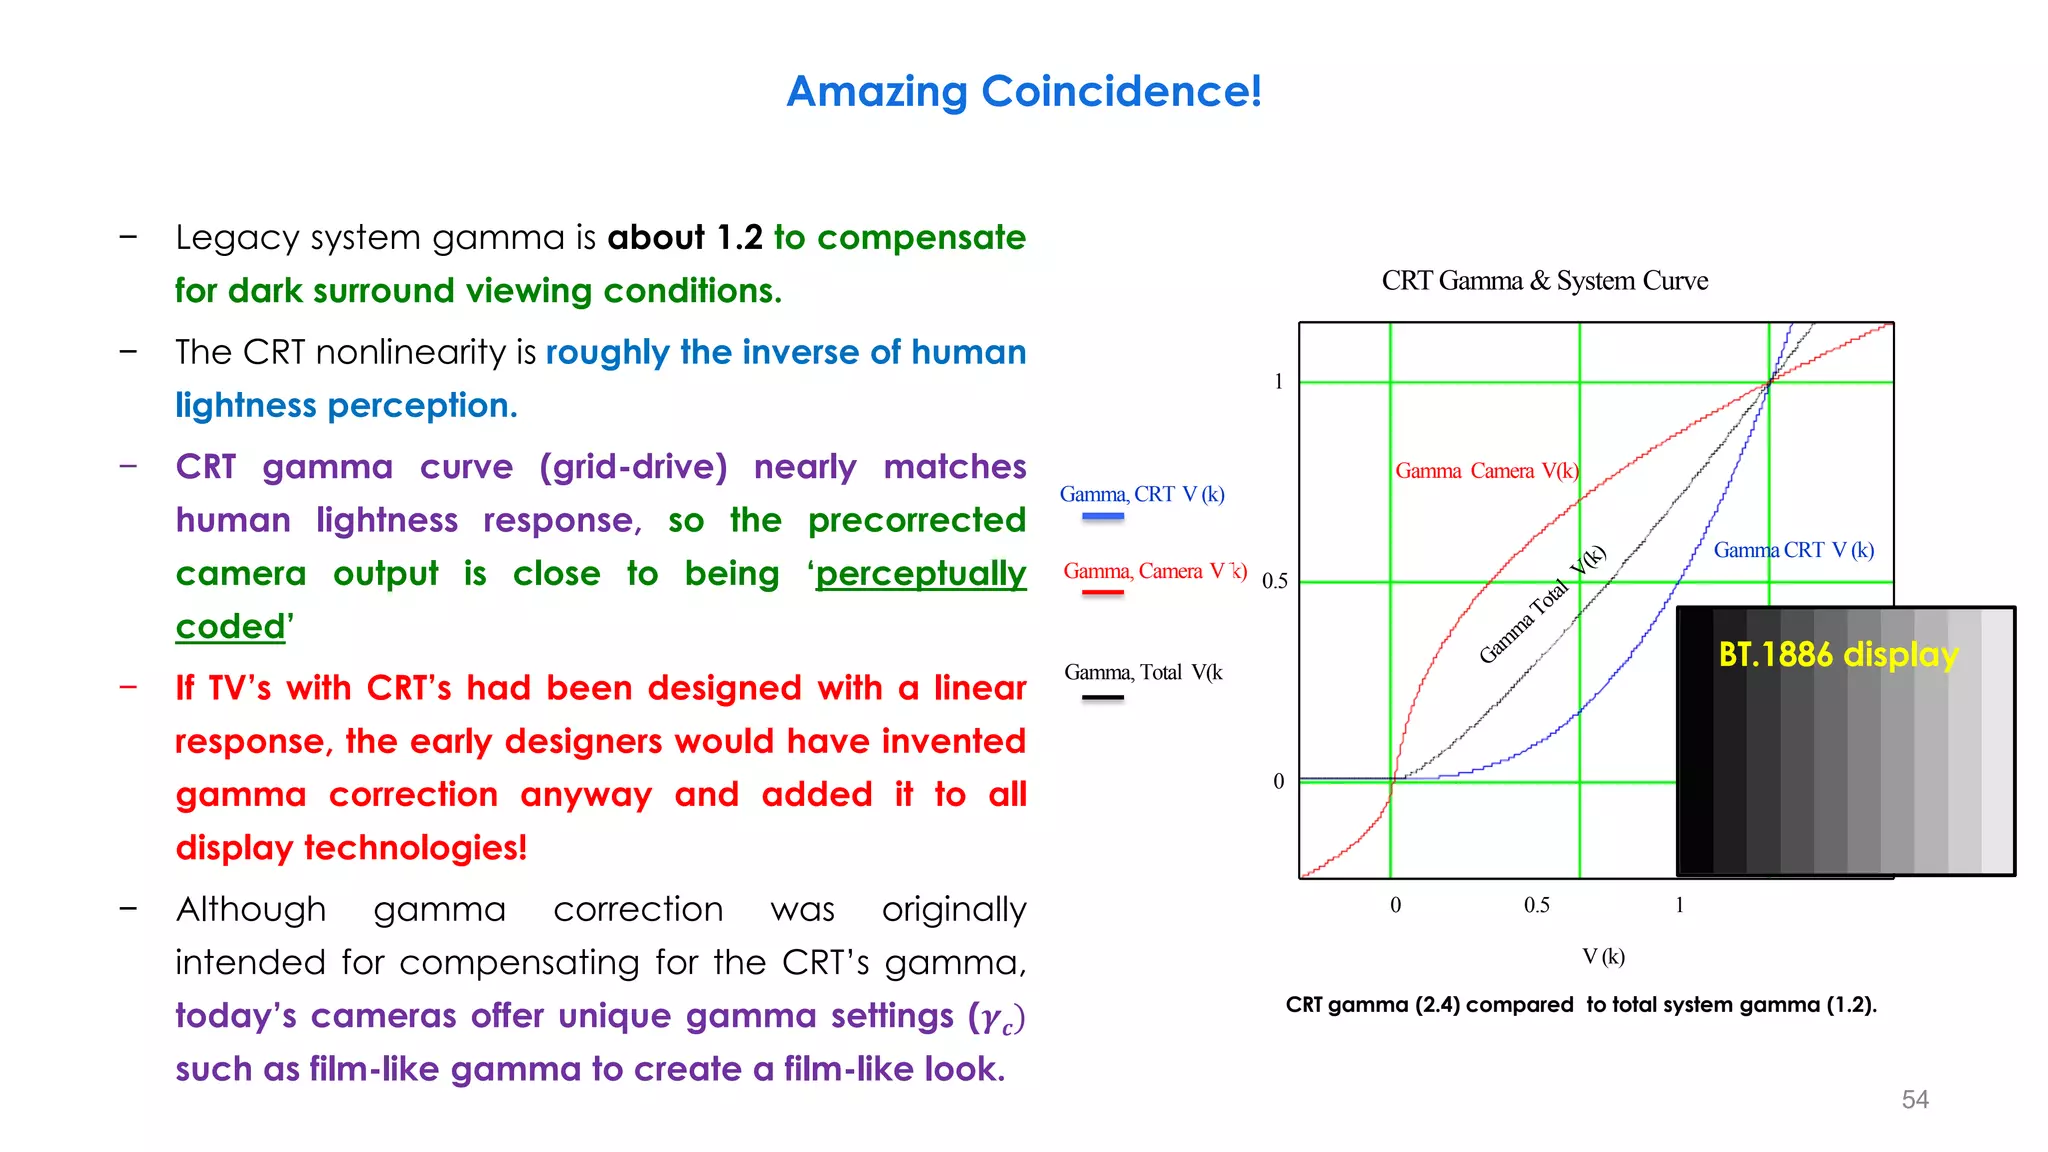
Legacy system-gamma (cascaded system) is about 1.2 to
compensate for dark surround viewing conditions (e.x. 𝜸𝒎 ≈ 𝟐. 𝟒).
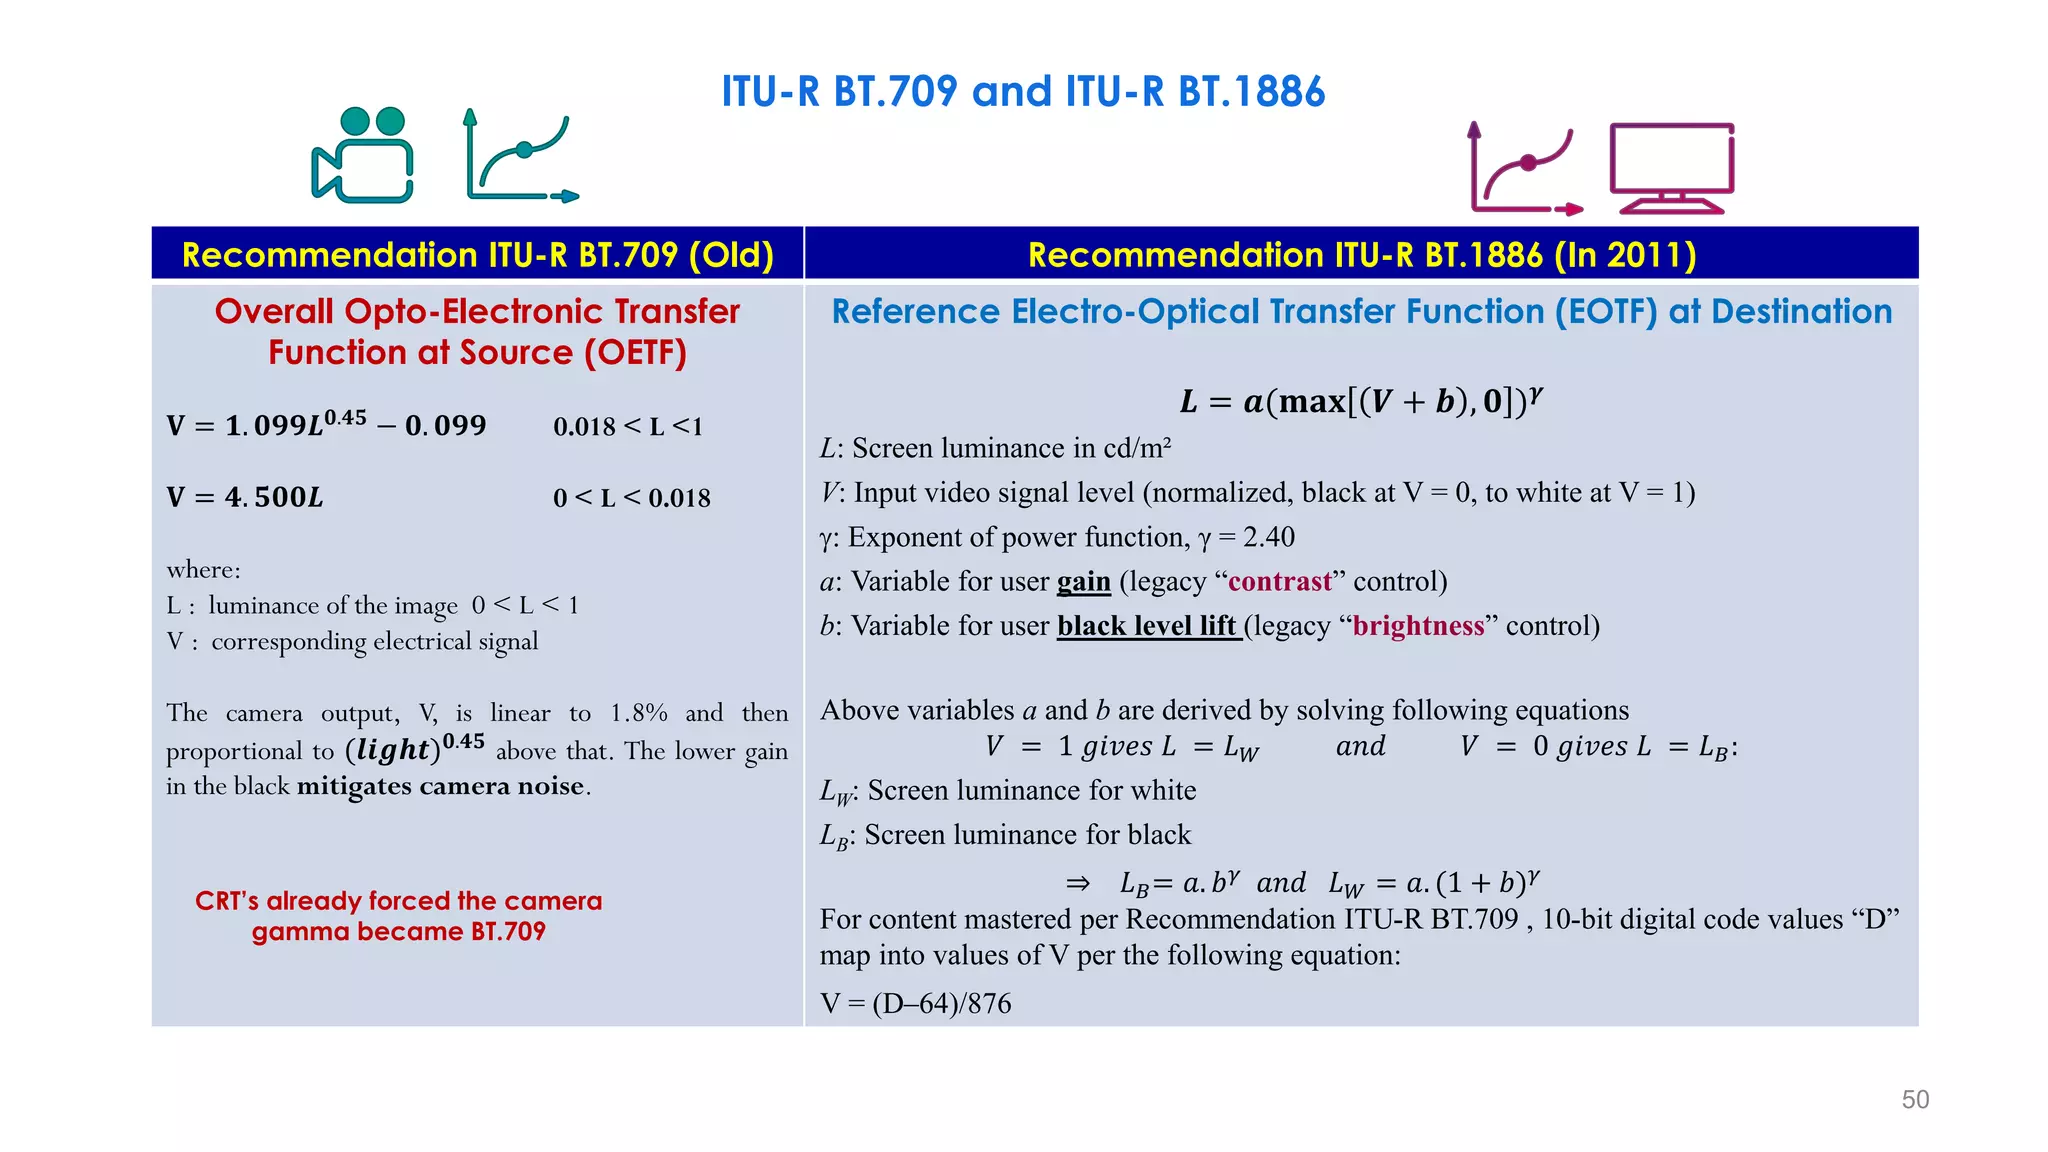
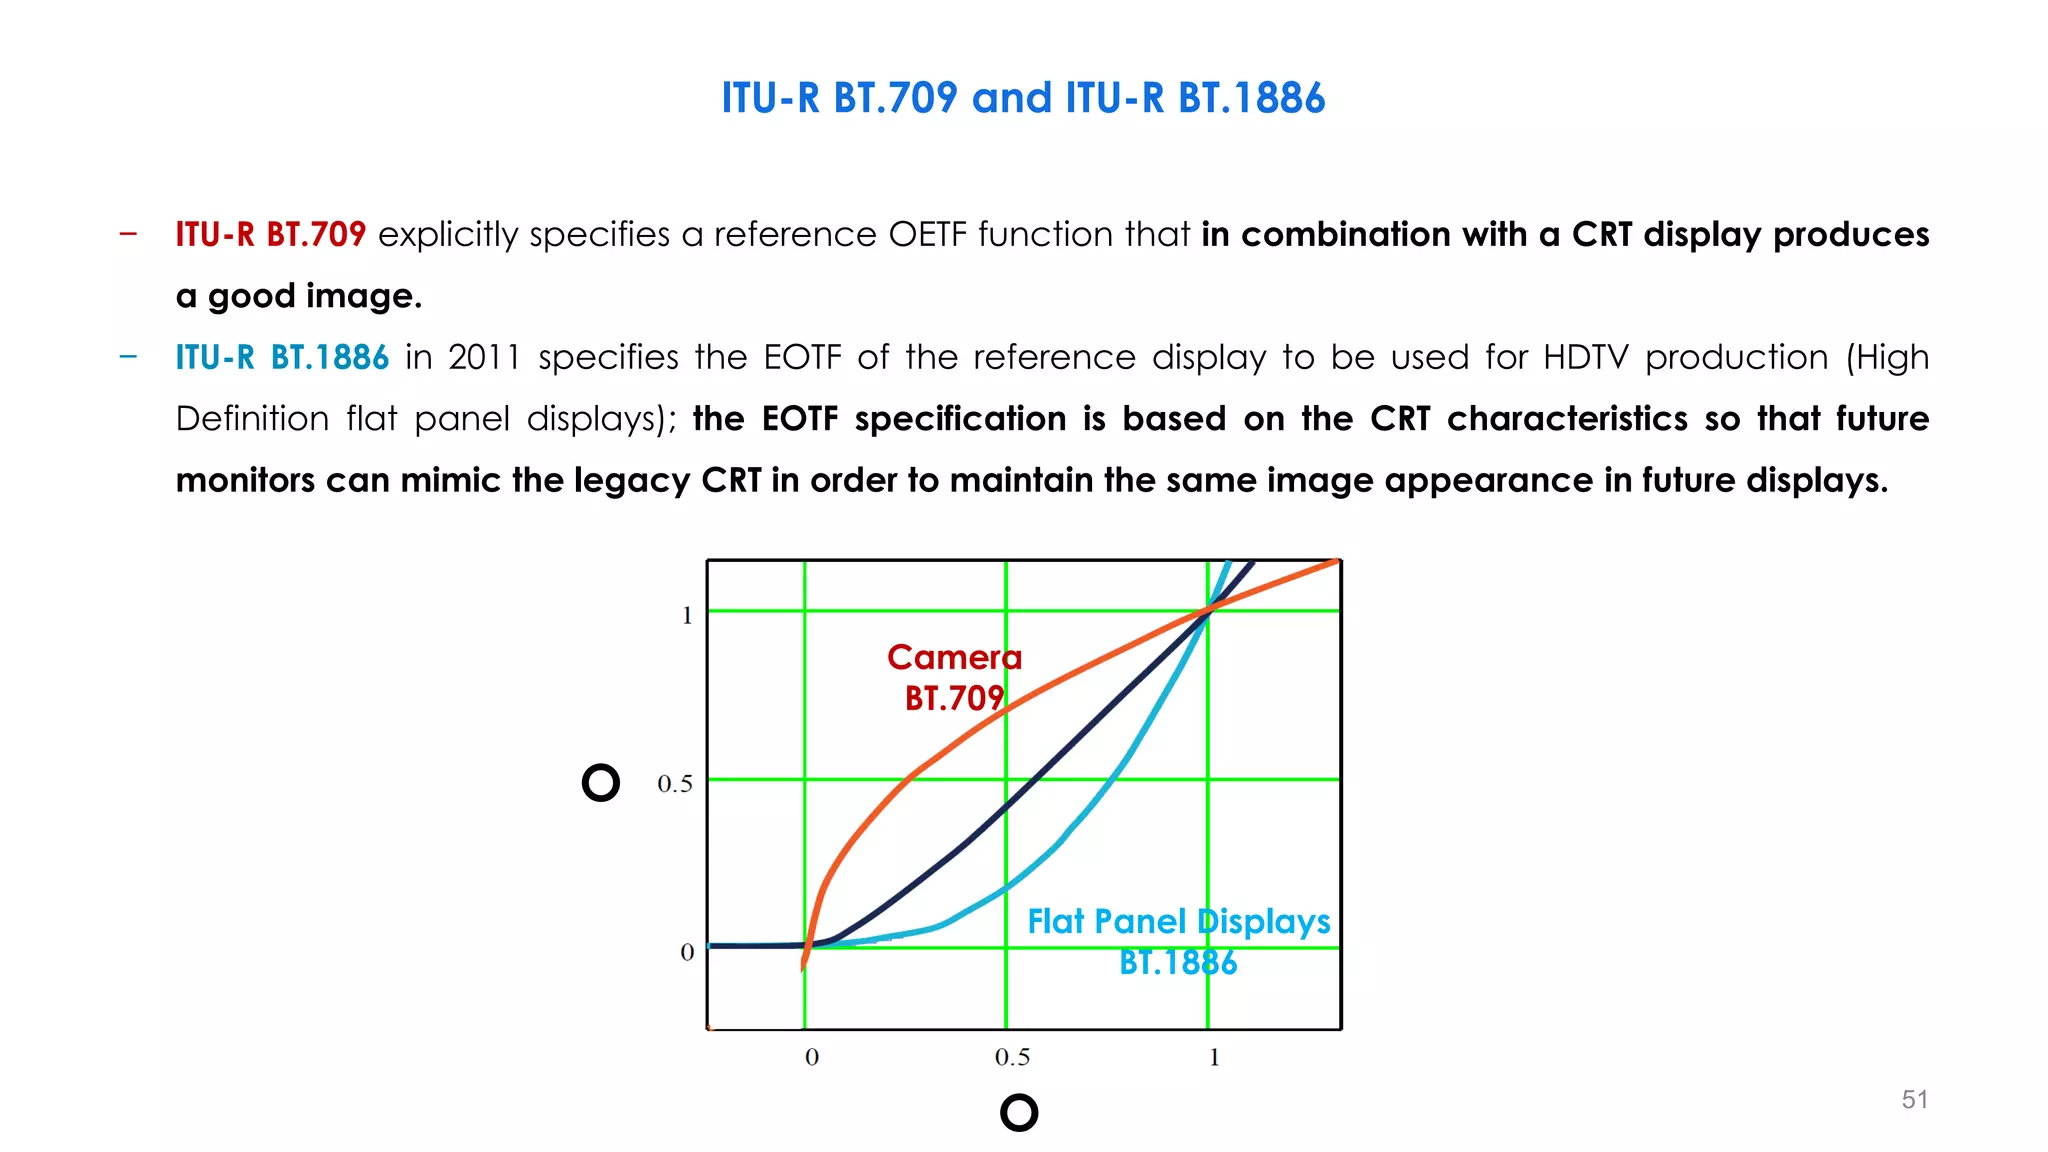
ITU-R BT.709 OETF
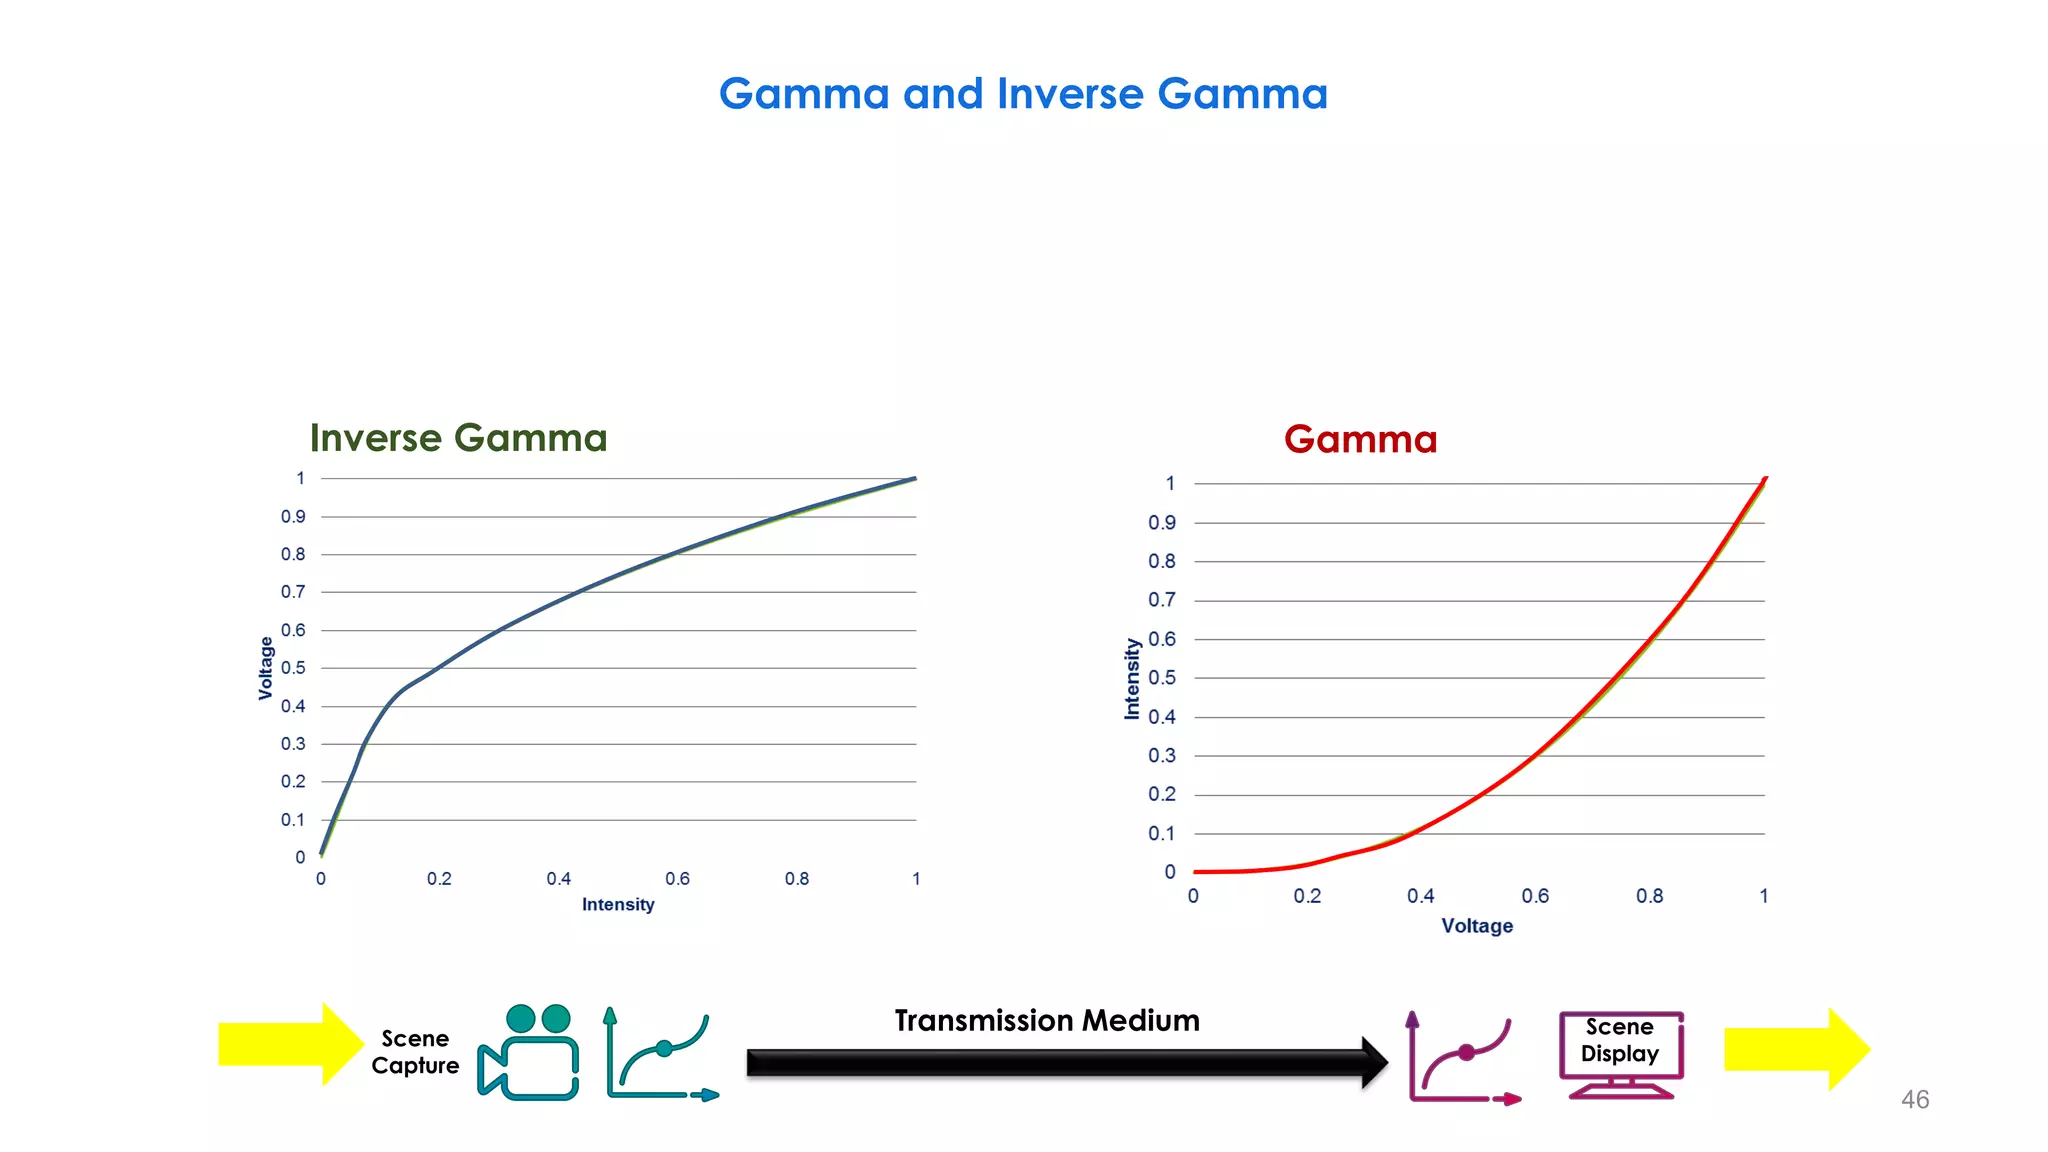
CRT Gamma
𝐿 = 𝑉𝛾𝑚
𝛾𝑚 = 2.22
Camera Gamma
𝑉 = 𝐿𝛾𝑐
𝛾𝑐 = 0.45
𝜸𝒄𝜸𝒎 = 𝟏
Gamma, CRT Characteristic
[0:1]
[0:1]
45](https://image.slidesharecdn.com/hdrandwcgprinciplespart1-210615182237/75/HDR-and-WCG-Principles-Part-1-45-2048.jpg)
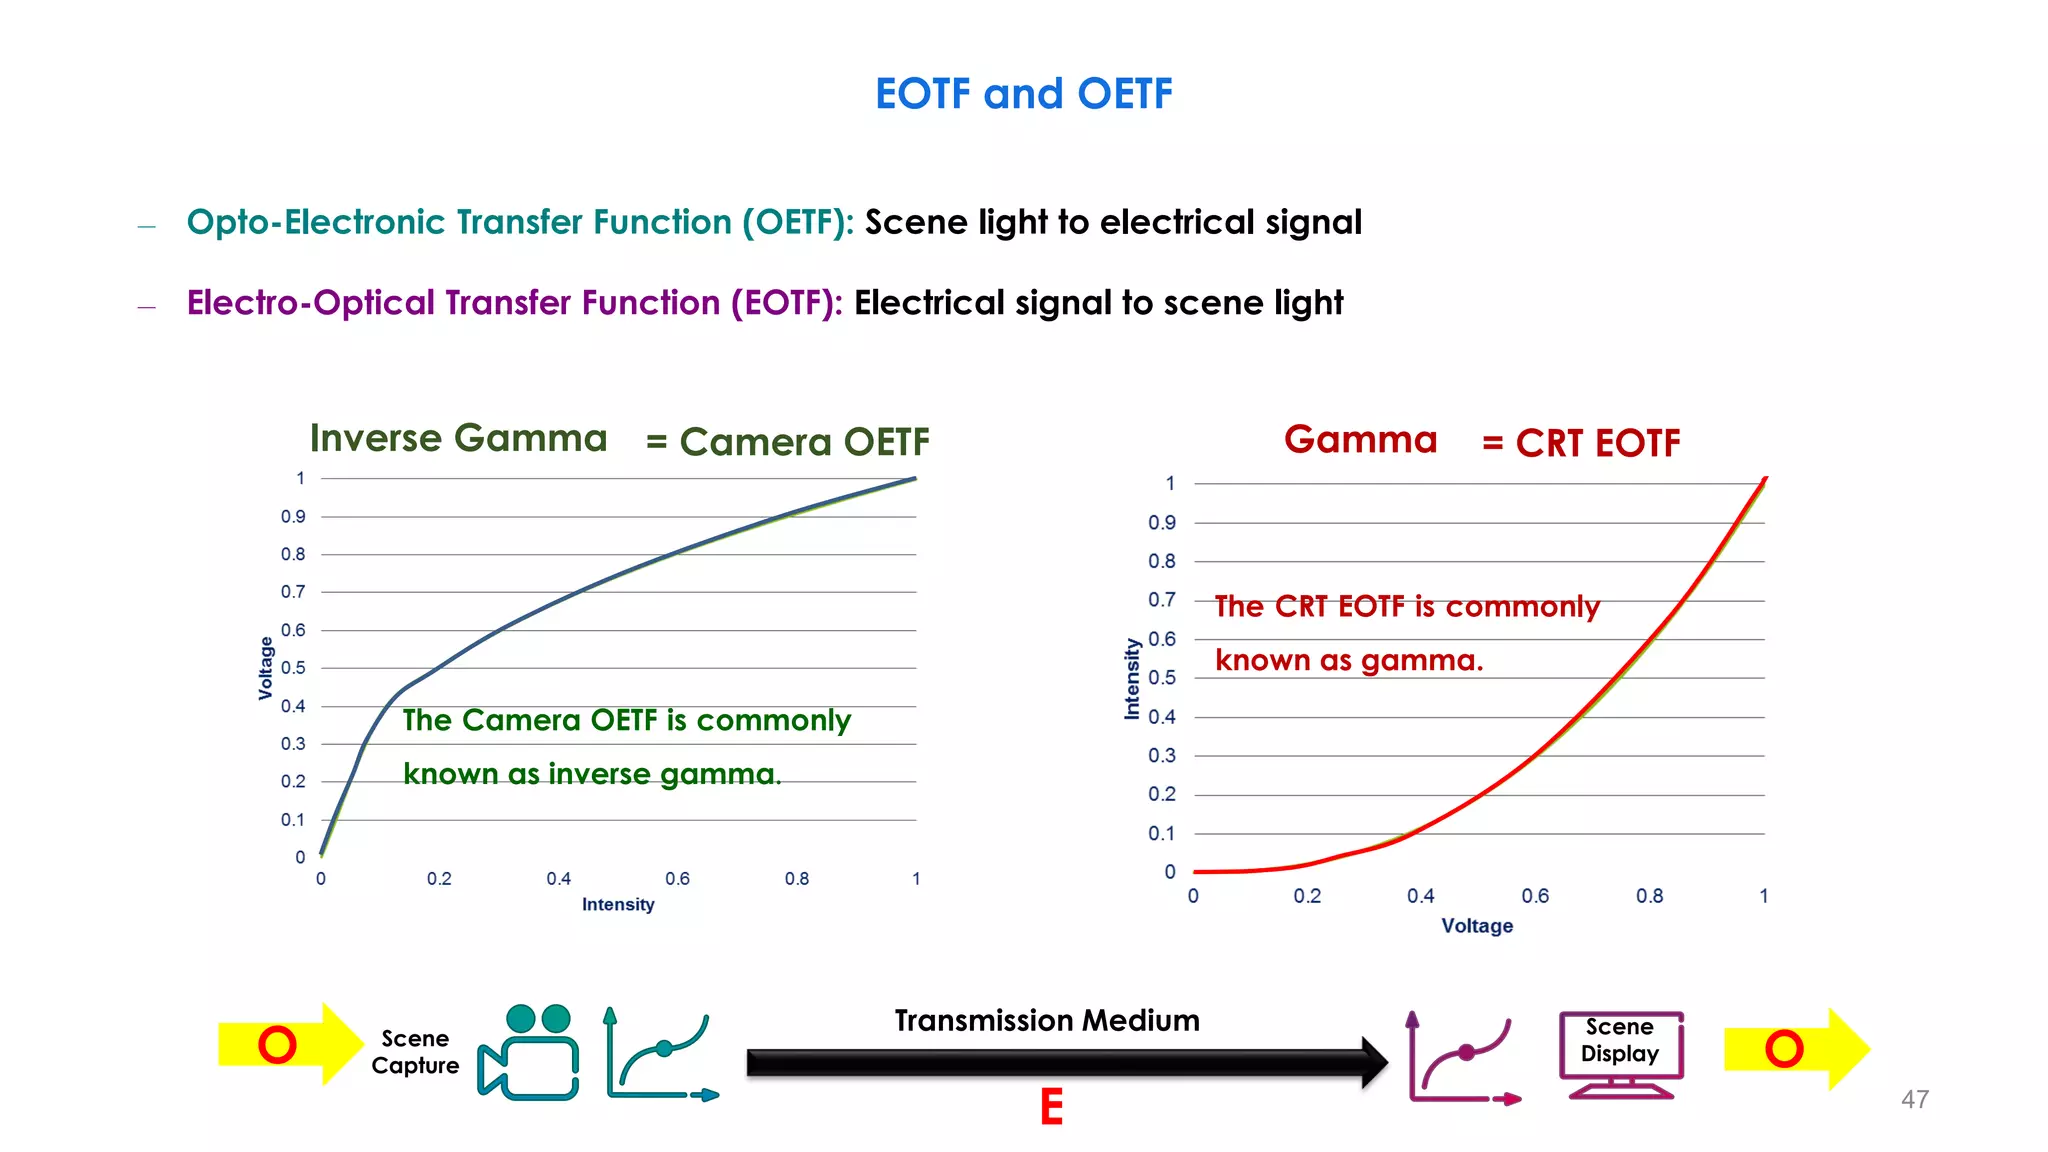
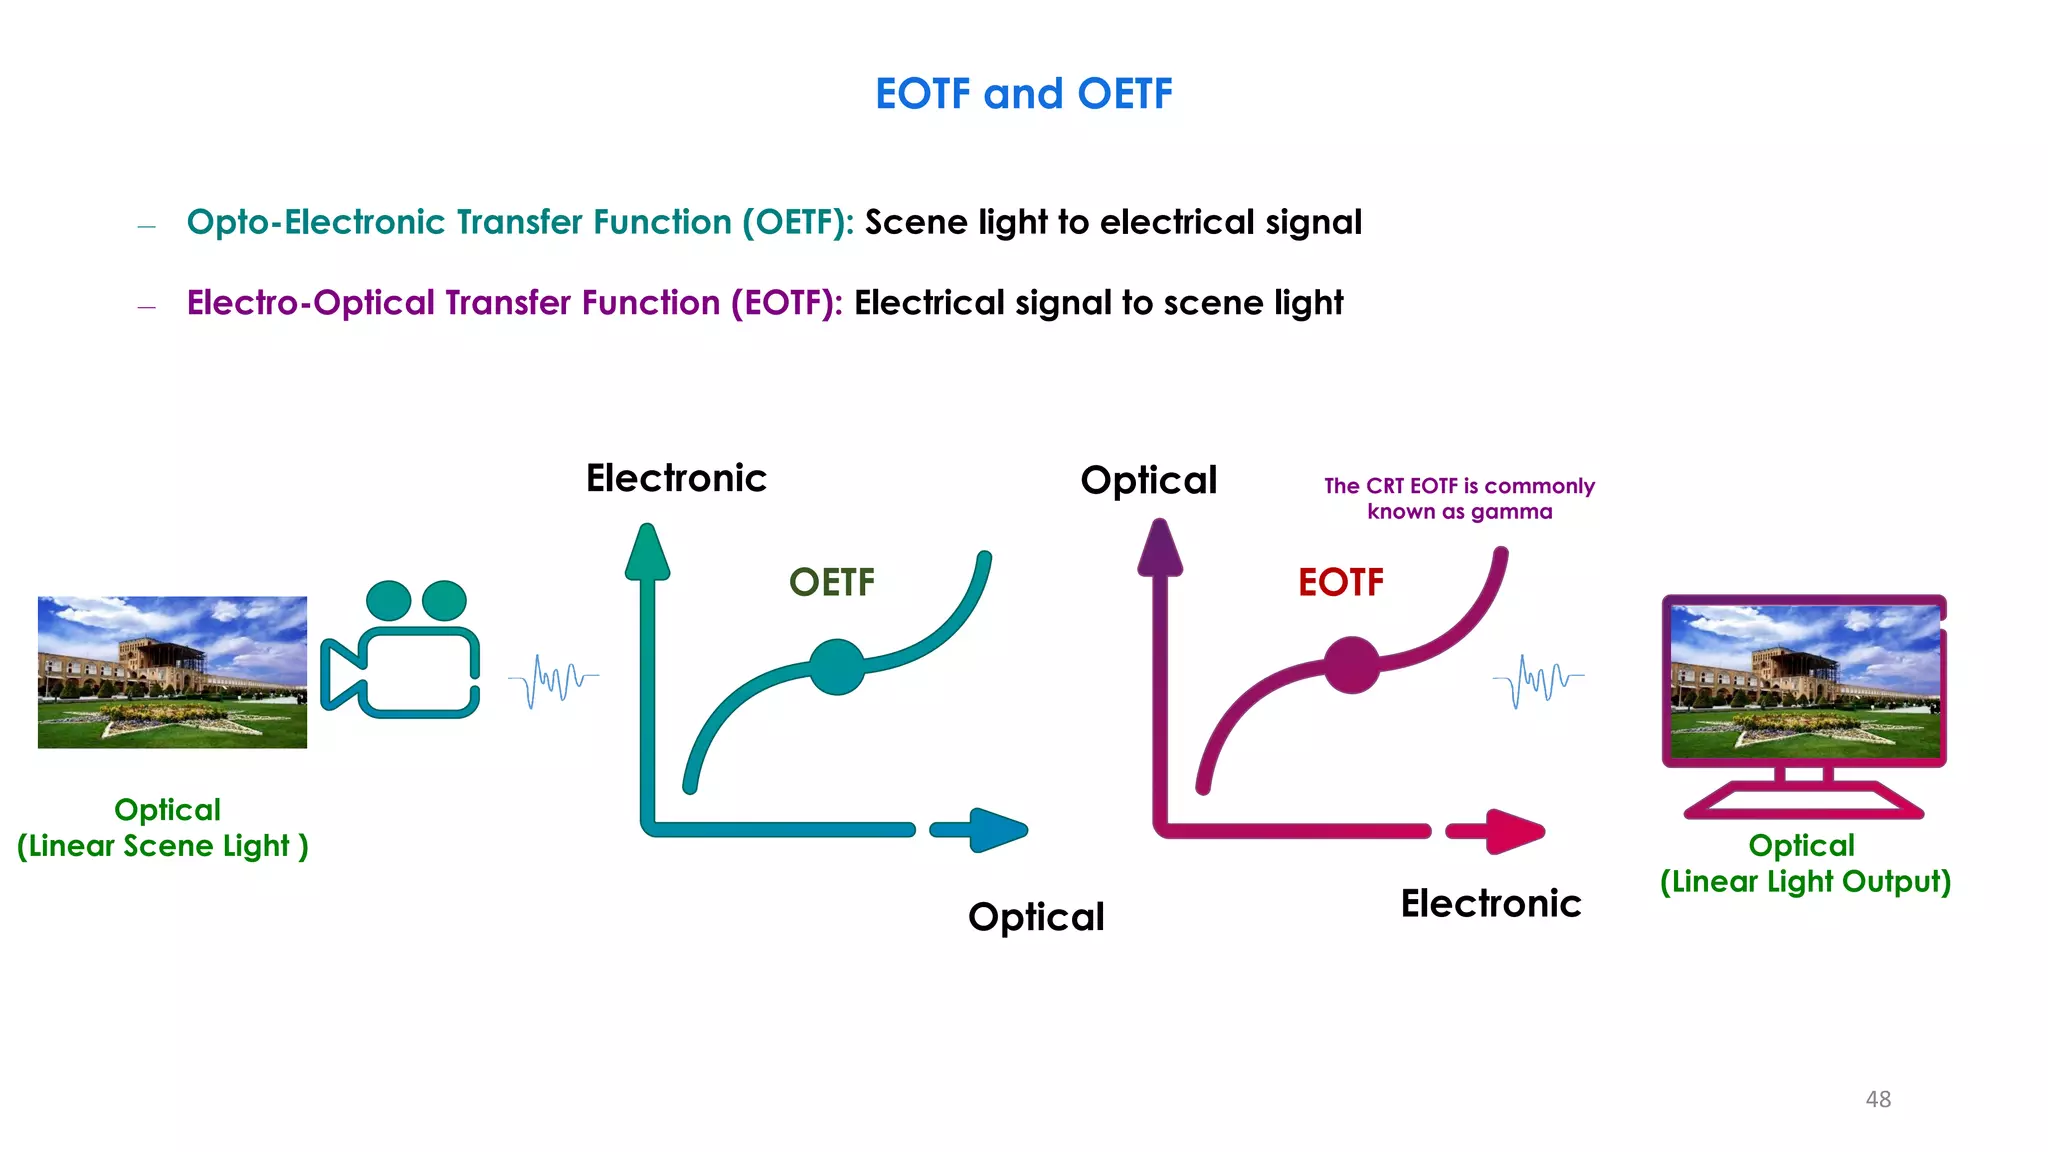
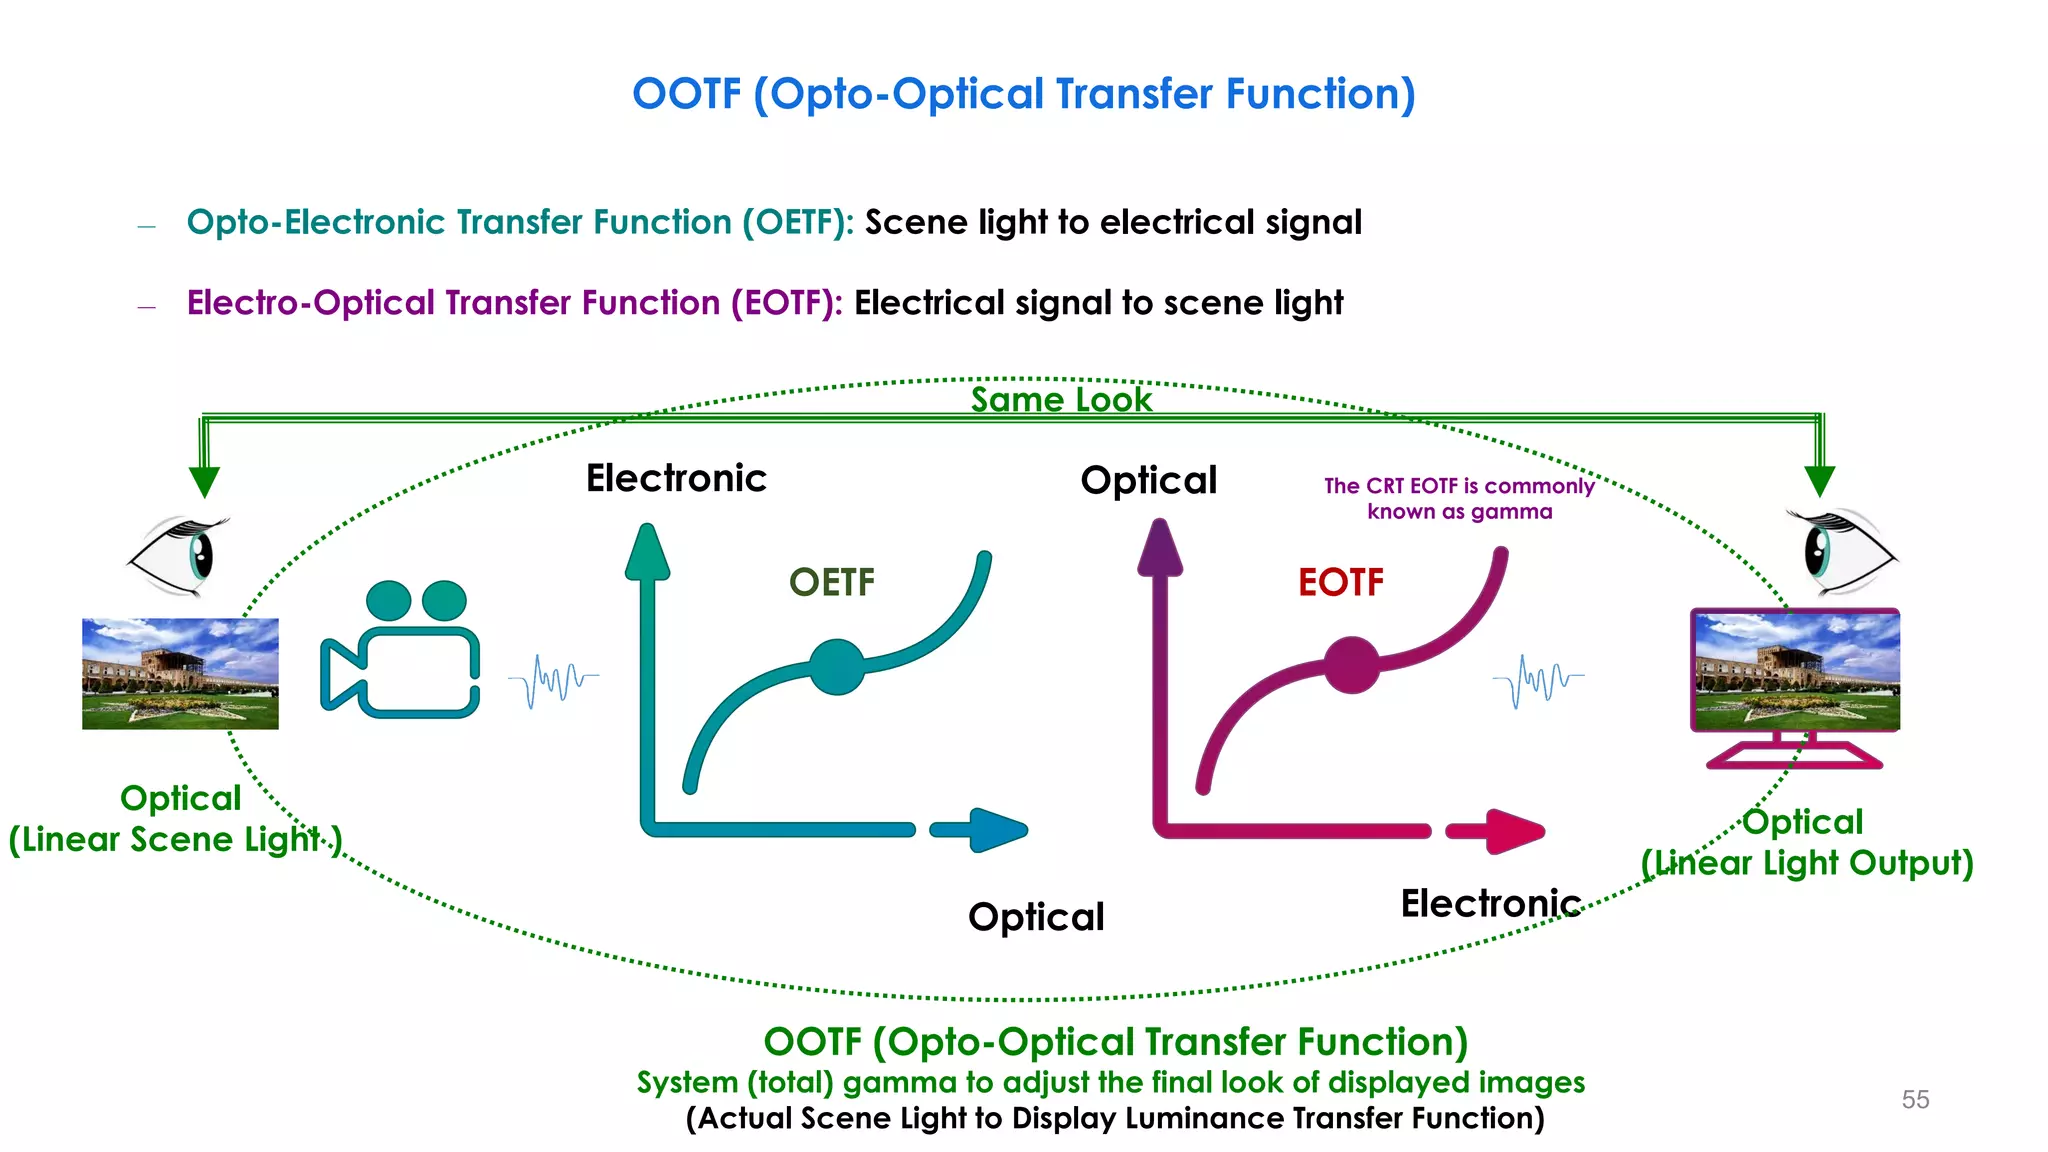
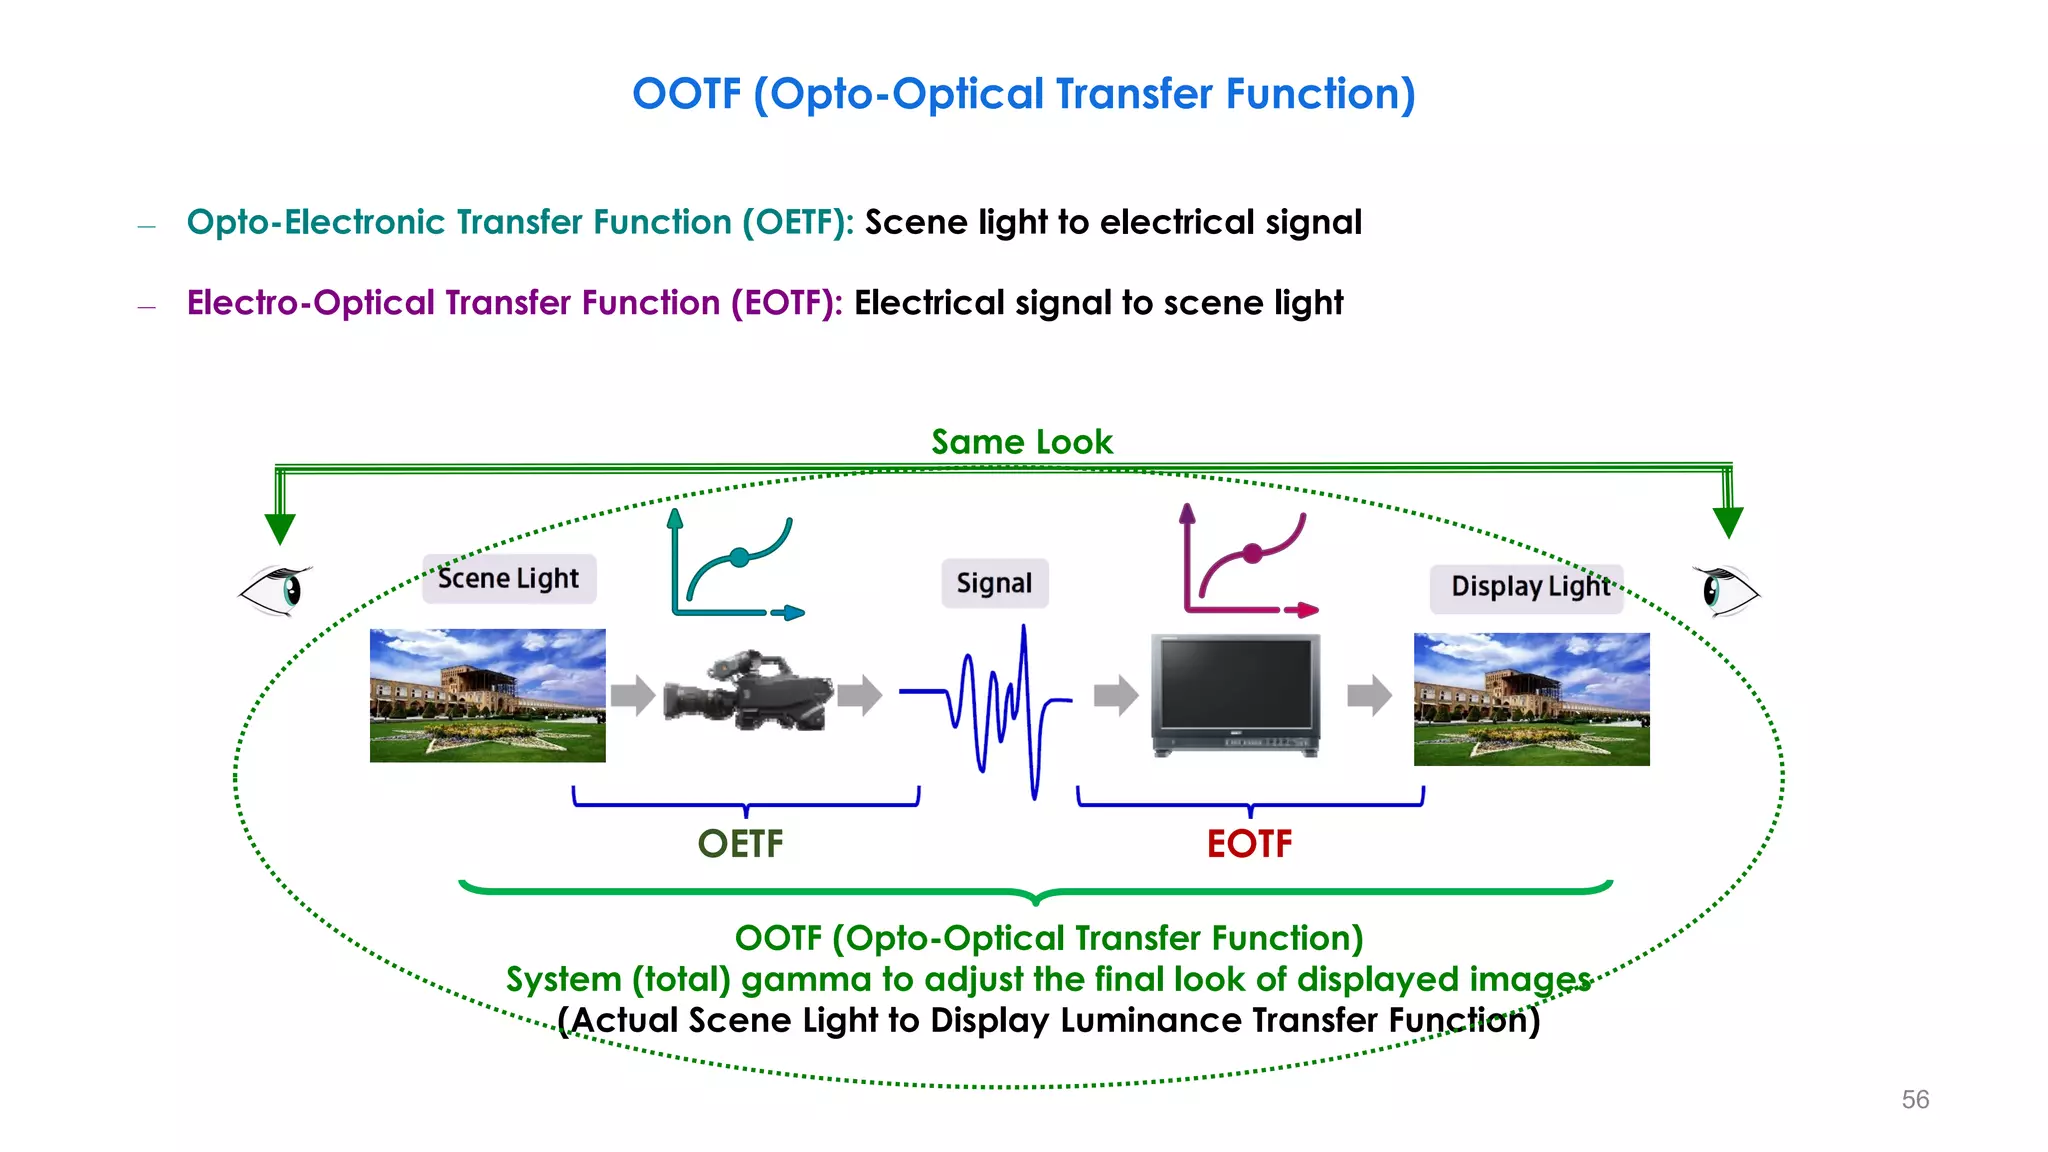
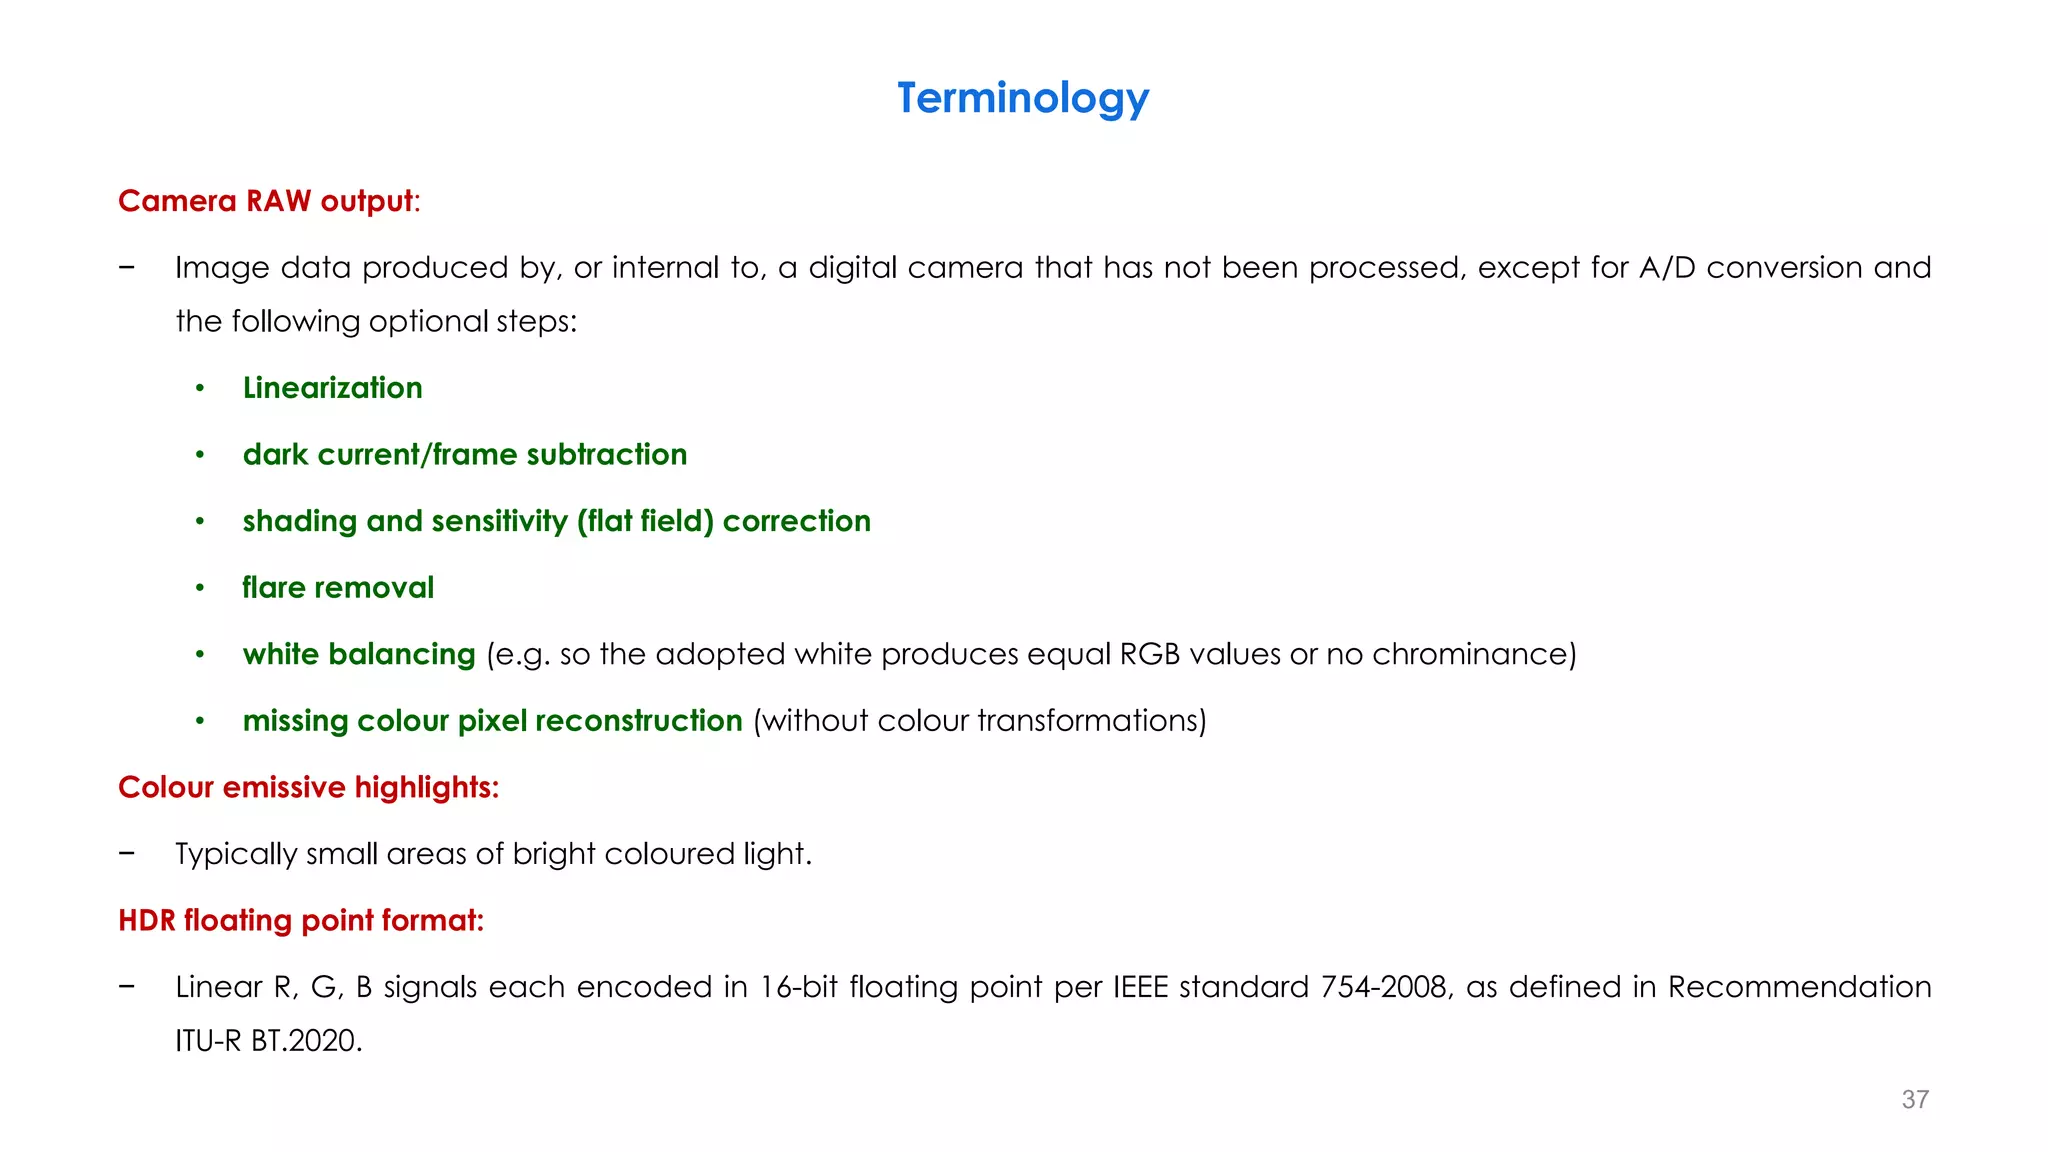
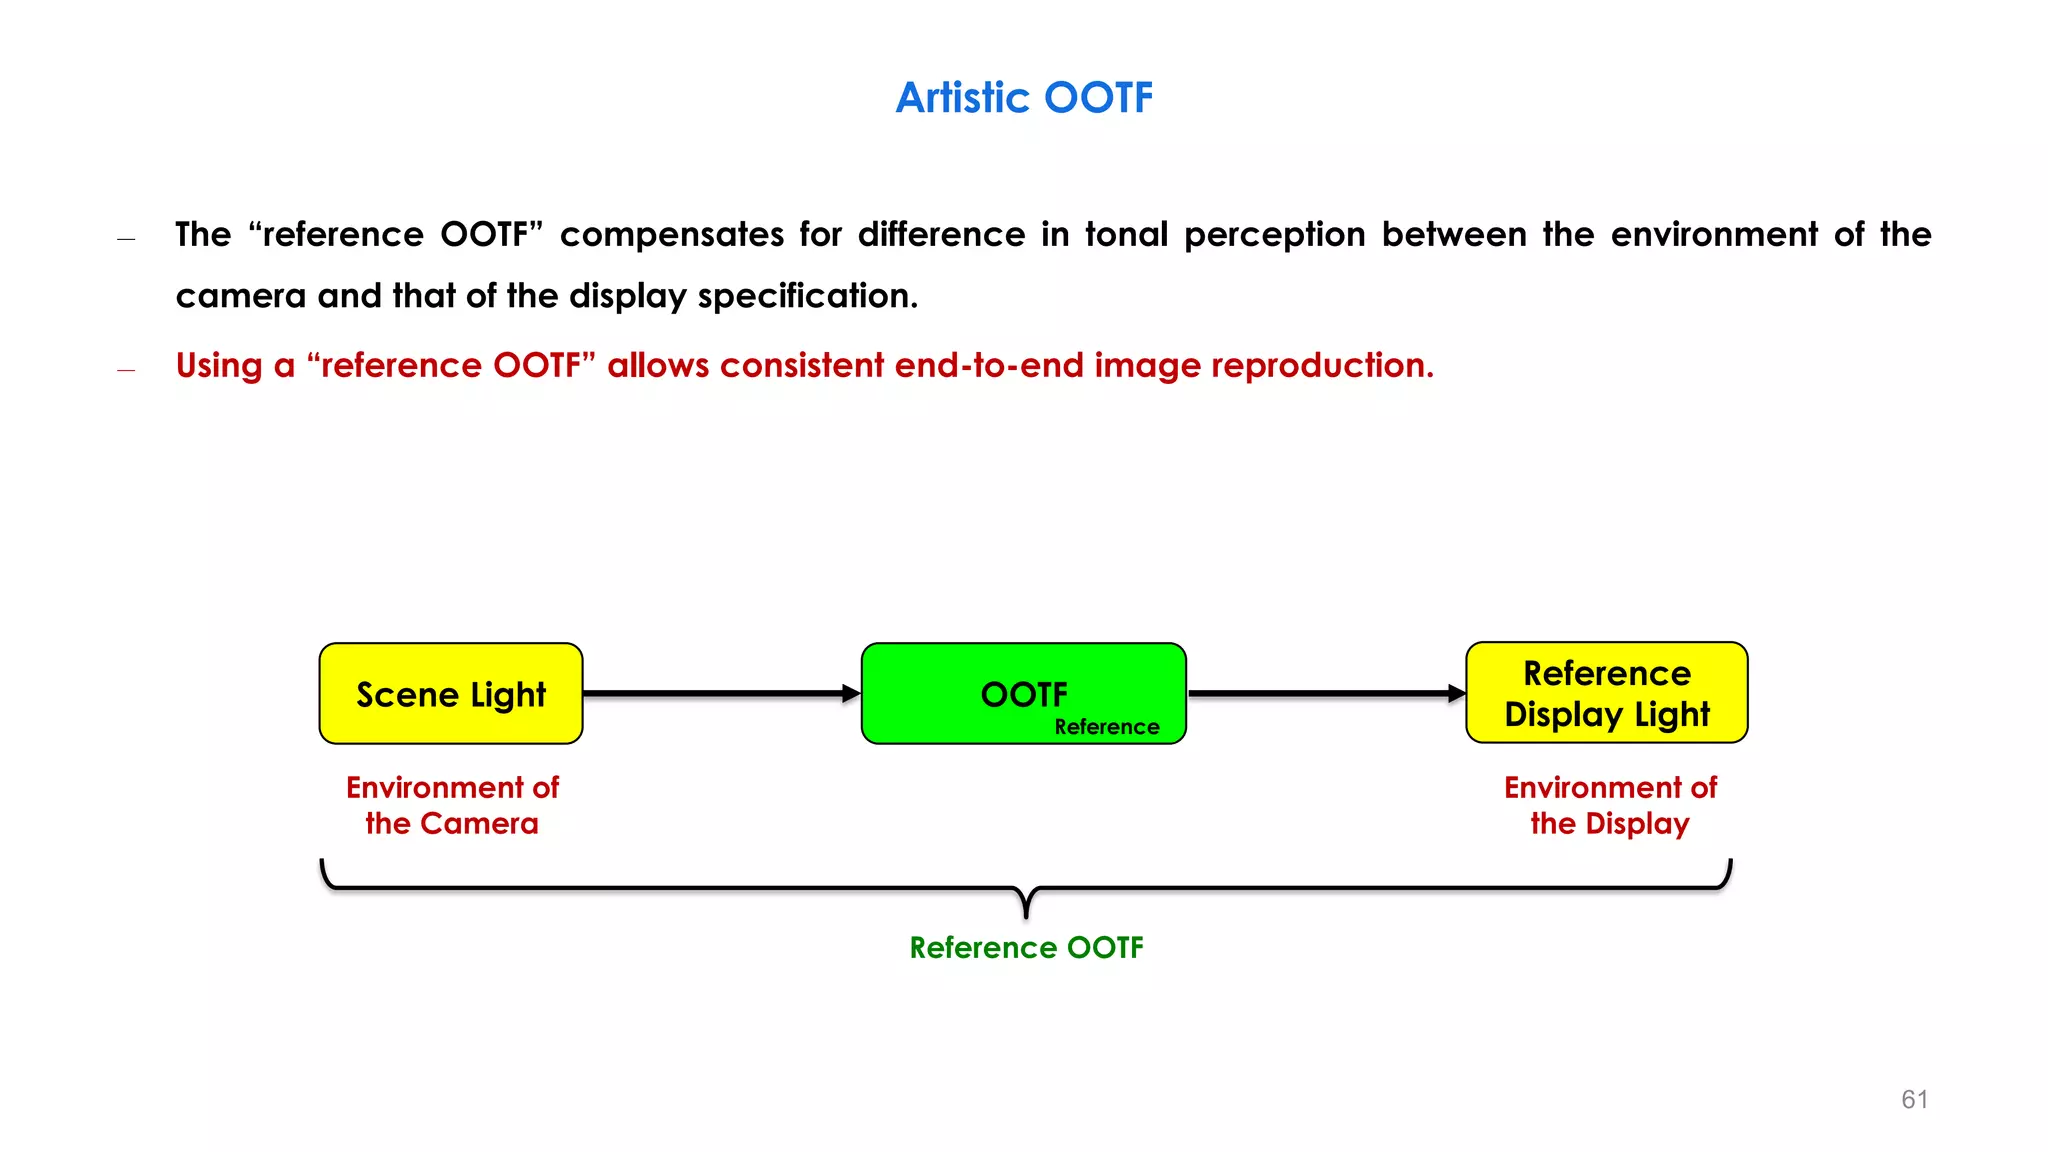
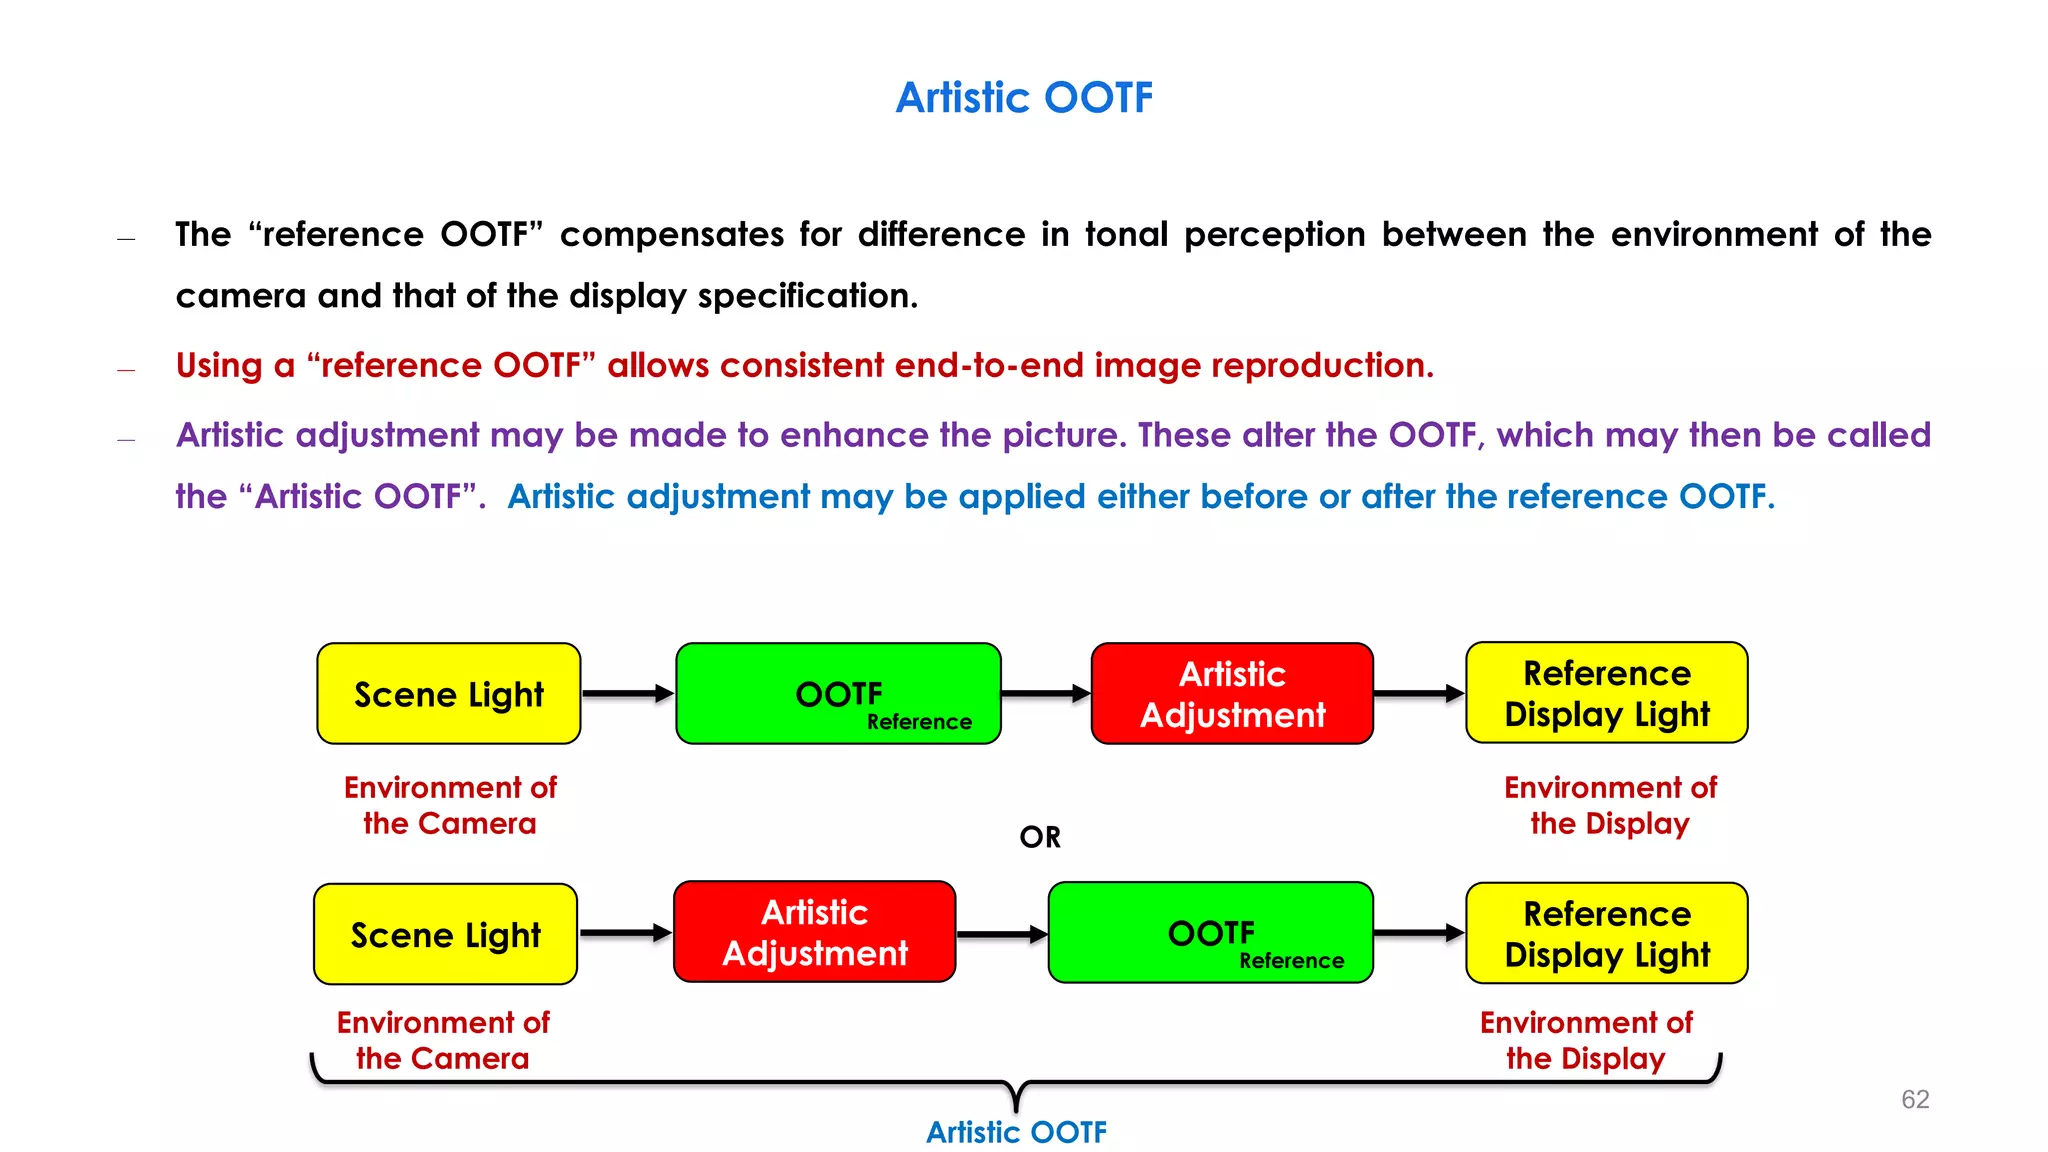
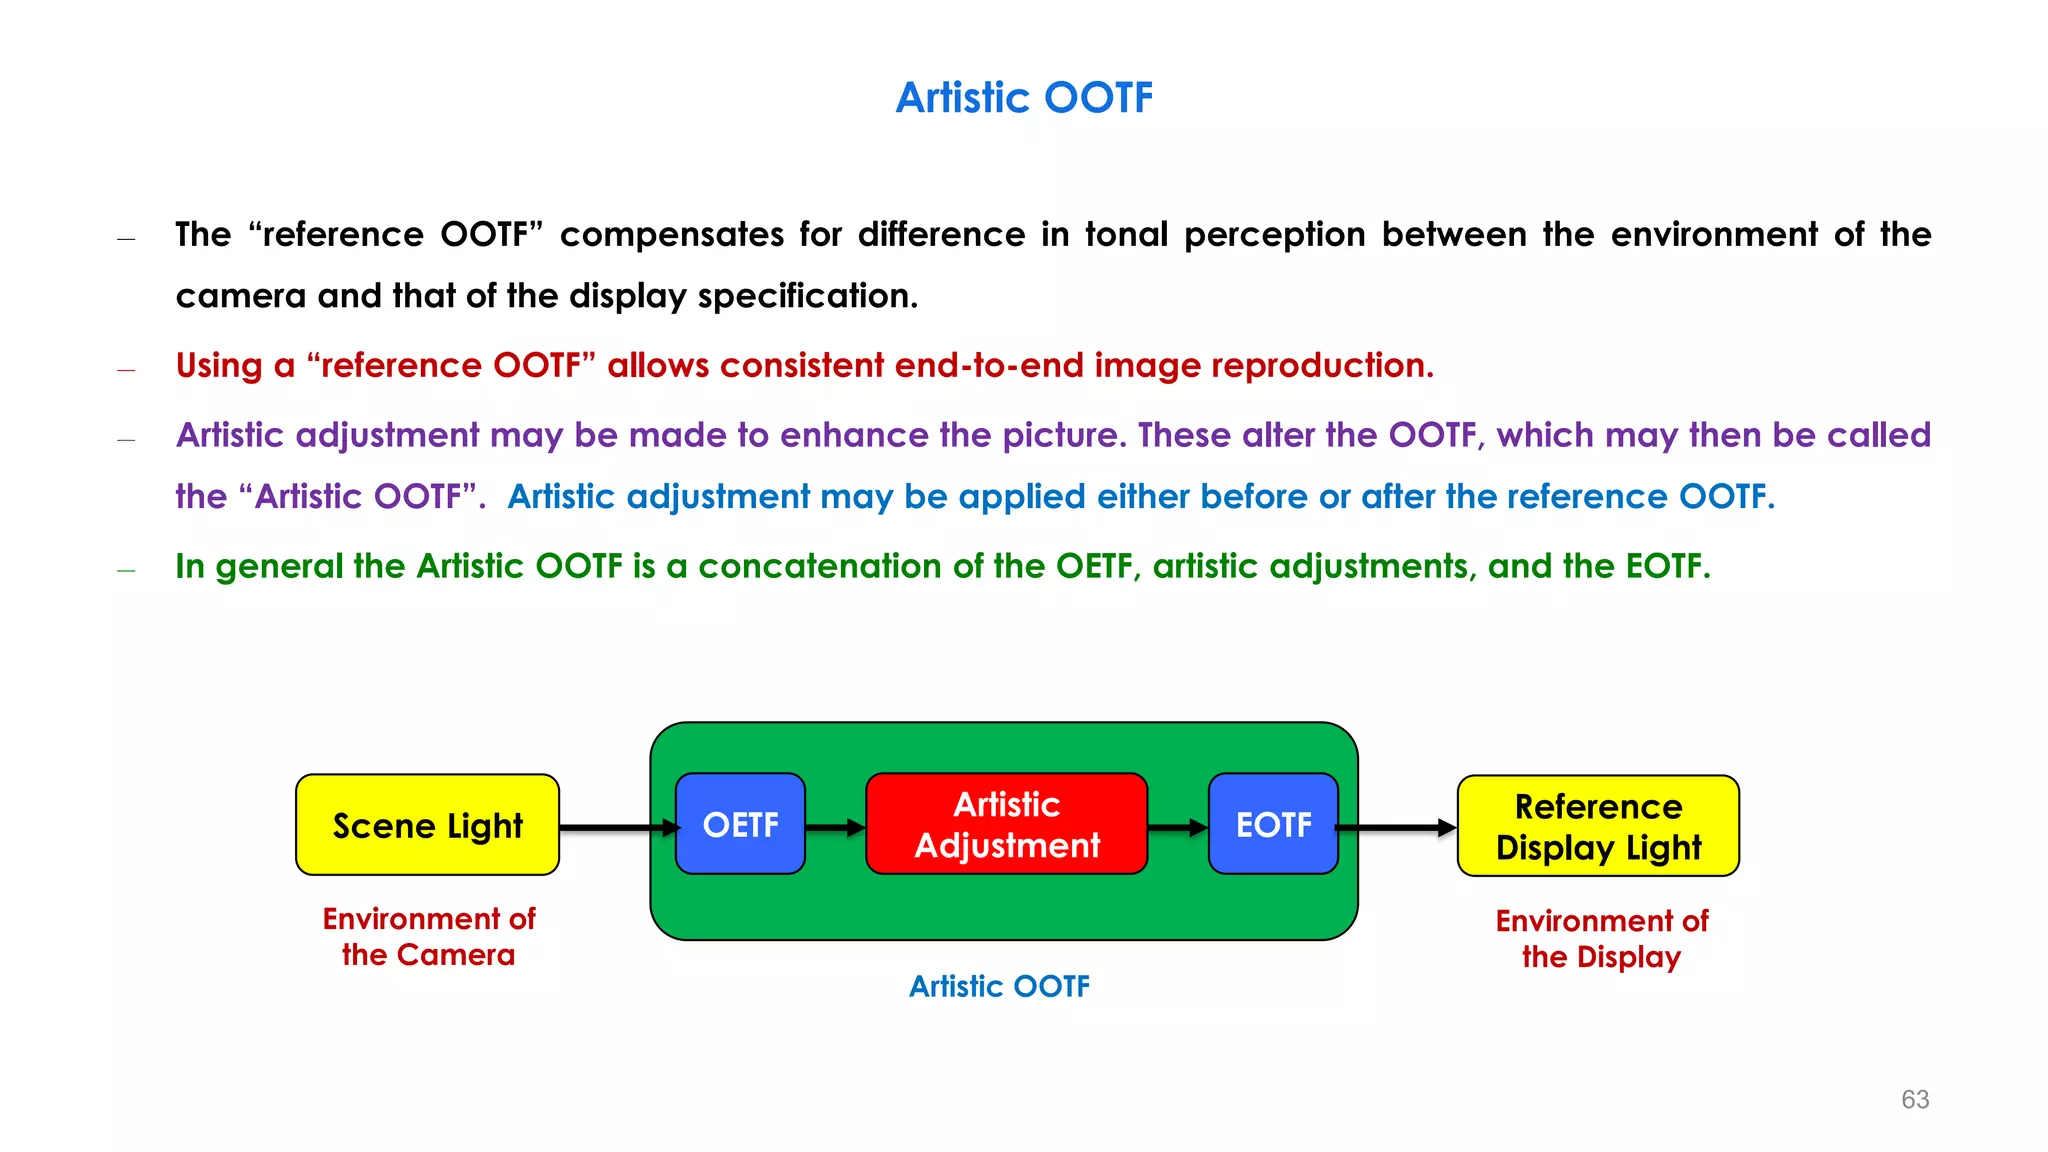
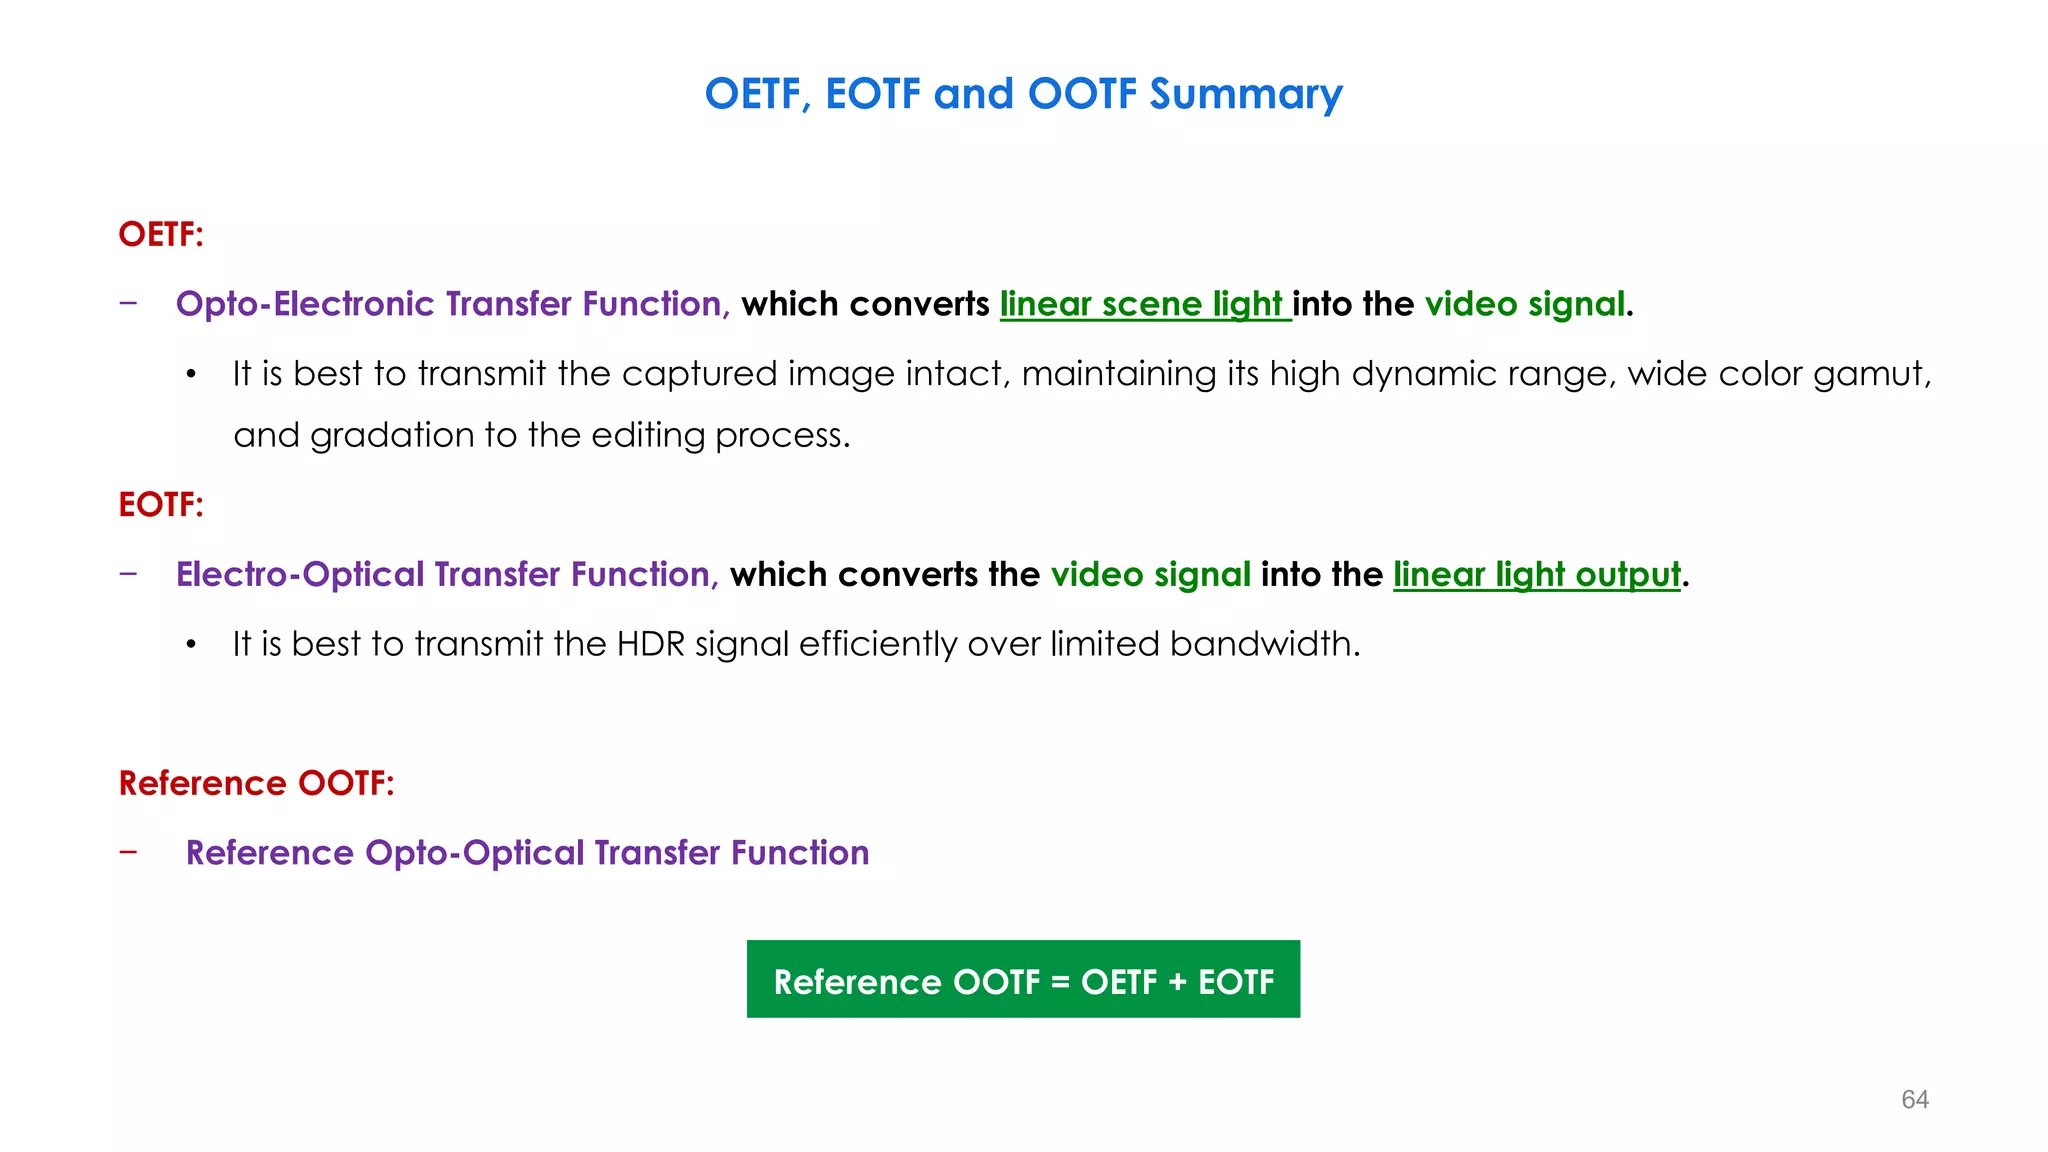
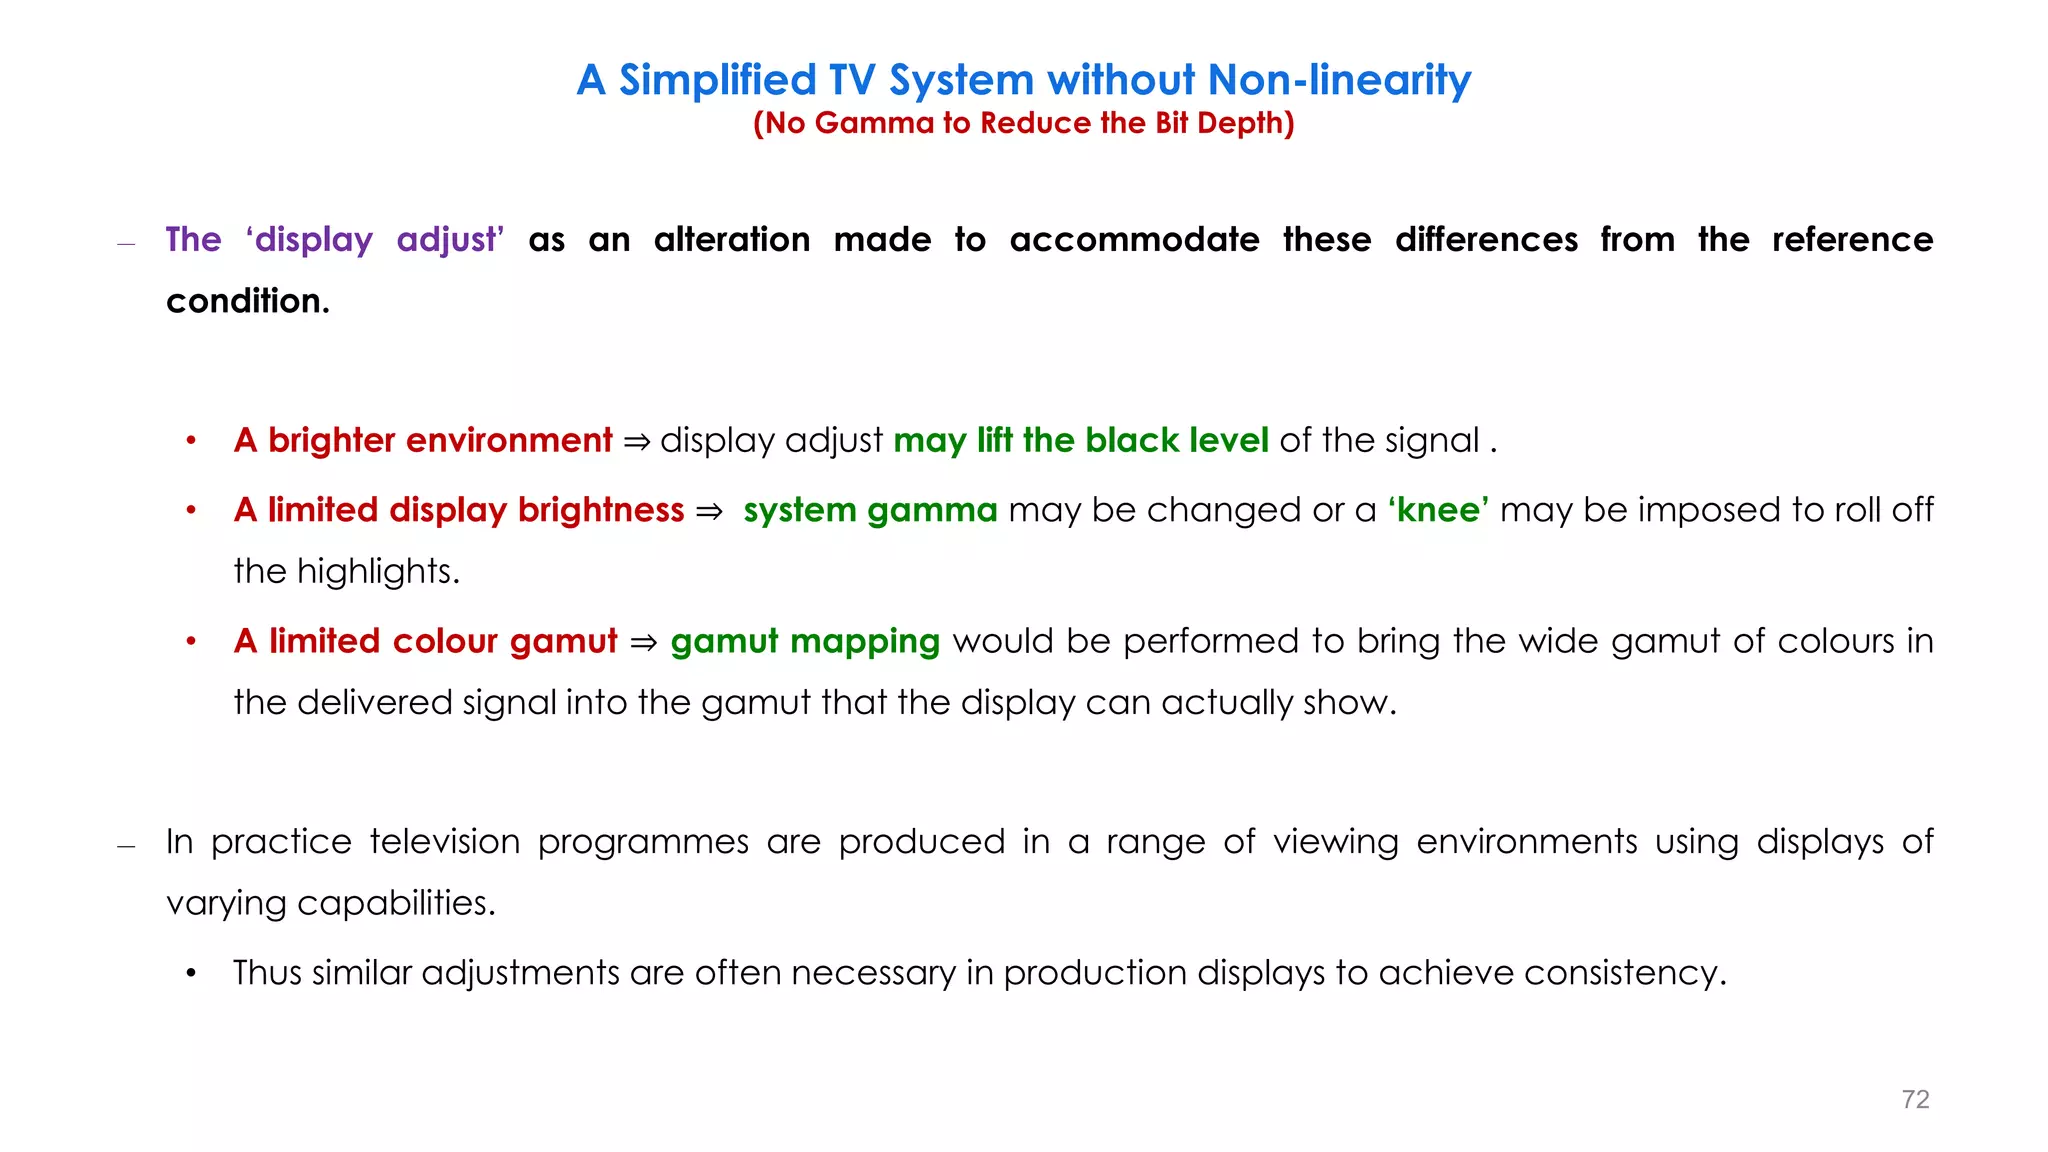
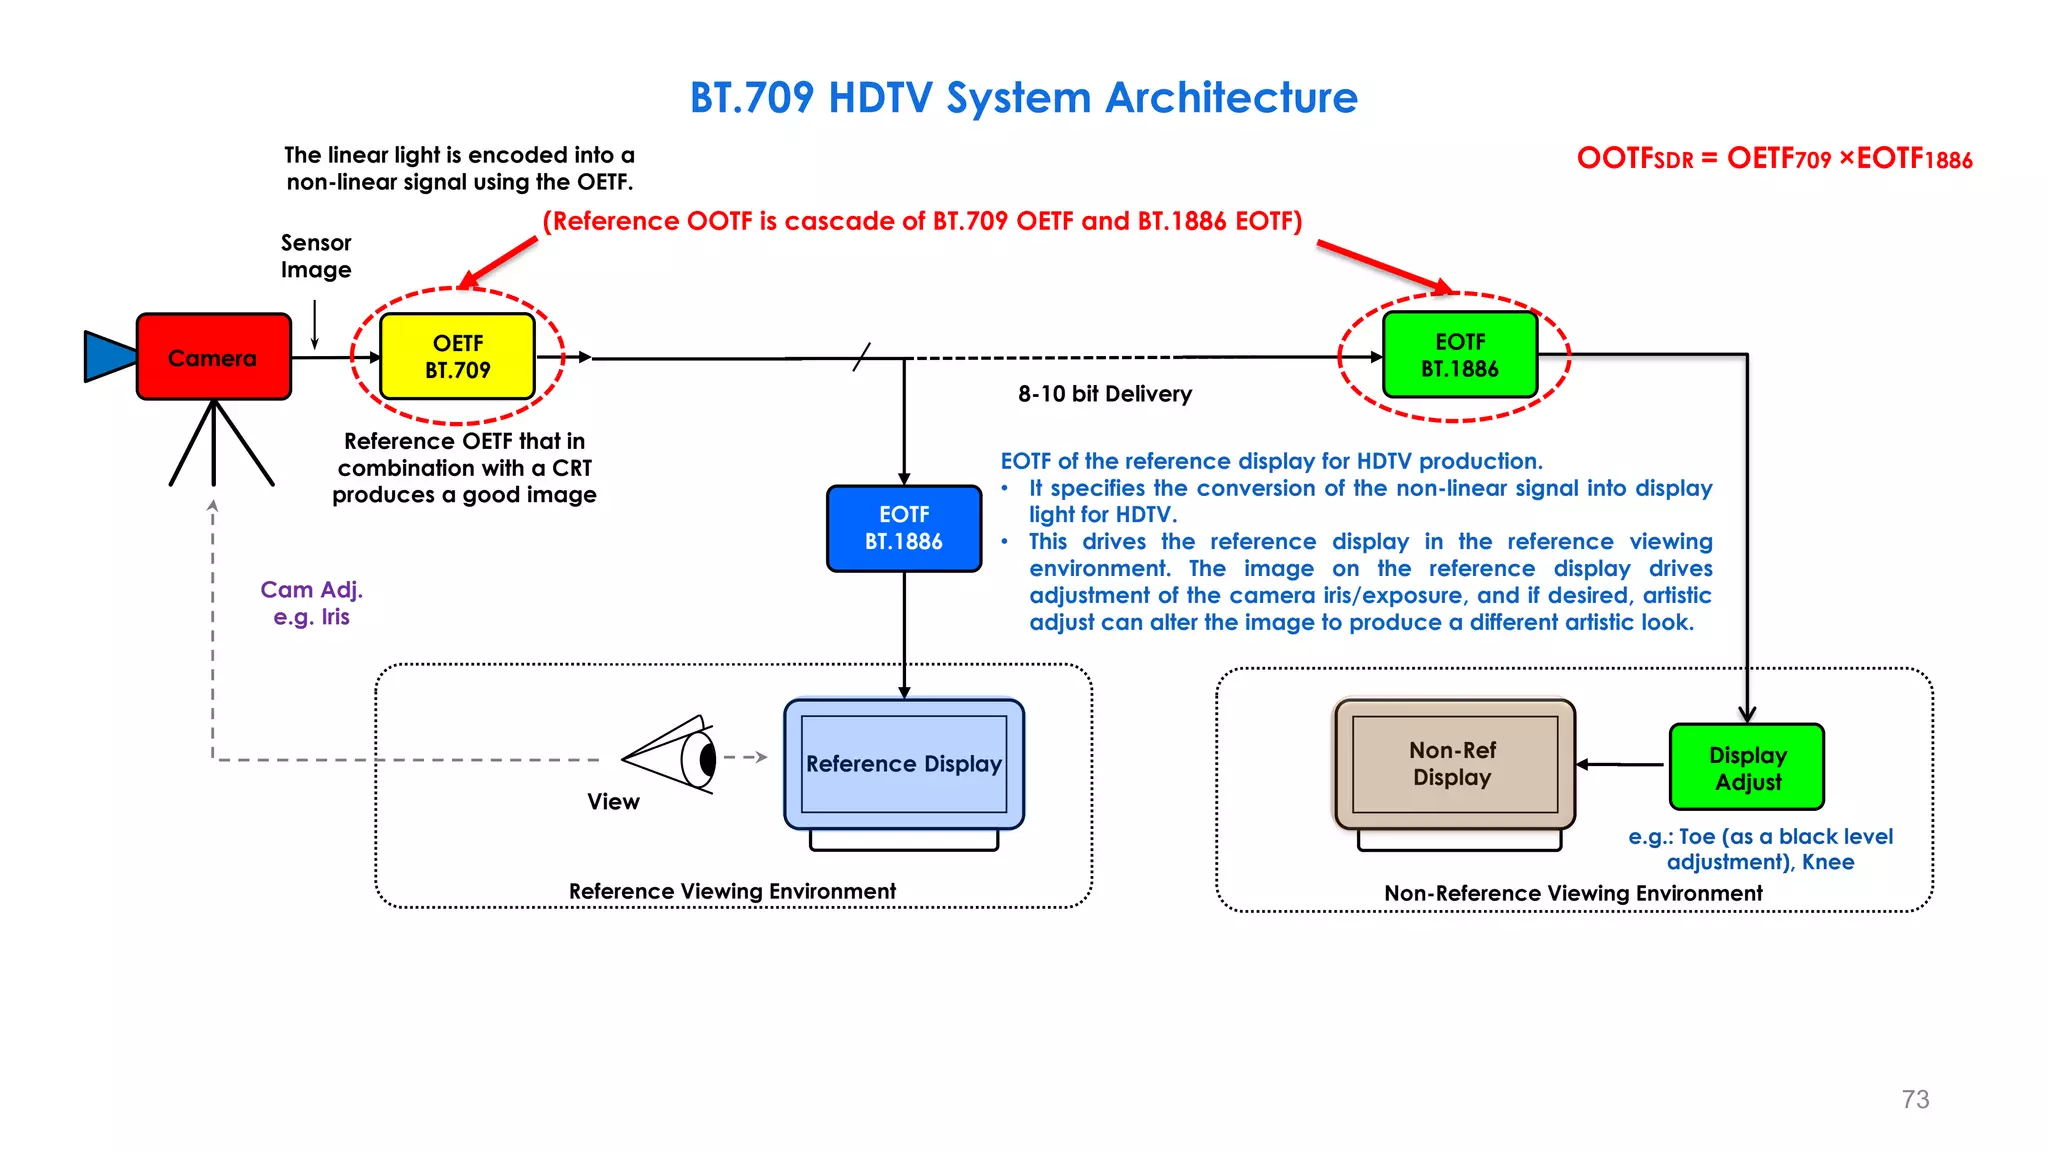
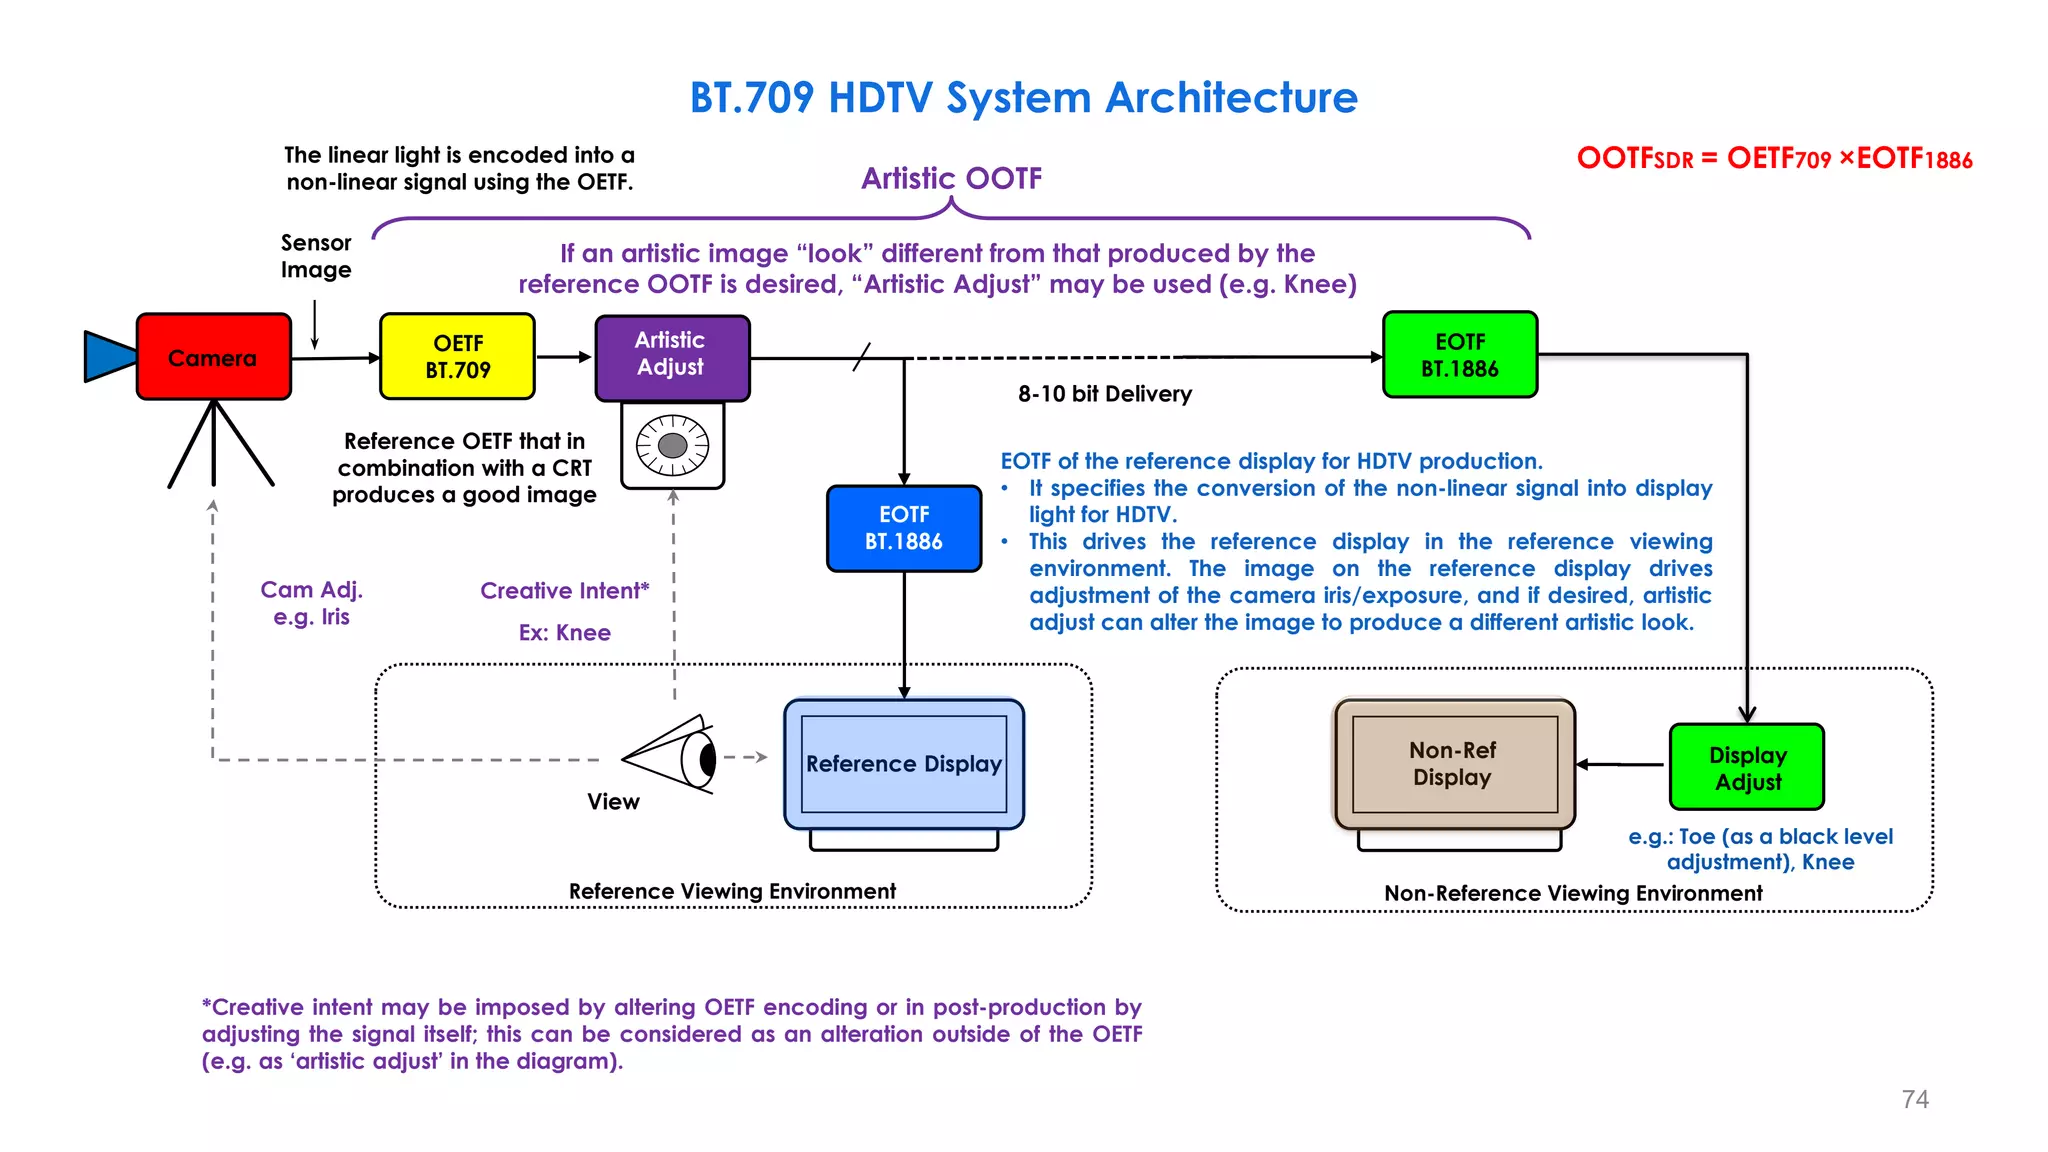
![Reference OOTF = OETF (BT.709) + EOTF (BT.1886)
– Opto-Electronic Transfer Function (OETF): Scene light to electrical signal
– Electro-Optical Transfer Function (EOTF): Electrical signal to scene light
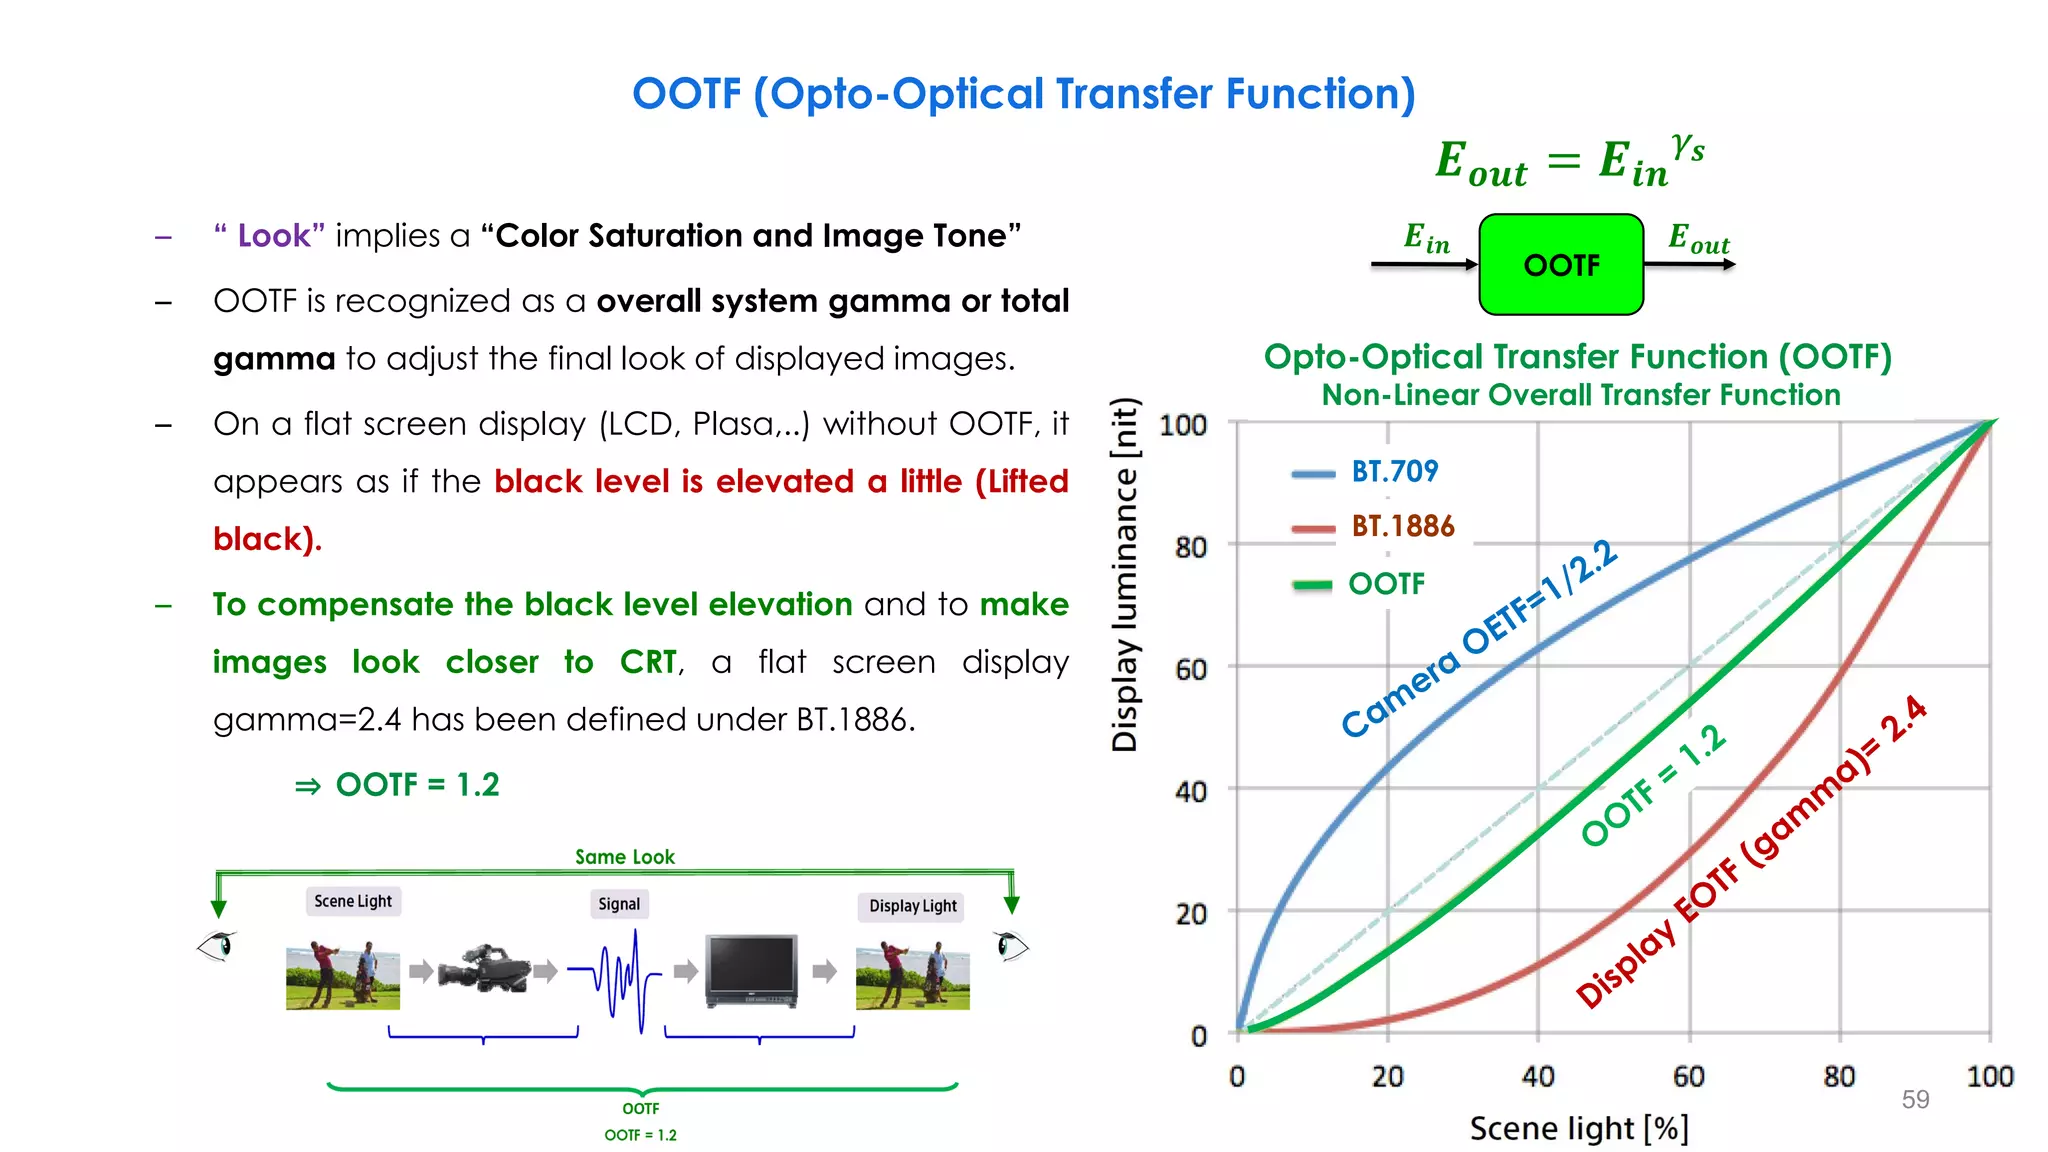
OOTF (Opto-Optical Transfer Function)
BT. 709
OETF
BT. 1886
EOTF
𝑬: [𝟎, 𝟏] 𝑬′
: [𝟎, 𝟏]
𝑭𝑫
Linear Scene-light
Signals 𝑹𝒔, 𝑮𝒔, 𝑩𝒔
Non-linear
Signals 𝑹𝒔, 𝑮𝒔, 𝑩𝒔
Linear Display-light
Signals 𝑹𝑫, 𝑮𝑫, 𝑩𝑫
57
𝑭𝑺](https://image.slidesharecdn.com/hdrandwcgprinciplespart1-210615182237/75/HDR-and-WCG-Principles-Part-1-57-2048.jpg)
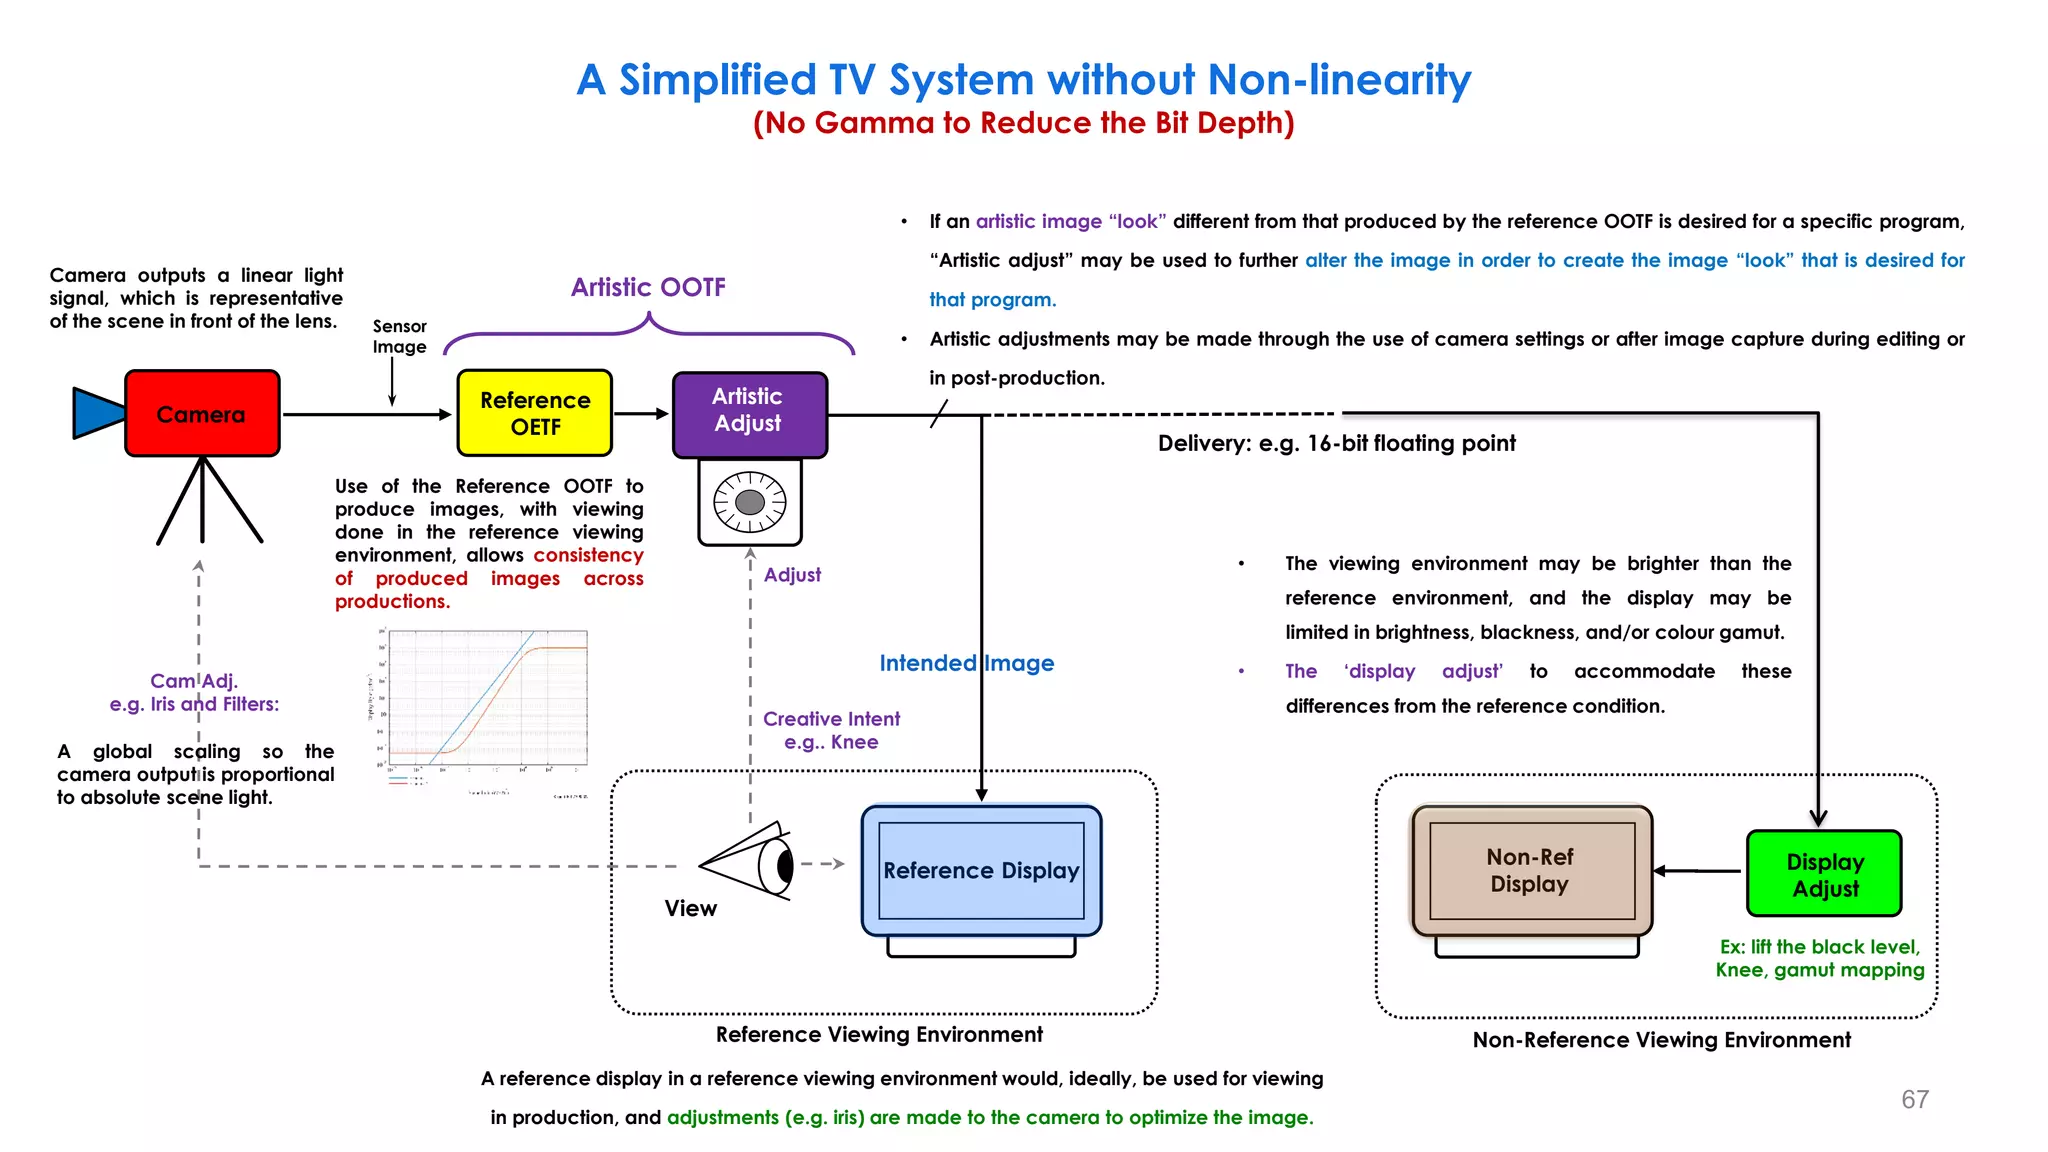
![OOTF (Opto-Optical Transfer Function)
Linear Scene Light
Cancel
OOTF=Artistic Intent
(seasoning)
OETF-1 OOTF
Output [%]
Input [cd/㎡ ] Input [%]
Output
[cd/㎡ ]
Camera Monitor
Display Light
Gamma 2.4
Optical Signal
Scene Light
Electronic Signal
Gamma Table:Standard 5
Step Gamma :0.45
System Gamma
(Total Gamma)
1.2
SDR (BT.1886)
Display Linear Light
58
OETF](https://image.slidesharecdn.com/hdrandwcgprinciplespart1-210615182237/75/HDR-and-WCG-Principles-Part-1-58-2048.jpg)
![Display Gamma too low Display Gamma correct Display Gamma too high
− Critical with variations in Display Brightness and Viewing Conditions
• Brighter viewing environments require lower gamma values
Lower display gamma lifts details out of the shadows
OOTF (Opto-Optical Transfer Function)
Total Gamma 1.4
Total Gamma 1.3
Total Gamma 1.2
(OOTF) Opto-Optical Transfer Function
Relative Scene Light [0.0001:1]
0.0001
Lower display gamma lifts
details out of the shadows
60
𝑬𝒊𝒏
OOTF
𝑬𝒐𝒖𝒕
𝑬𝒐𝒖𝒕 = 𝑬𝒊𝒏
𝛾𝒔](https://image.slidesharecdn.com/hdrandwcgprinciplespart1-210615182237/75/HDR-and-WCG-Principles-Part-1-60-2048.jpg)


![Luminance
Levels
[cd/m²]
108
106
104
102
100
10-2
10-6
Sun Direct 109
Sun light
Indoor light
Moon light
10-4
Star light
Day
Vision
Night
Vision
Typical
Human
Vision
Range
w/o
Adjustment
~
10
5
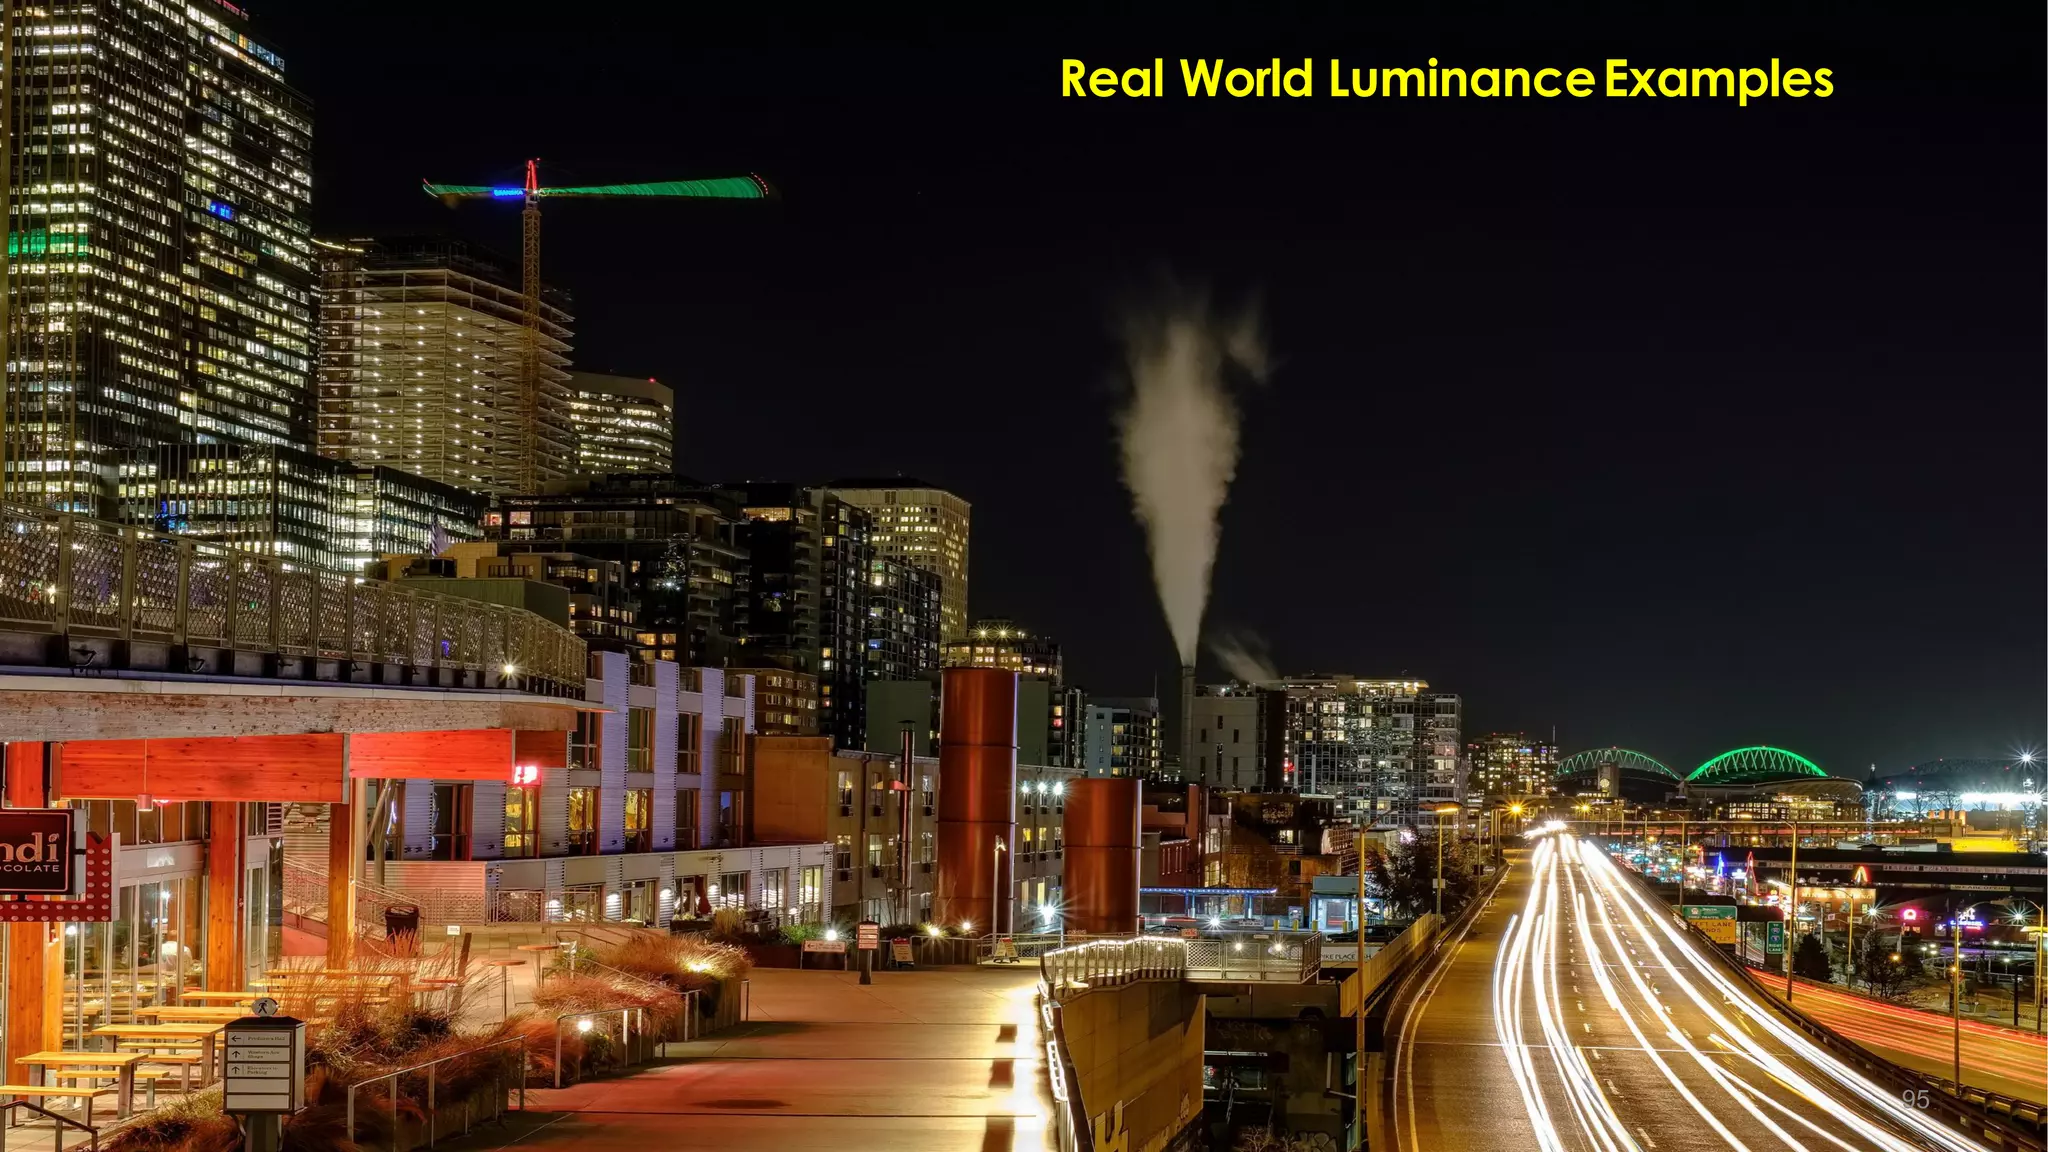
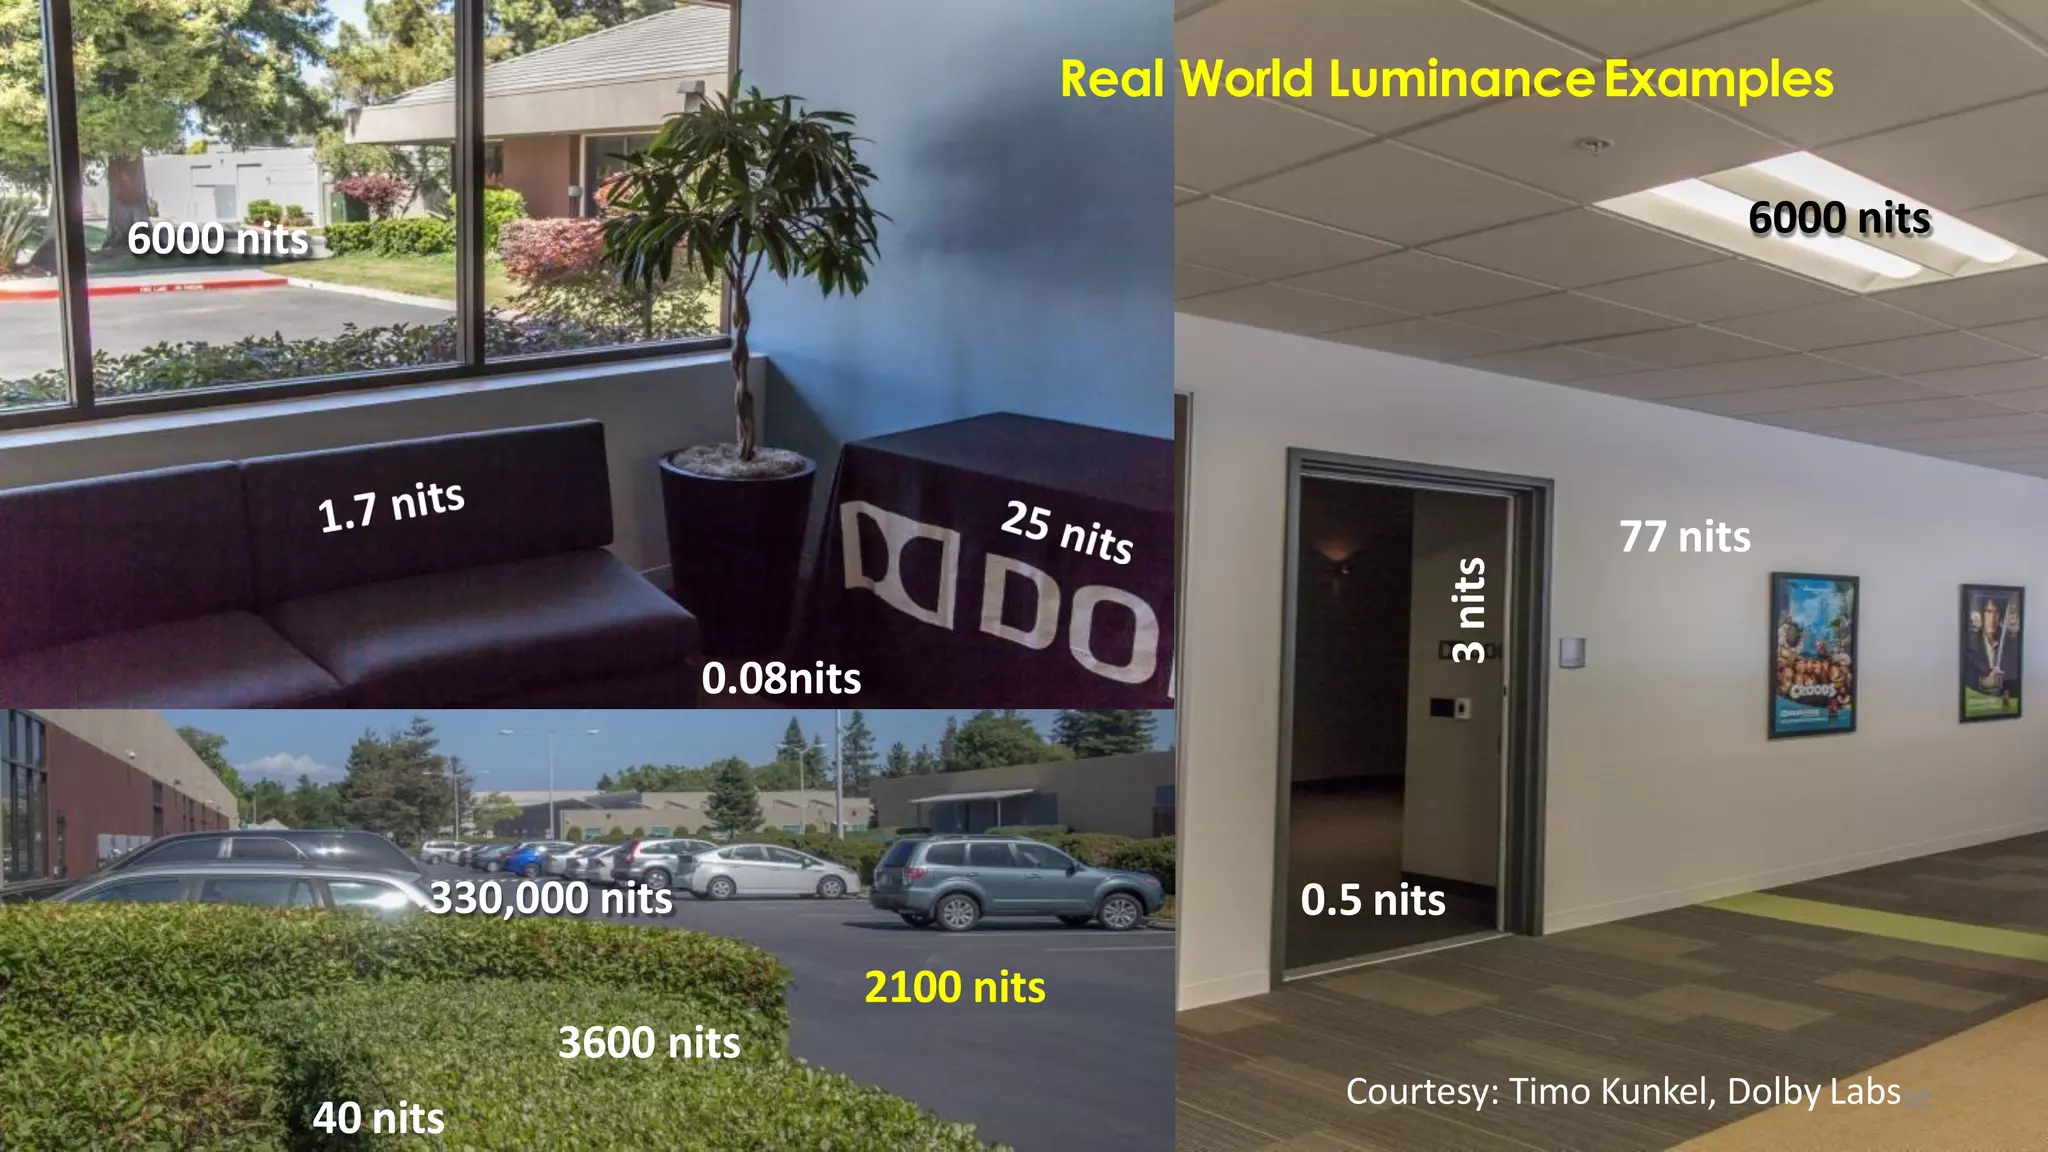
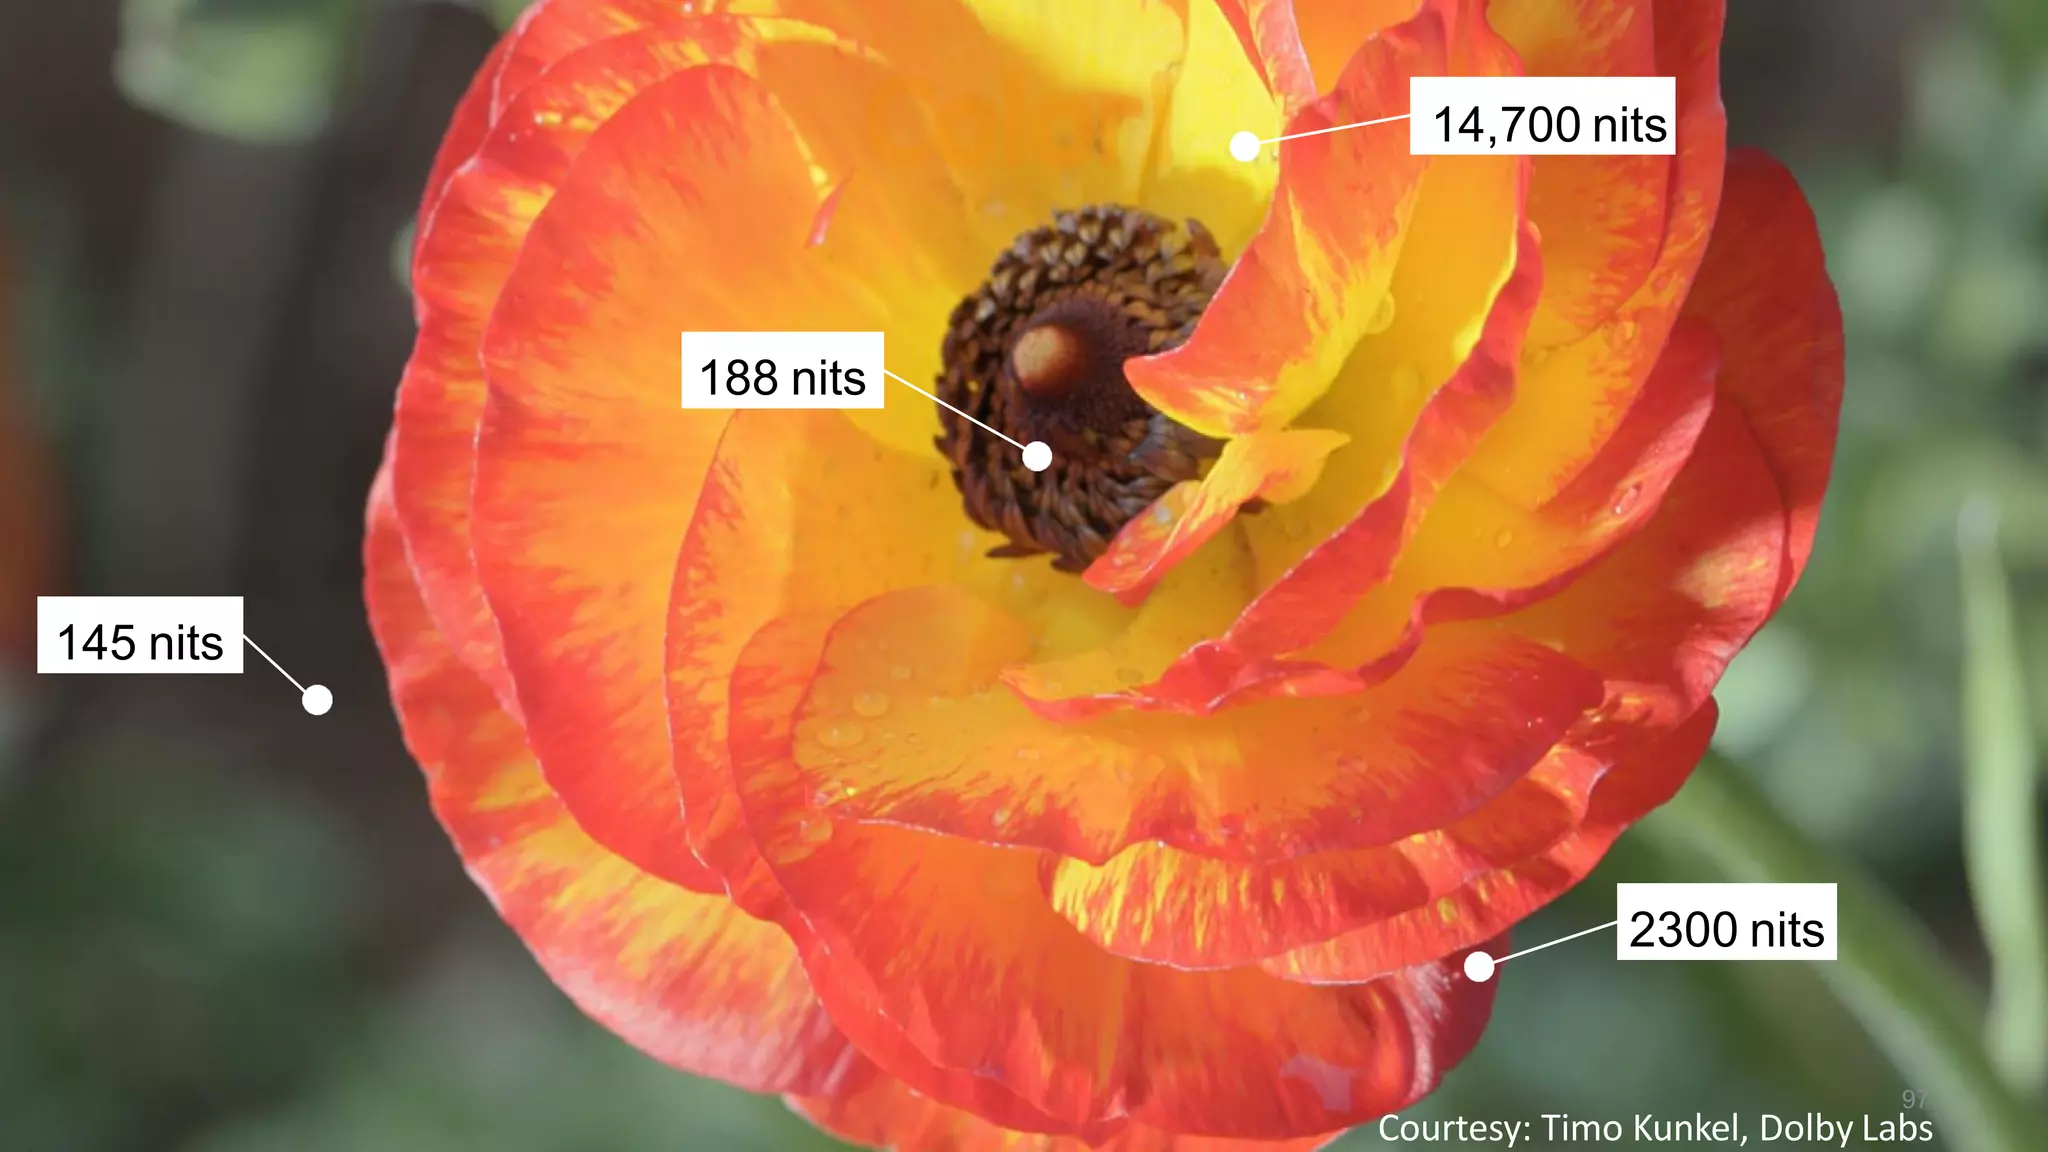
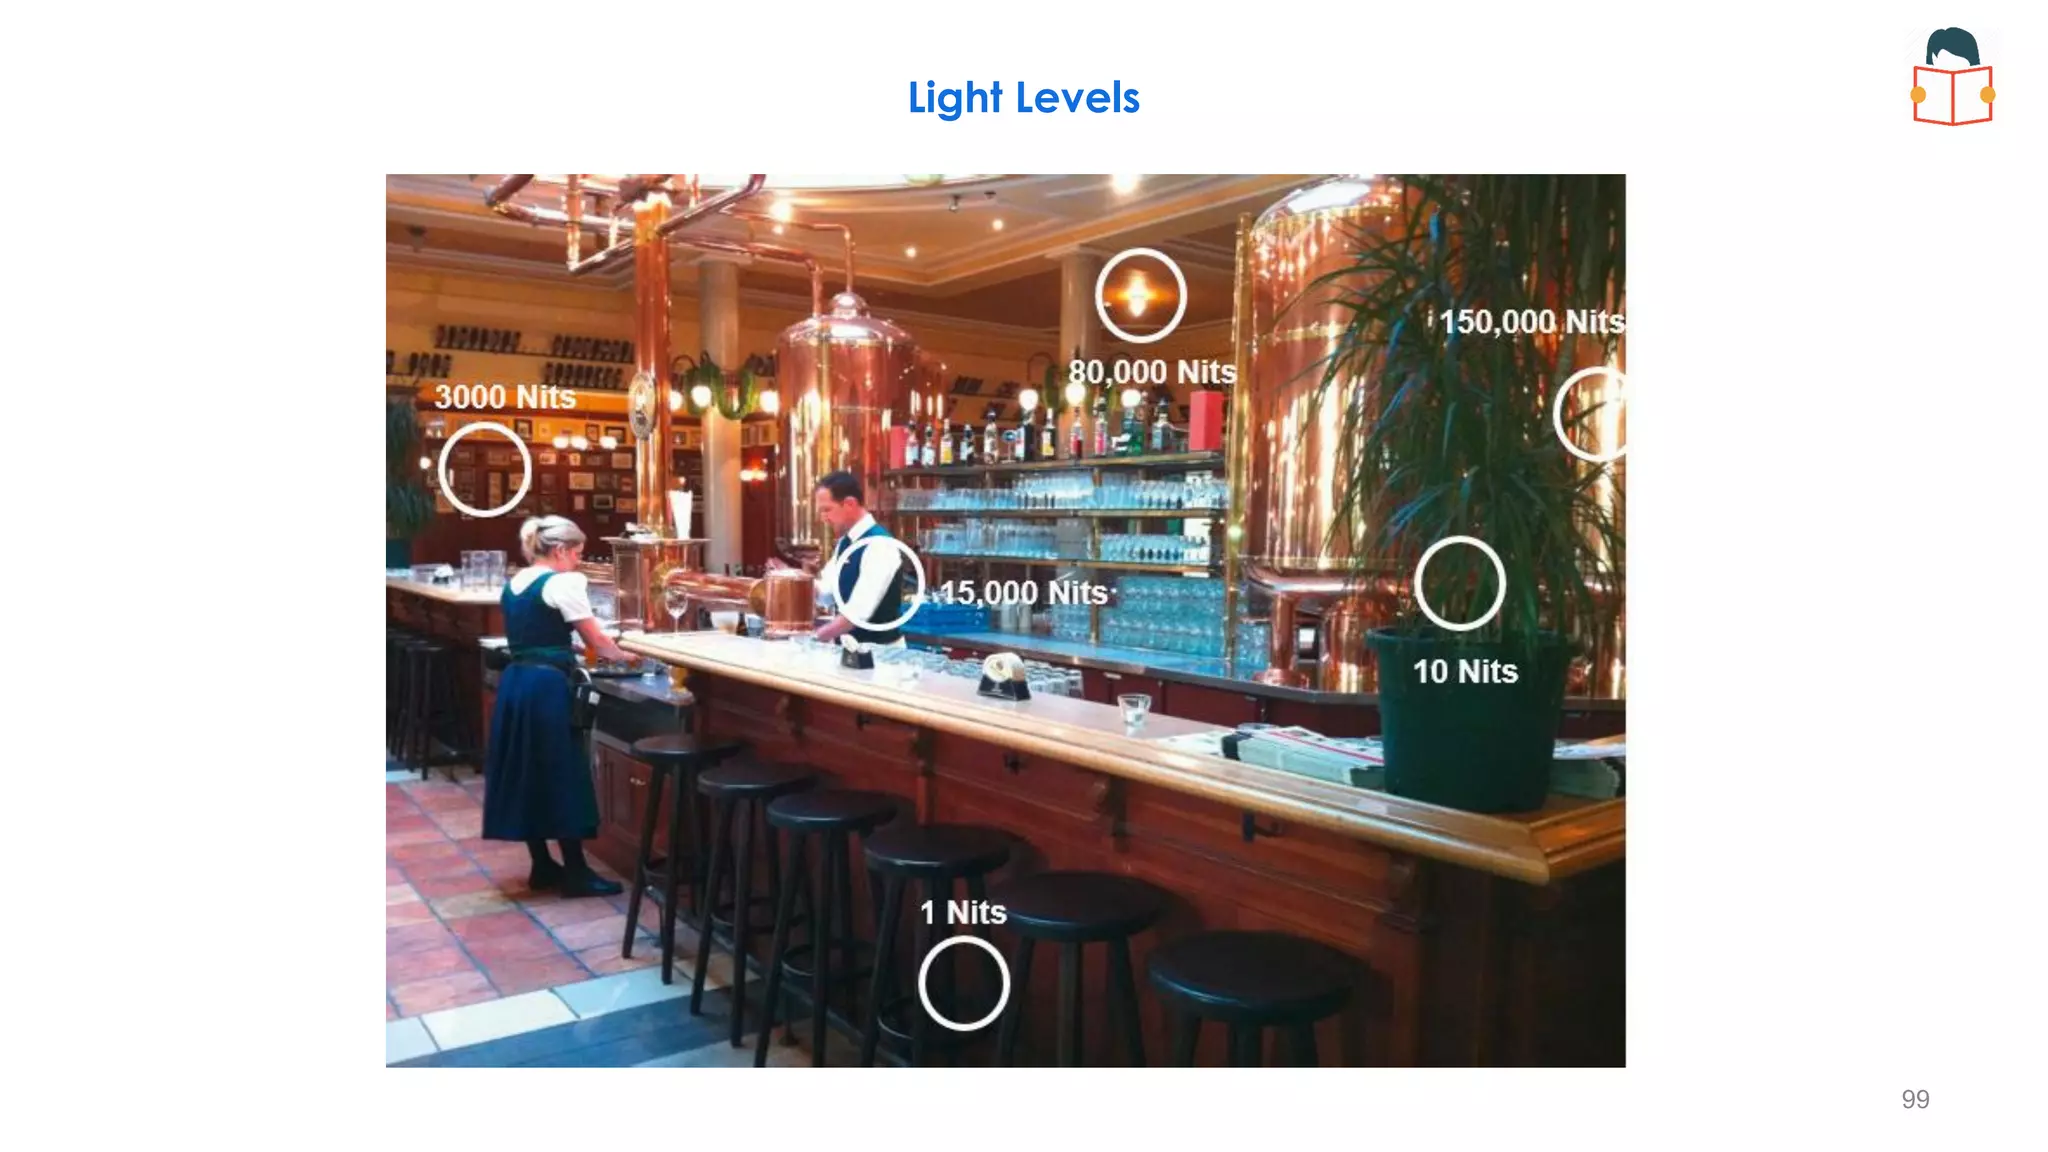
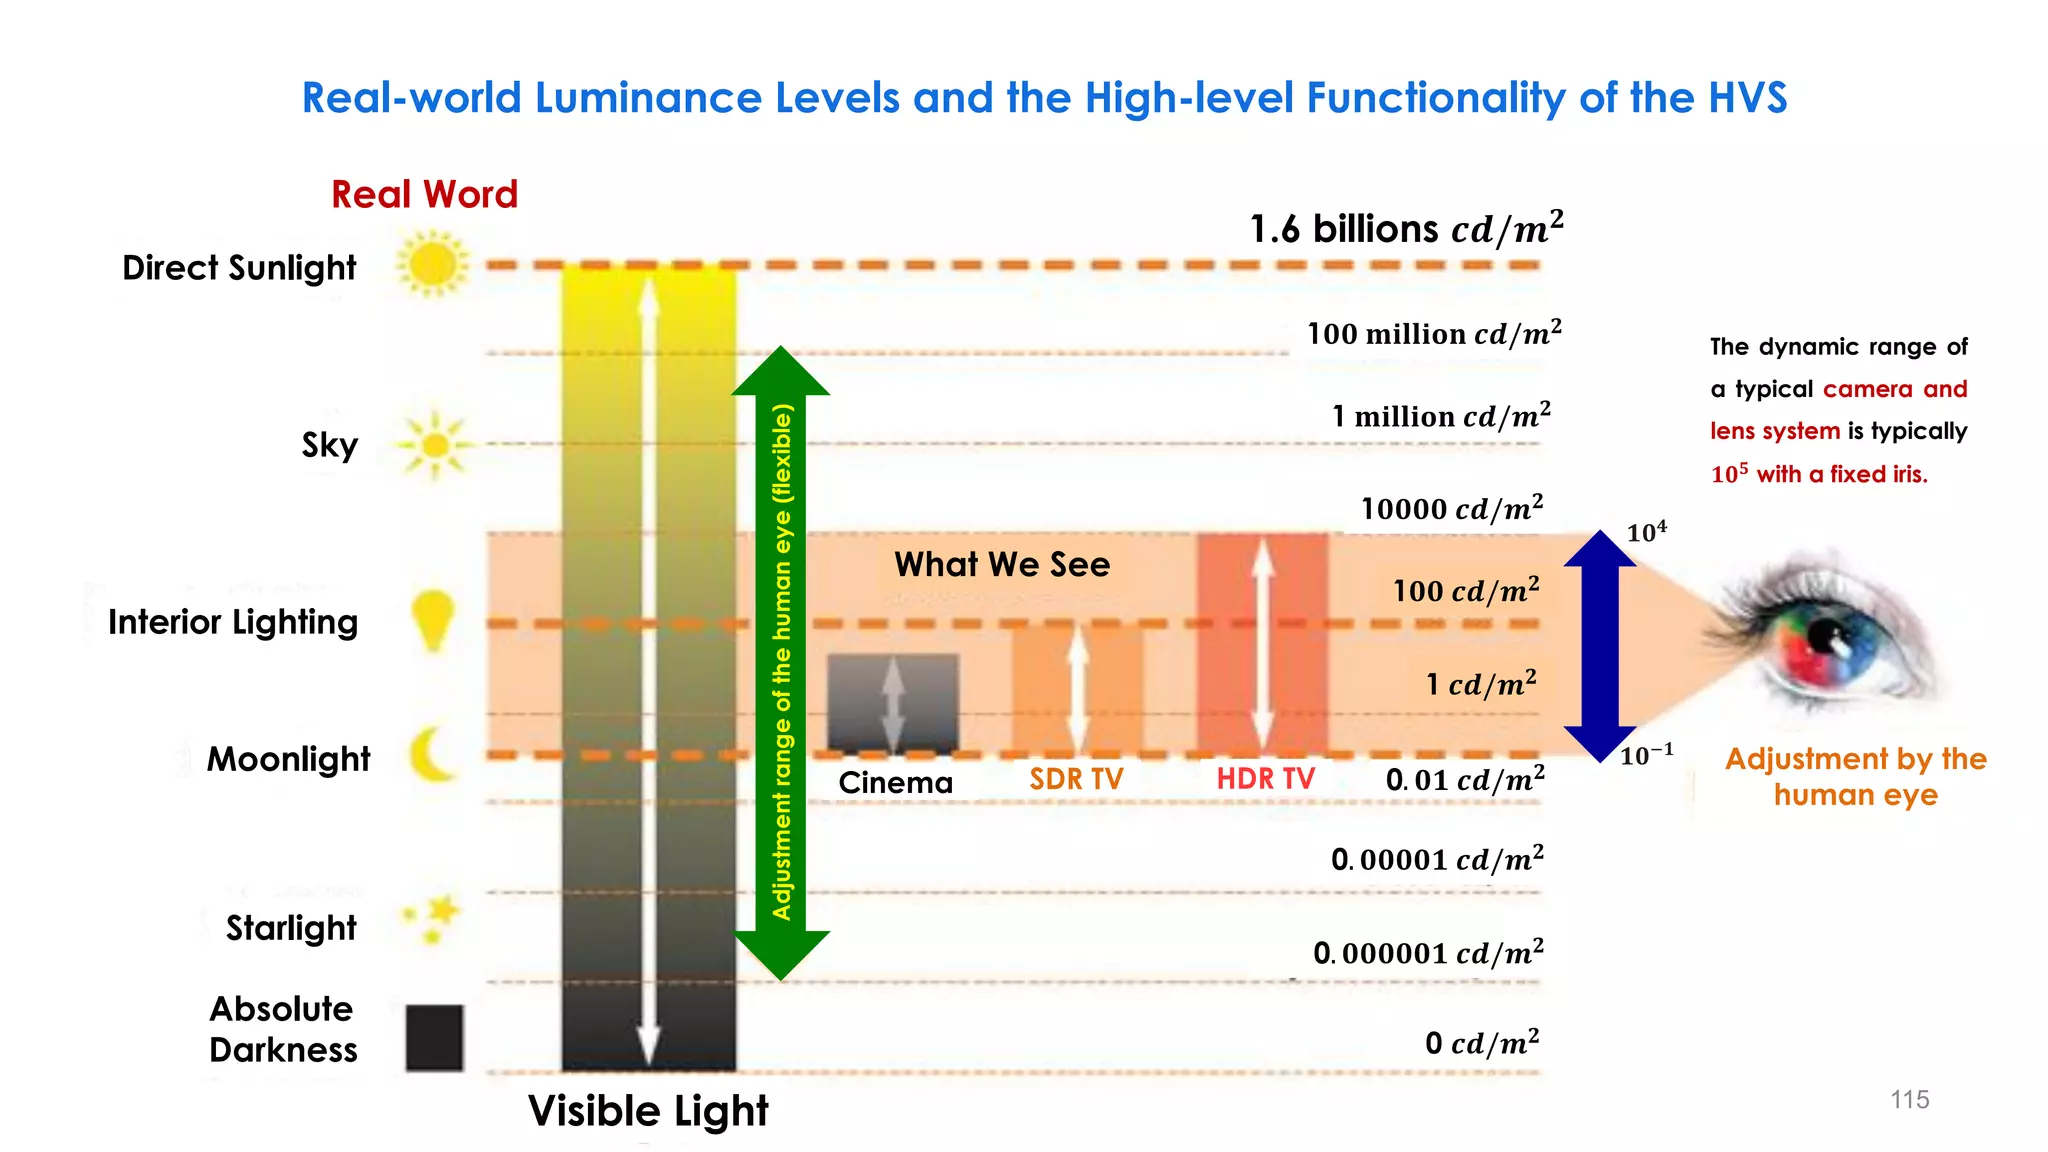
Dynamic Range of the "Eyes” and HVS Light Levels
𝟎. 𝟏 𝒏𝒊𝒕
𝟏𝟎, 𝟎𝟎𝟎 𝒏𝒊𝒕
Real Word Human Vision
When the pupil opens and closes, the
human eye can perceive a full range
of luminance levels in the natural world.
116](https://image.slidesharecdn.com/hdrandwcgprinciplespart1-210615182237/75/HDR-and-WCG-Principles-Part-1-116-2048.jpg)
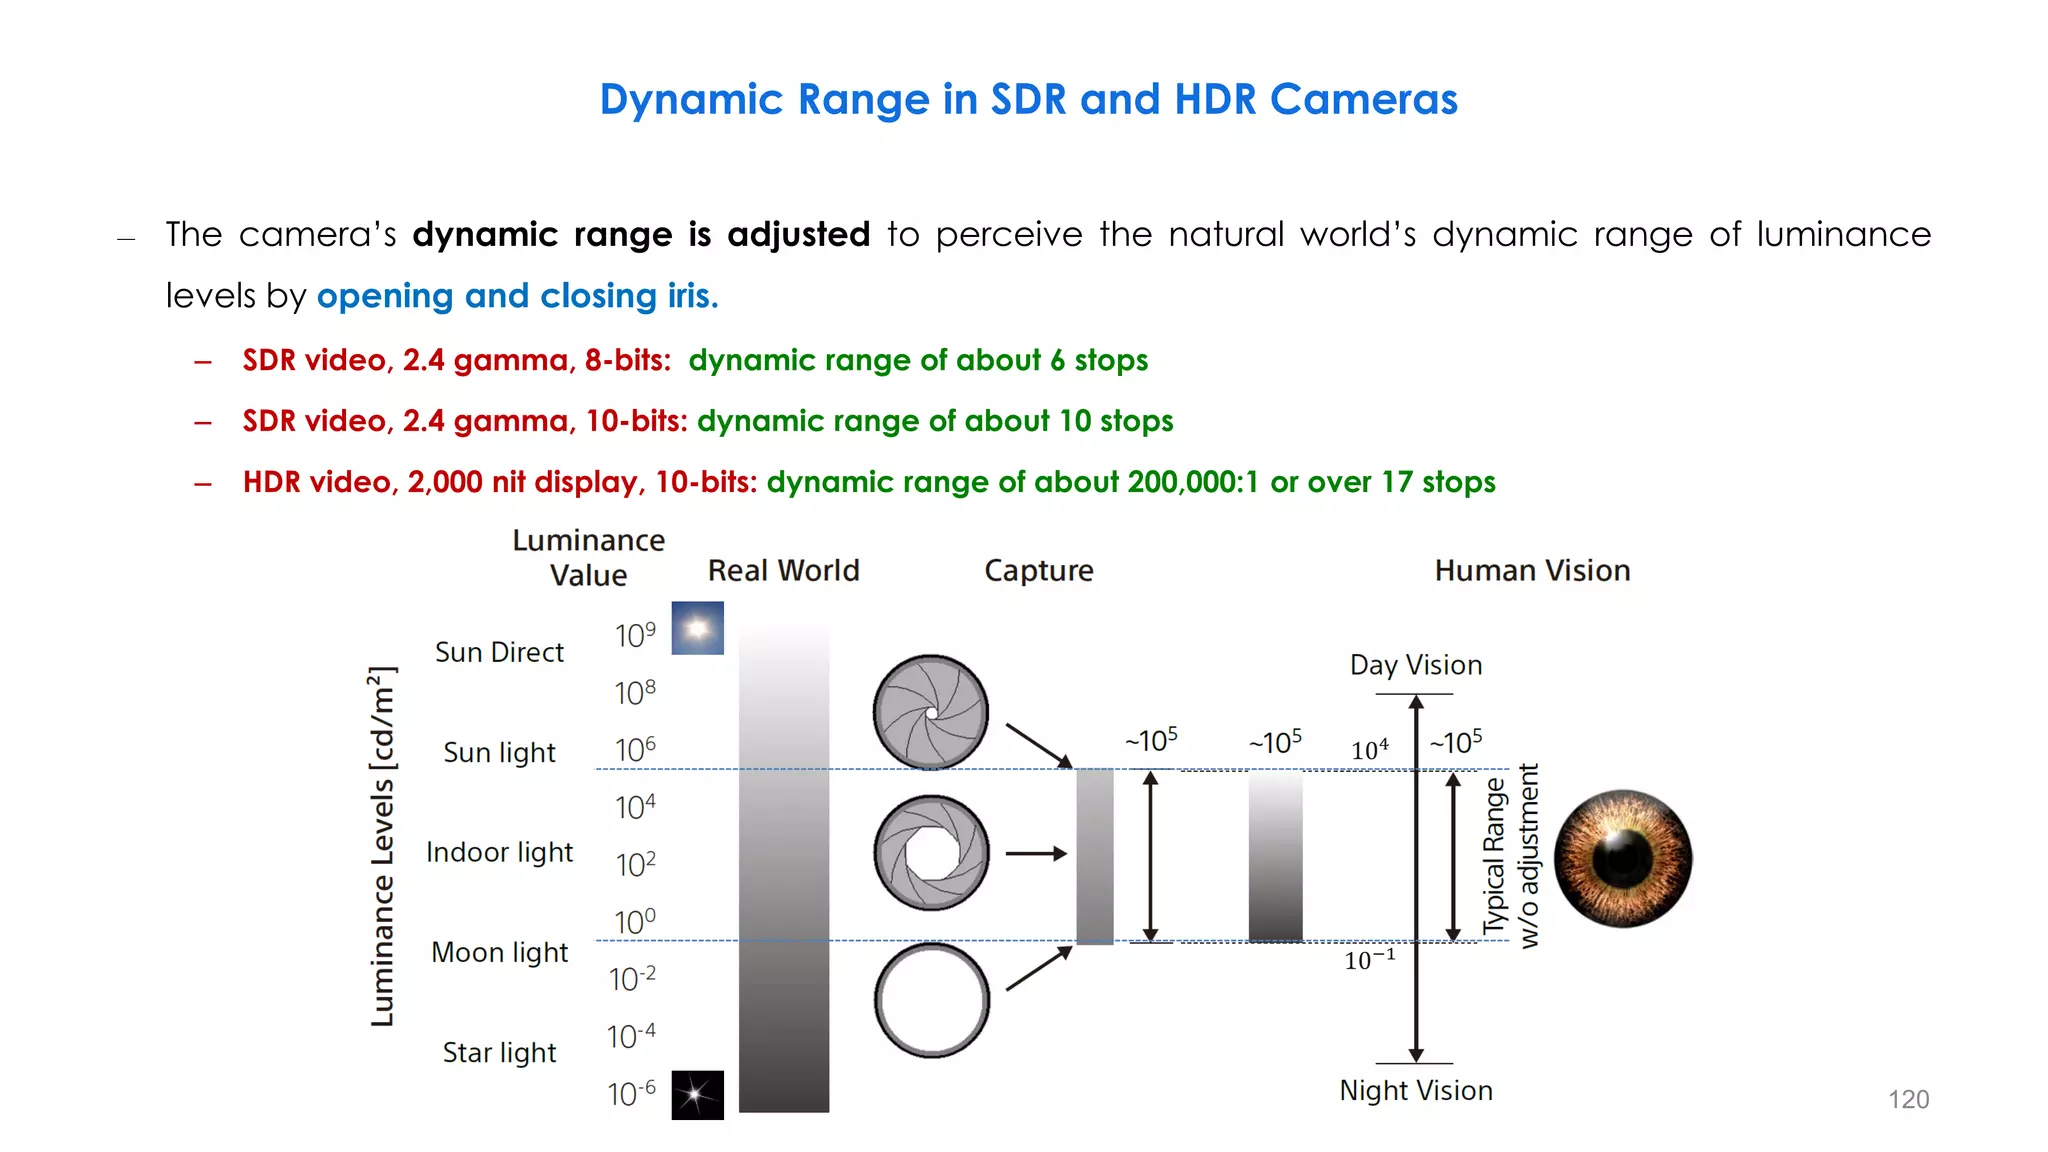
![Dynamic Range of the “Cameras”
Luminance
Levels
[cd/m²]
Image covering 105 range
||
Image maximizing the
visibility
||
Enablethe real expression!
108
106
104
102
100
10-2
10-4
10-6
Sun Direct 109
Sun light
Indoor light
Moon light
Star light
~
10
5
𝟎. 𝟏 𝒏𝒊𝒕
𝟏𝟎, 𝟎𝟎𝟎 𝒏𝒊𝒕
Typical
Human
Vision
Range
w/o
Adjustment
Real Word Human Vision
Camera Iris
The camera’s dynamic range is
adjusted to perceive the natural
world’s dynamic range of luminance
levels by opening and closing iris.
117](https://image.slidesharecdn.com/hdrandwcgprinciplespart1-210615182237/75/HDR-and-WCG-Principles-Part-1-117-2048.jpg)


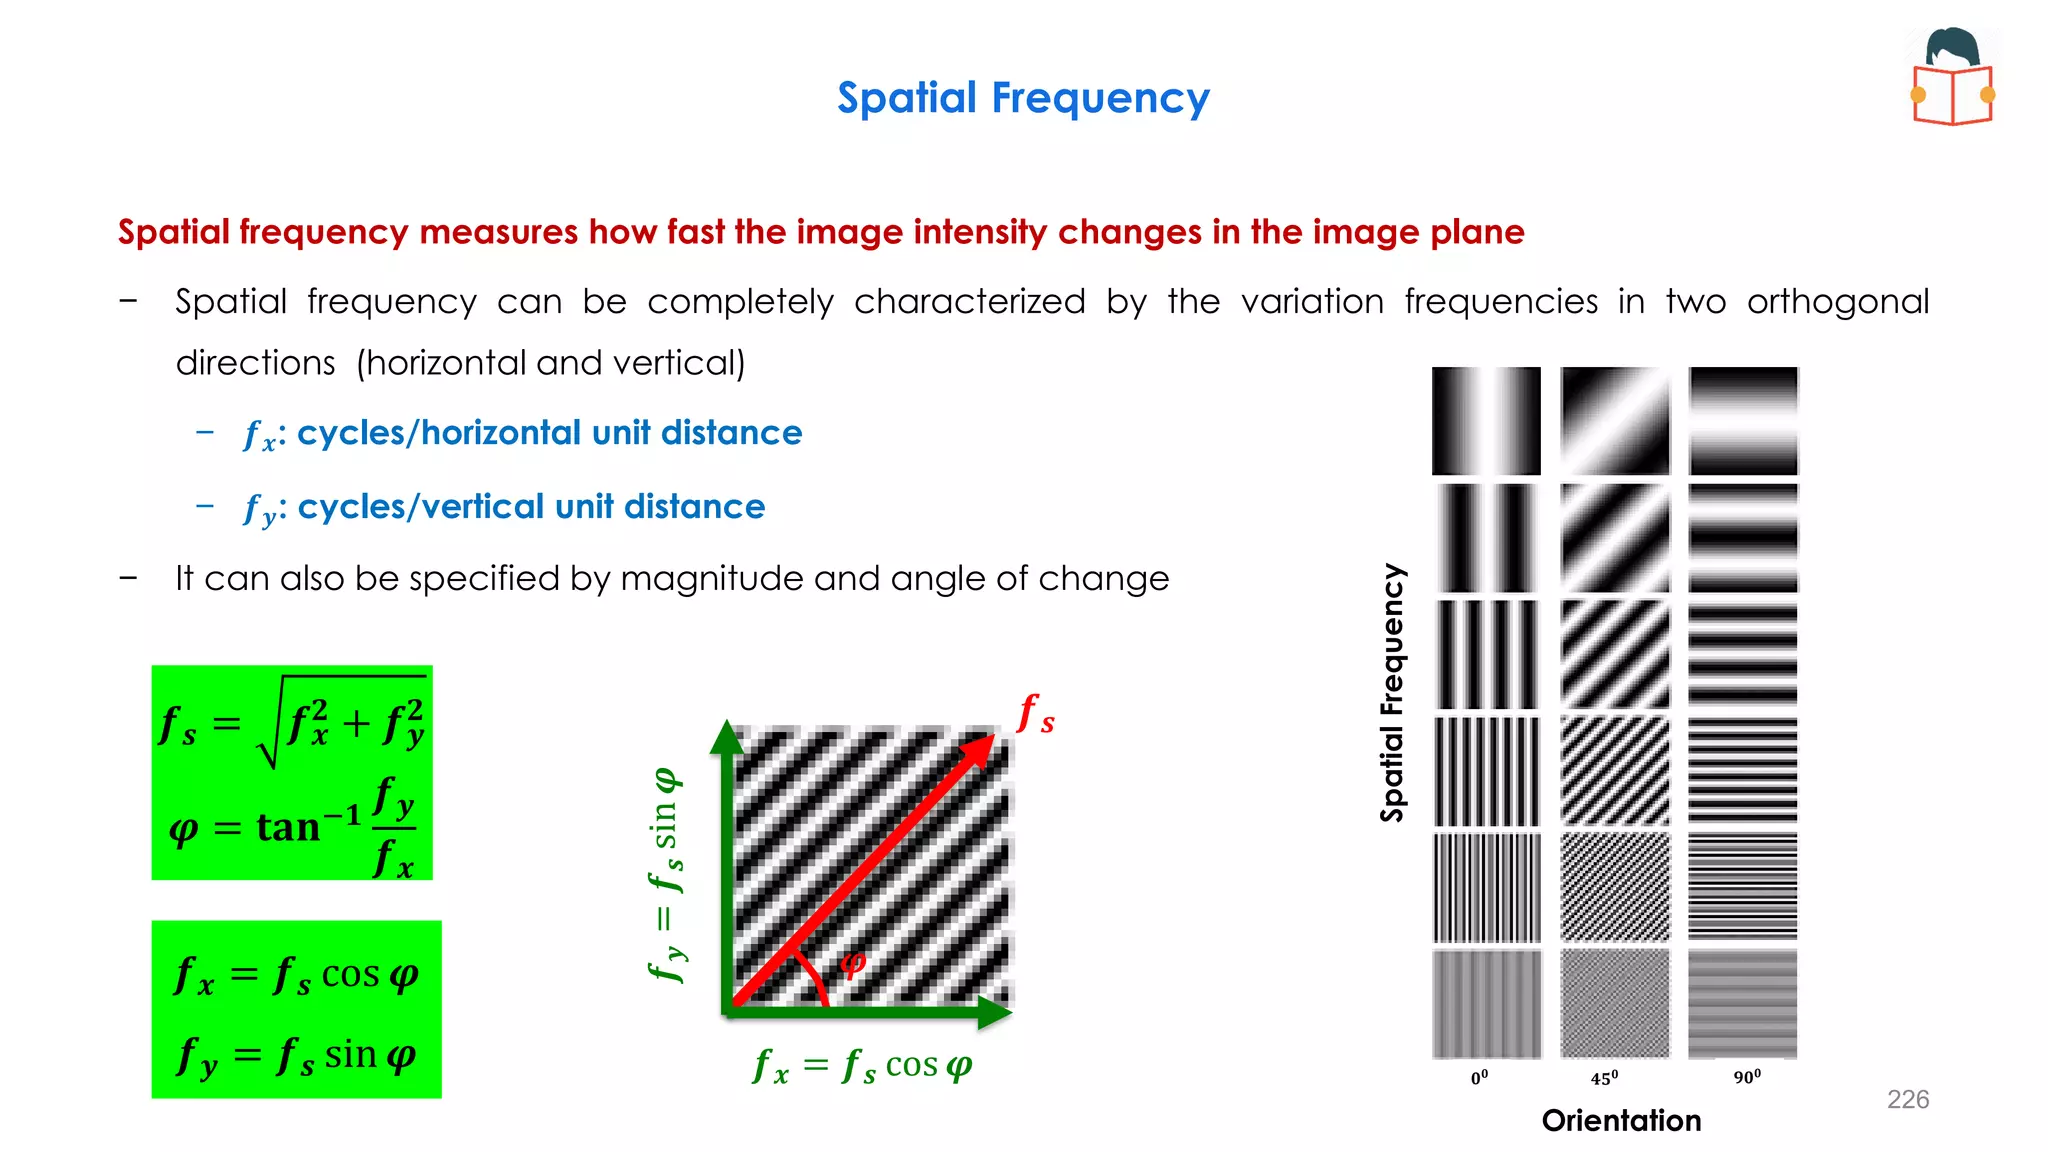
![Frequency Response of the HVS
− Spatial Frequency Response
− Temporal Frequency Response and Flicker
− Spatio-temporal Frequency Response
− Smooth Pursuit Eye Movement
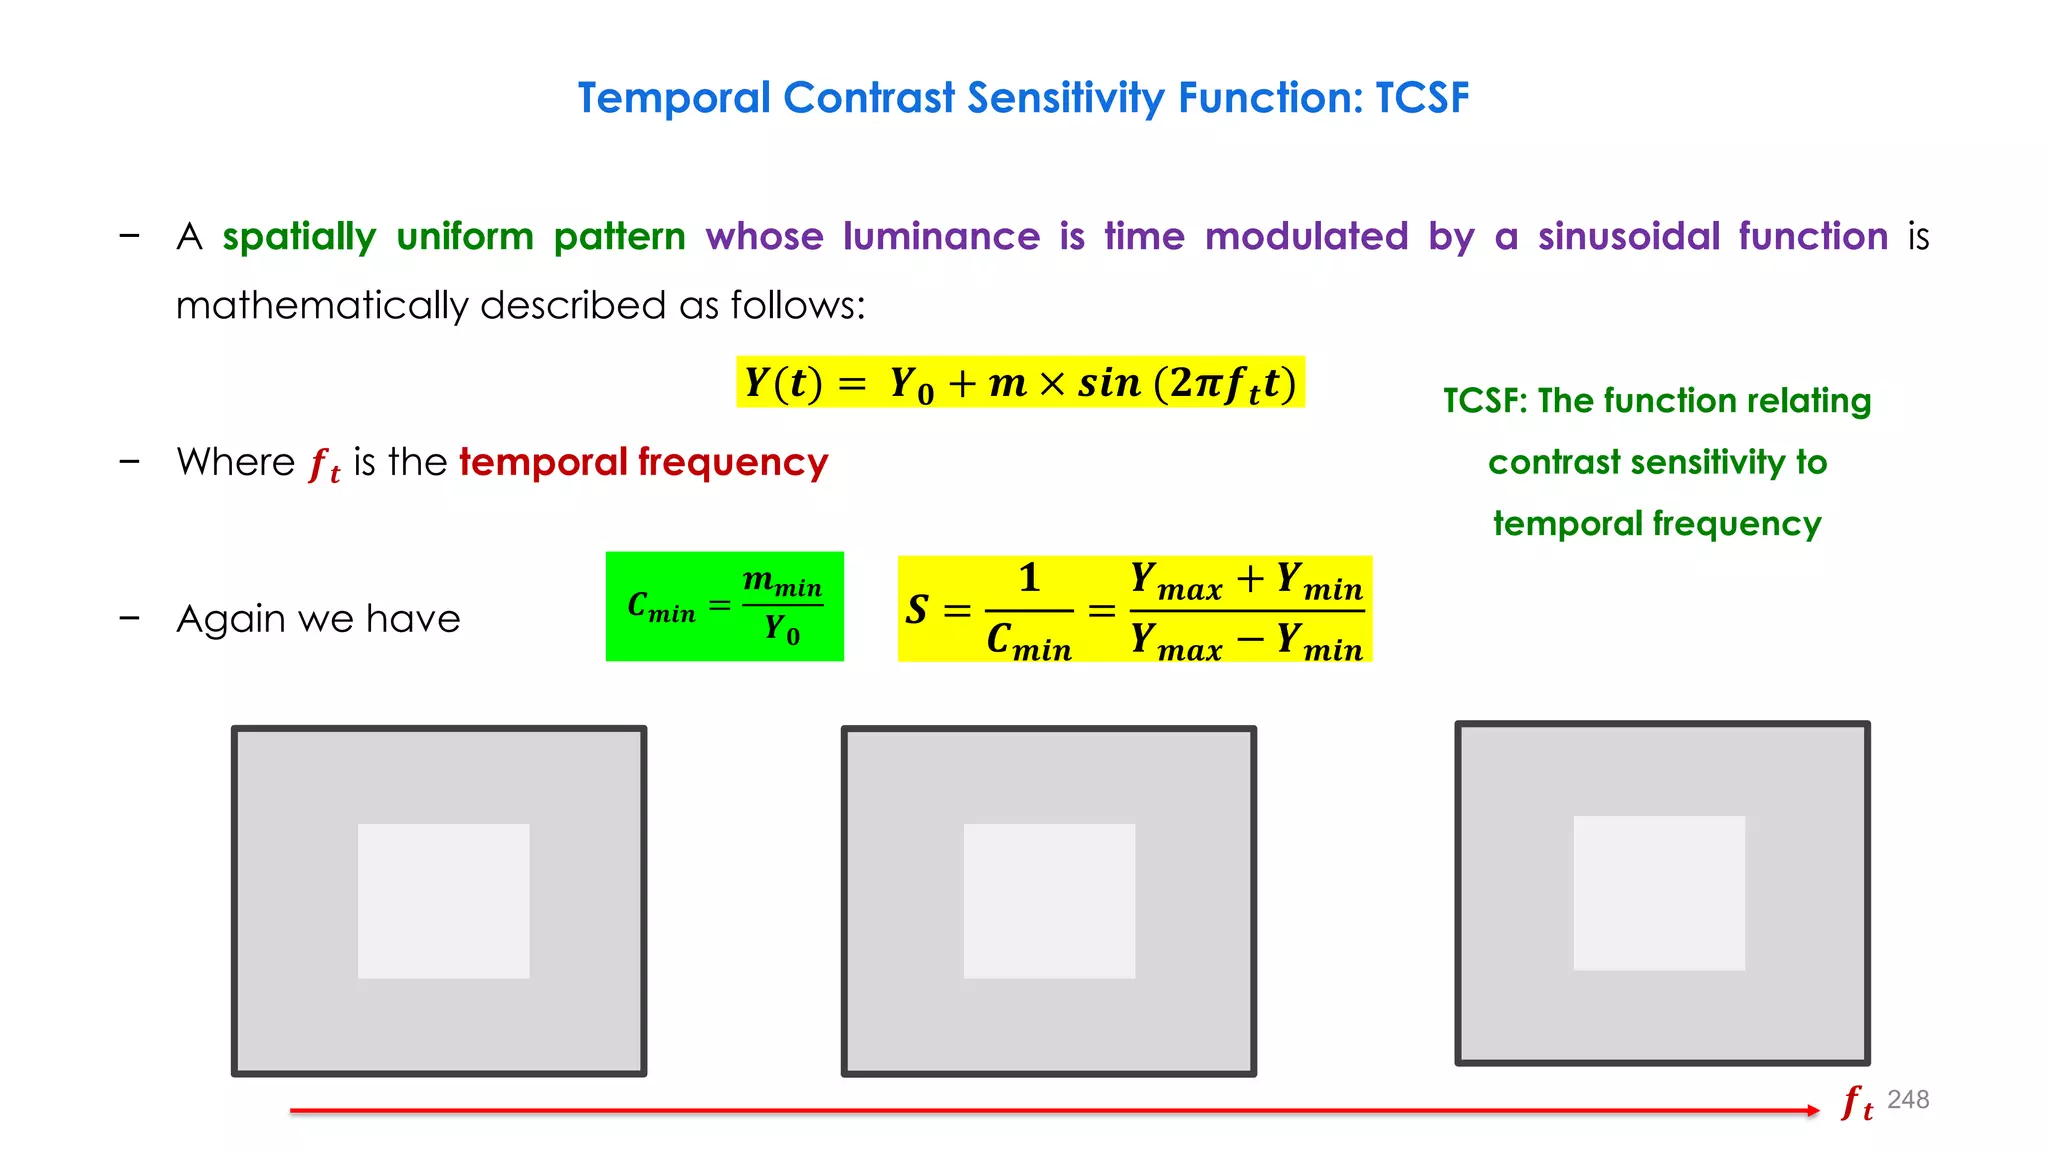
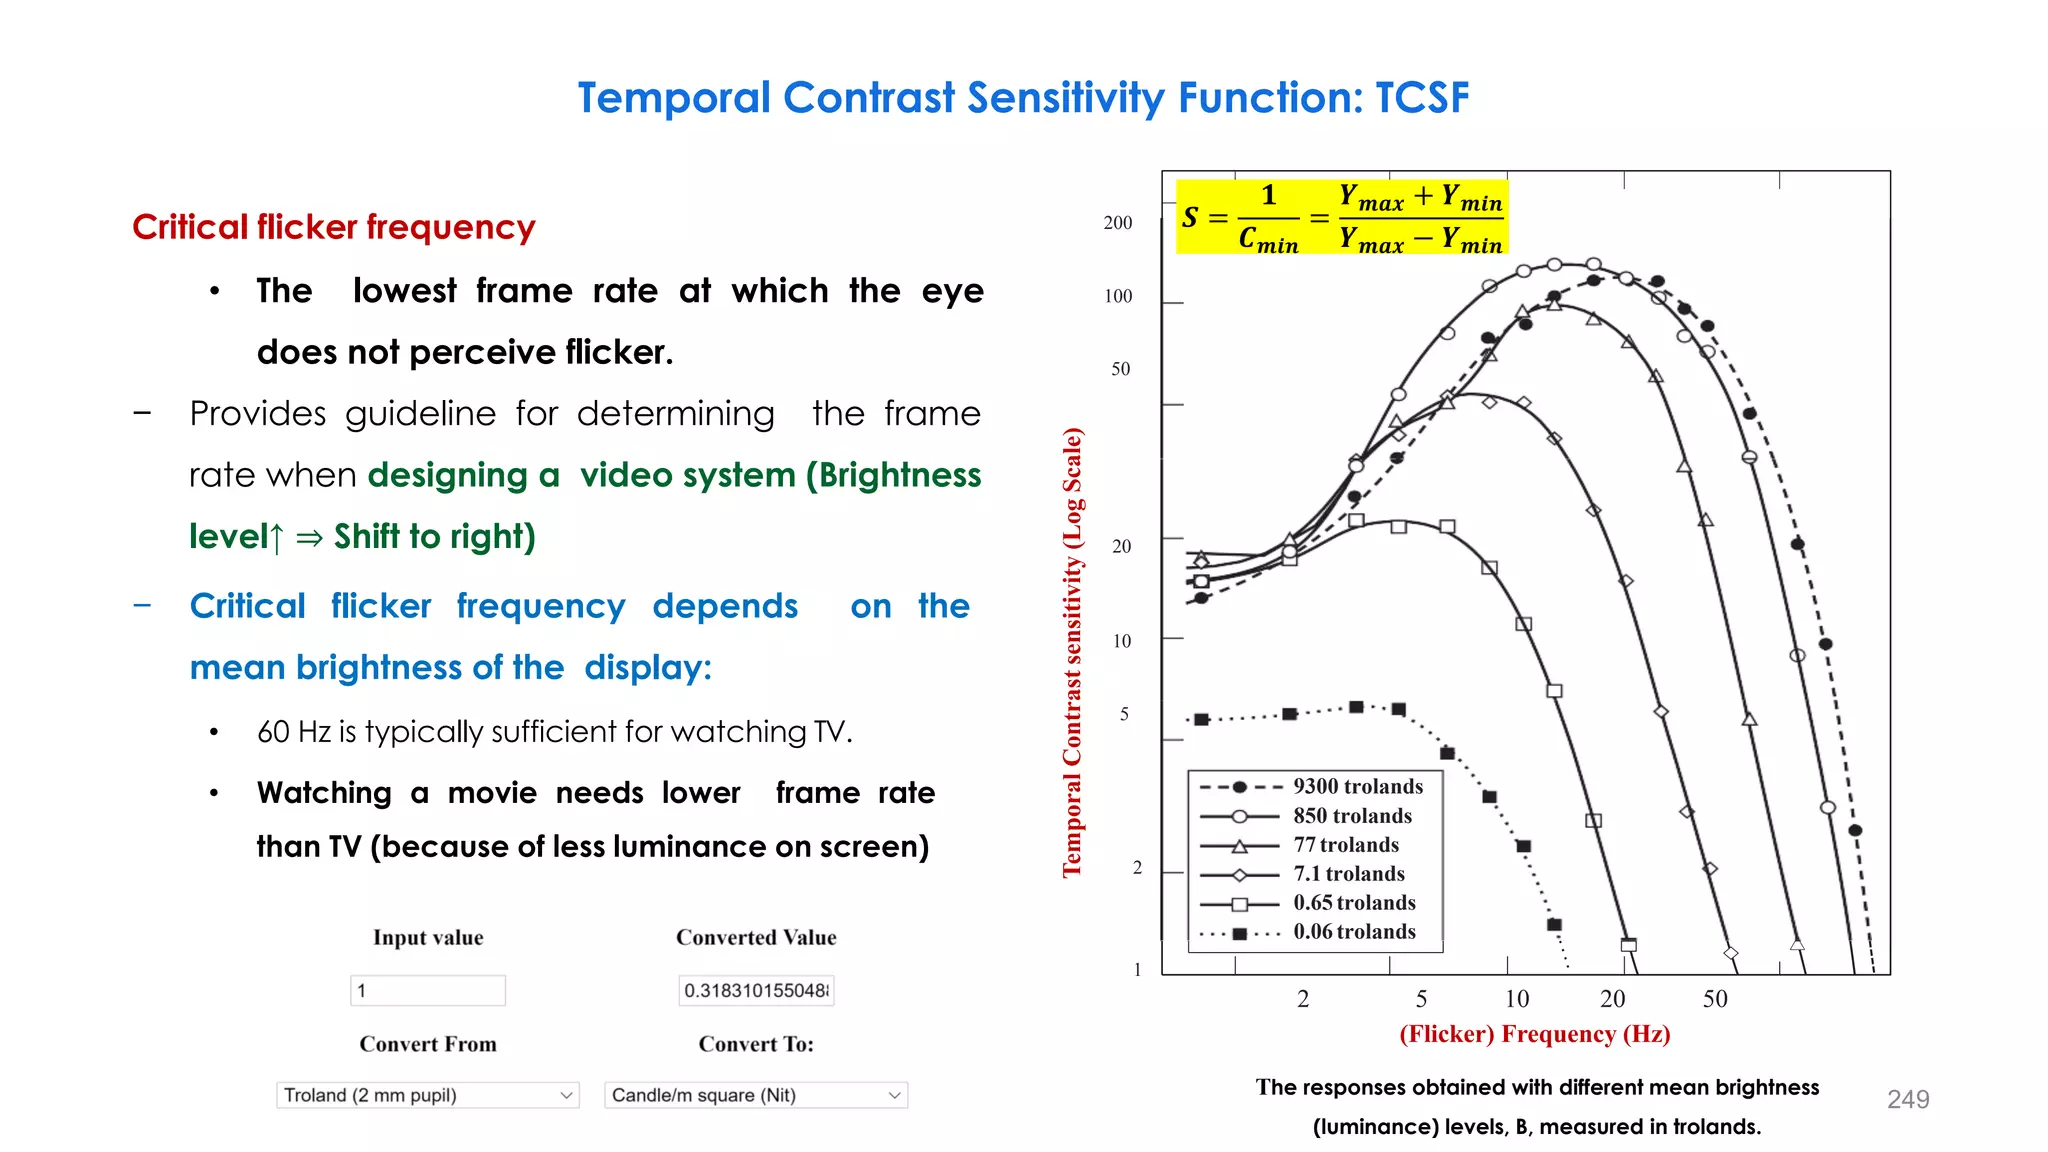
𝒀 𝒙, 𝒚, 𝒕 = 𝒀𝟎 + 𝒎 × 𝒔𝒊𝒏 [𝟐𝝅 𝒇𝒙𝒙 + 𝒇𝒚𝒚 + 𝝋𝟎] × 𝒔𝒊𝒏 (𝟐𝝅𝒇𝒕𝒕 + ƴ
𝝋𝟎)
𝒀 𝒙, 𝒚, 𝒕 = 𝒀𝟎 + 𝒎 × 𝒔𝒊𝒏 (𝟐𝝅𝒇𝒕𝒕 + 𝝋𝟎)
𝒀 𝒙, 𝒚, 𝒕 = 𝒀𝟎 + 𝒎 × 𝒔𝒊𝒏 [𝟐𝝅 𝒇𝒙𝒙 + 𝒇𝒚𝒚 + 𝝋𝟎]
225](https://image.slidesharecdn.com/hdrandwcgprinciplespart1-210615182237/75/HDR-and-WCG-Principles-Part-1-225-2048.jpg)
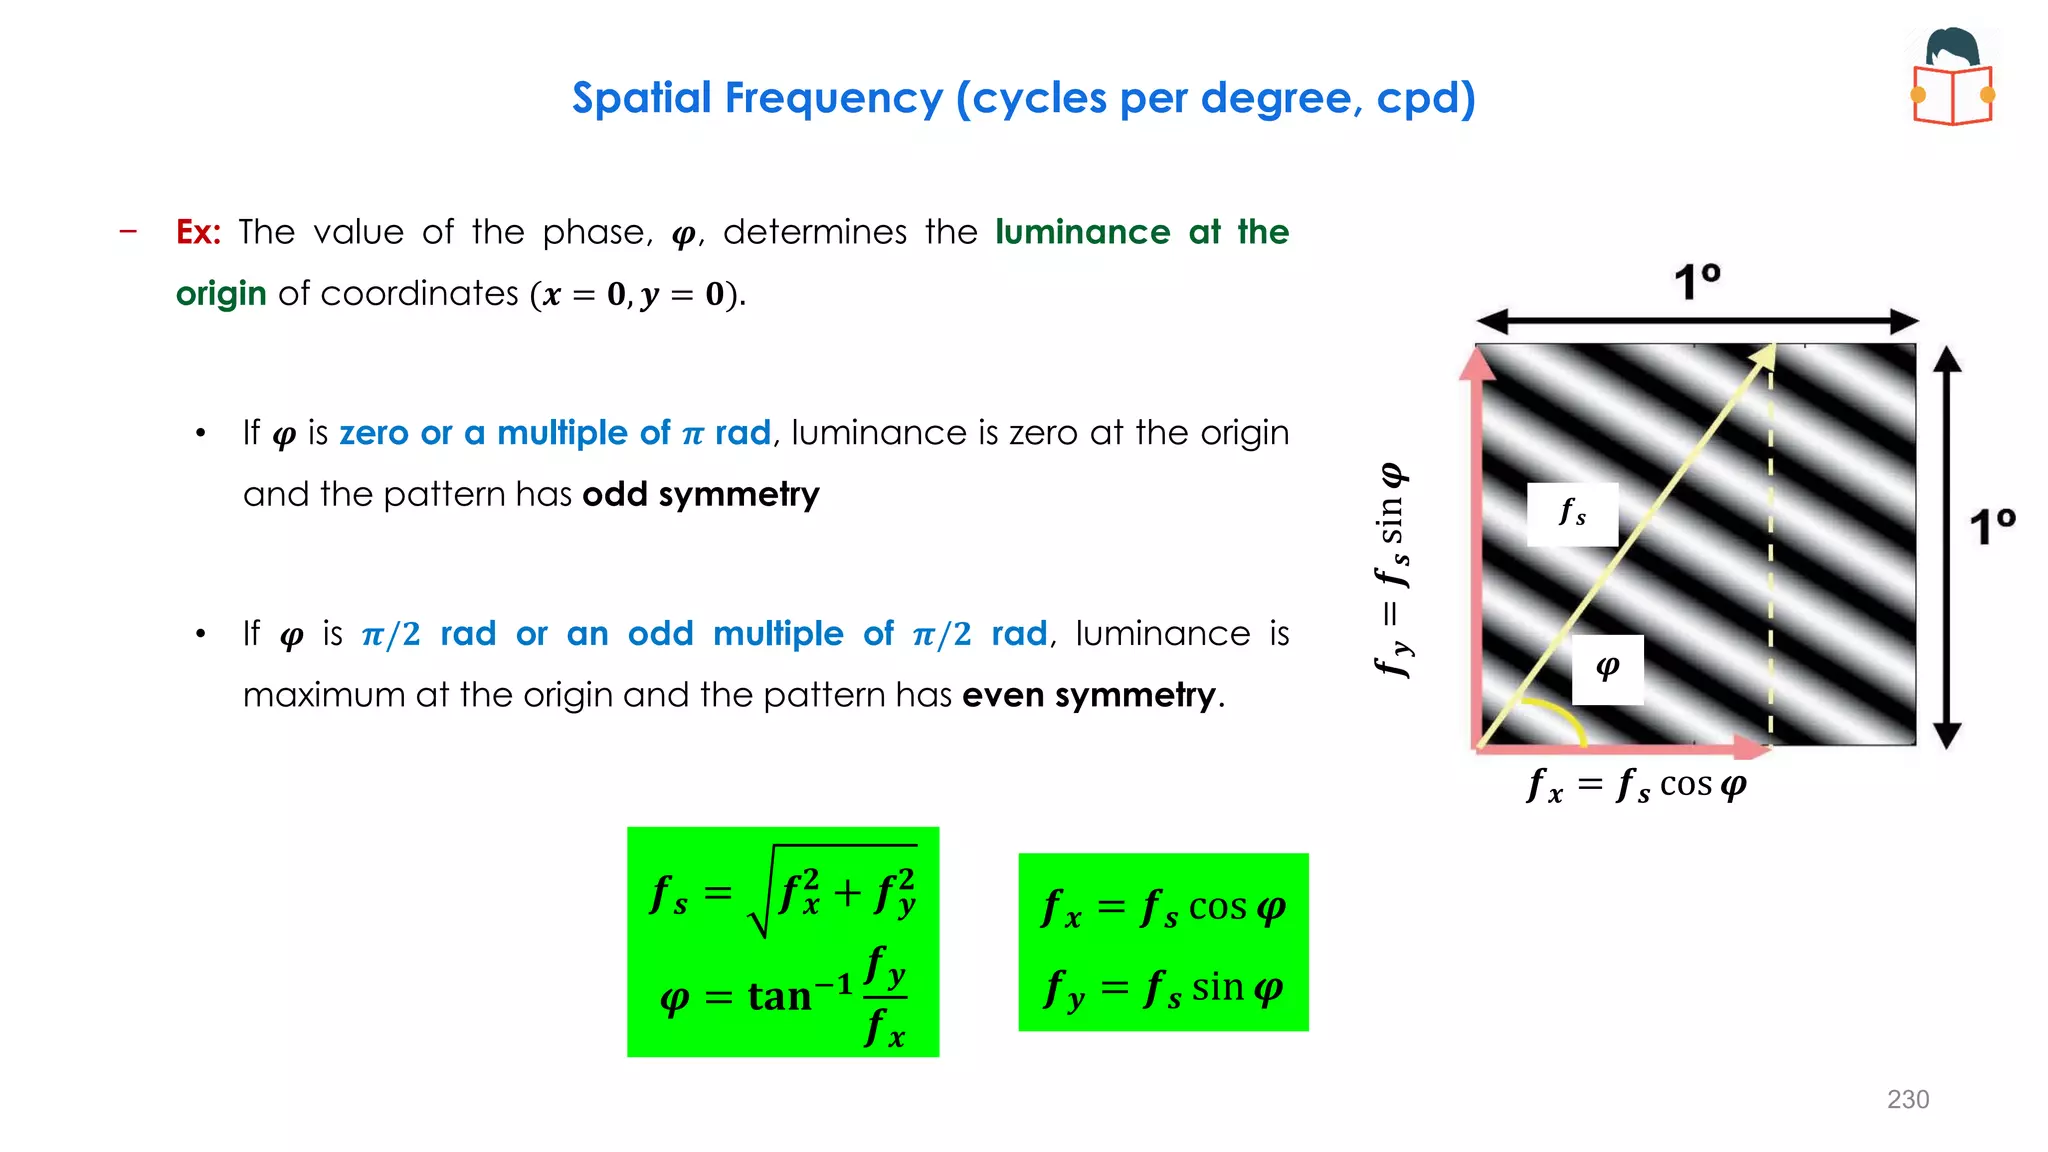
![− Previously defined spatial frequency depends on viewing distance.
− Angular frequency is what matters to the eye! (viewing distance is included in it)
𝜽 = 𝟐 𝐭𝐚𝐧−𝟏
𝒉
𝟐𝒅
𝑹𝒂𝒅 ≈
𝟐𝒉
𝟐𝒅
𝑹𝒂𝒅 =
𝟏𝟖𝟎
𝝅
.
𝒉
𝒅
(𝑫𝒆𝒈𝒓𝒆𝒆)
𝒇𝒔[𝒄𝒑𝒅] =
𝒇𝒔[𝑪𝒚𝒄𝒍𝒆𝒔/𝑼𝒏𝒊𝒕 𝑫𝒊𝒔𝒕𝒂𝒏𝒄𝒆]
𝜽
=
𝝅
𝟏𝟖𝟎
.
𝒅
𝒉
𝒇𝒔[𝑪𝒚𝒄𝒍𝒆𝒔/𝑼𝒏𝒊𝒕 𝑫𝒊𝒔𝒕𝒂𝒏𝒄𝒆]
Spatial Frequency (cycles per degree, cpd)
𝒉
𝒅
𝜽
228](https://image.slidesharecdn.com/hdrandwcgprinciplespart1-210615182237/75/HDR-and-WCG-Principles-Part-1-228-2048.jpg)
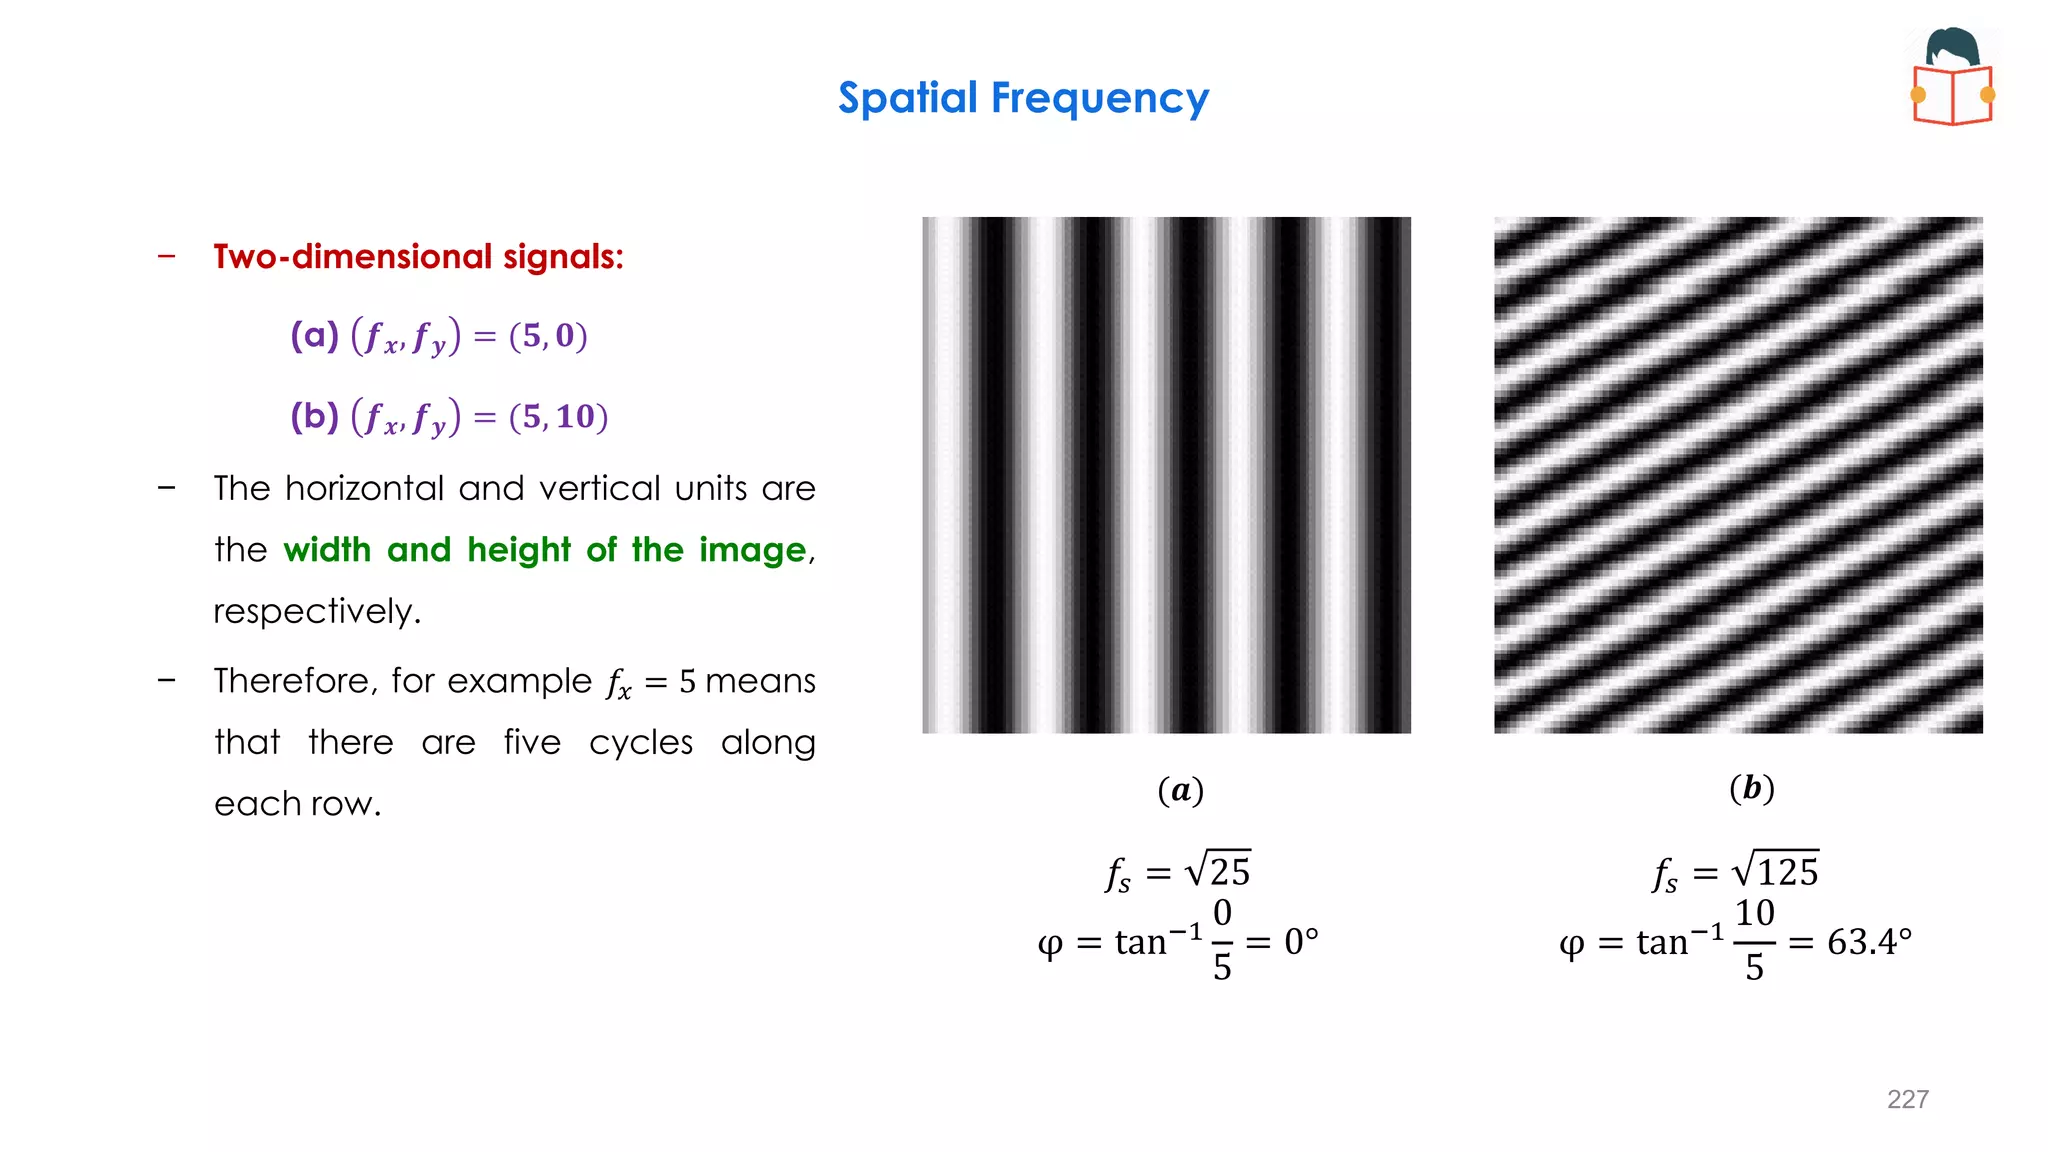
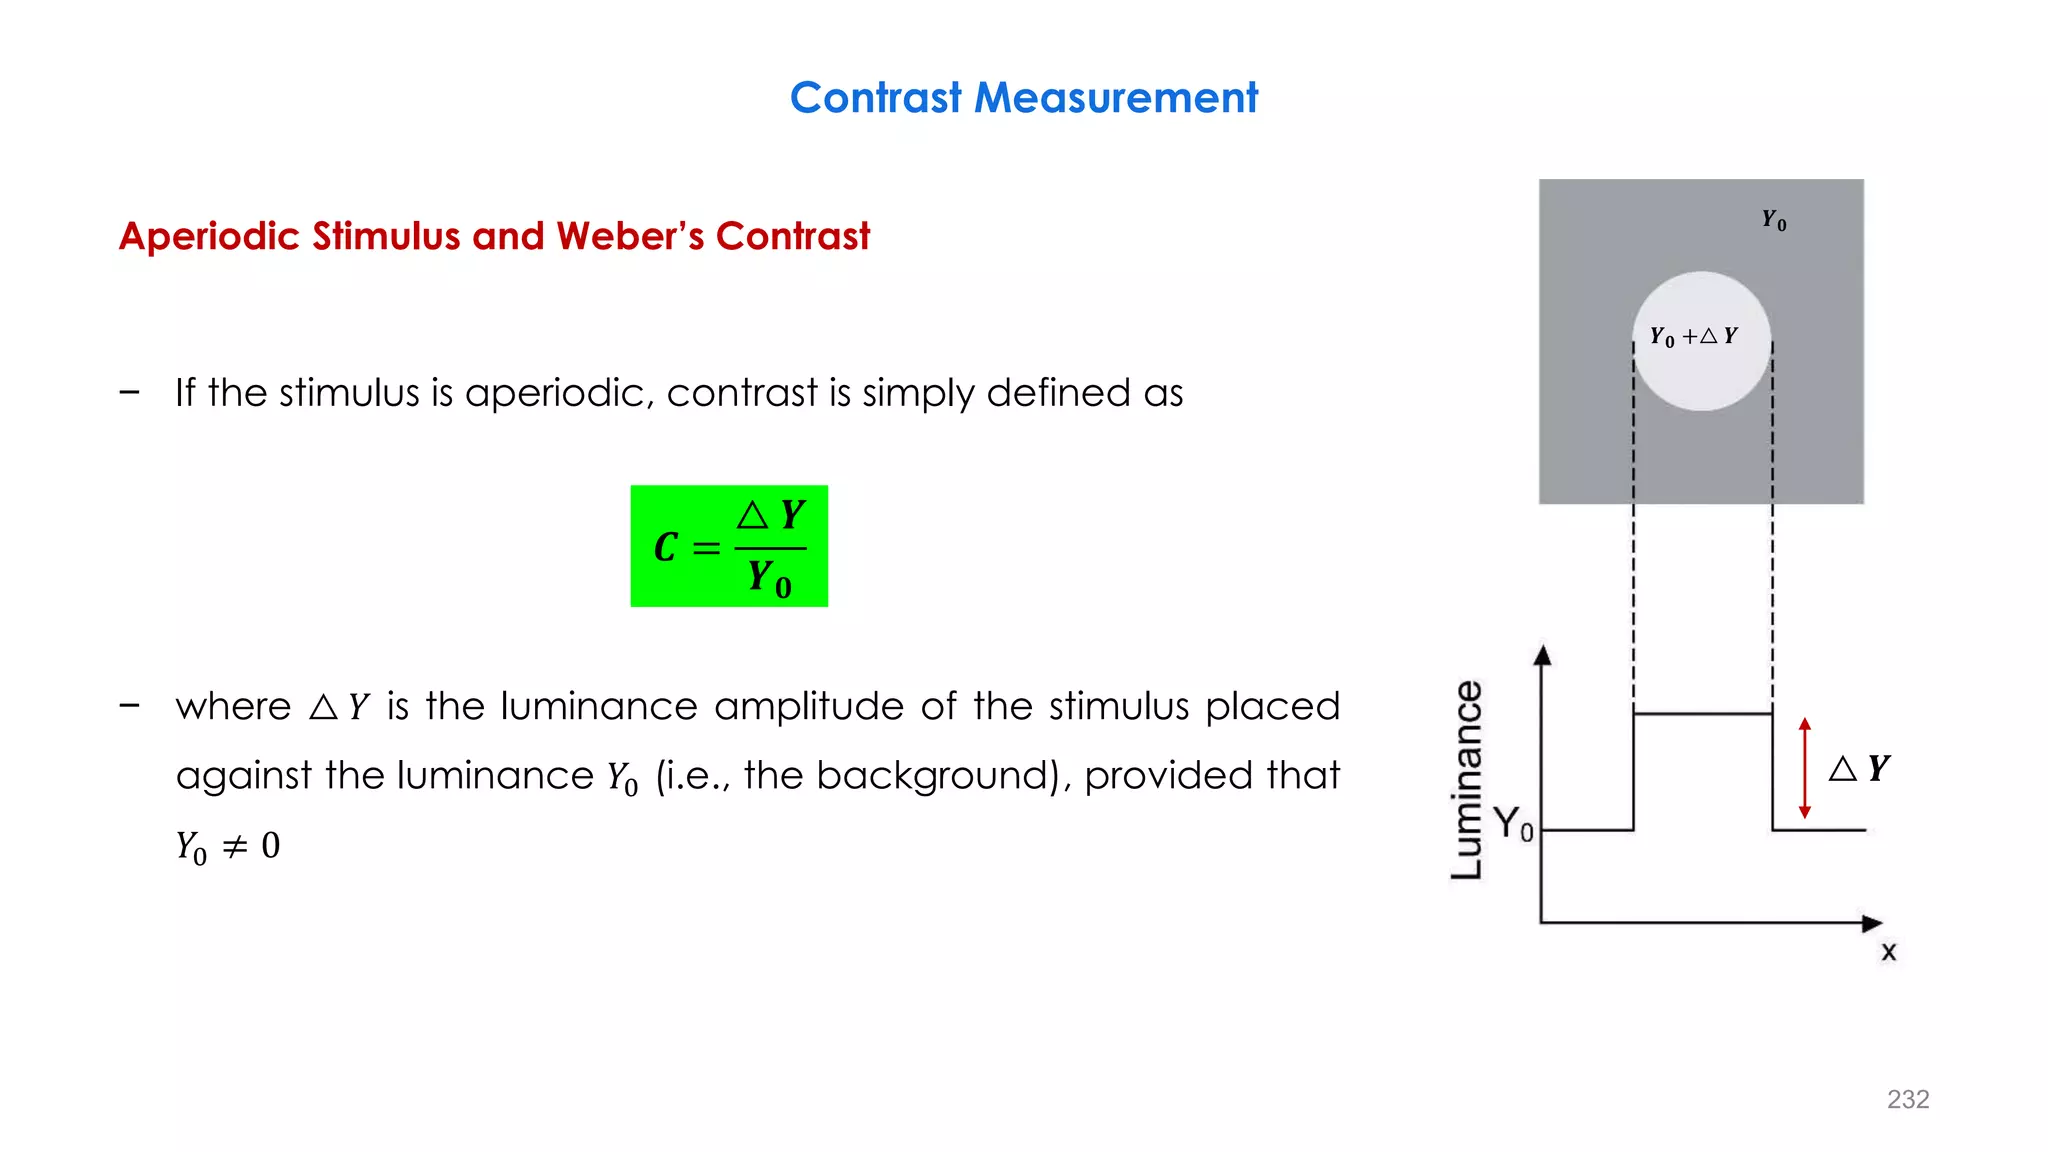
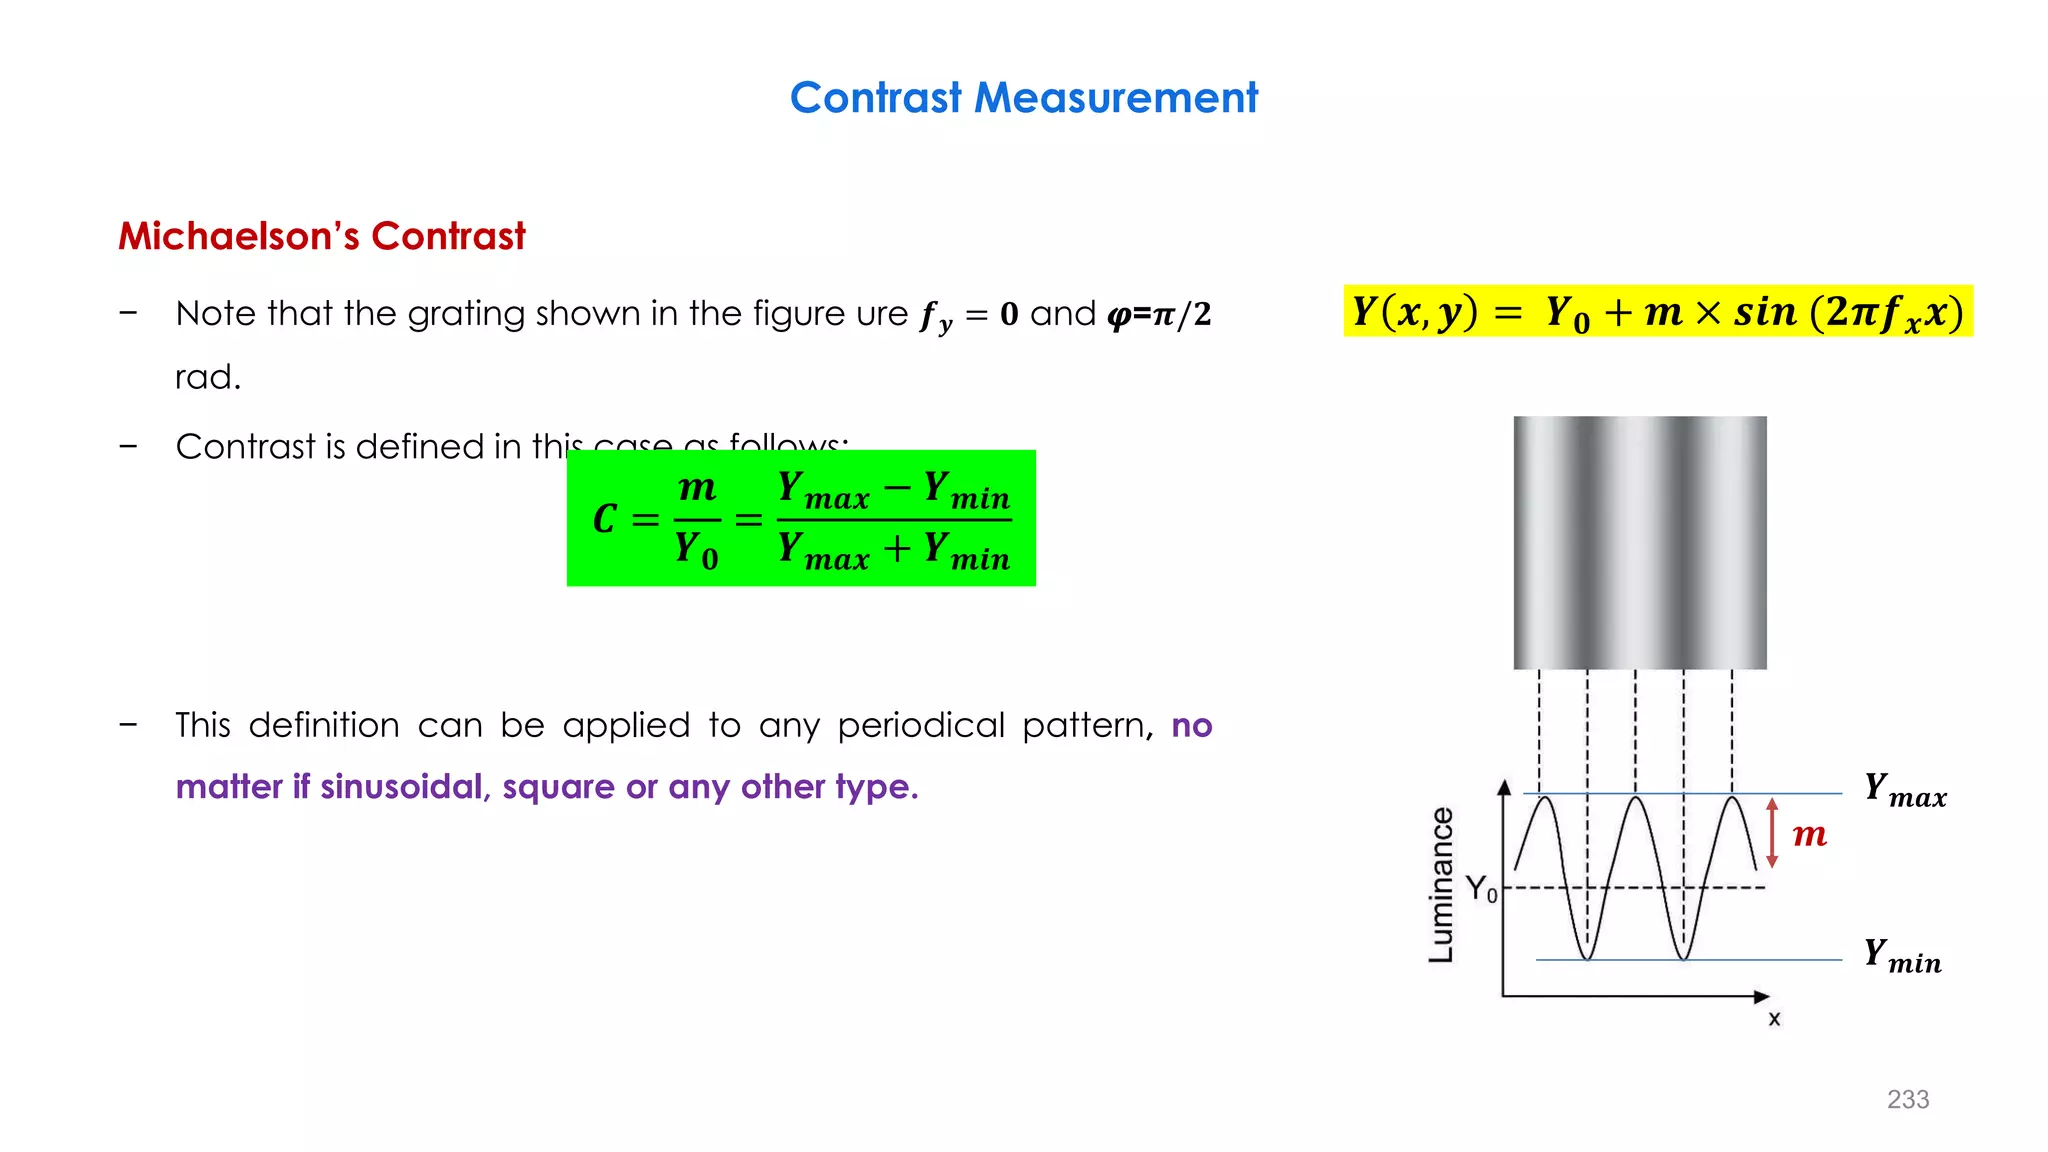
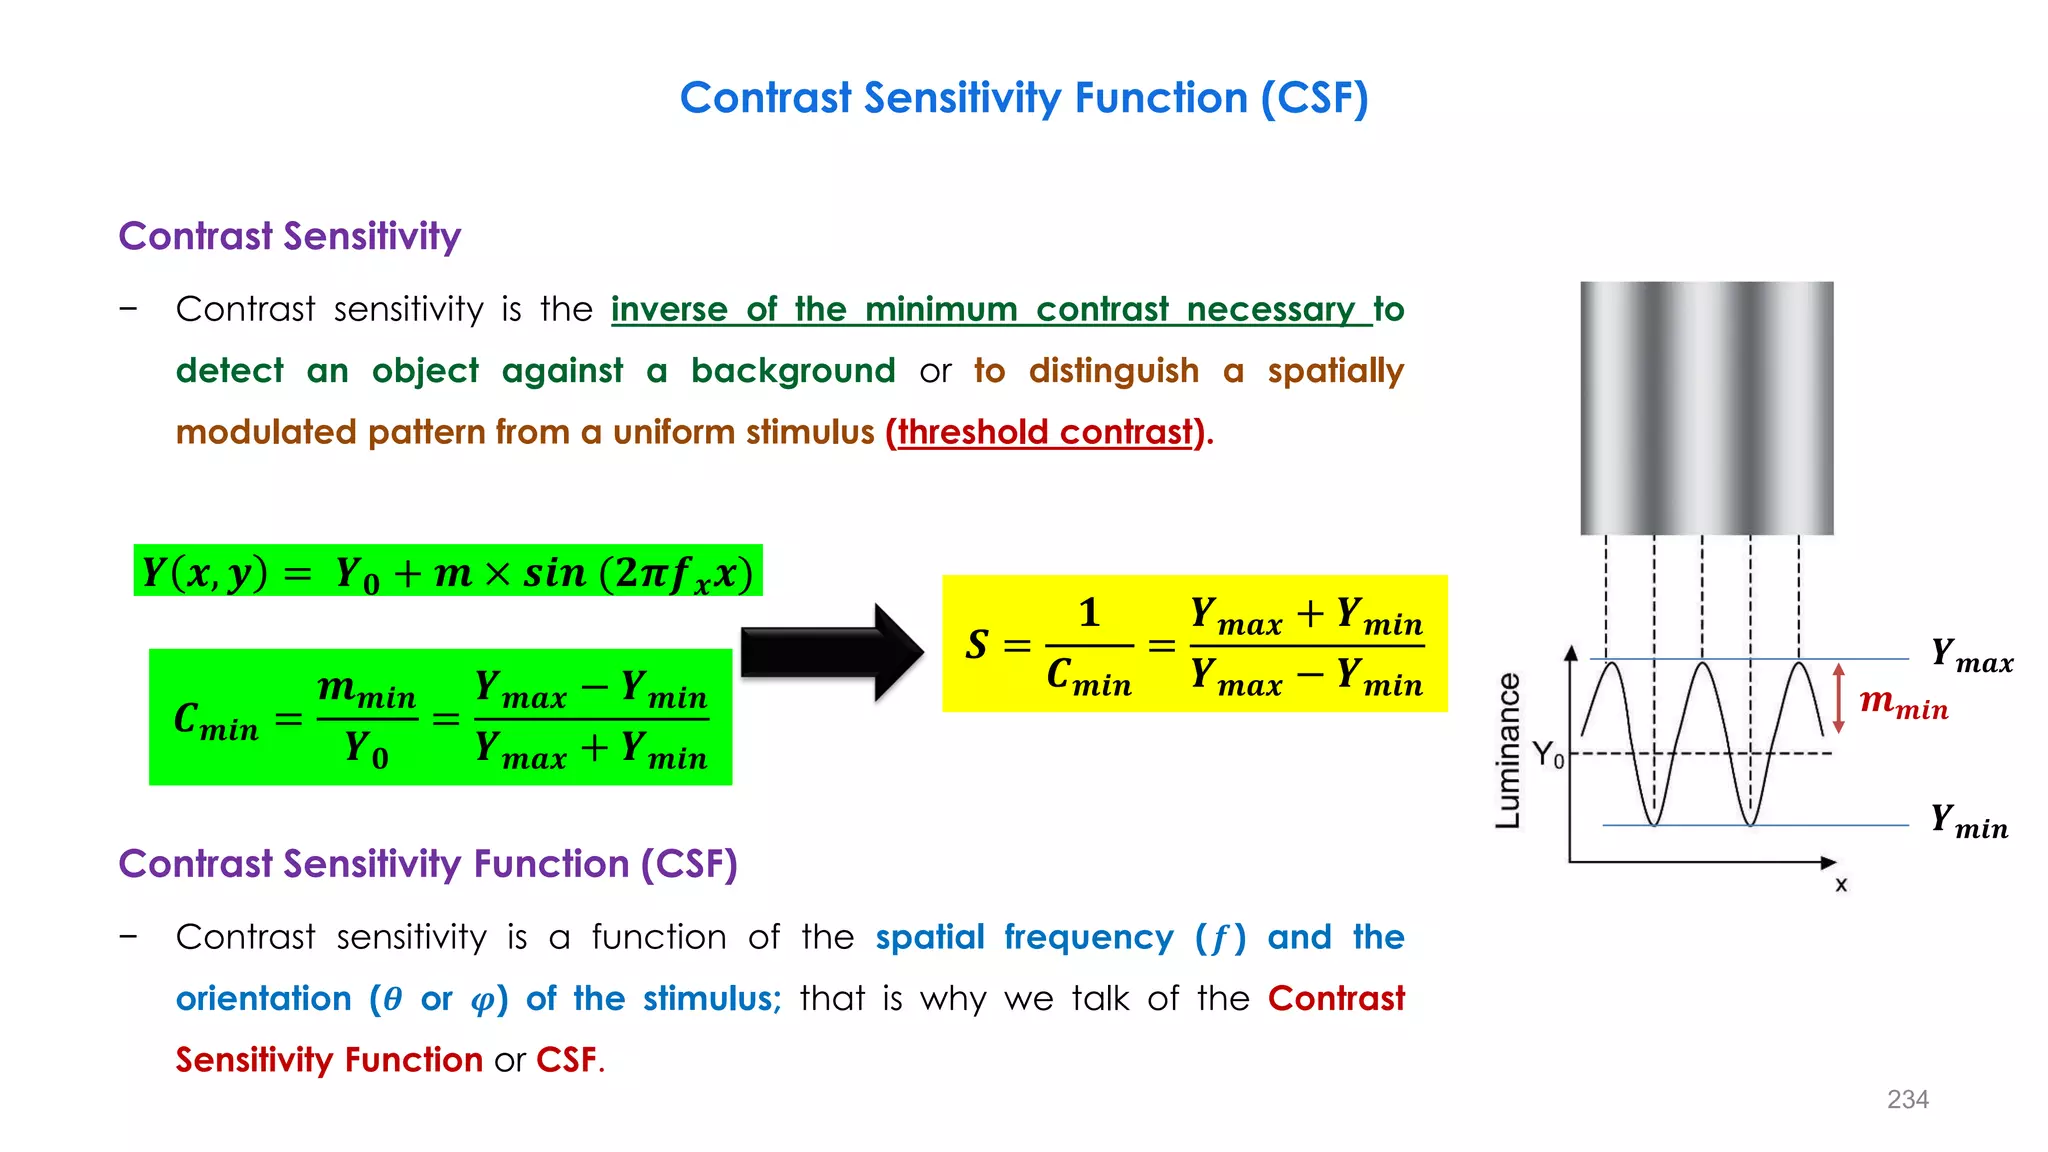
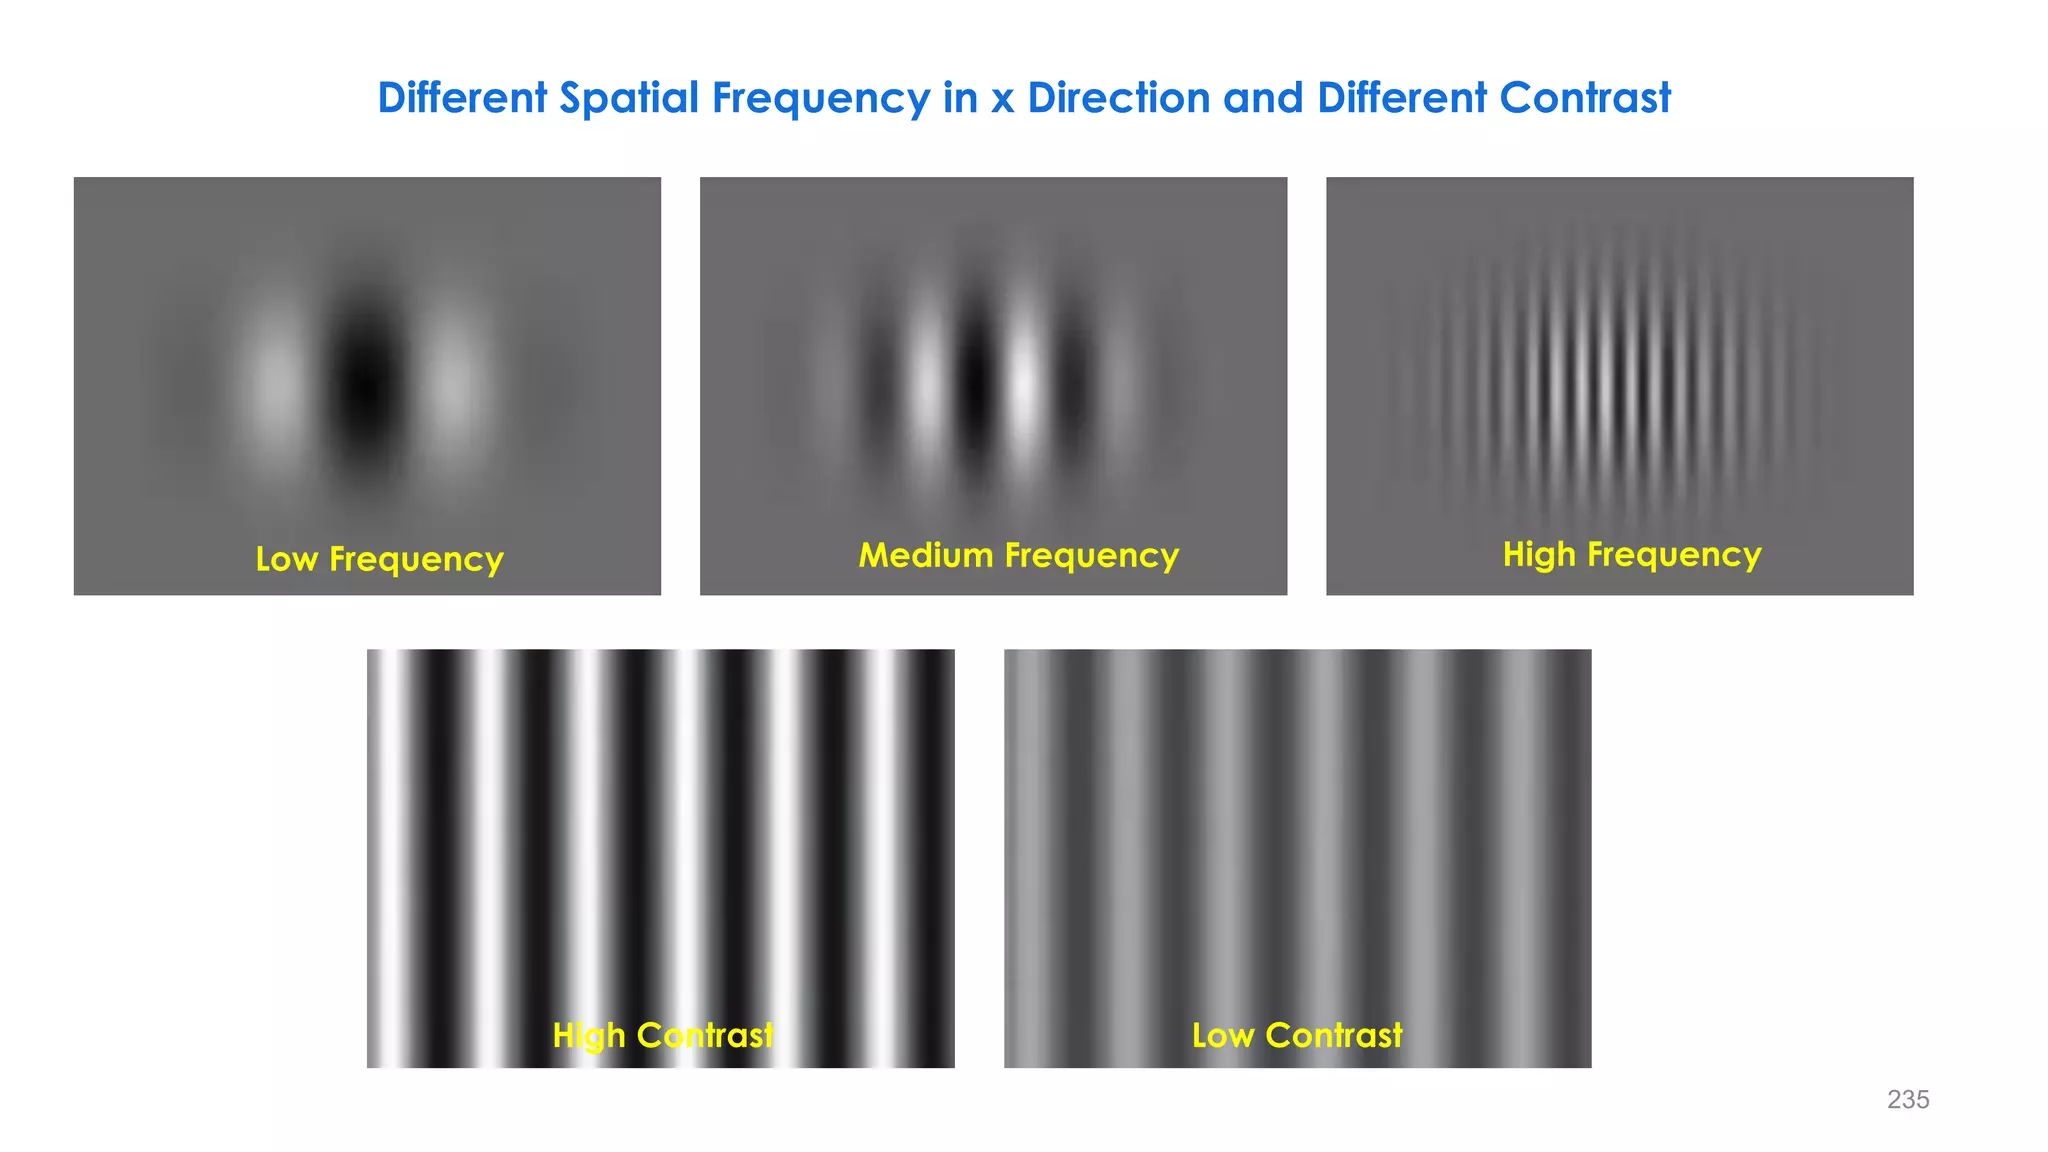
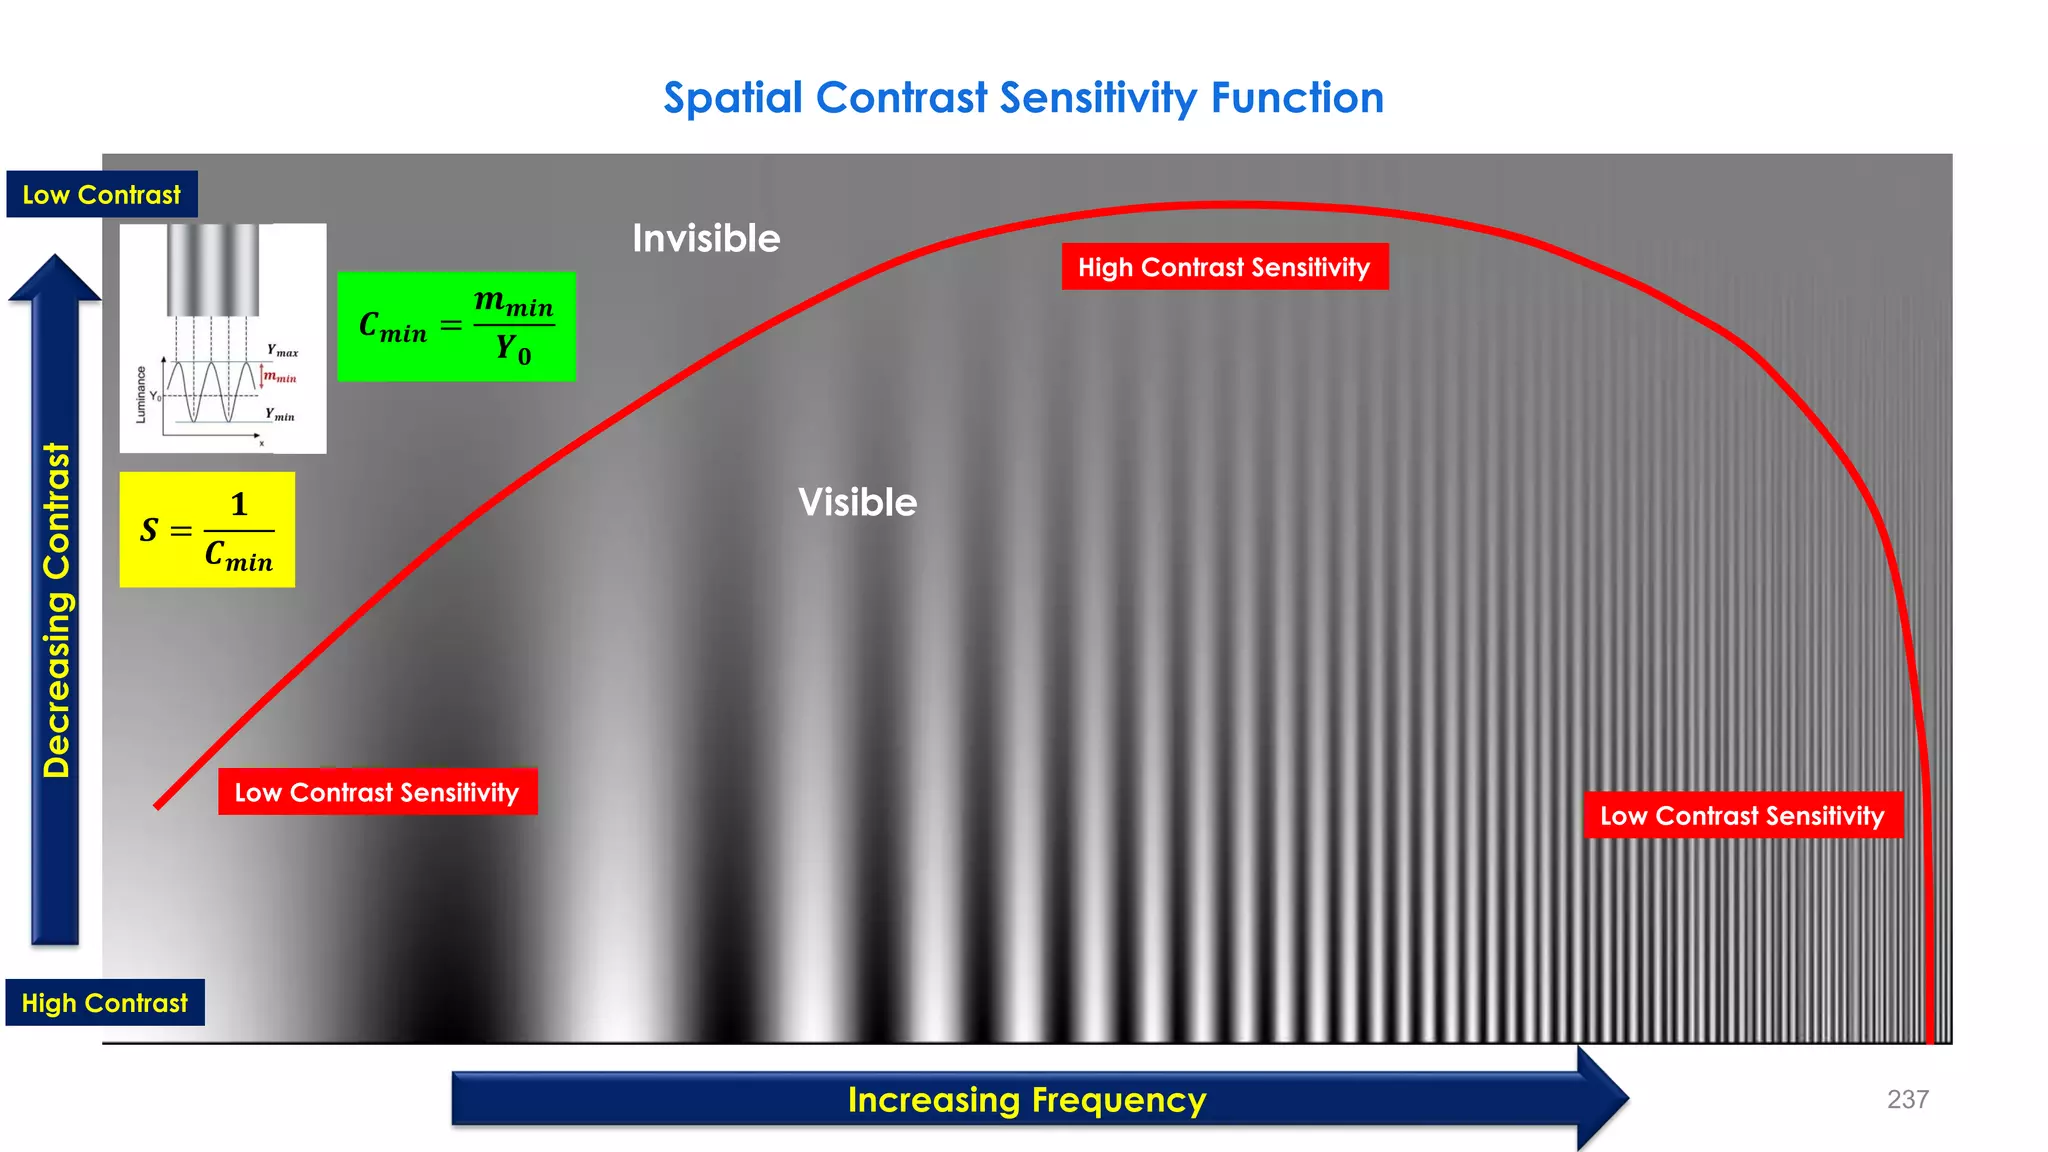
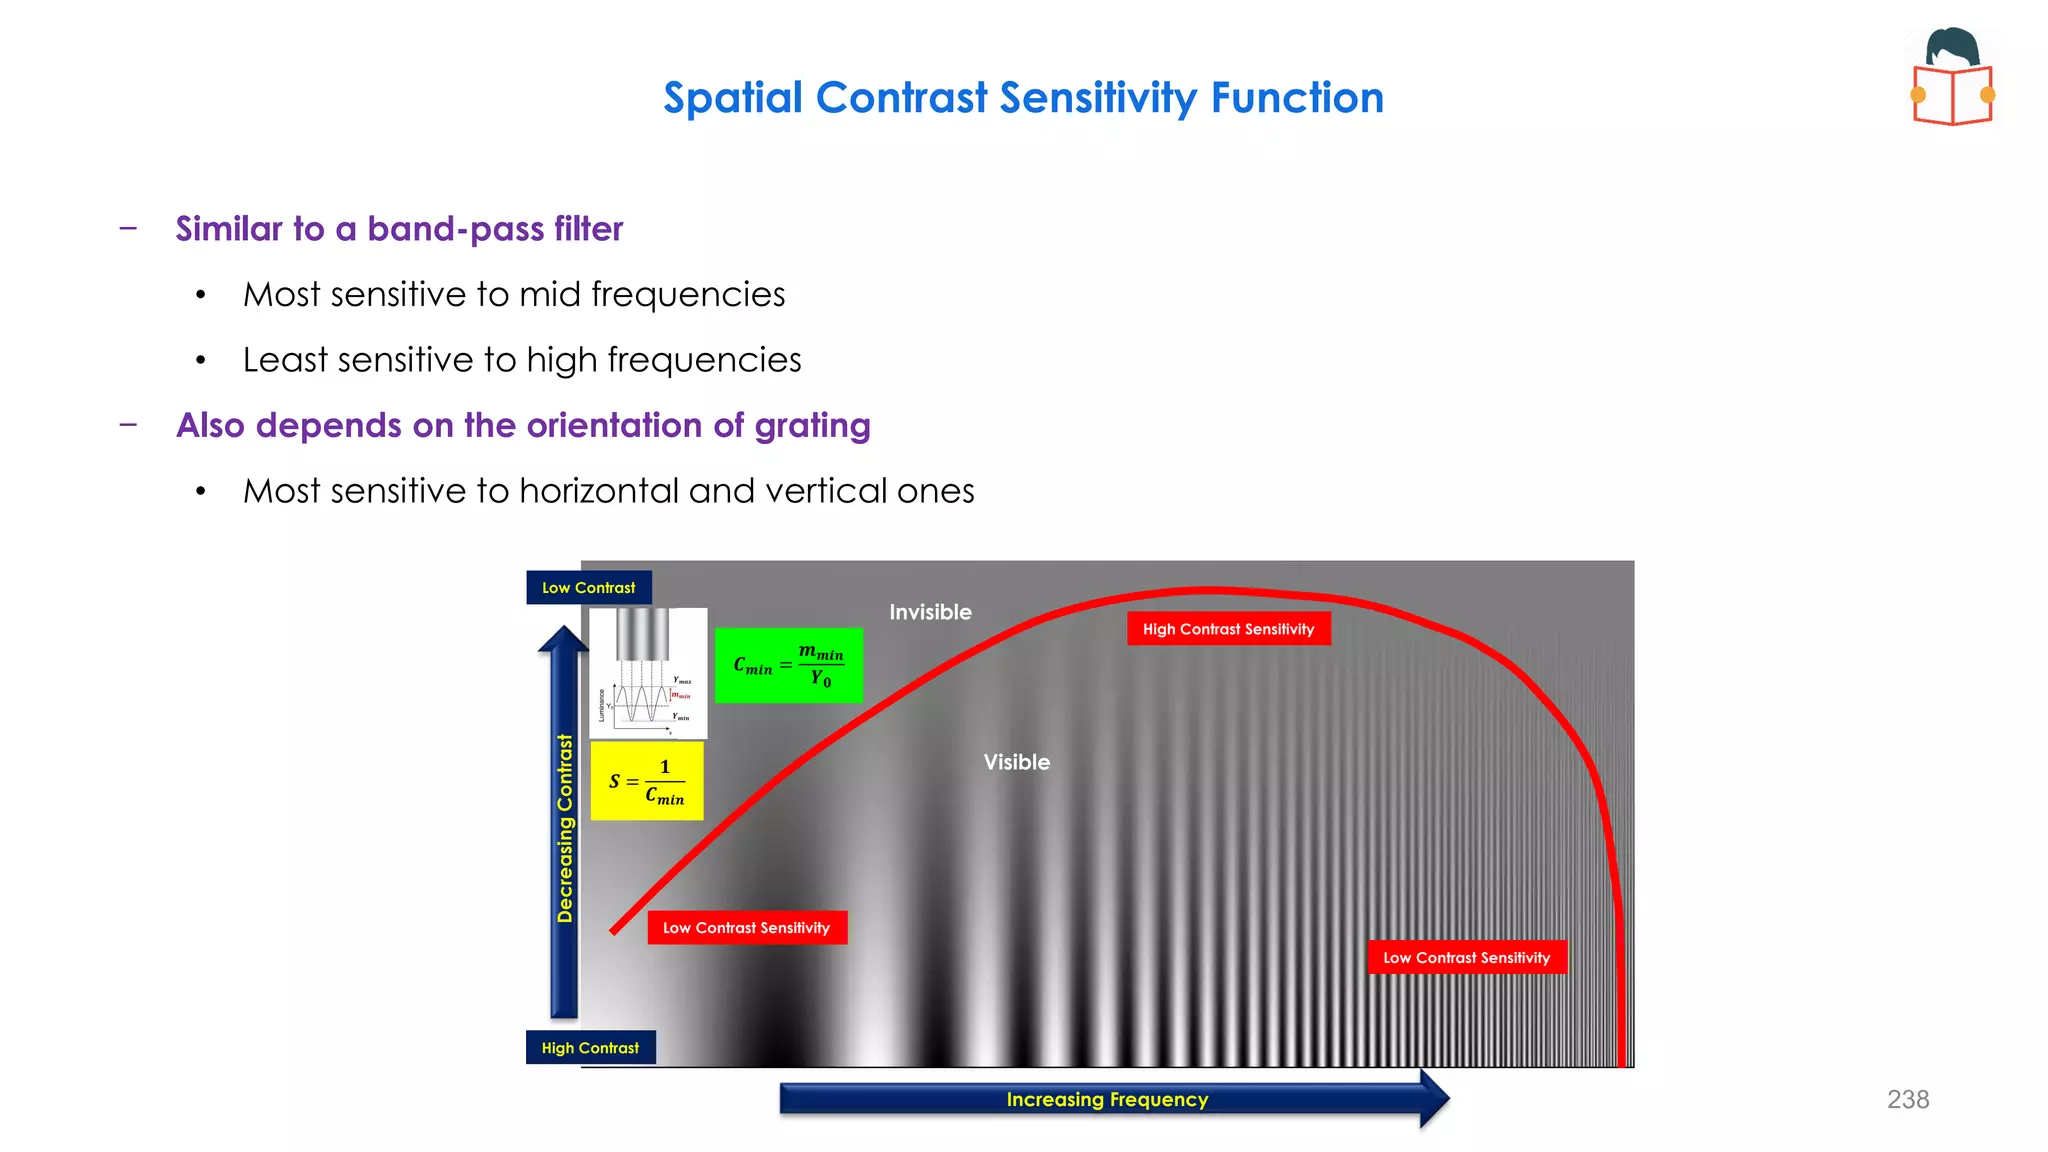
![− If the stimulus is a spatially periodical pattern (or grating), it is defined
by its spatial frequency, which is the number of cycles per unit of
subtended angle.
− The luminance profile of a sinusoidal grating of frequency 𝒇 oriented
along a spatial direction defined by the angle 𝝋 can be written as:
− Where 𝒀𝟎 is the mean luminance of the grating, 𝒎 is its amplitude
and 𝒇𝒙 and 𝒇𝒚 are its spatial frequencies along the 𝒙 and 𝒚
directions, respectively (measured in cycles per degree, cpd) ; that
is:
𝒀 𝒙, 𝒚 = 𝒀𝟎 + 𝒎 × 𝒔𝒊𝒏 [𝟐𝝅 𝒇𝒙𝒙 + 𝒇𝒚𝒚 ]
𝒇𝒔 = 𝒇𝒙
𝟐
+ 𝒇𝒚
𝟐
𝝋 = 𝐭𝐚𝐧−𝟏
𝒇𝒚
𝒇𝒙
𝒇𝒙 = 𝒇𝒔 cos 𝝋
𝒇𝒚 = 𝒇𝒔 sin 𝝋
𝒇𝒙 = 𝒇𝒔 cos 𝝋
𝒇
𝒚
=
𝒇
𝒔
sin
𝝋
𝒇𝒔
𝝋
Spatial Frequency (cycles per degree, cpd)
229](https://image.slidesharecdn.com/hdrandwcgprinciplespart1-210615182237/75/HDR-and-WCG-Principles-Part-1-229-2048.jpg)
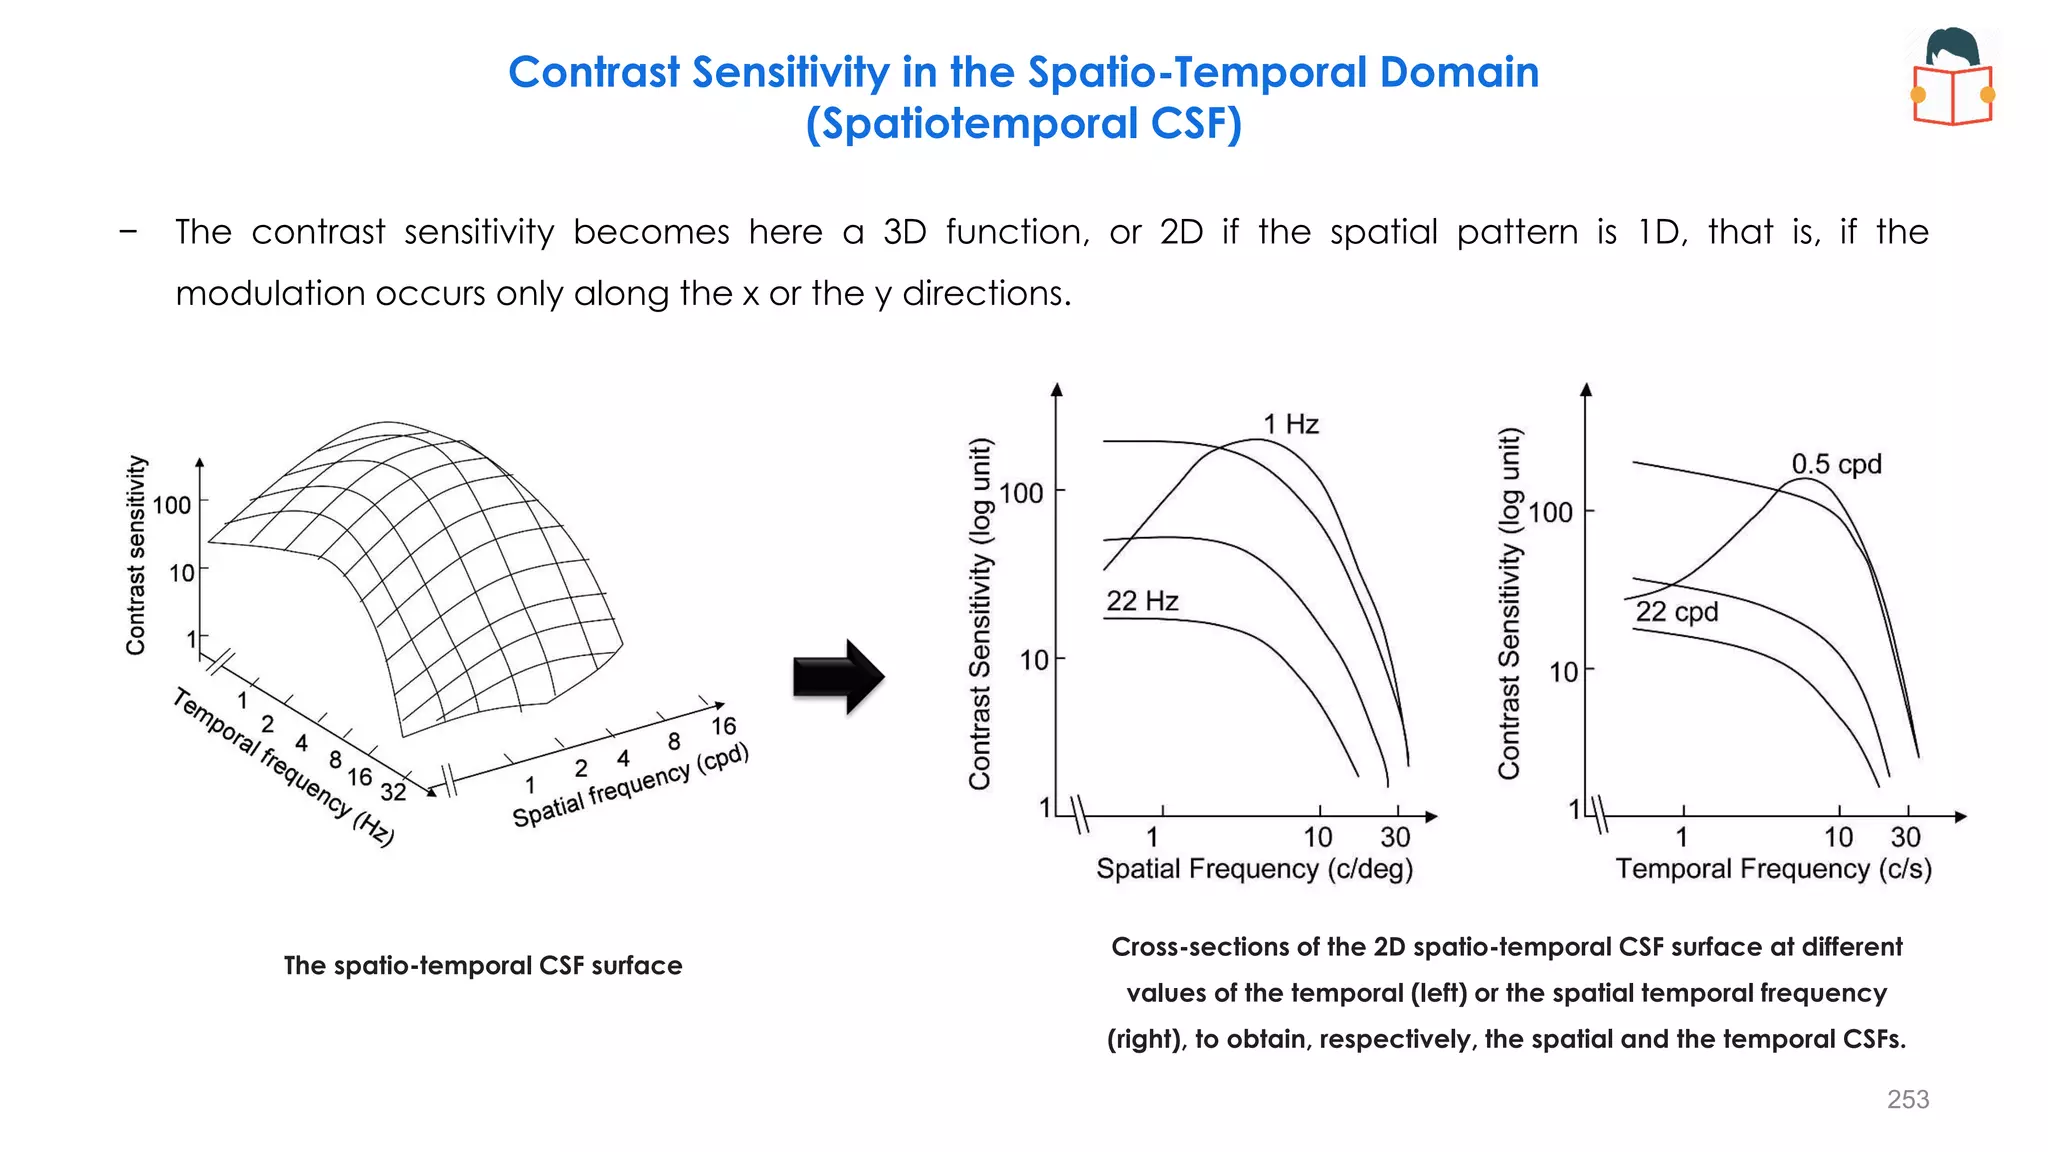
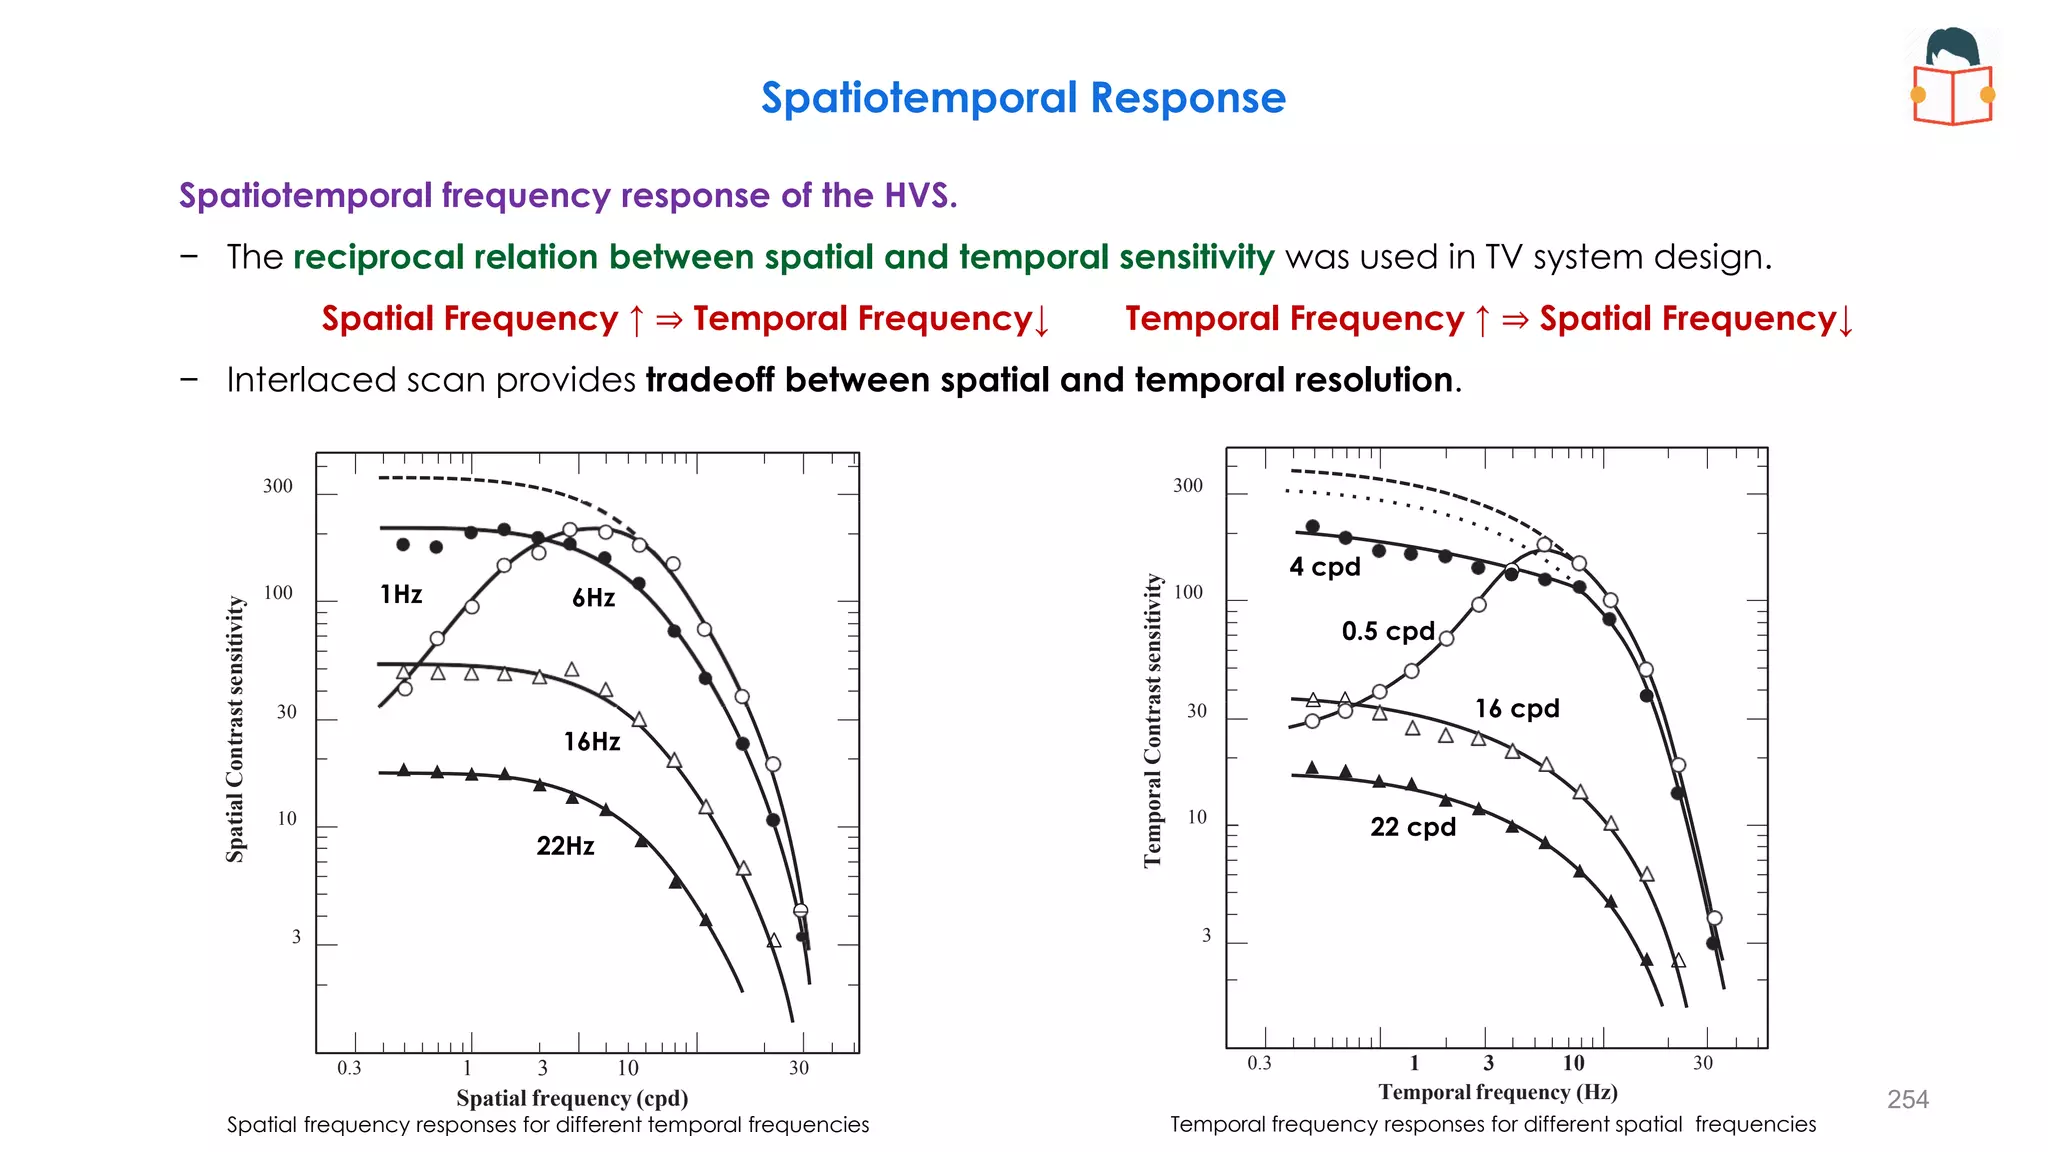
![𝒀 𝒙, 𝒚, 𝒕 = 𝒀𝟎 + 𝒎 × 𝒔𝒊𝒏 [𝟐𝝅 𝒇𝒙𝒙 + 𝒇𝒚𝒚 ] × 𝒔𝒊𝒏 (𝟐𝝅𝒇𝒕𝒕)
Contrast Sensitivity in the Spatio-Temporal Domain
A luminance pattern that changes as a function of position (𝒙, 𝒚) and time, 𝒕, is a spatio-temporal pattern.
− Spatio-temporal patterns usually employed as stimuli are counterphase gratings and travelling gratings.
− In counterphase sine gratings, luminance is sinusoidally modulated both in space (with frequencies 𝒇𝒙, 𝒇𝒚)
and in time (with frequency 𝒇𝒕).
250](https://image.slidesharecdn.com/hdrandwcgprinciplespart1-210615182237/75/HDR-and-WCG-Principles-Part-1-250-2048.jpg)
![Contrast Sensitivity in the Spatio-Temporal Domain
− In counterphase sine gratings, if 𝒇𝒚 = 0 , the corresponding luminance profile would be:
𝒀 𝒙, 𝒚, 𝒕 = 𝒀𝟎 + 𝒎 × 𝒔𝒊𝒏 (𝟐𝝅𝒇𝒙𝒙) 𝒔𝒊𝒏 (𝟐𝝅𝒇𝒕𝒕) 𝒀 𝒙, 𝒚, 𝒕 = 𝒀𝟎 + 𝒎 × 𝒔𝒊𝒏 [𝟐𝝅 𝒇𝒙𝒙 + 𝒇𝒕𝒕 )]
Stationary Sinusoid Counterphase Flickering Sinusoid
251](https://image.slidesharecdn.com/hdrandwcgprinciplespart1-210615182237/75/HDR-and-WCG-Principles-Part-1-251-2048.jpg)
![Contrast Sensitivity in the Spatio-Temporal Domain
A travelling grating is a spatial pattern that moves with a given velocity, 𝒗.
− If we assume 𝒇𝒚 = 0 , the luminance profile would be:
− where 𝒇𝒕 = 𝒗 × 𝒇𝒙 is the temporal frequency of the luminance modulation caused by the motion at each
point (𝑥, 𝑦) of the pattern
− The sign (±) accompanying the variable 𝑣 indicates whether the grating is moving towards the left or the
right, respectively.
𝒀 𝒙, 𝒚, 𝒕 = 𝒀𝟎 + 𝒎 × 𝒔𝒊𝒏 [𝟐𝝅 𝒇𝒙𝒙 + 𝒇𝒕𝒕 ]
𝒀 𝒙, 𝒚, 𝒕 = 𝒀𝟎 + 𝒎 × 𝒔𝒊𝒏 [𝟐𝝅𝒇𝒙 𝒙 ± 𝒗𝒕 ]
𝒇𝒕 = 𝒗 × 𝒇𝒙
252](https://image.slidesharecdn.com/hdrandwcgprinciplespart1-210615182237/75/HDR-and-WCG-Principles-Part-1-252-2048.jpg)
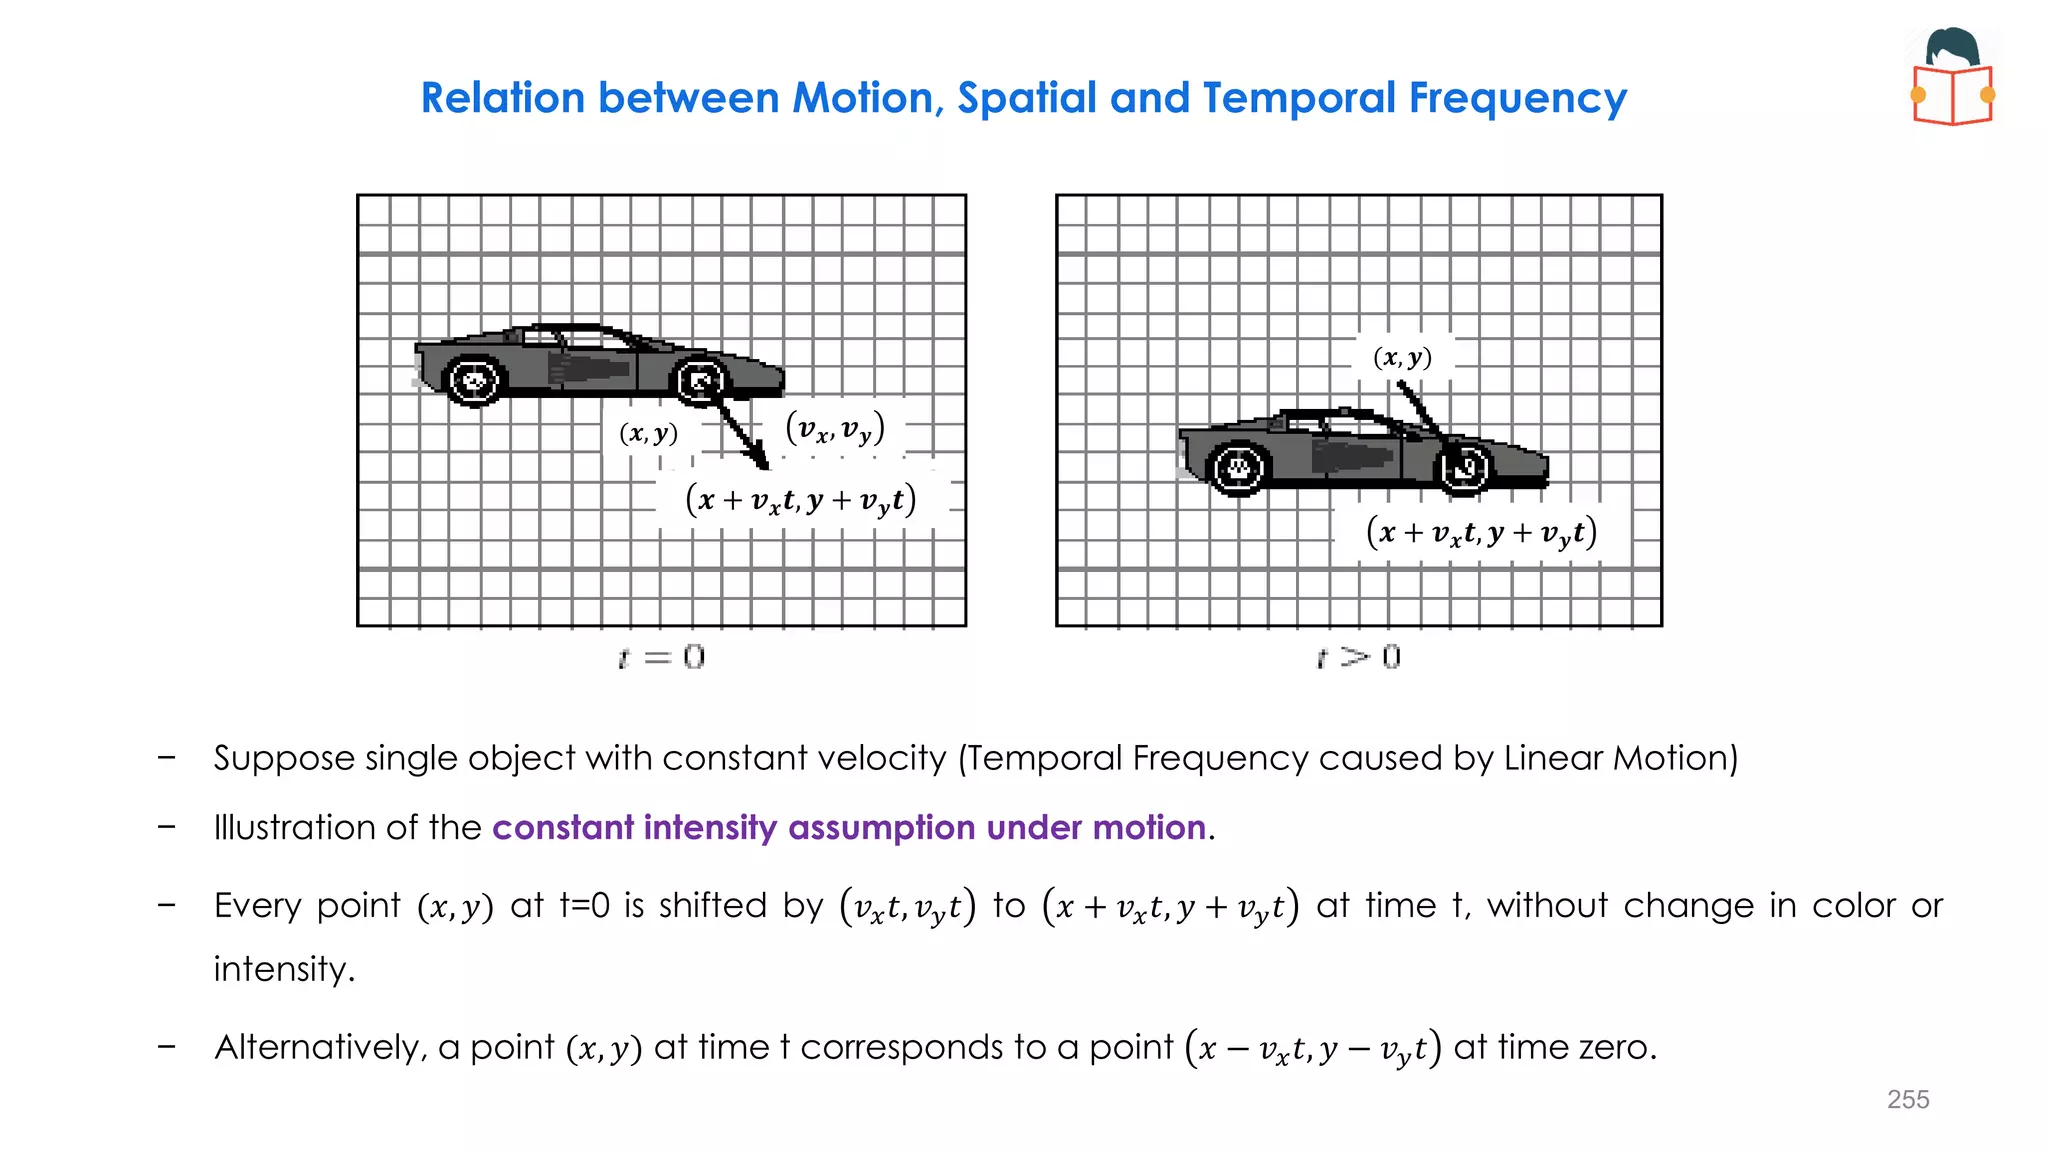
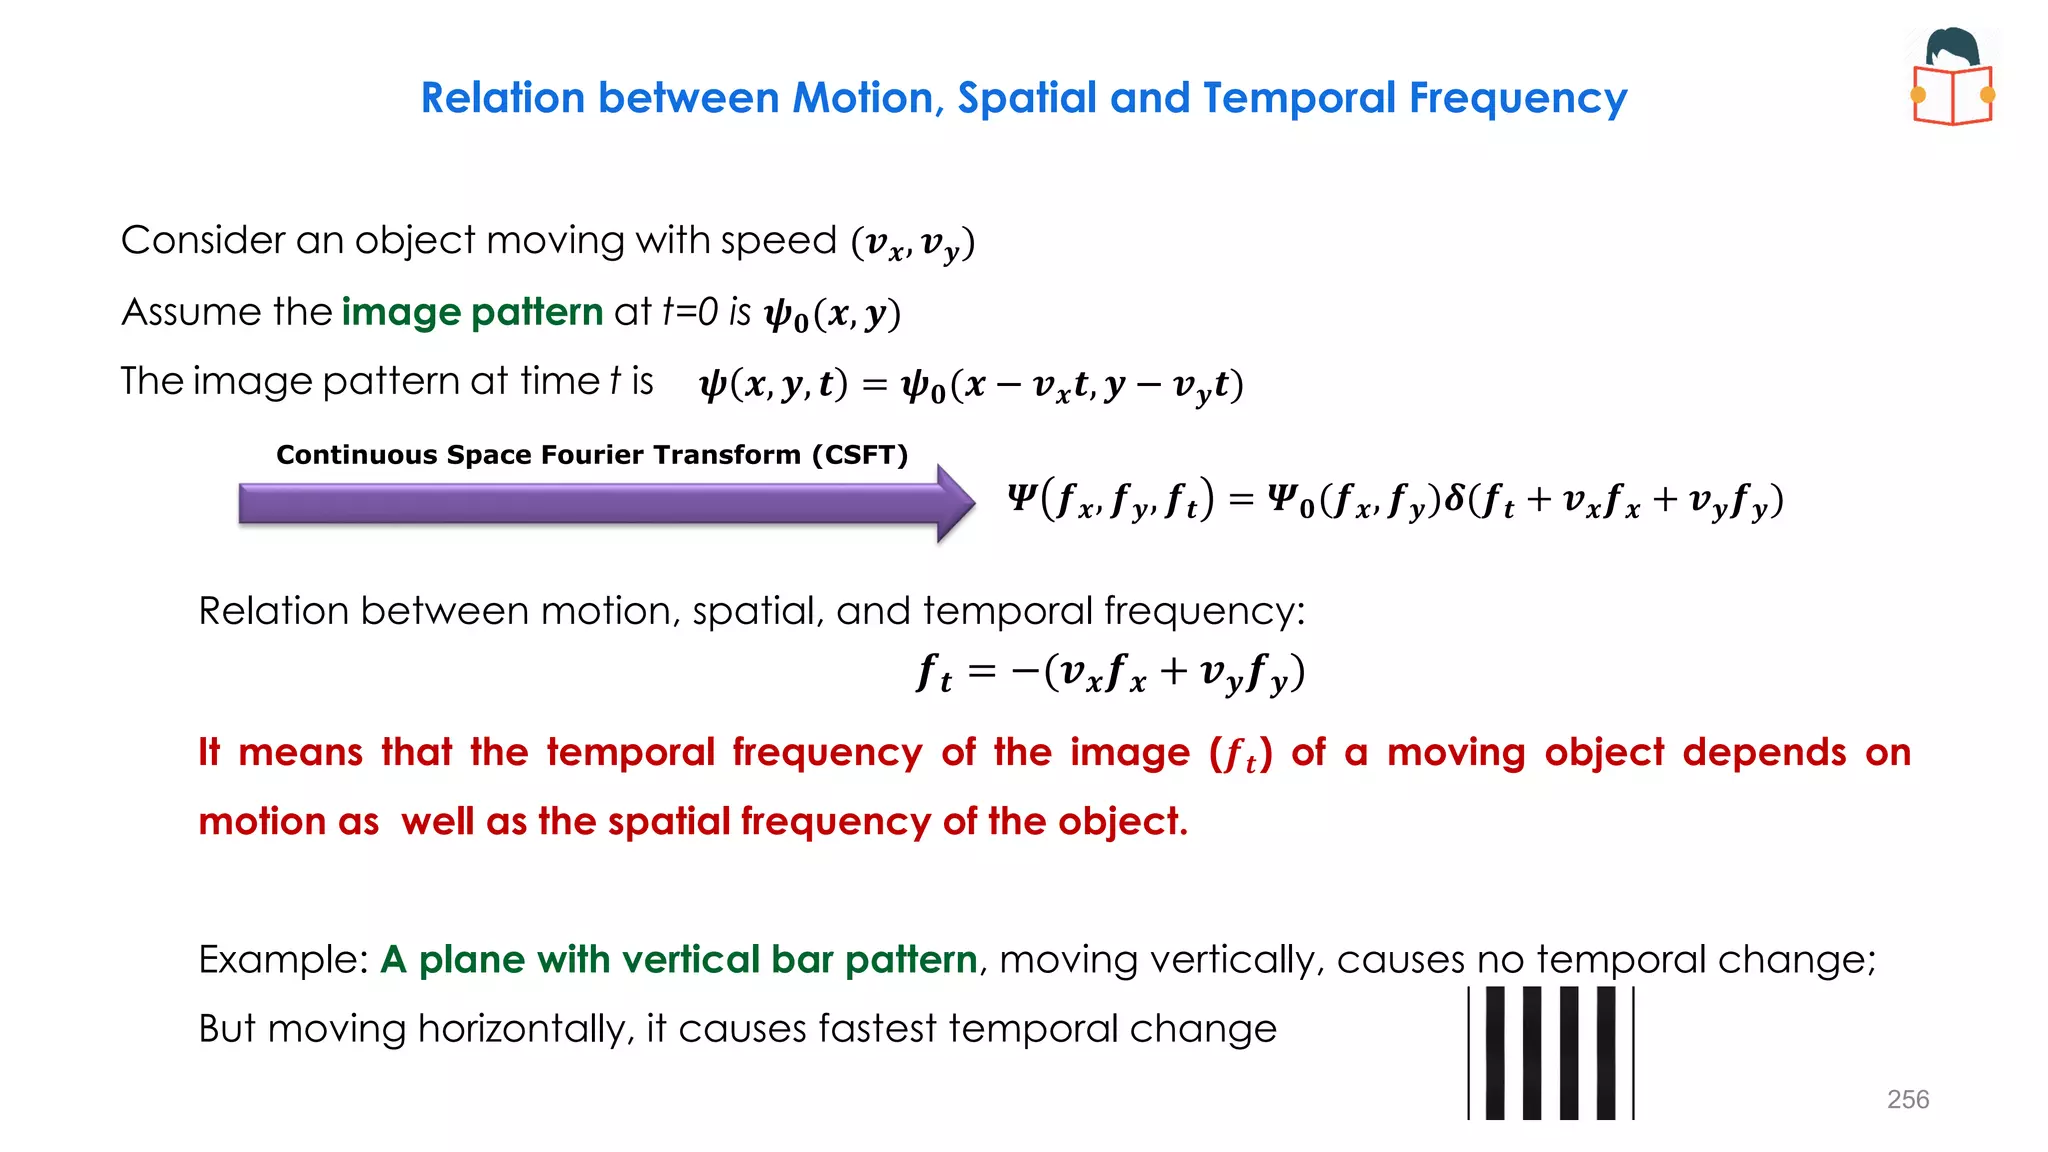
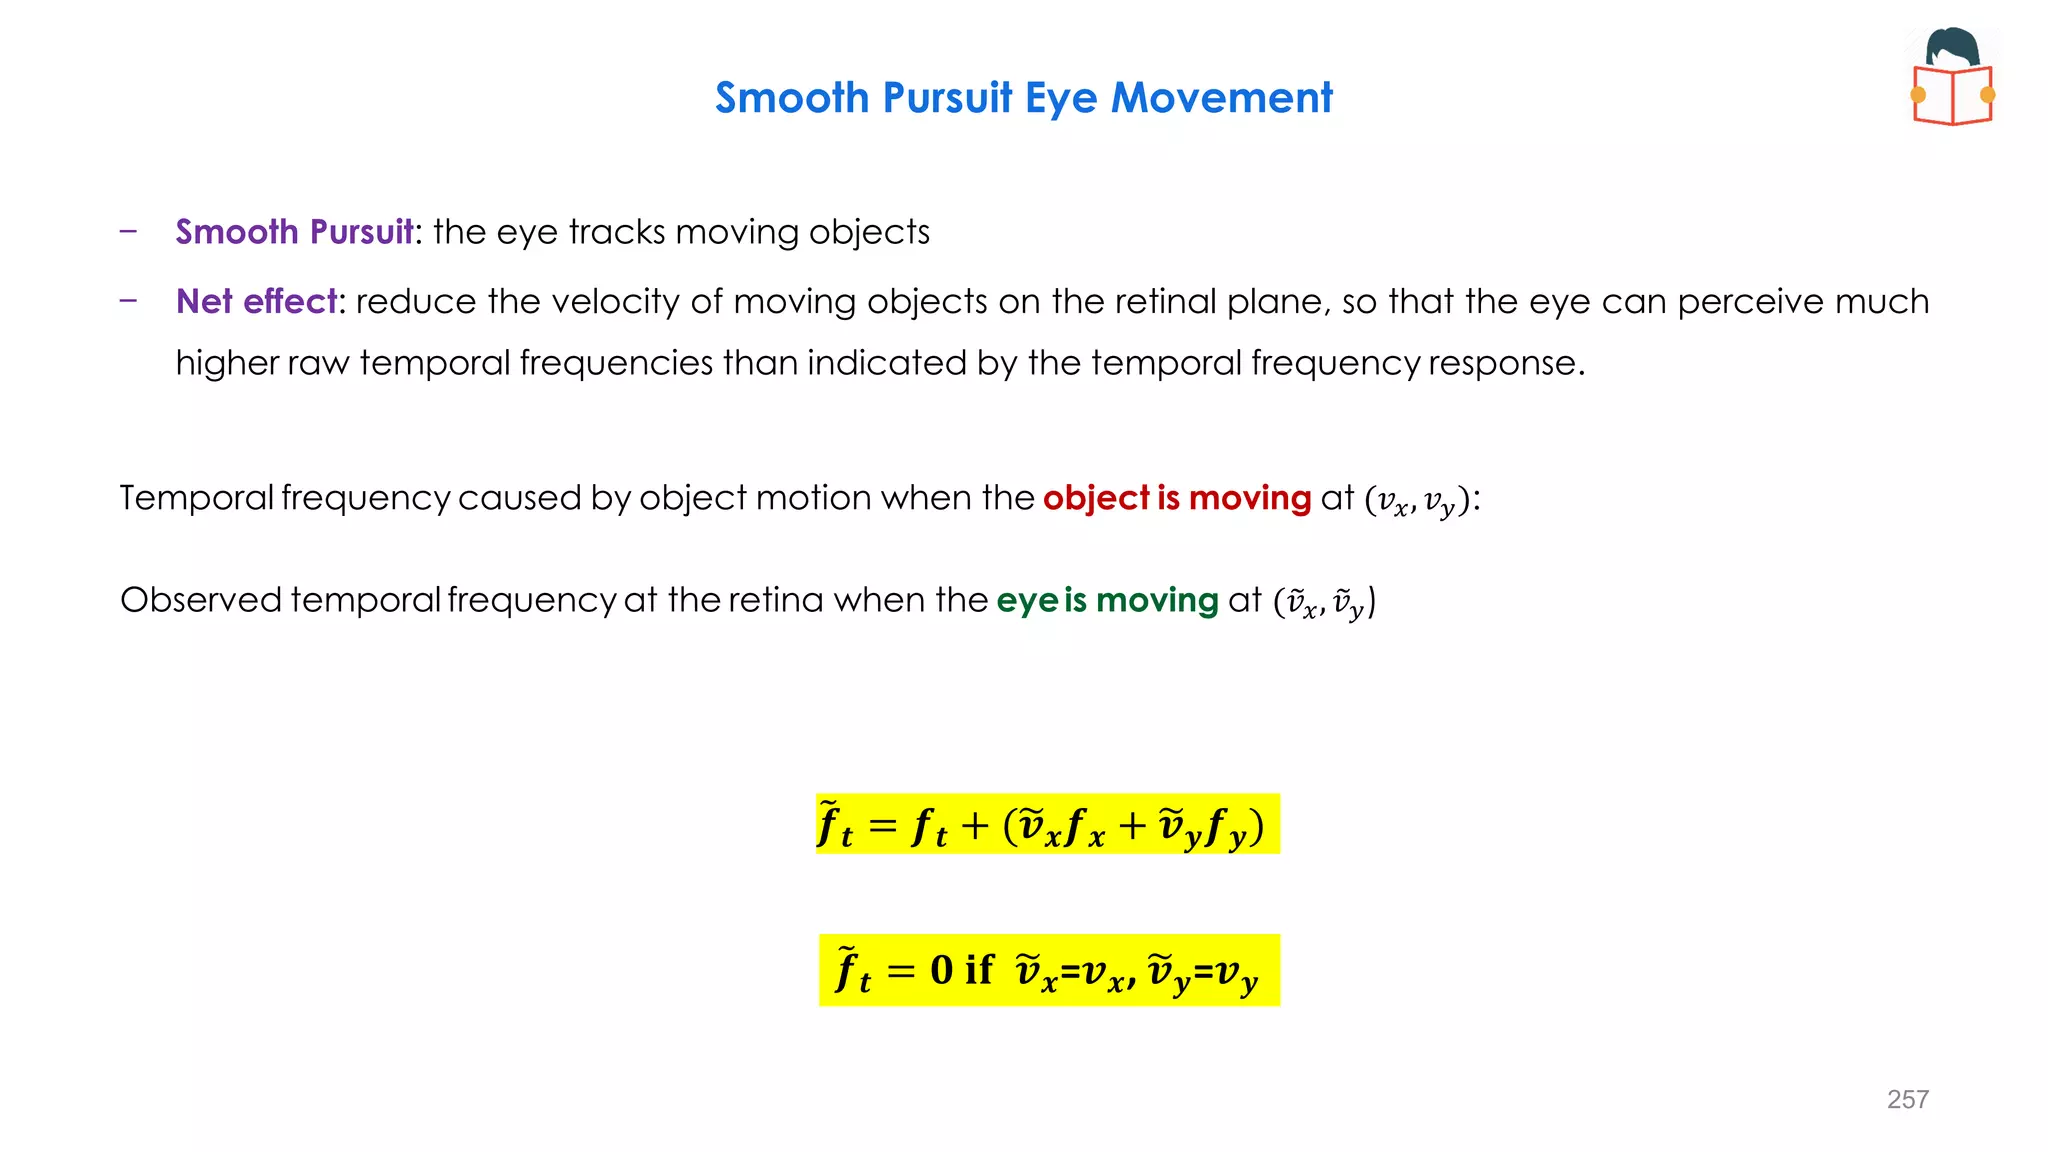

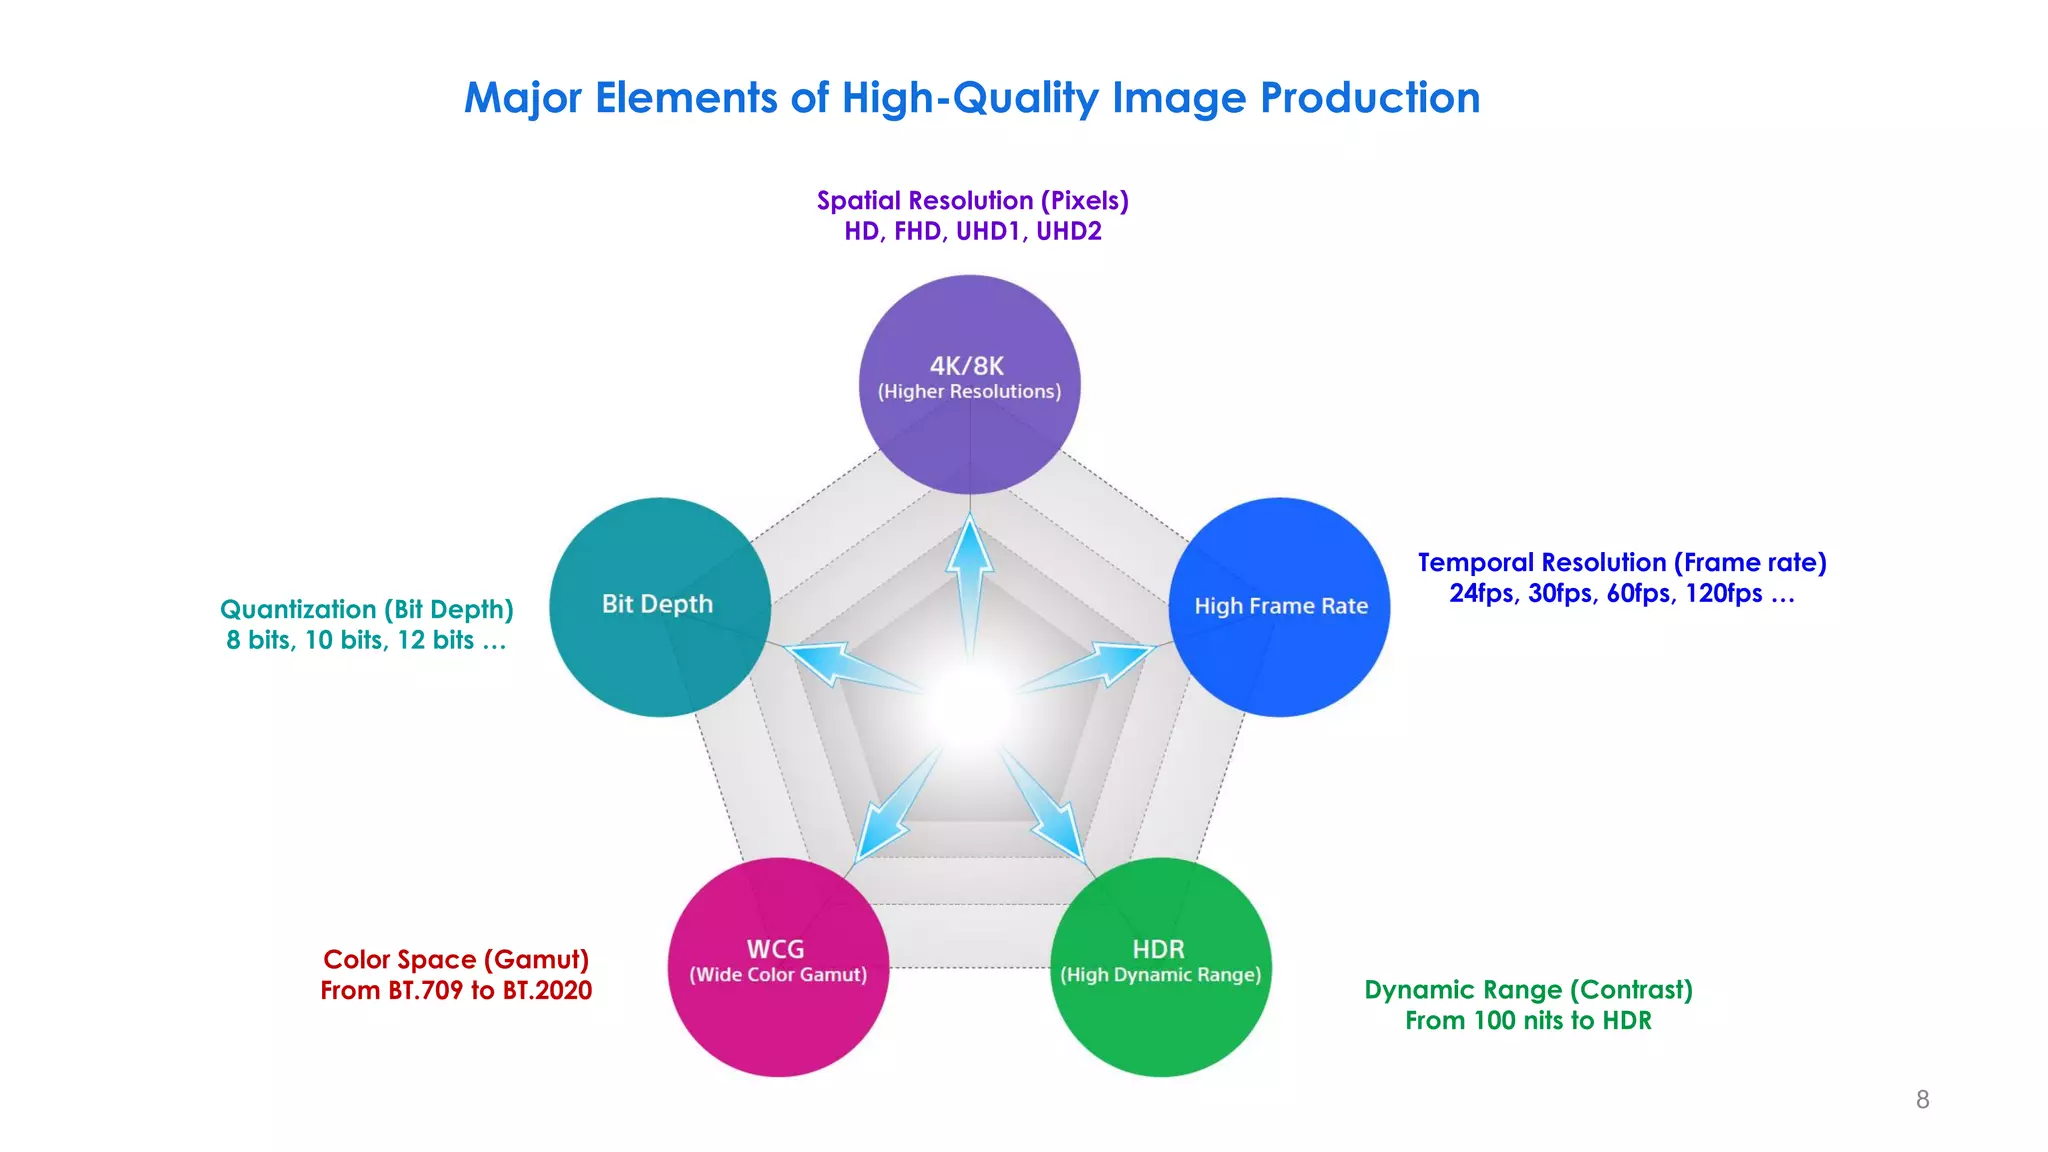
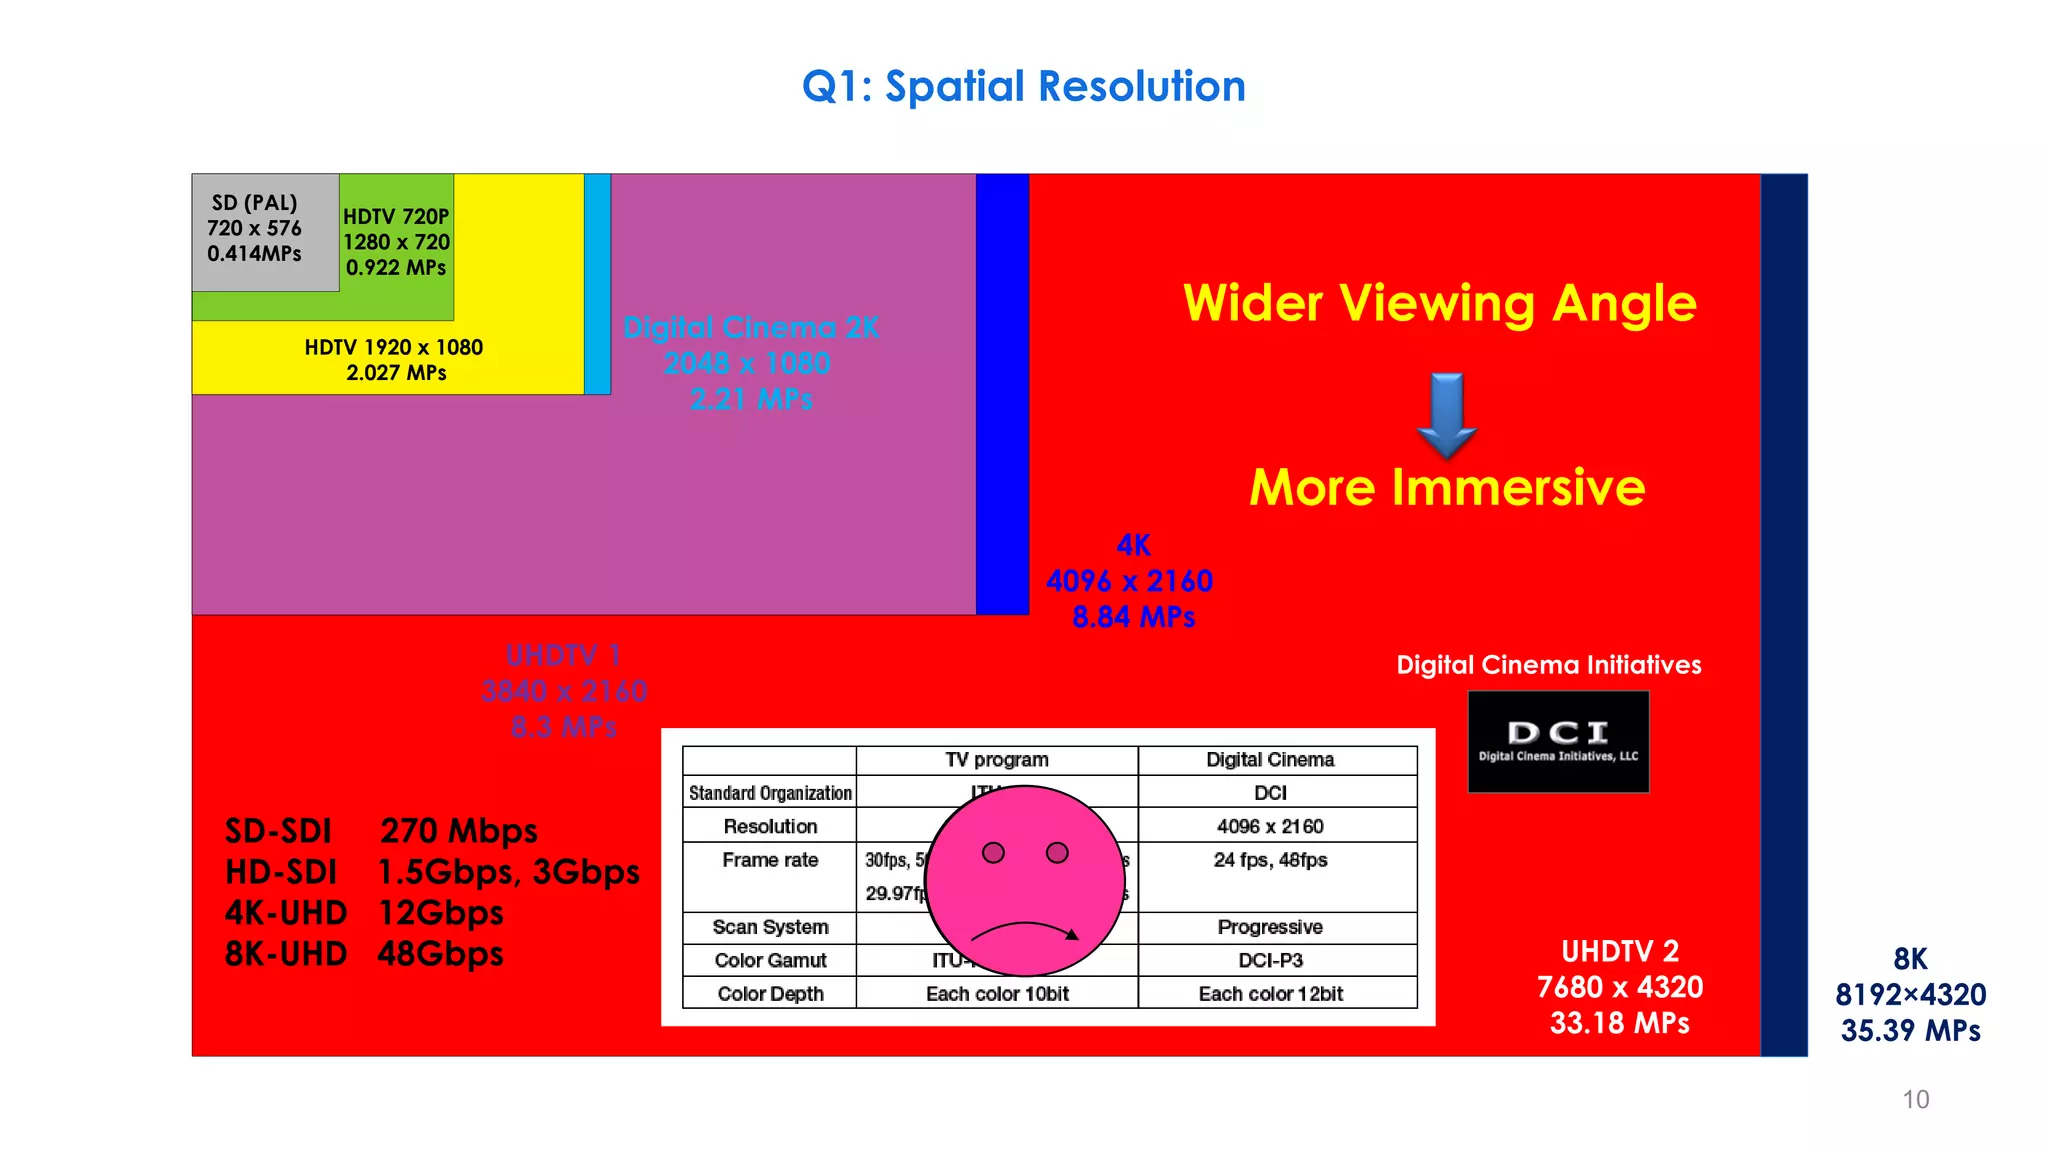
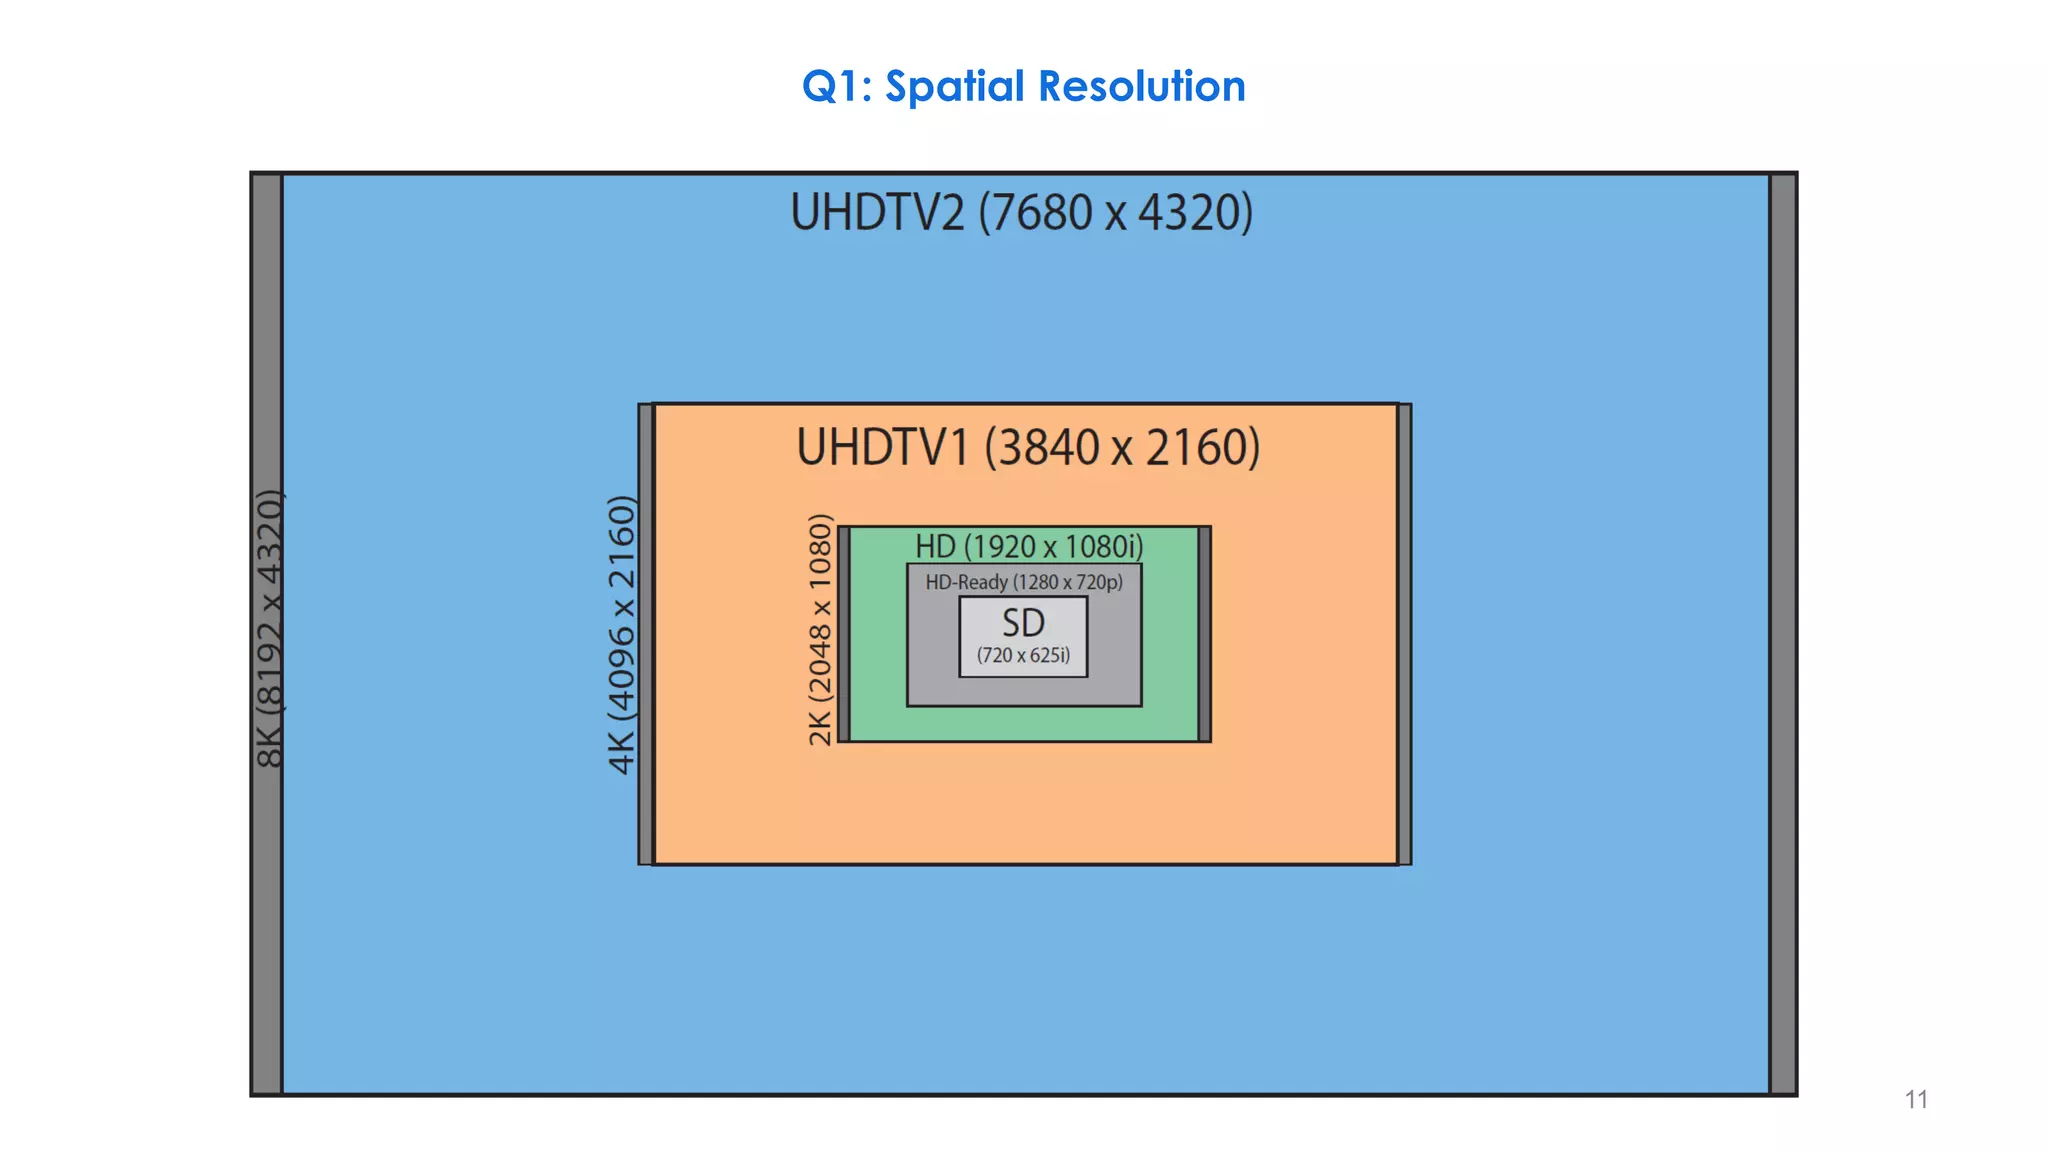
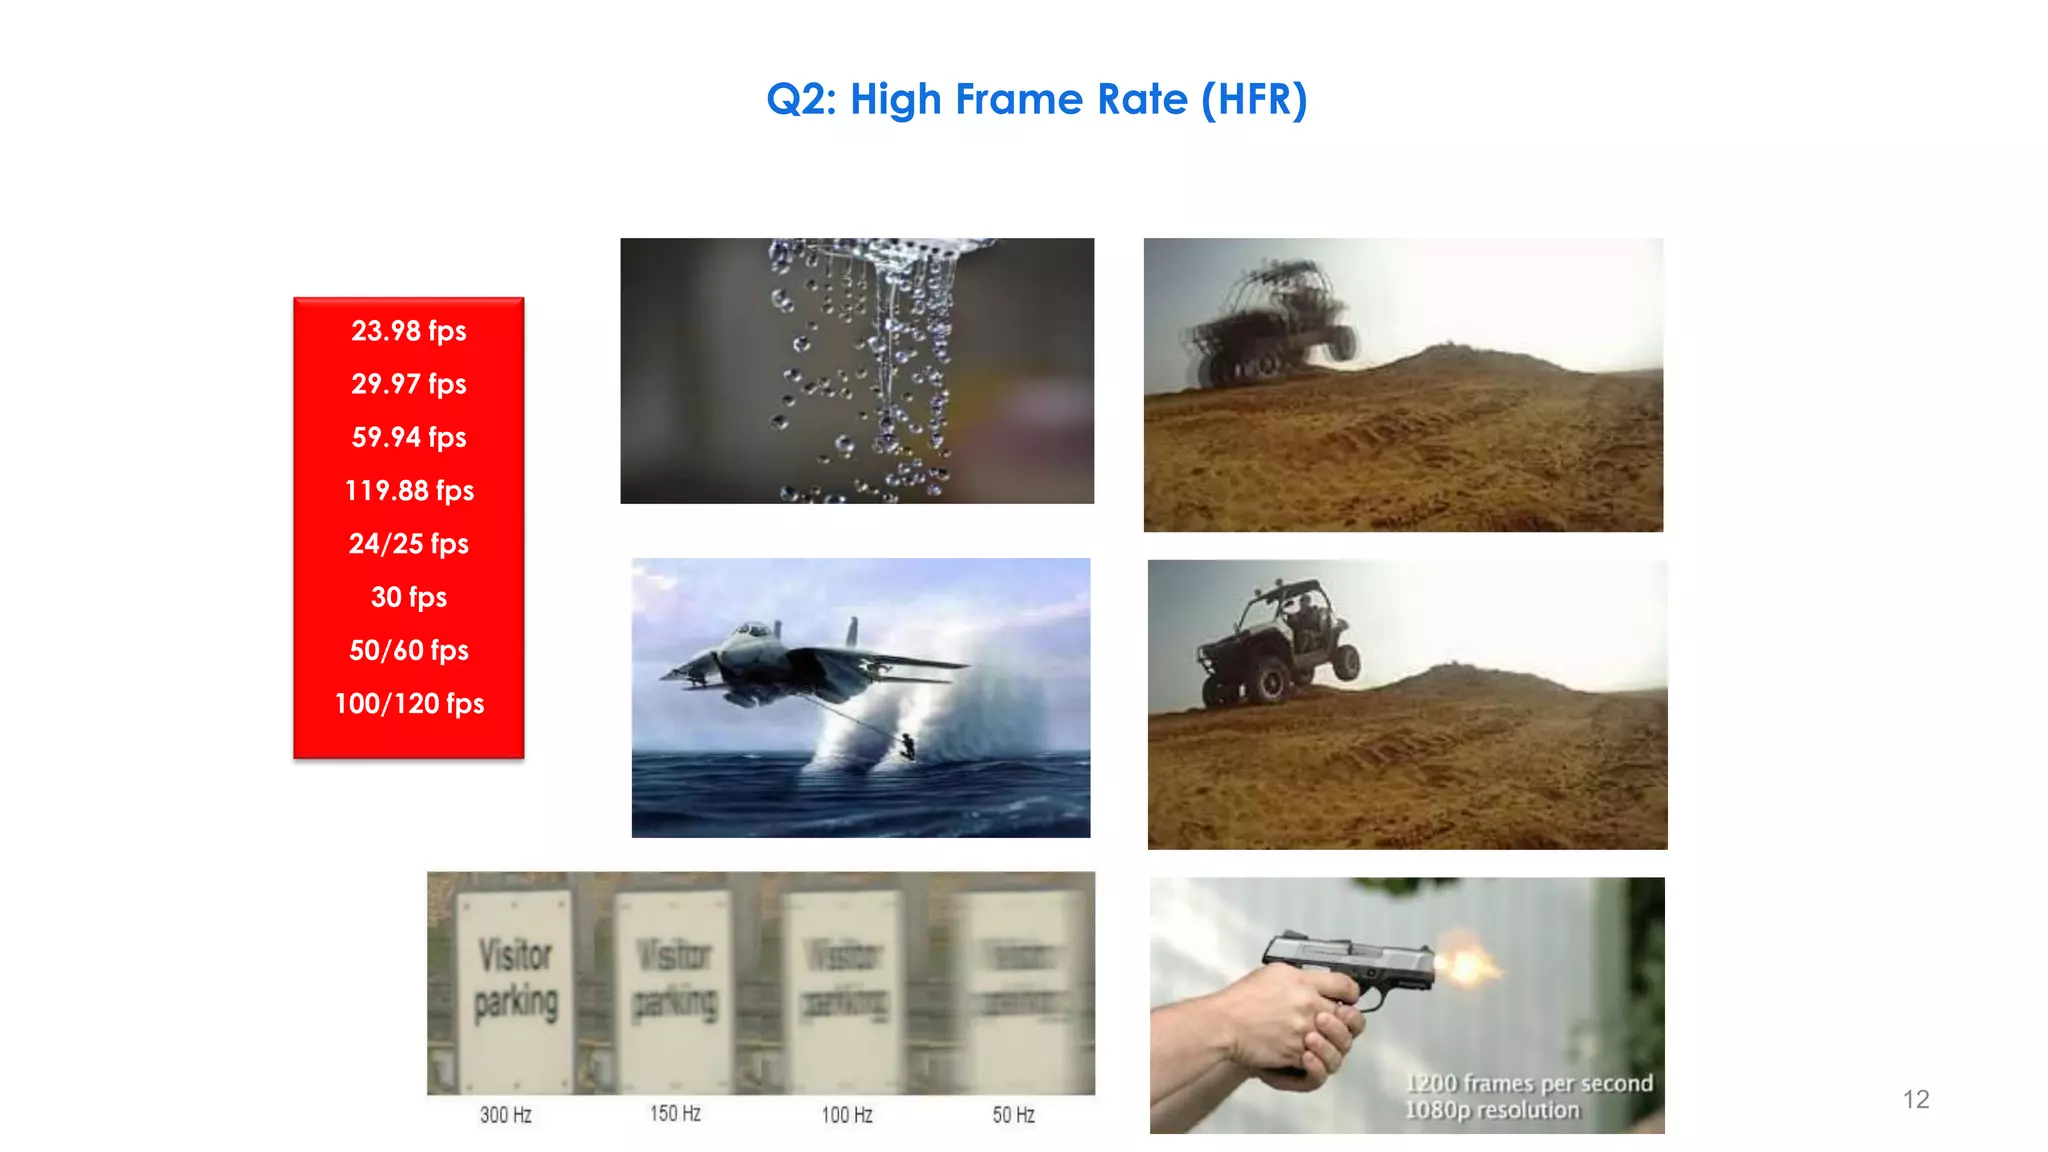
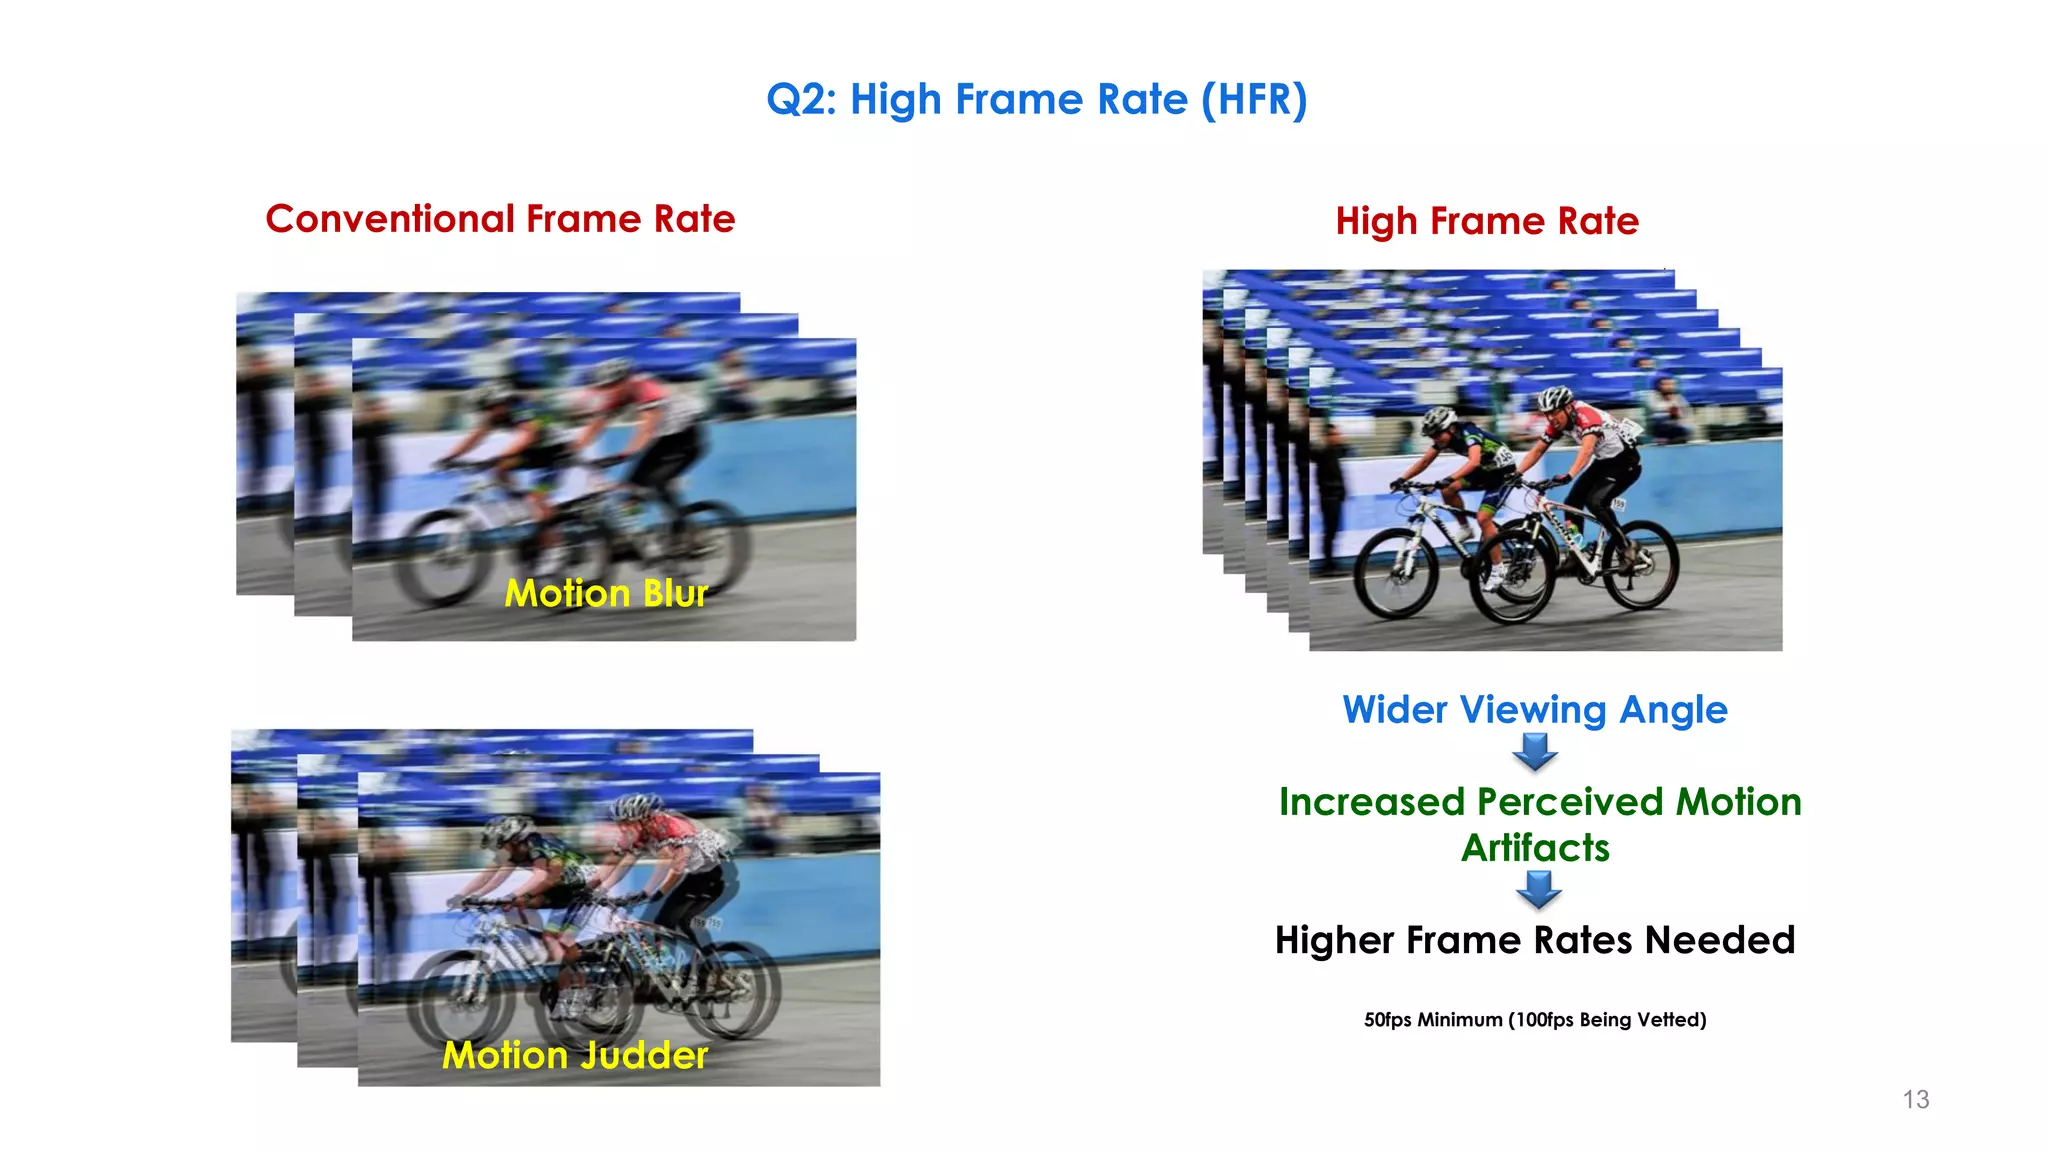
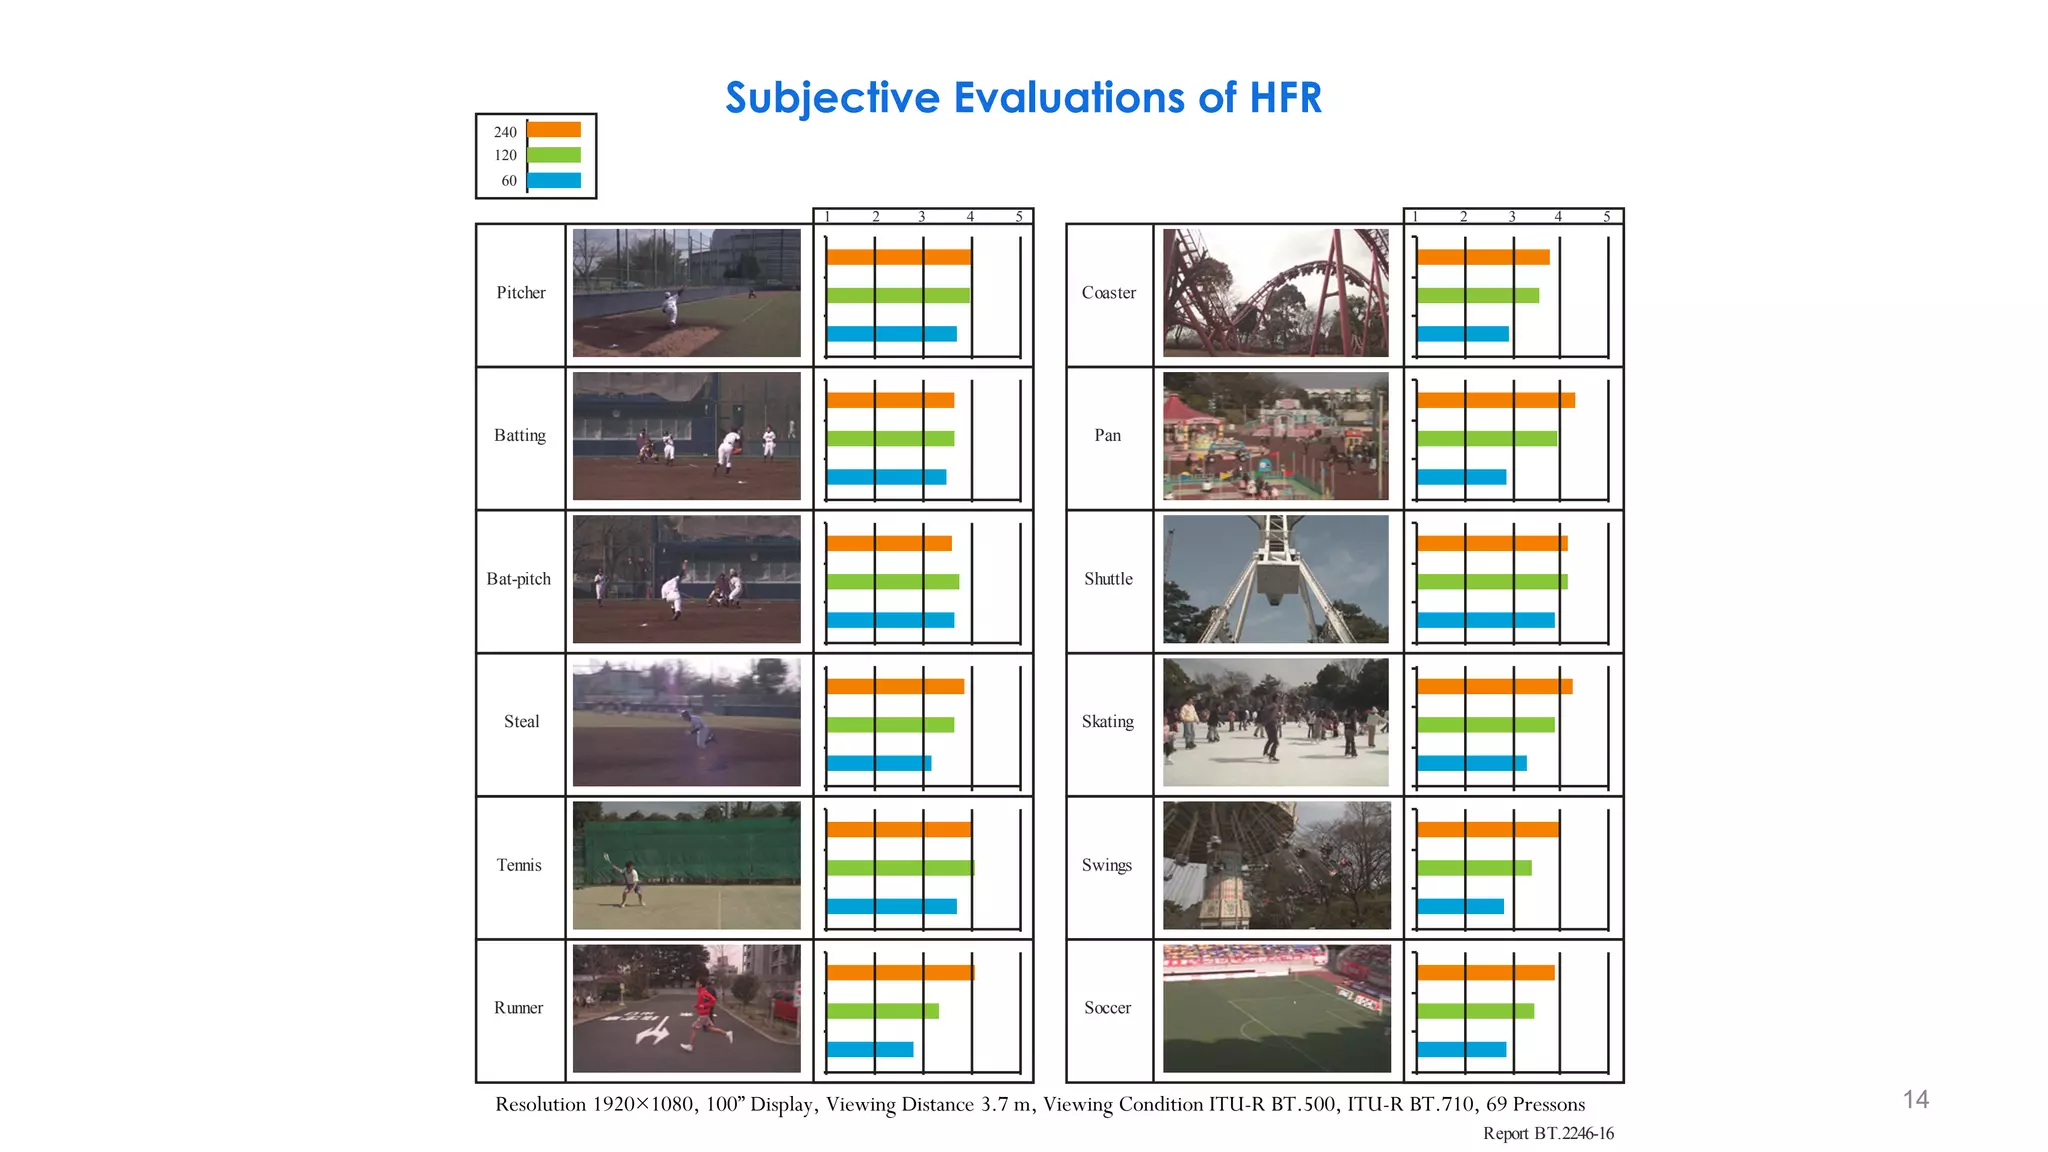
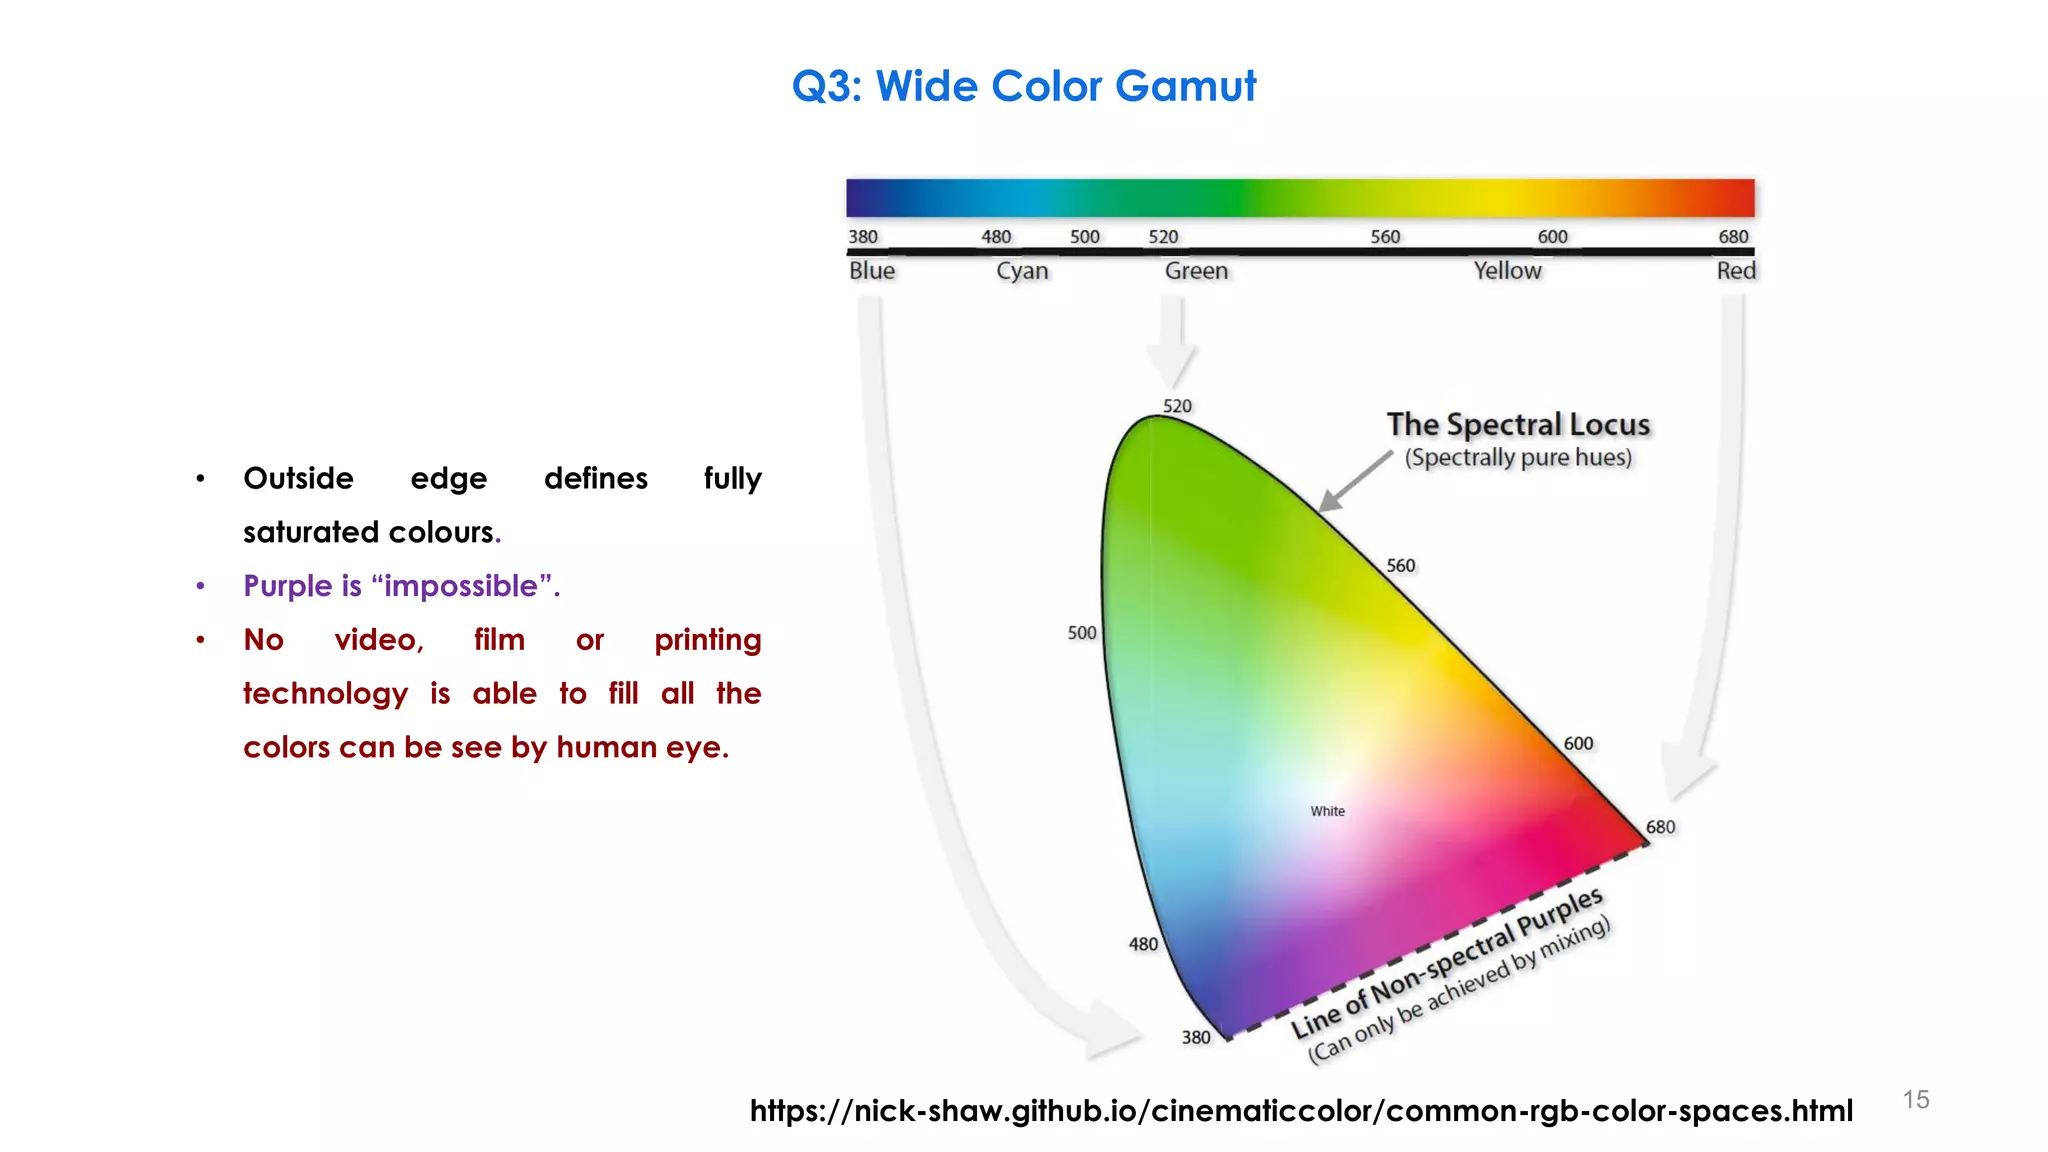
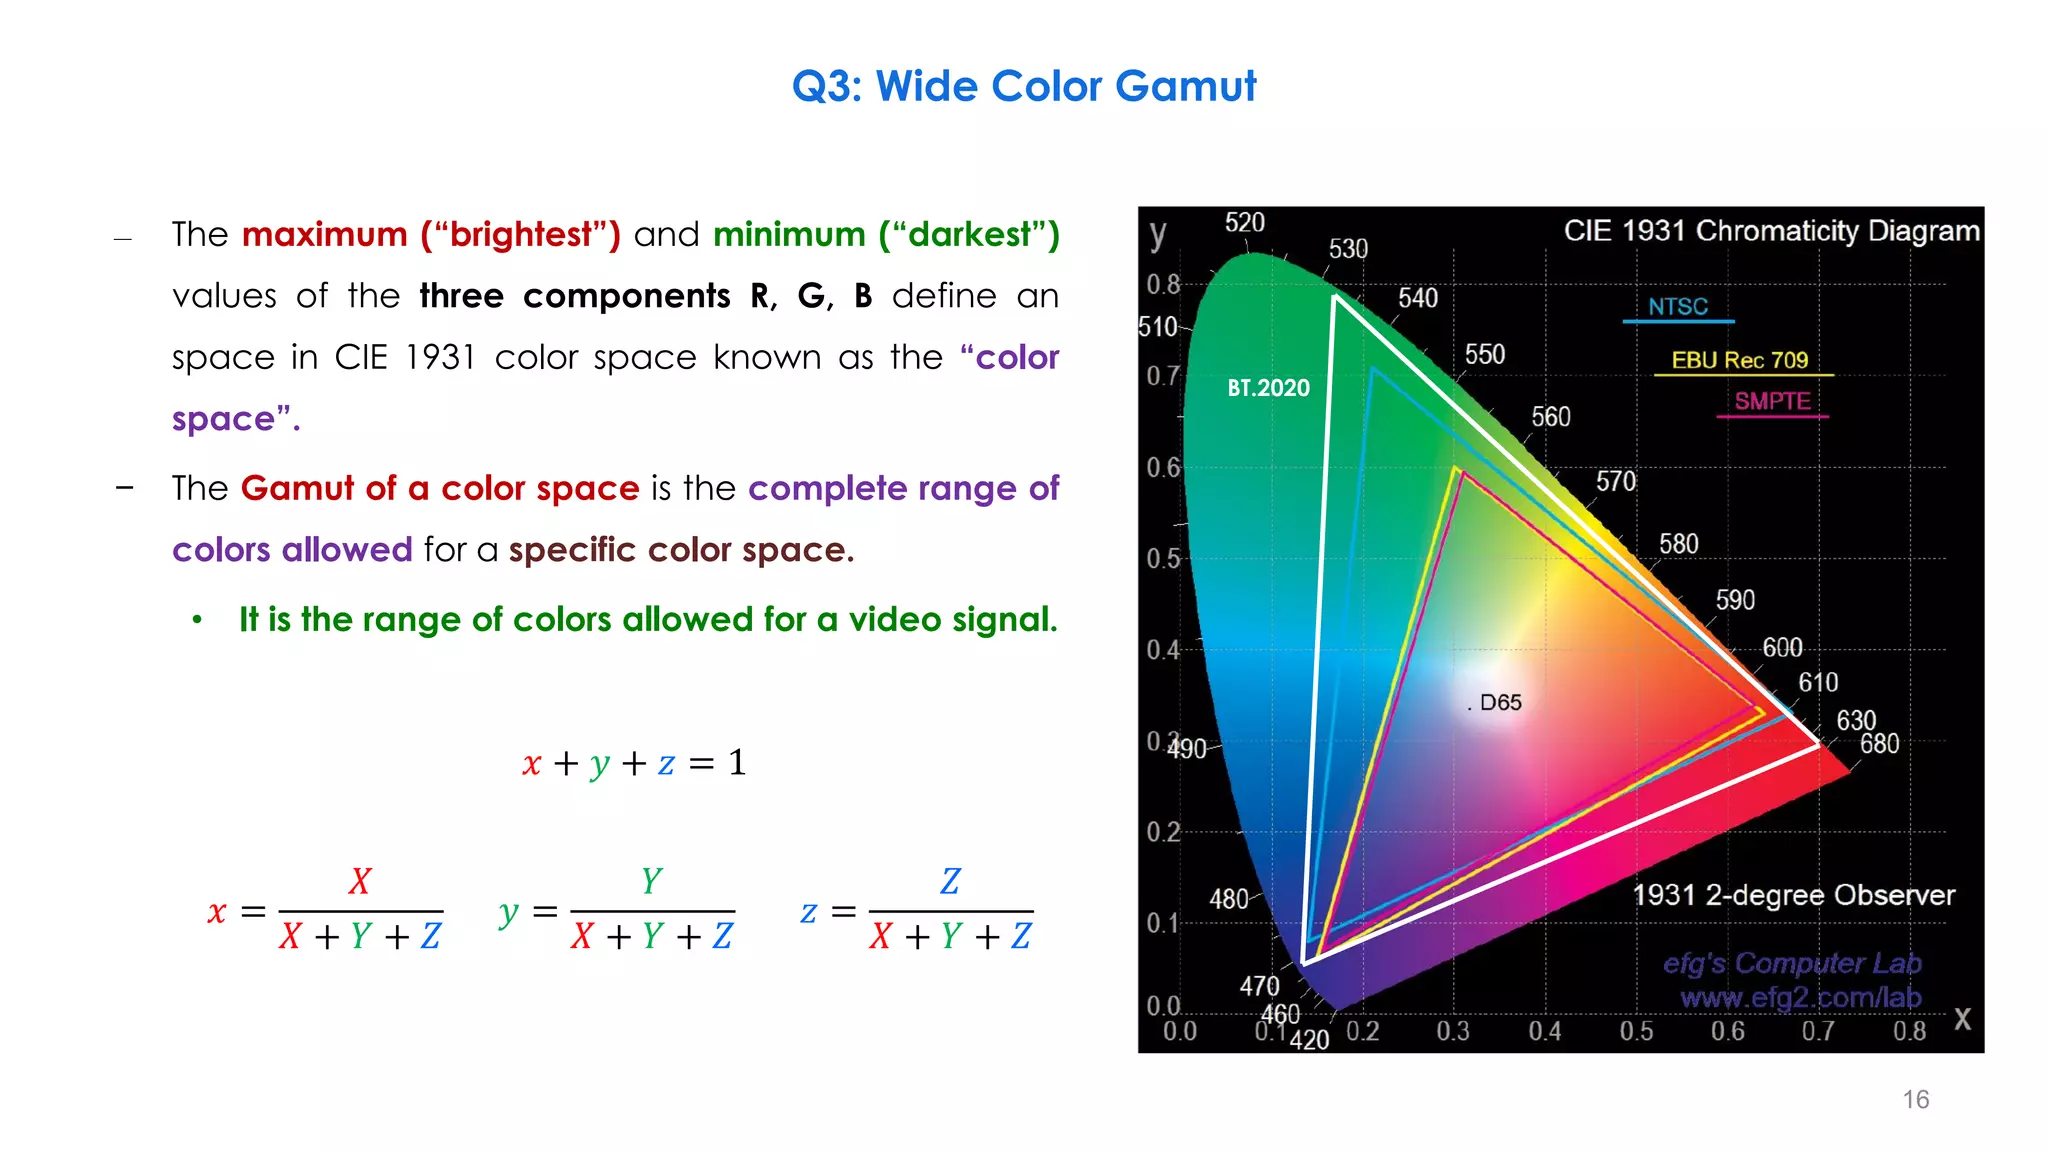
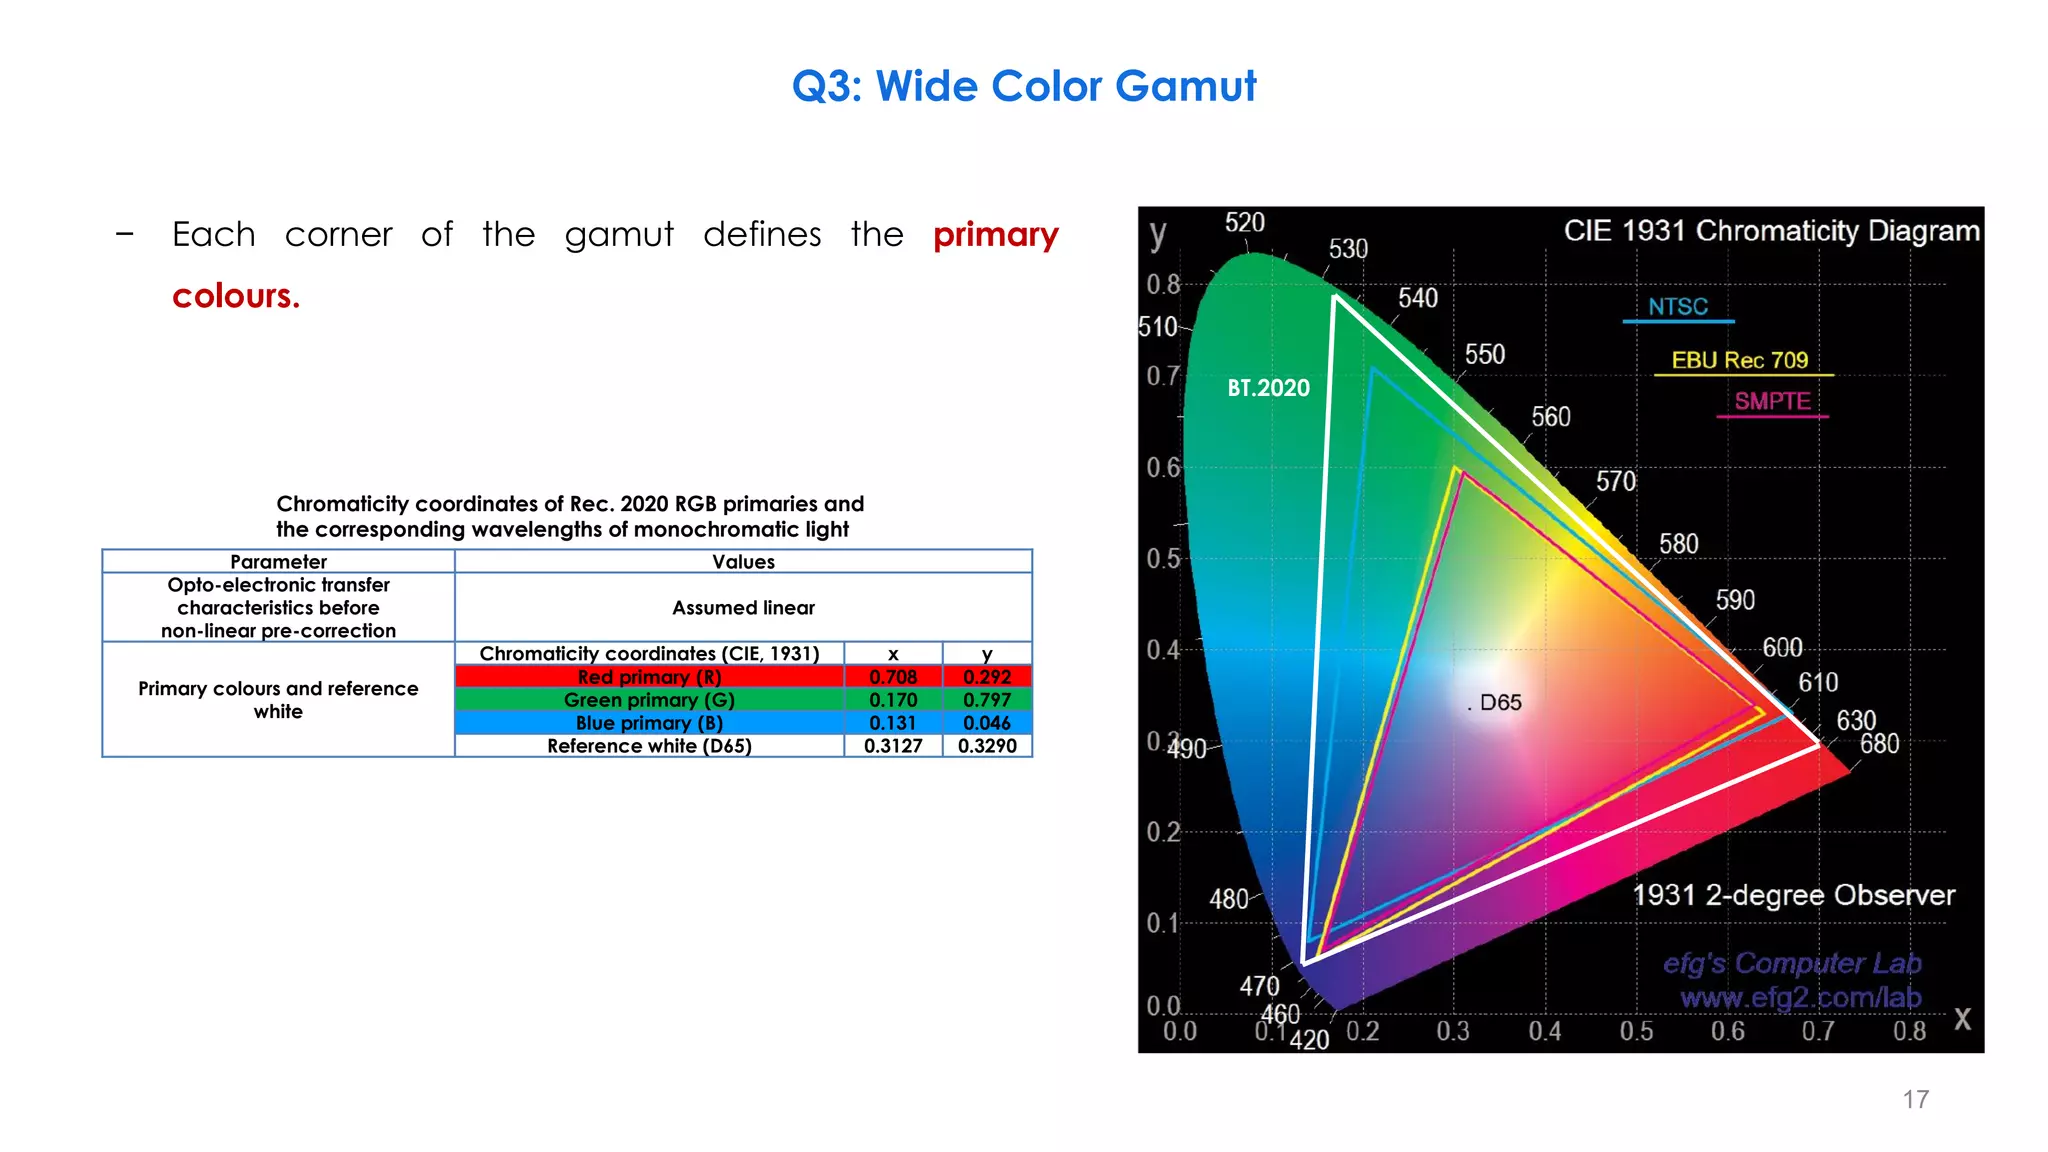
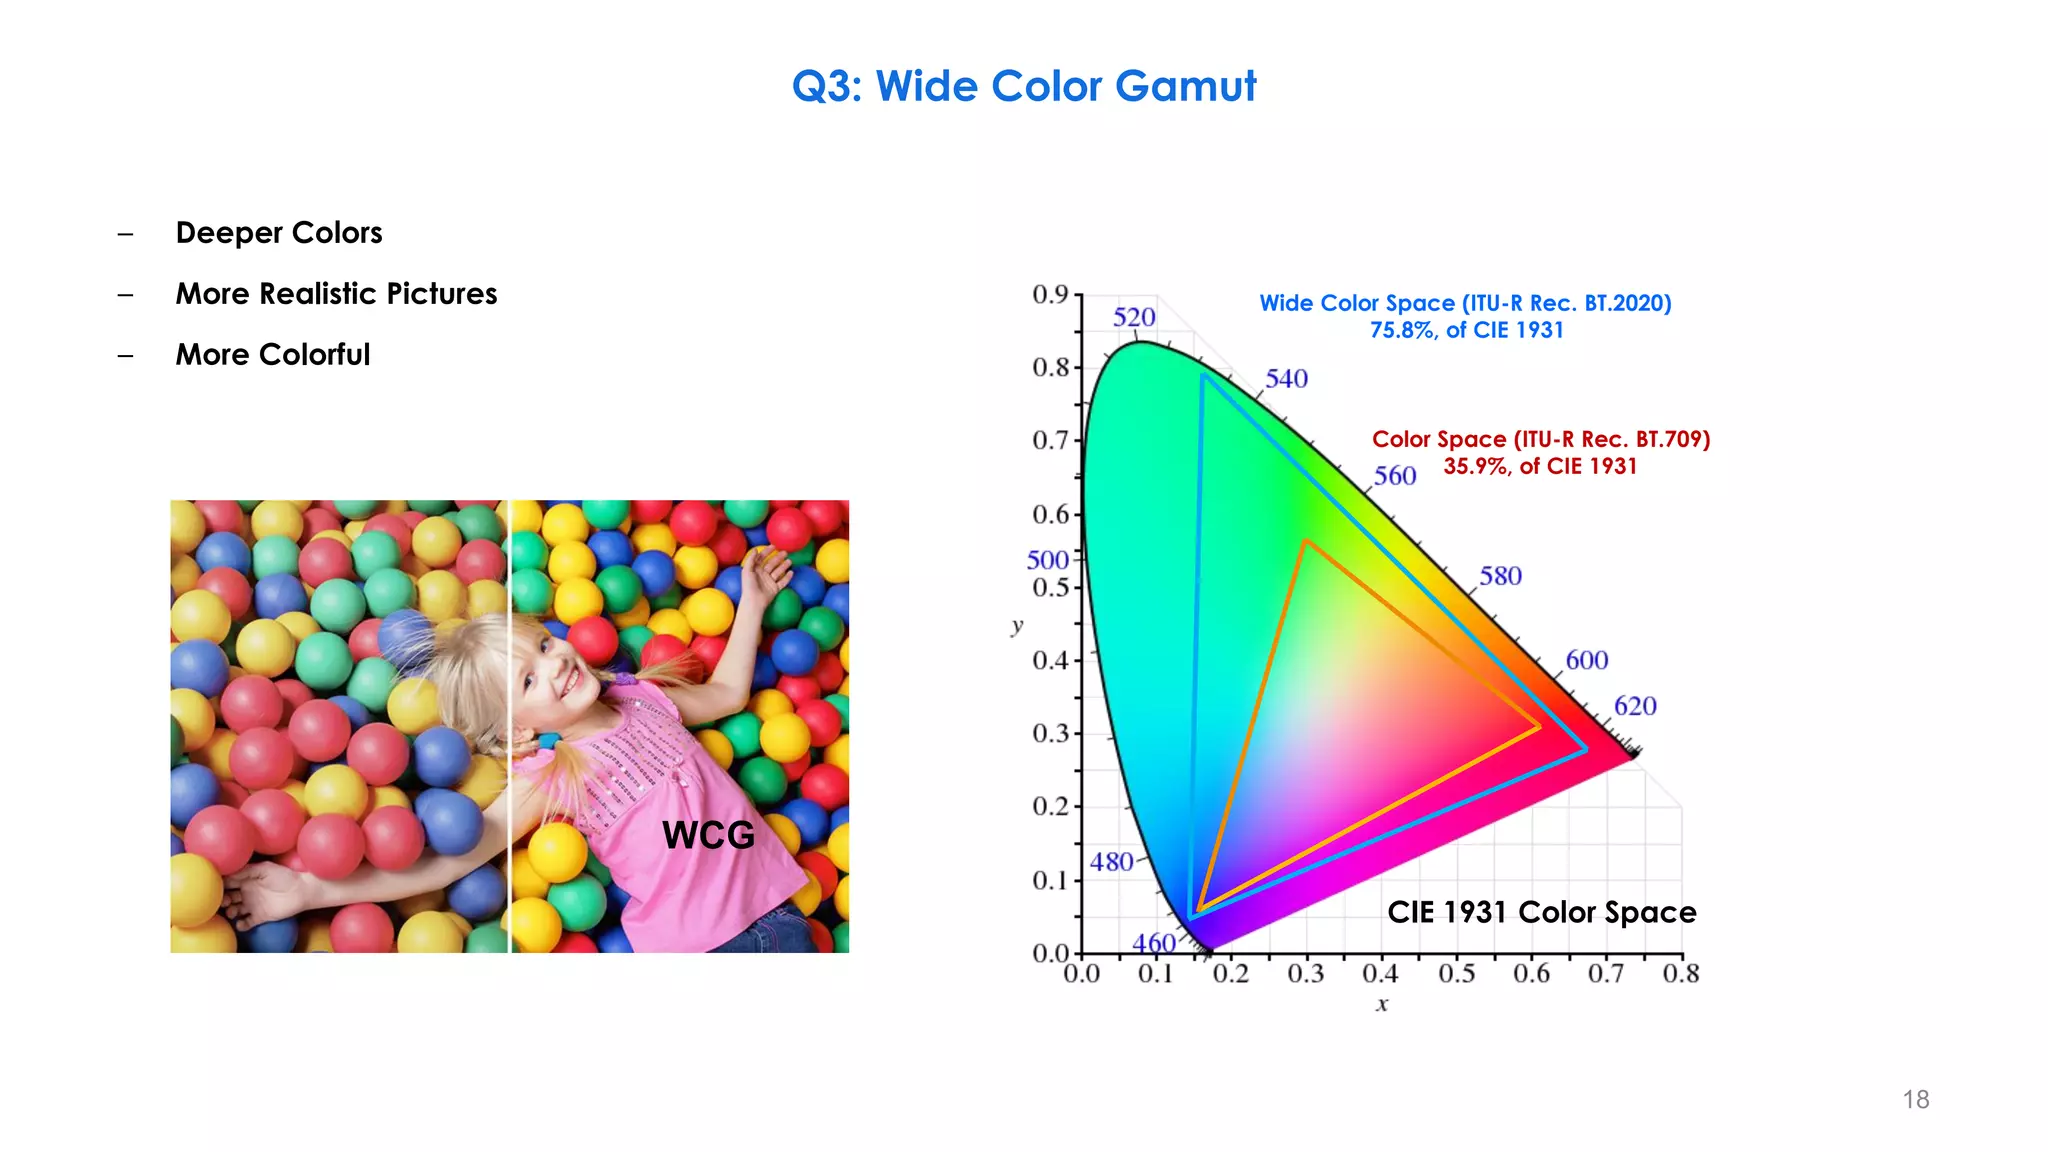
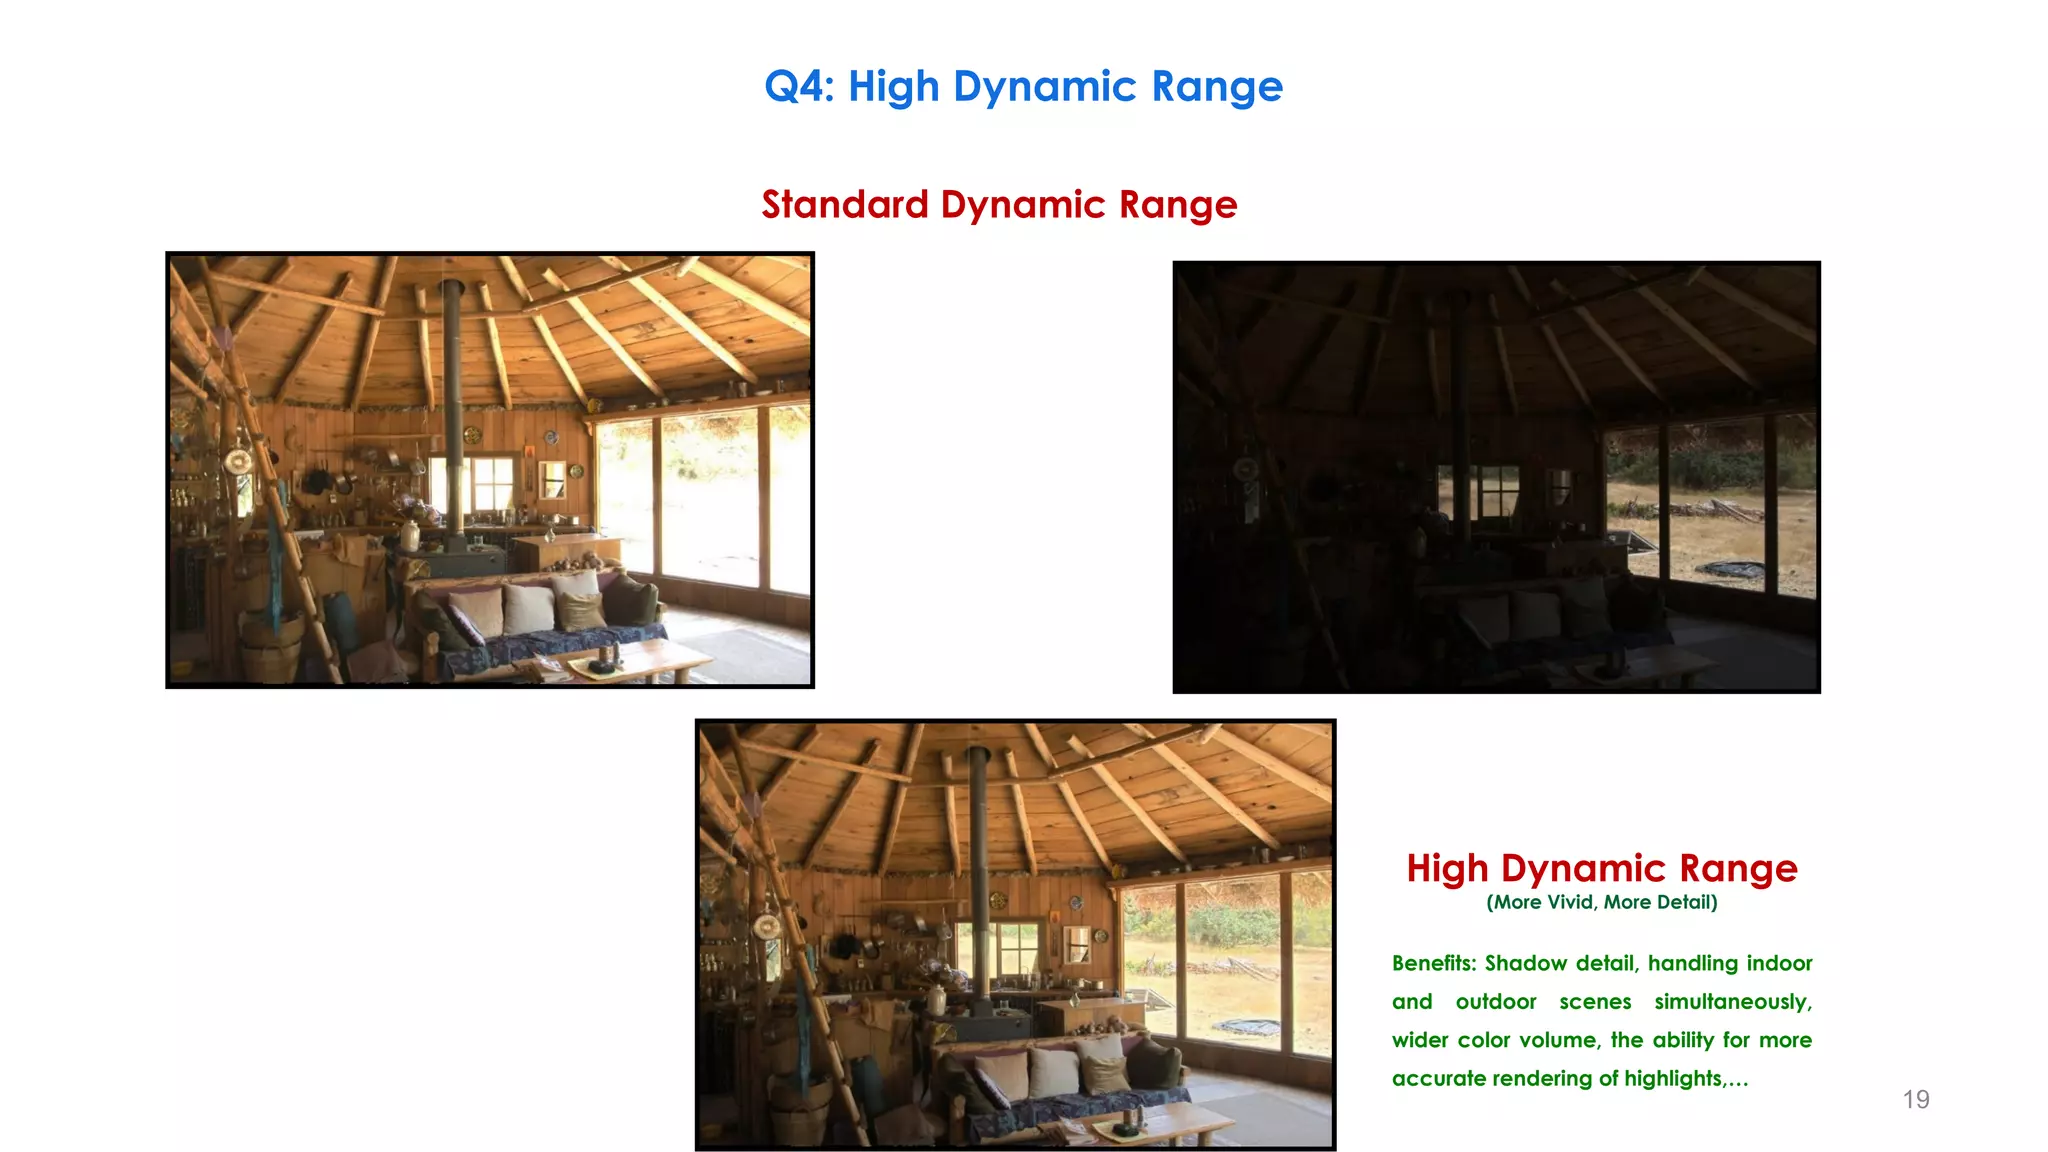
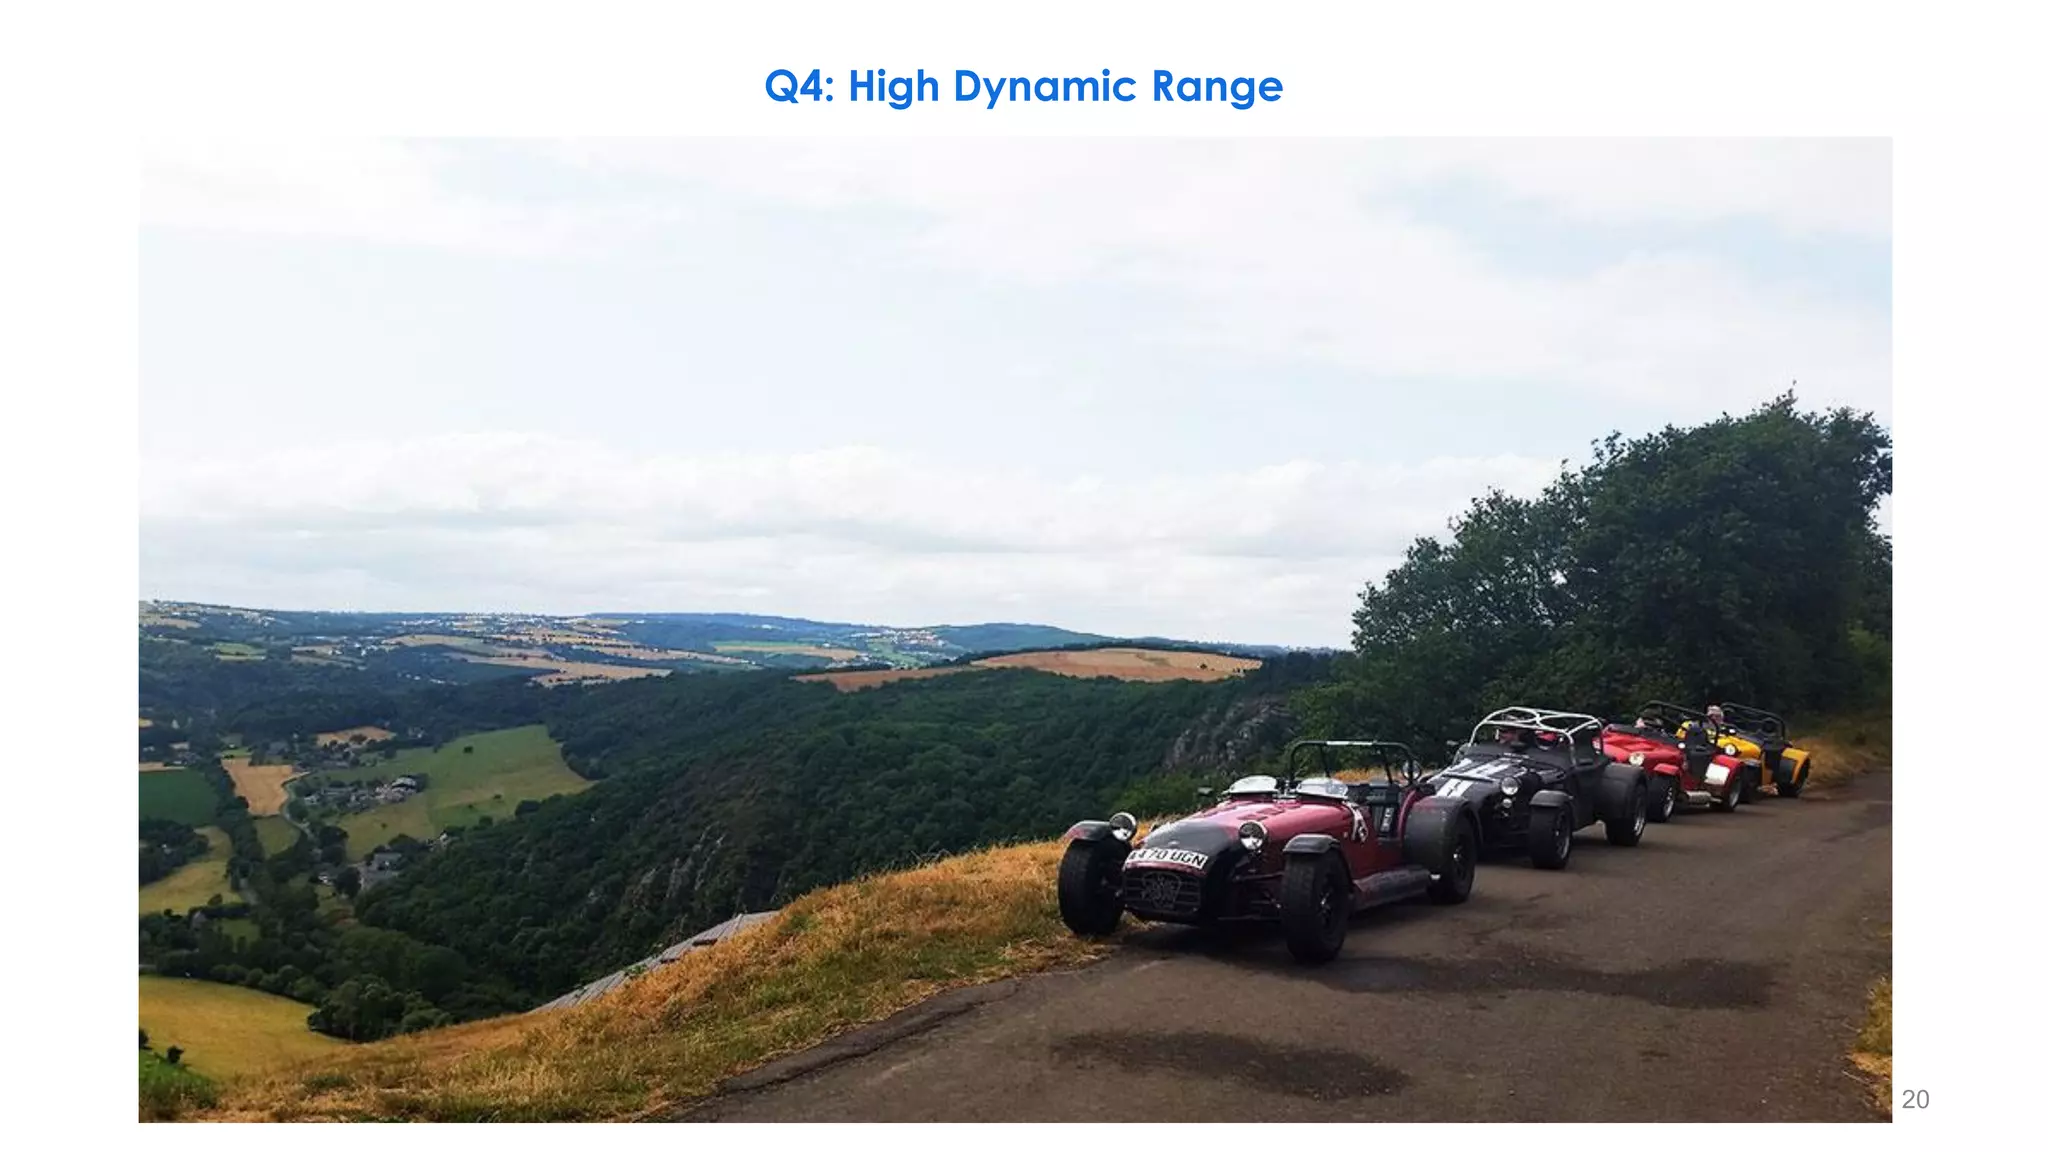
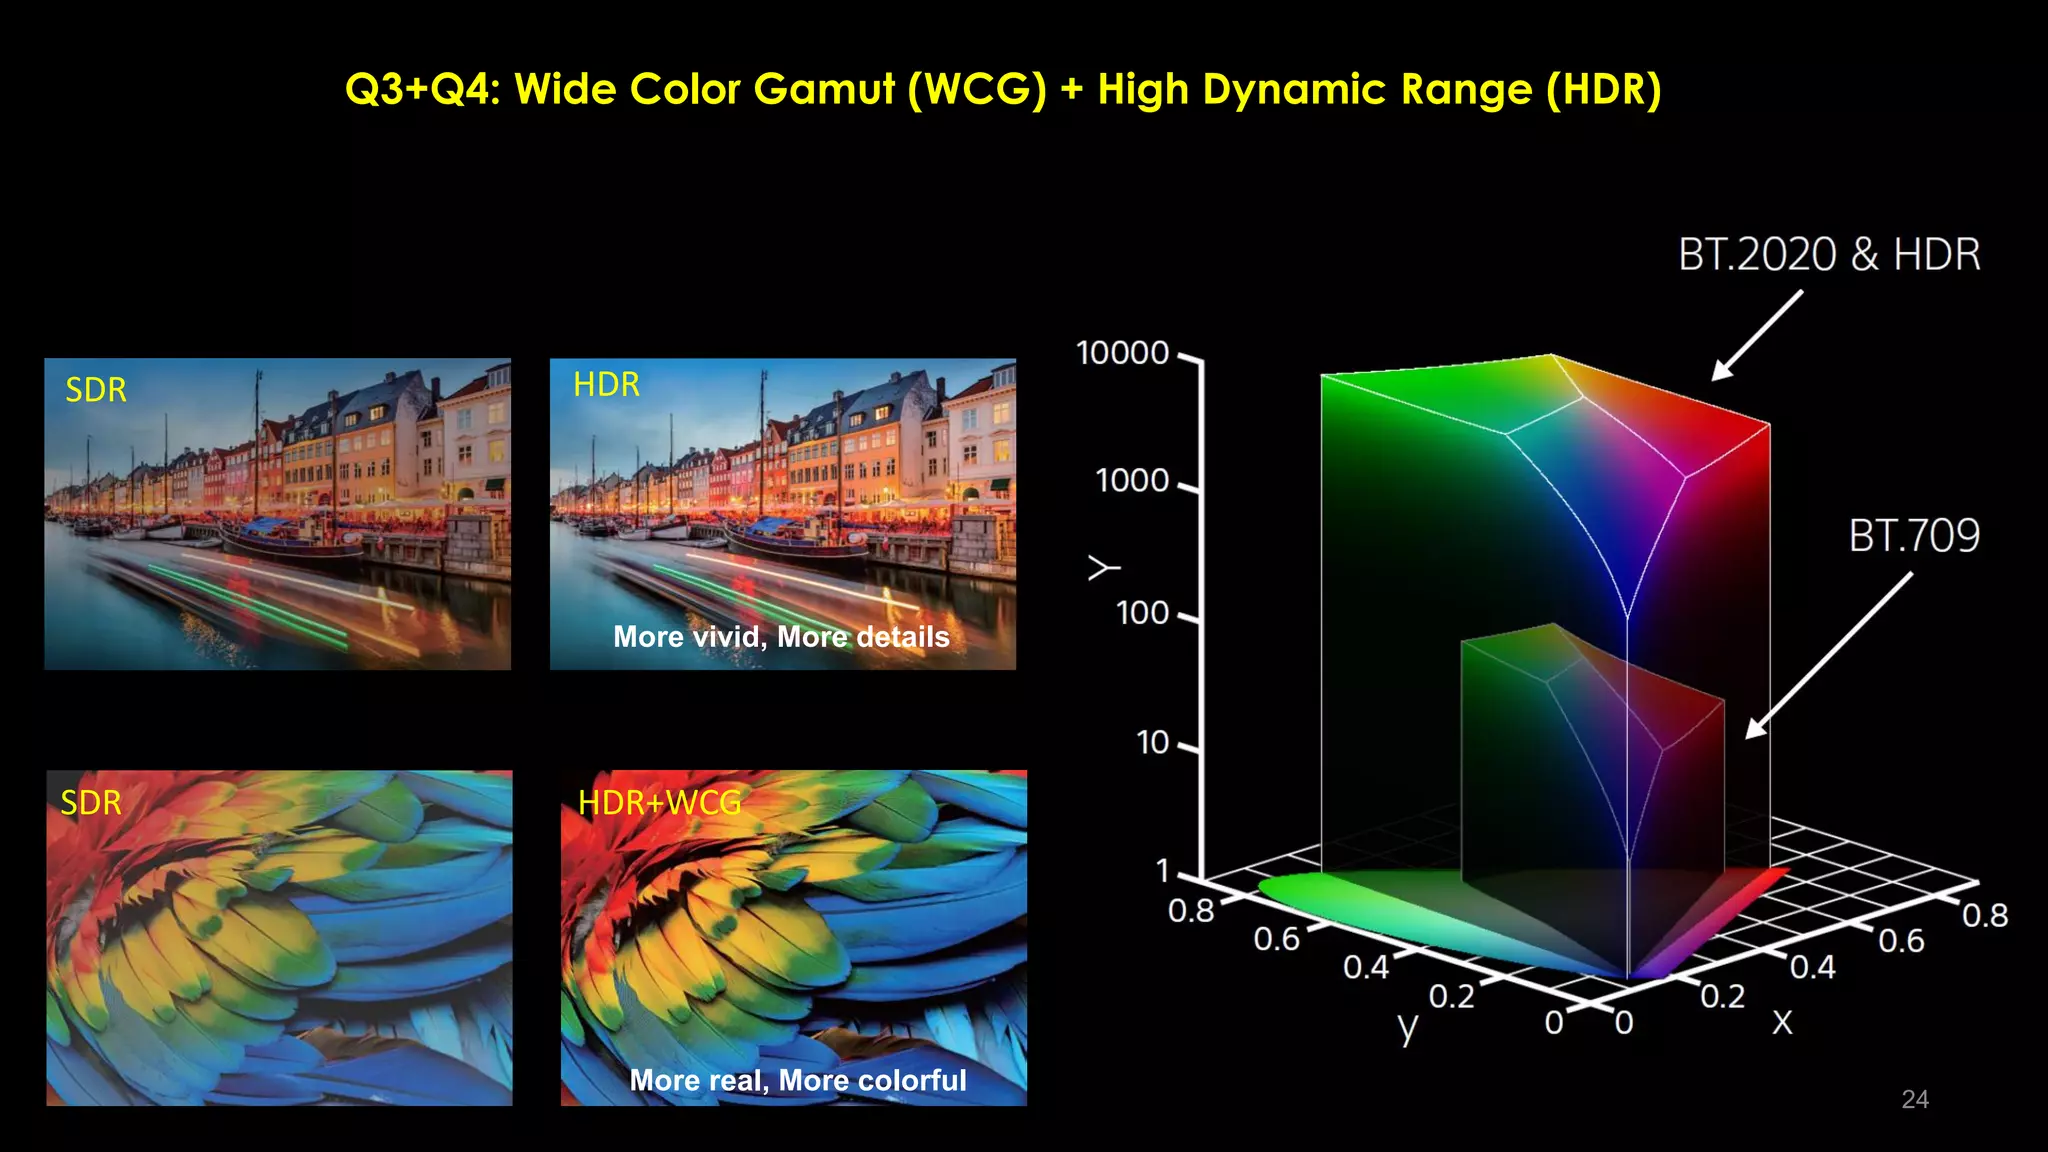
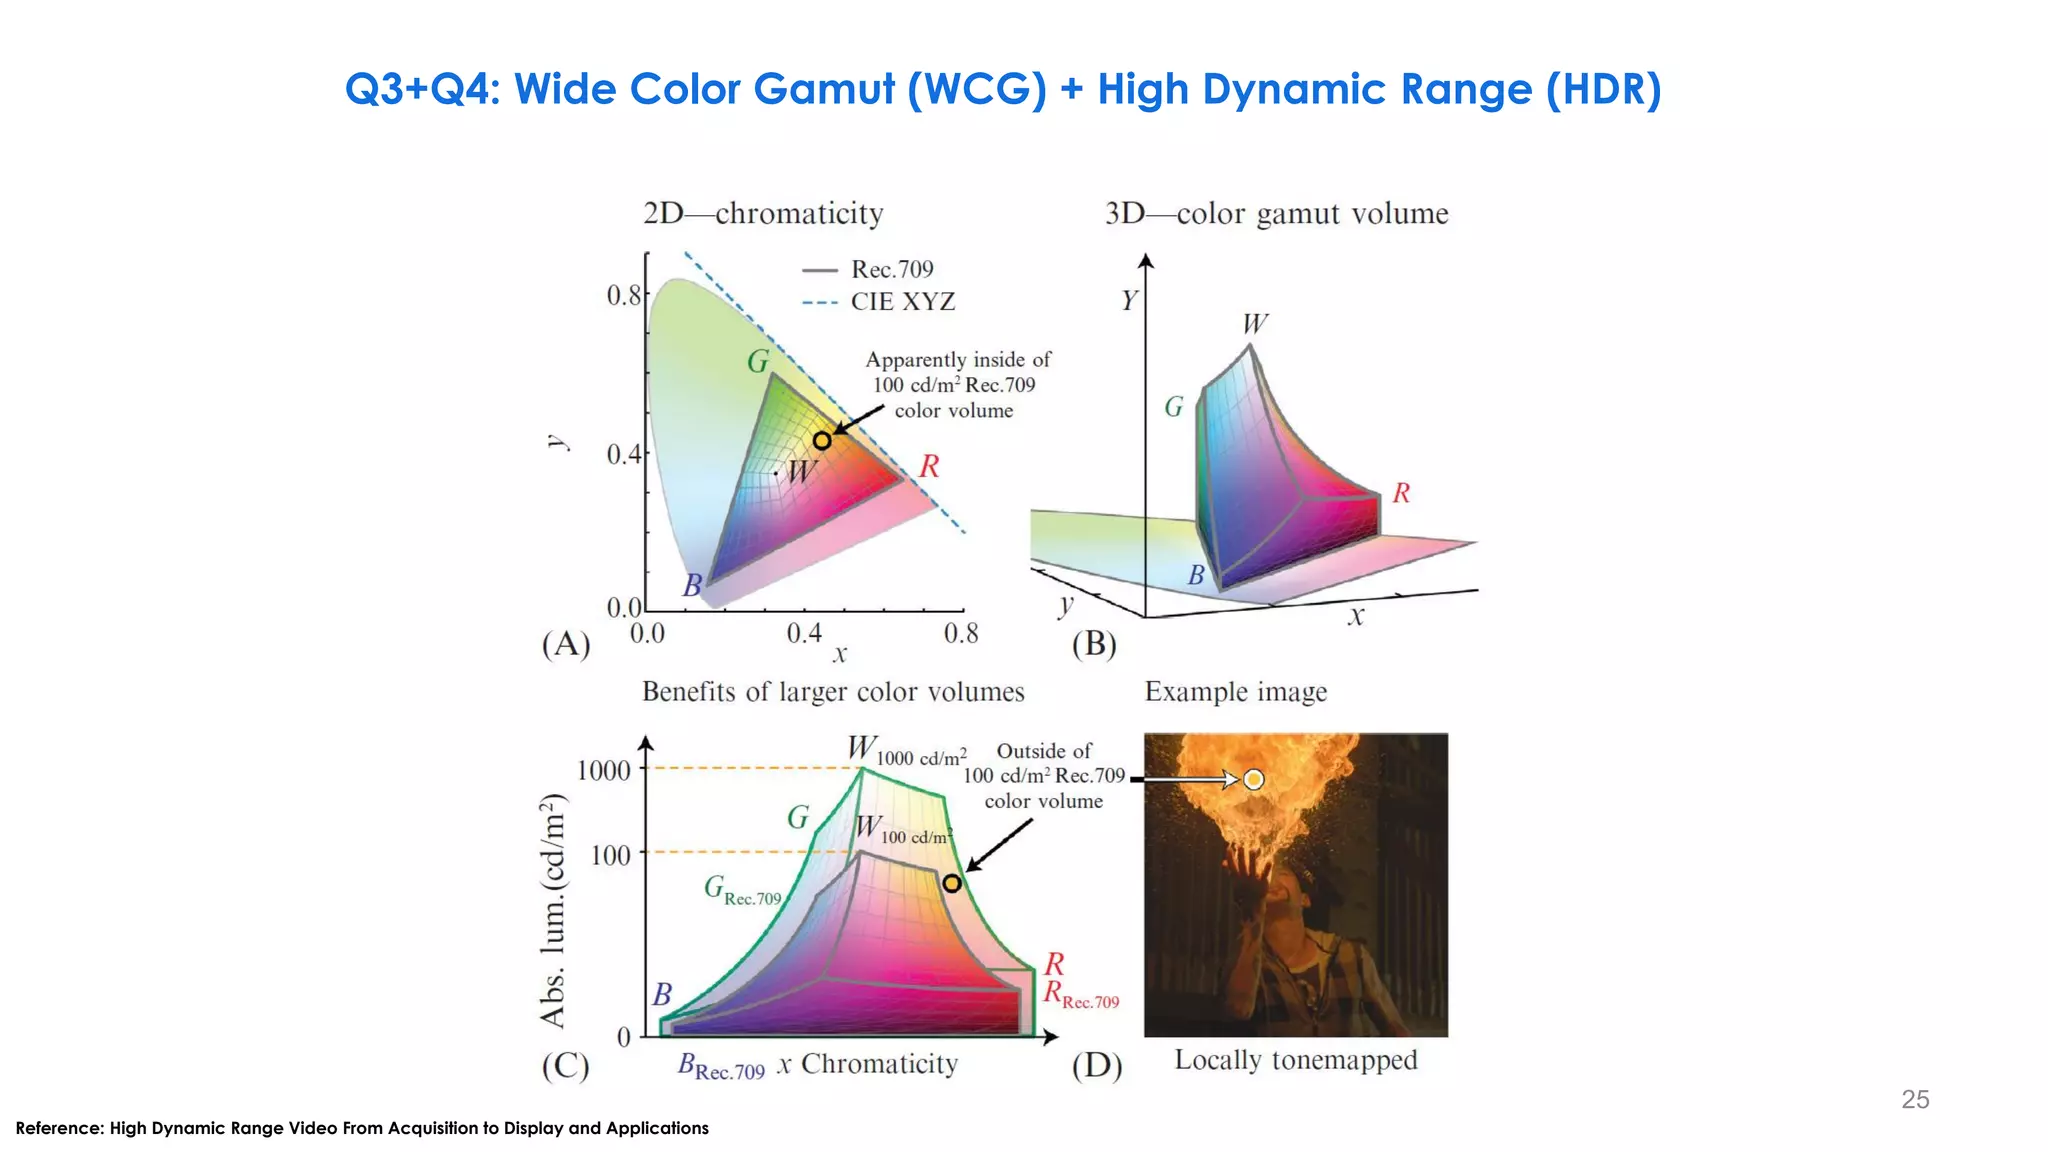
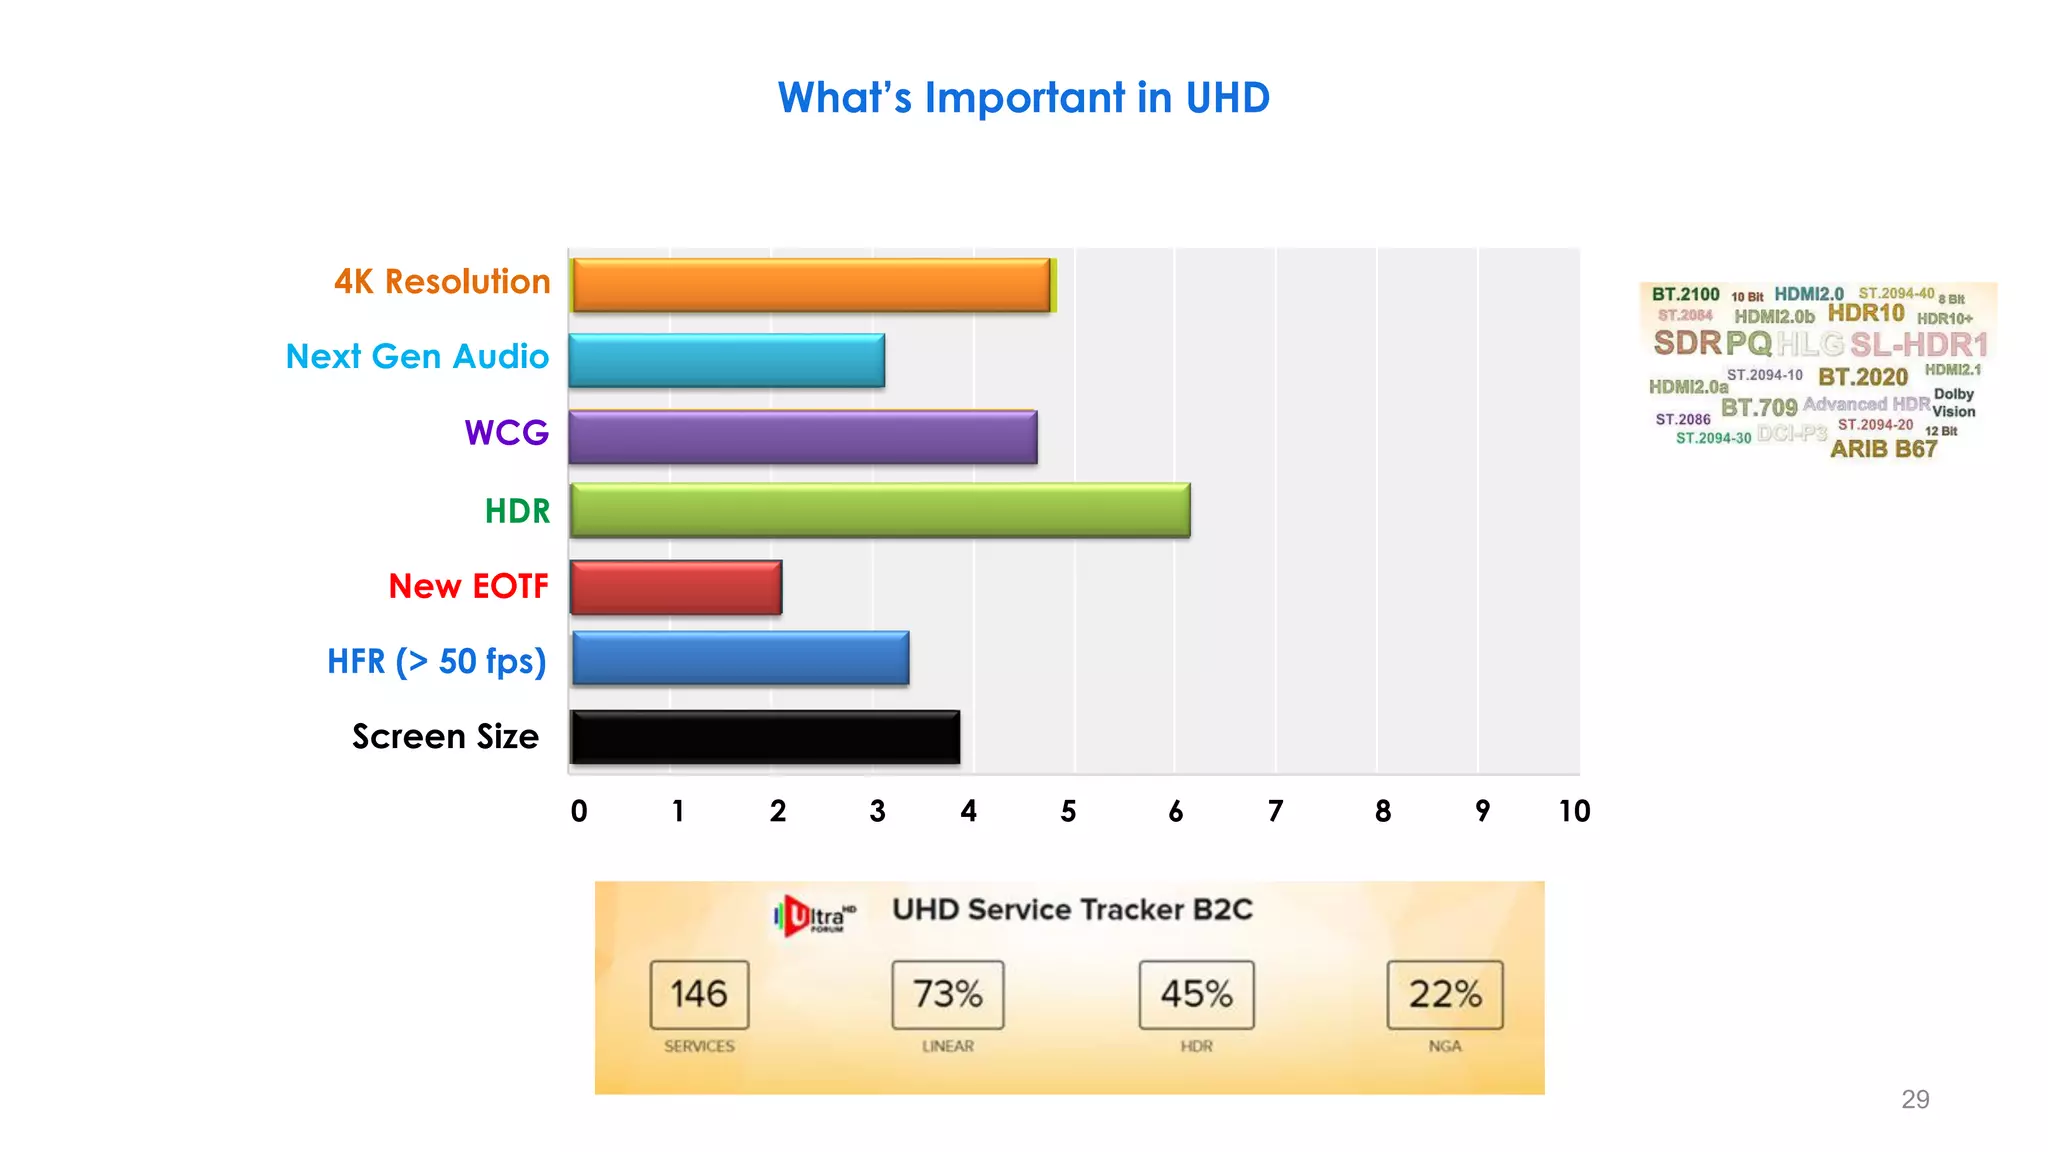
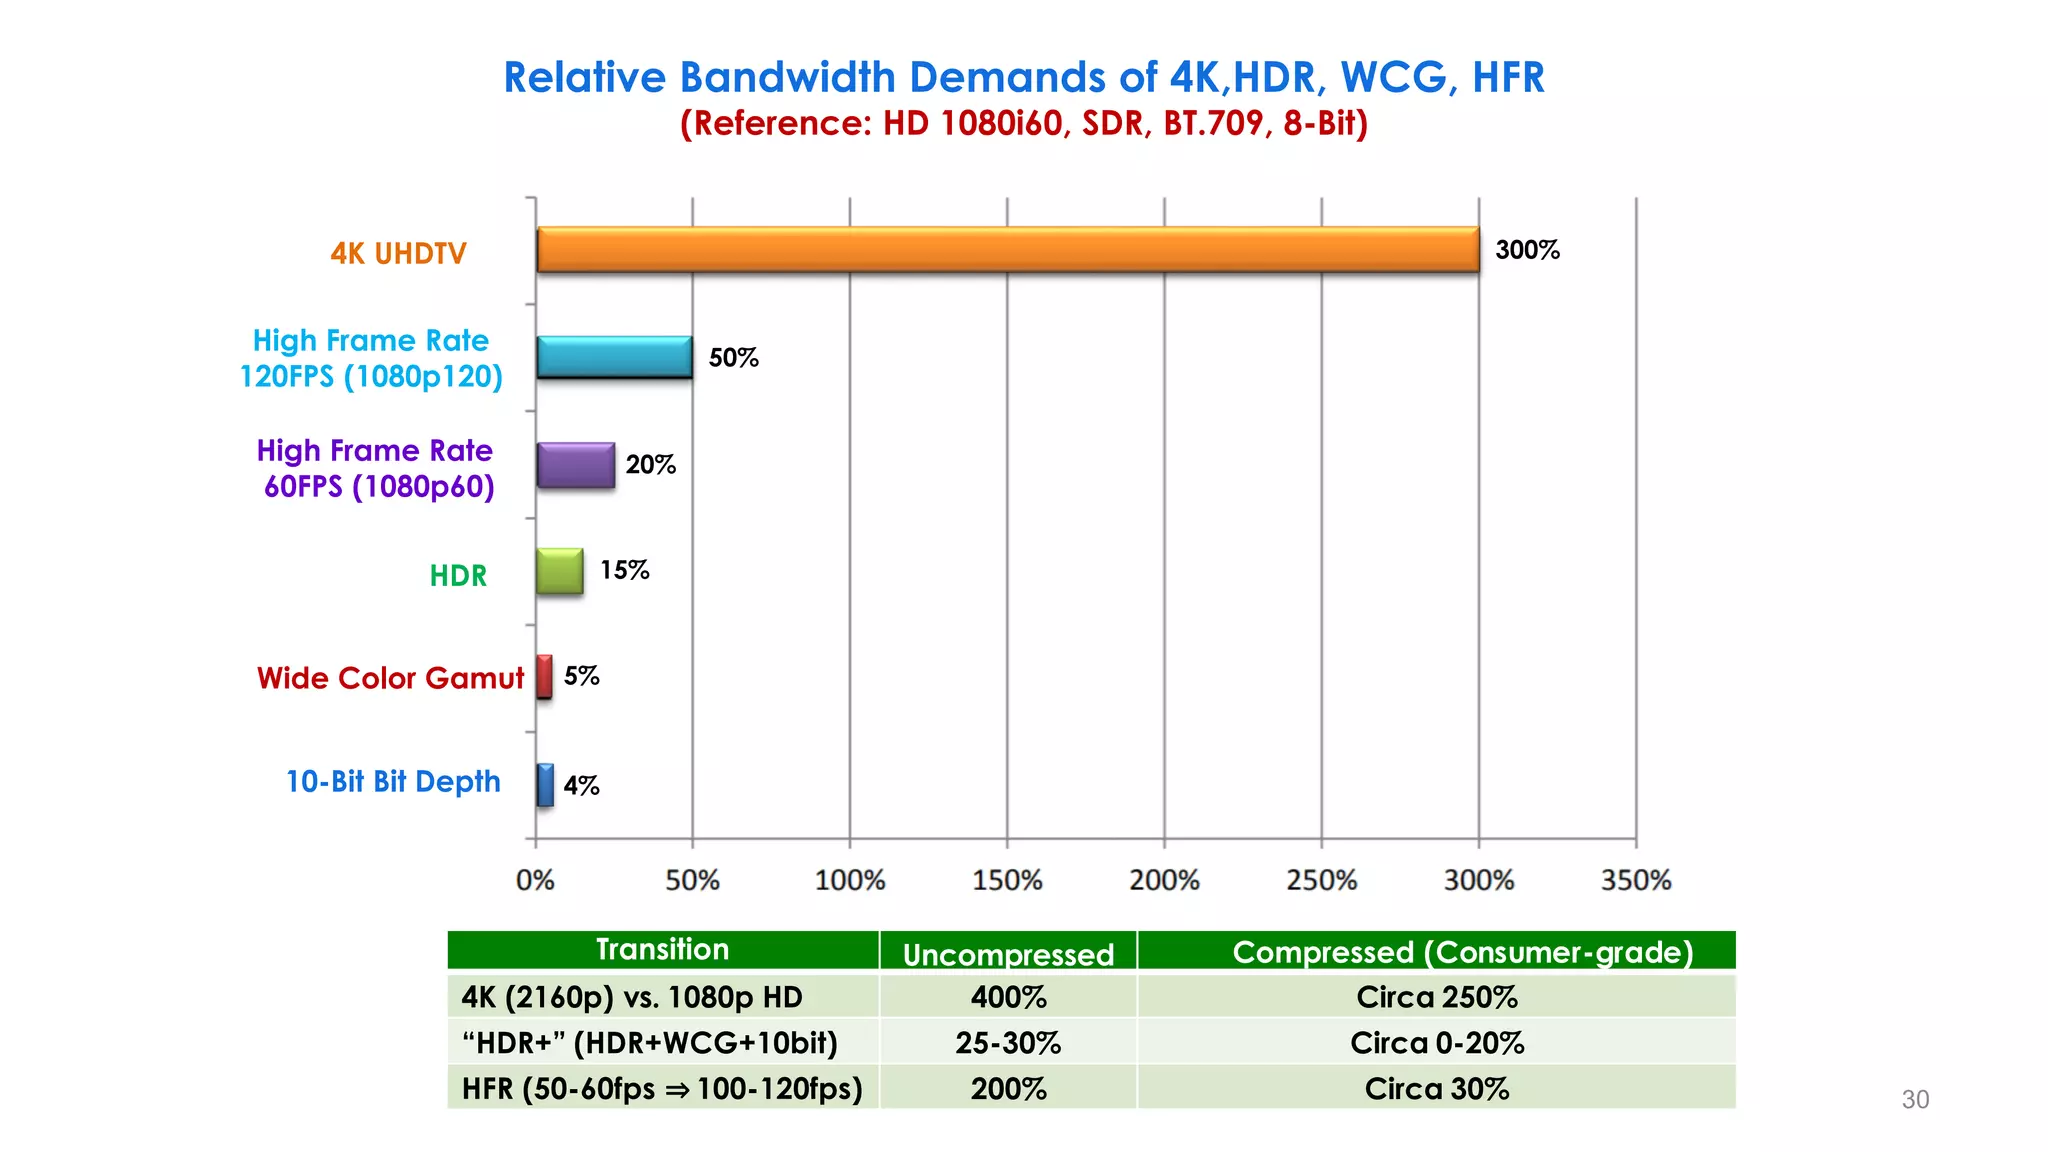
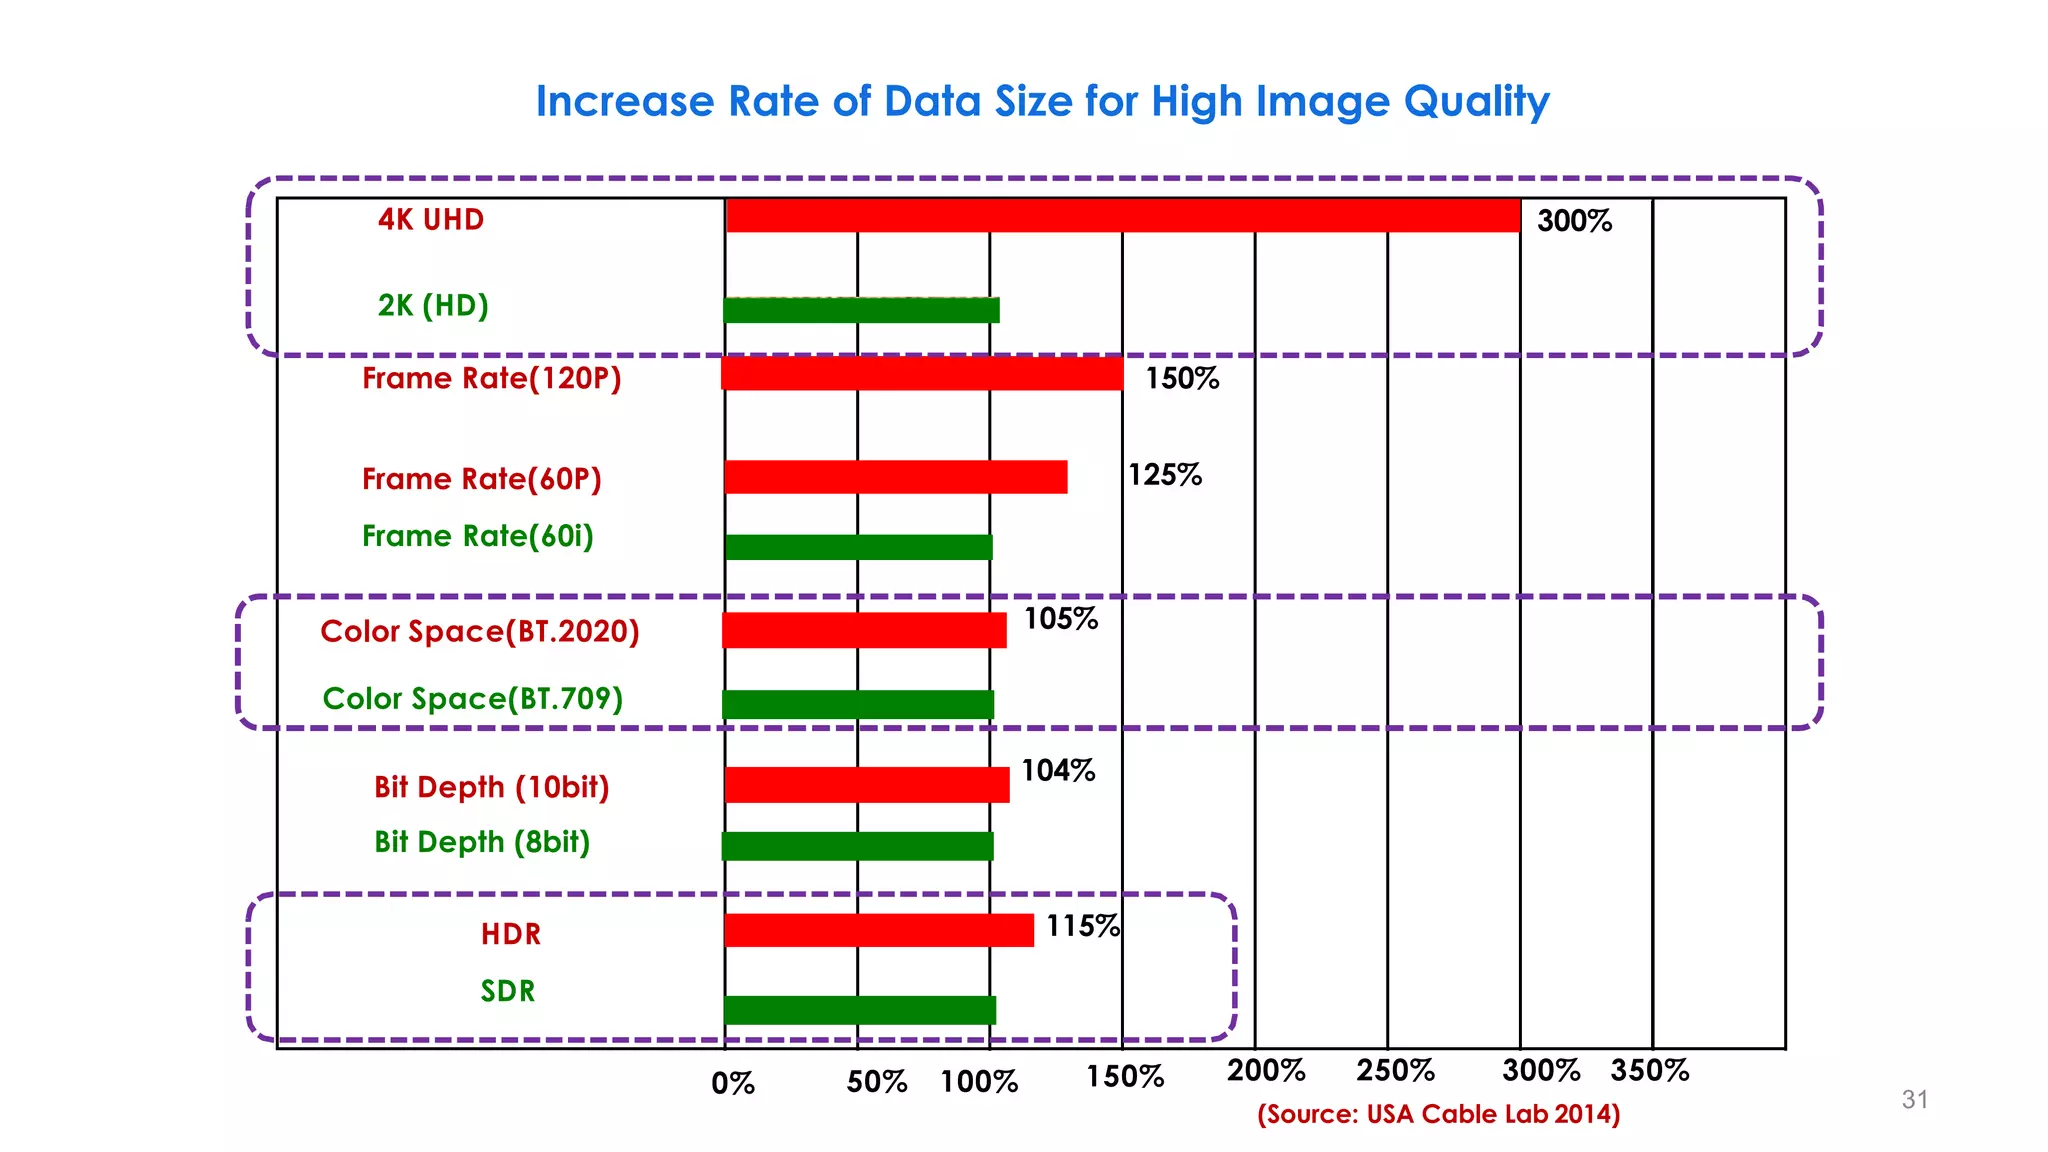
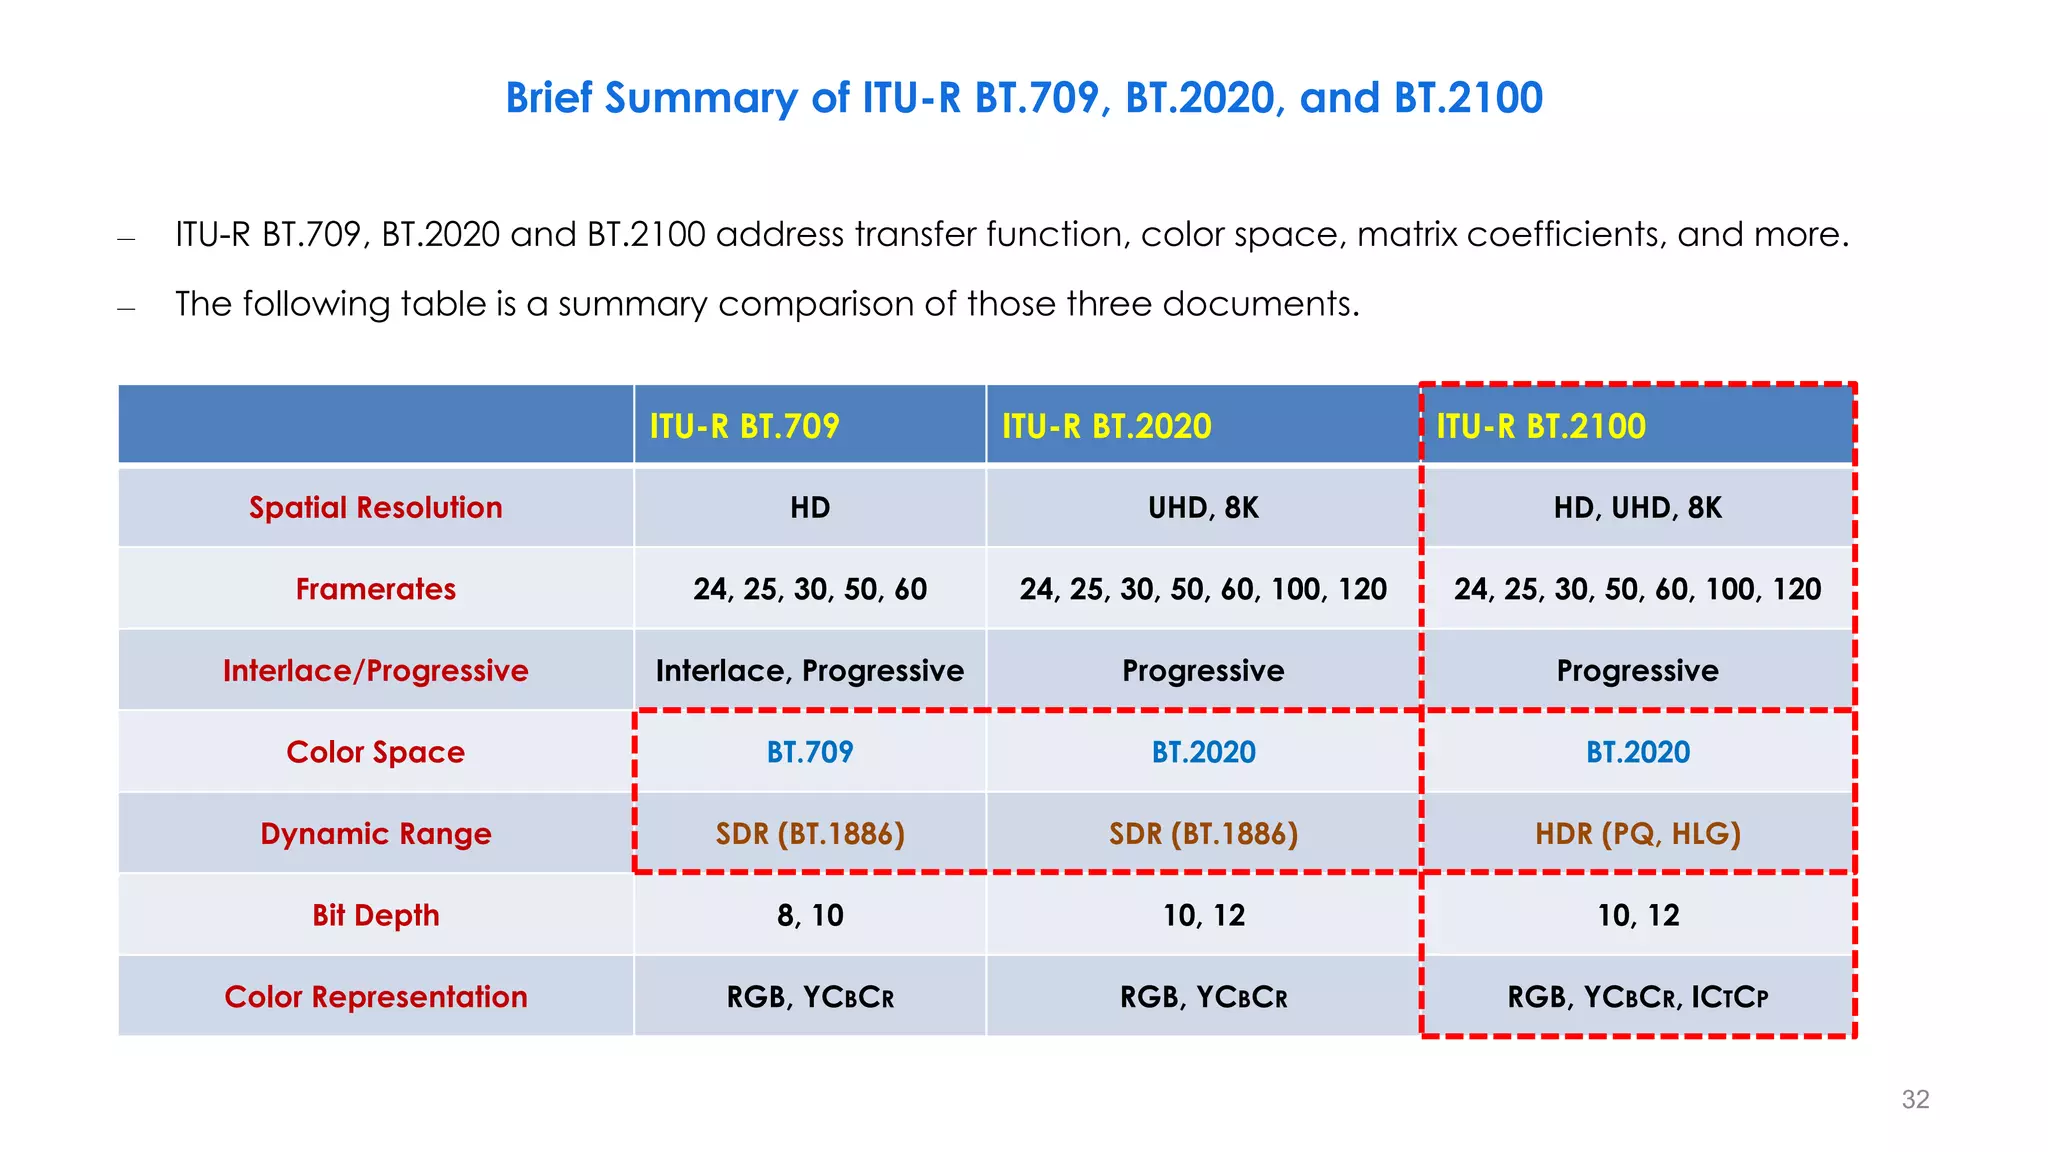
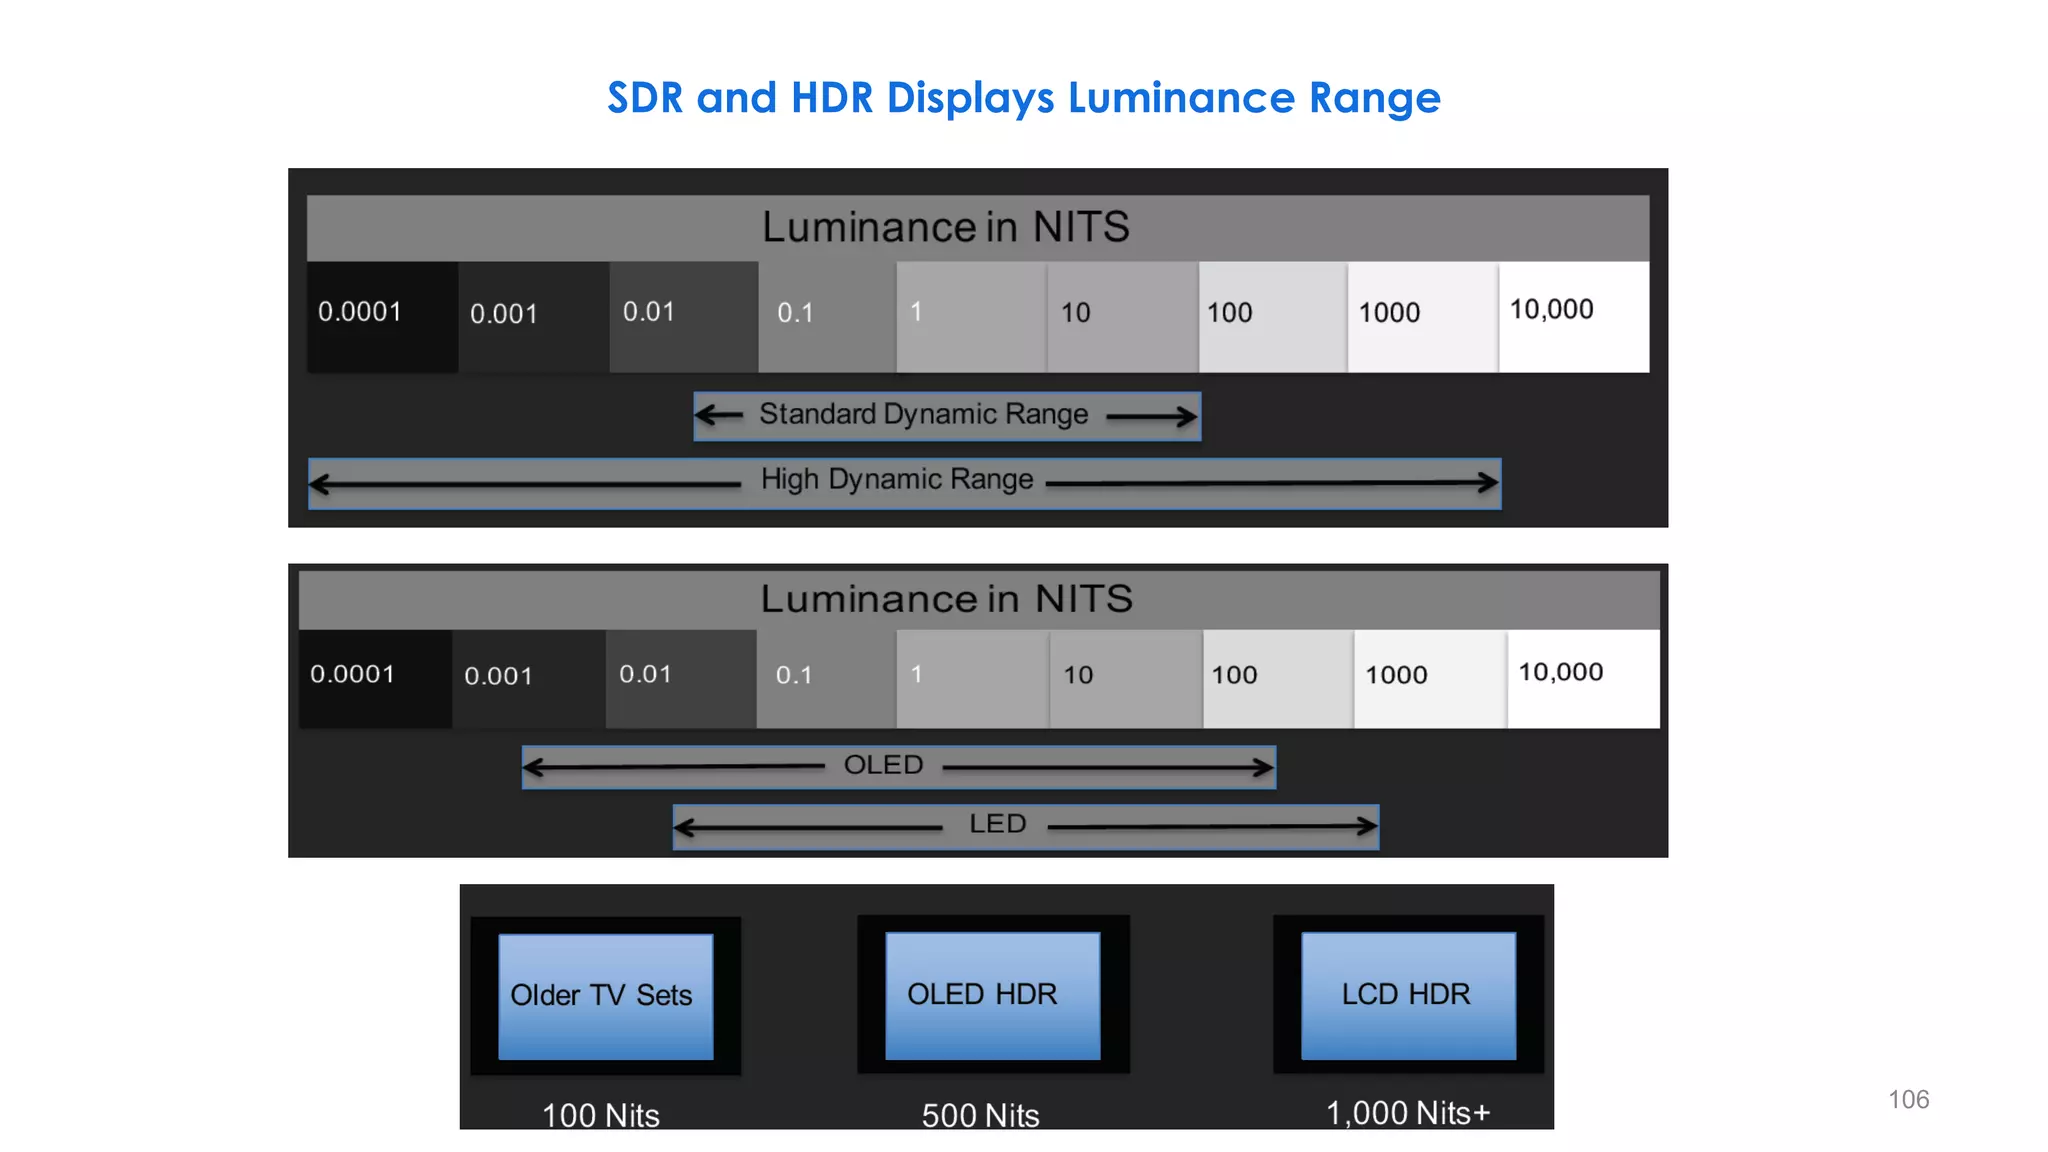
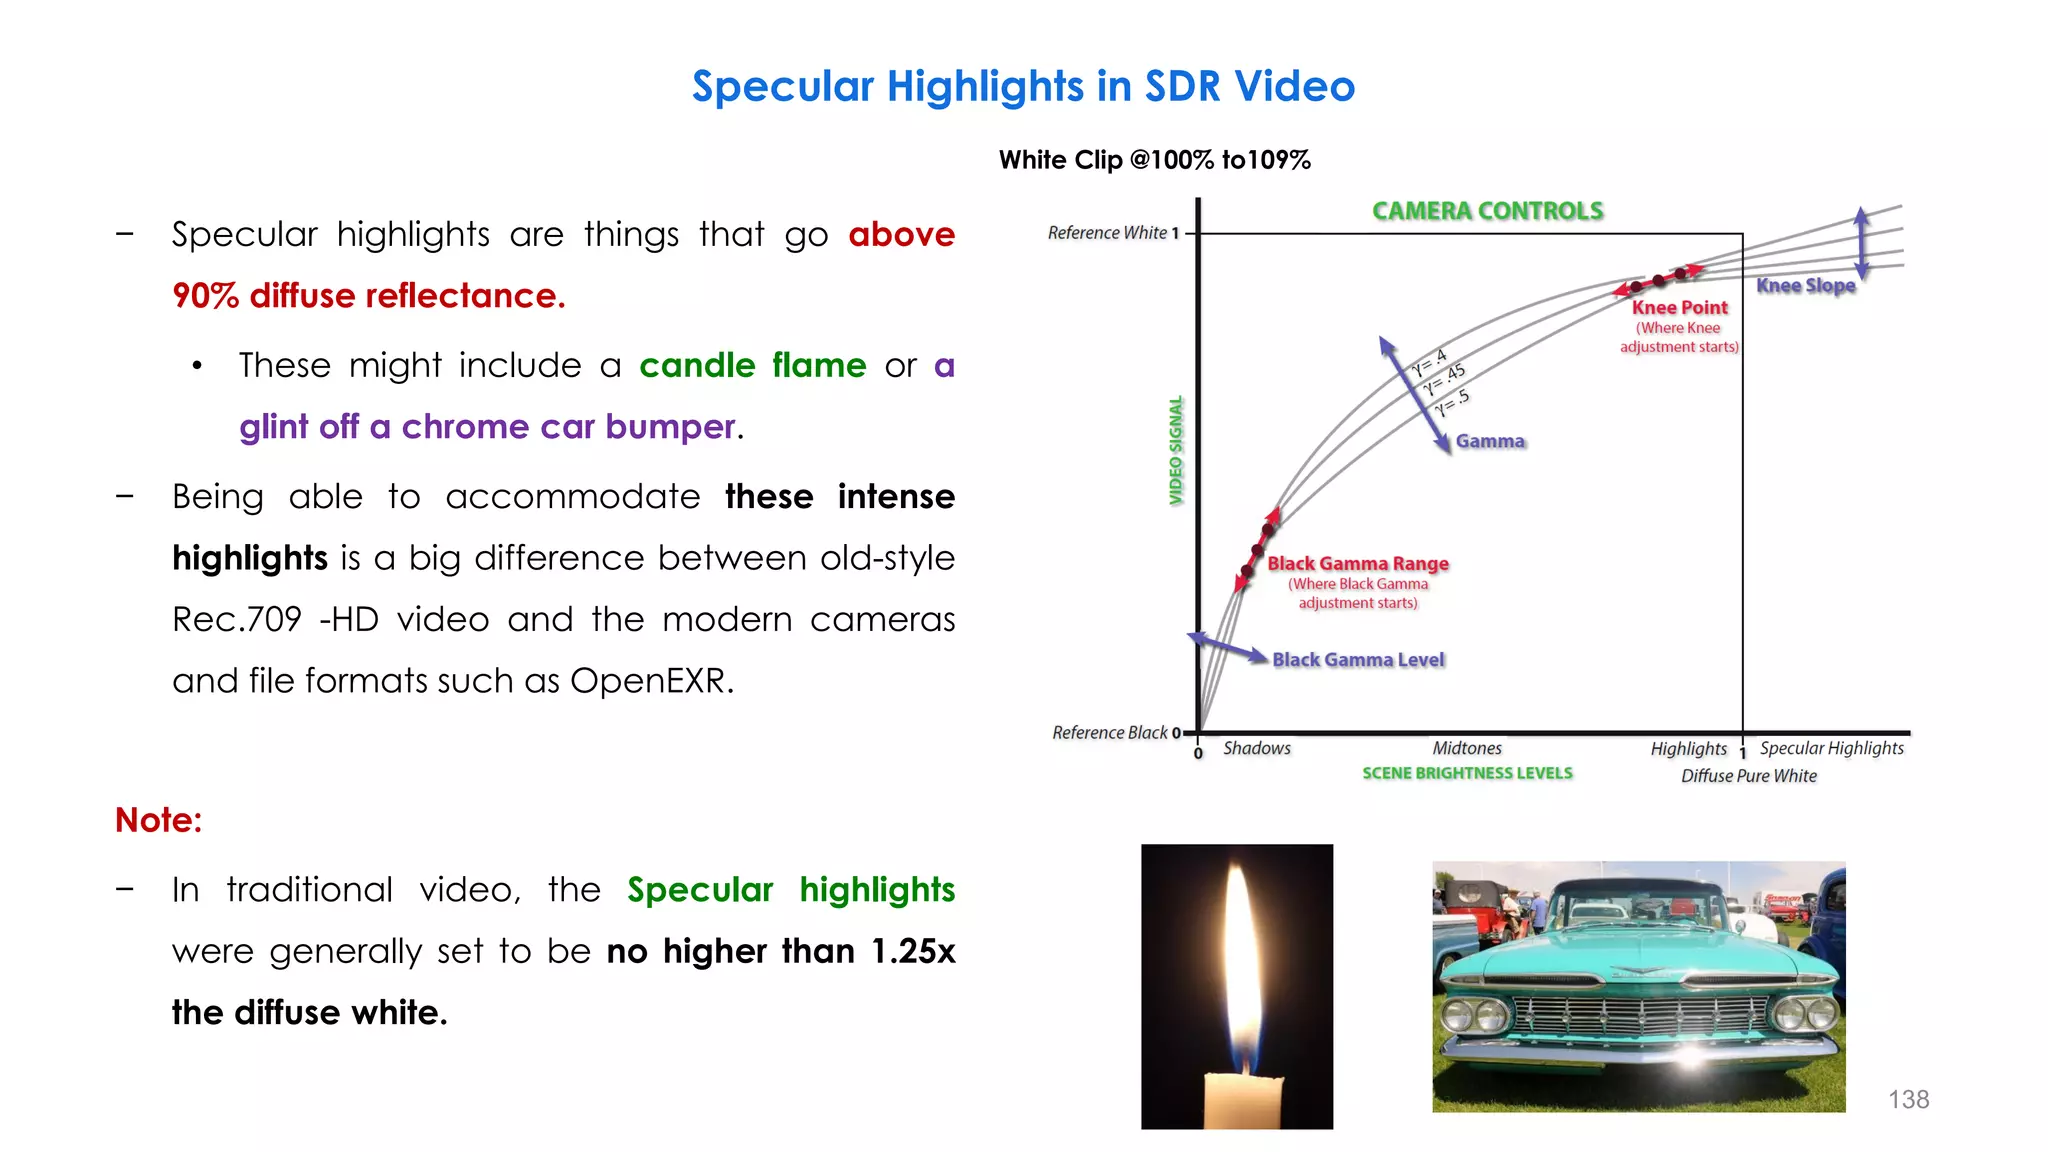
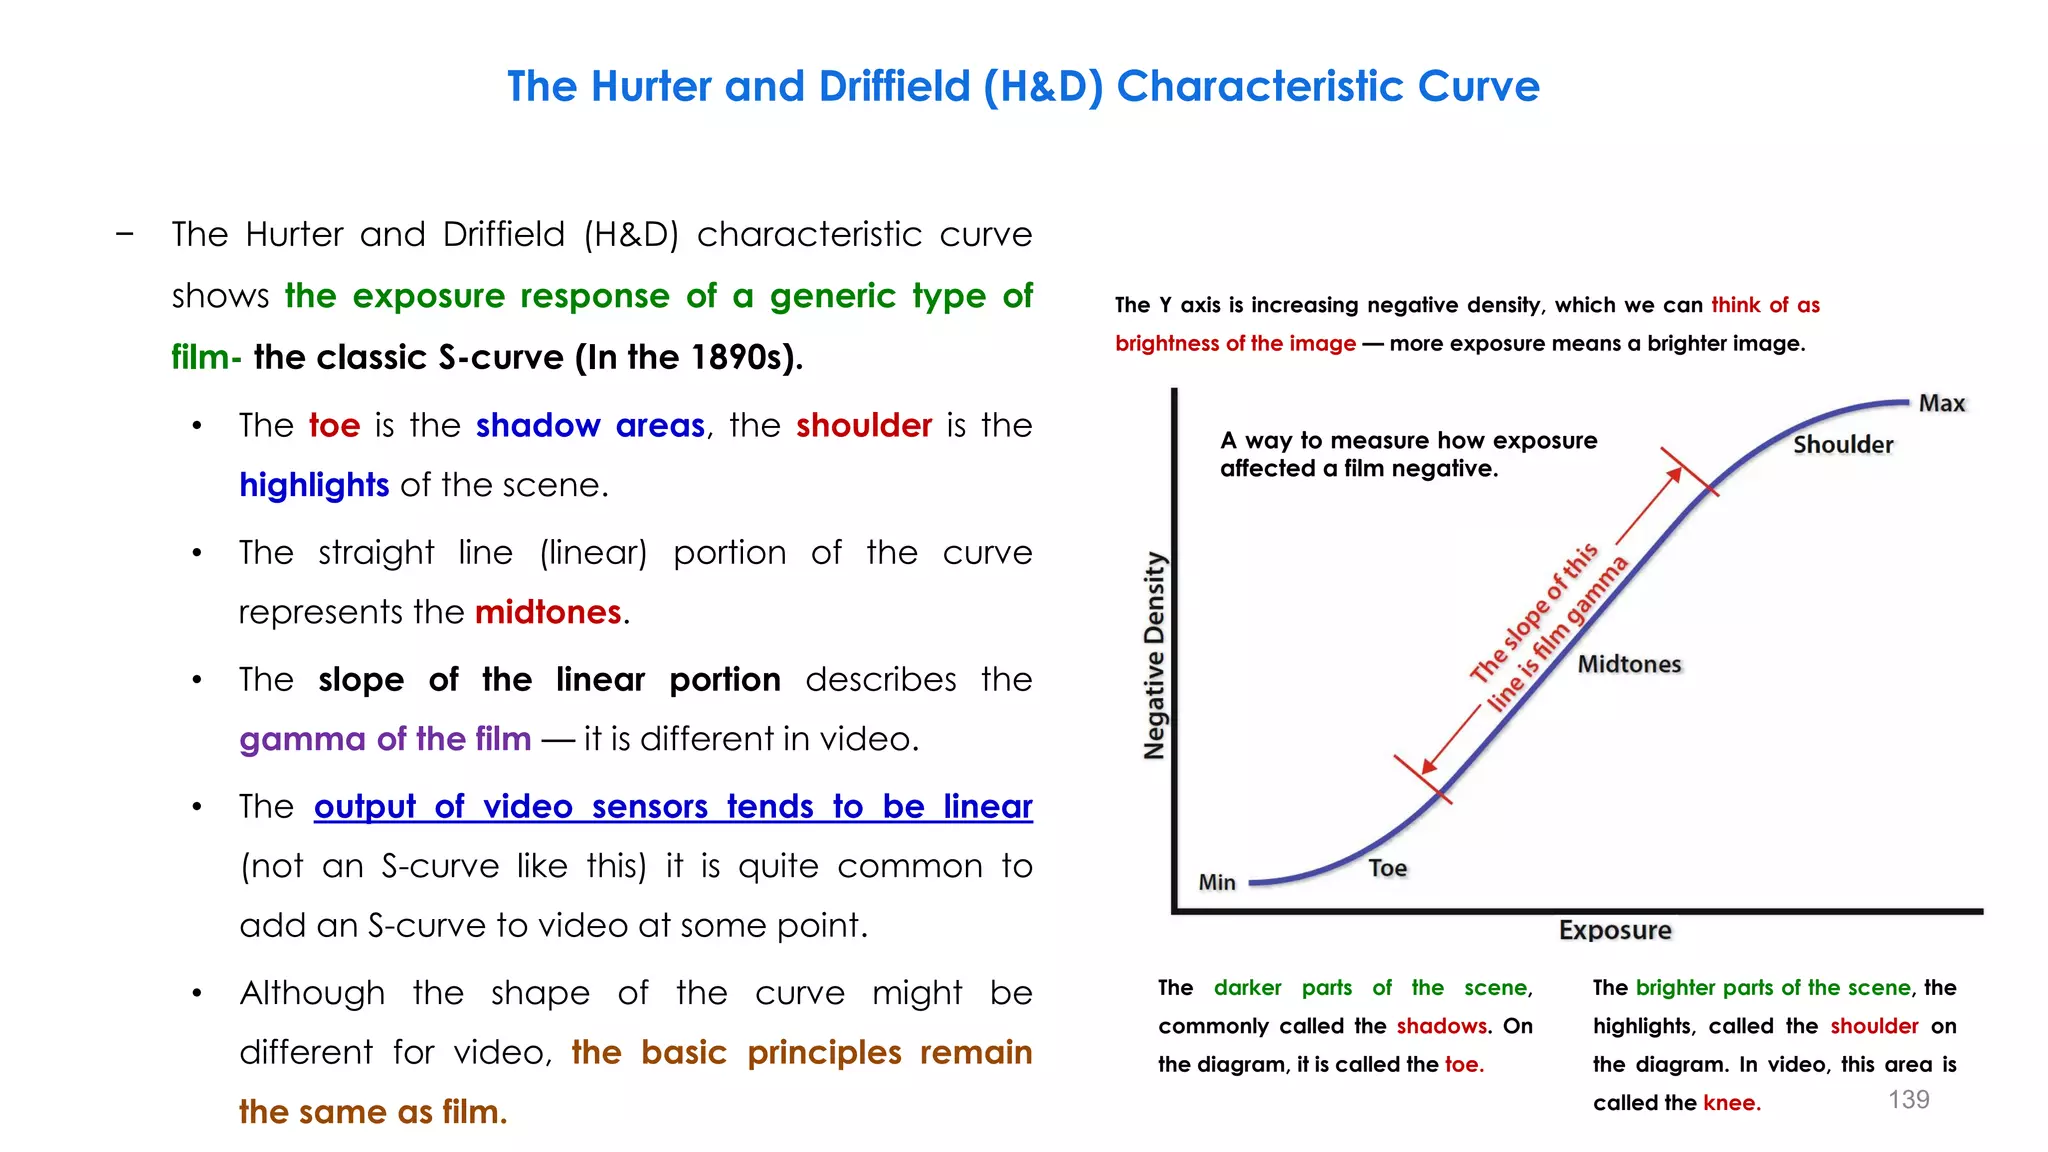
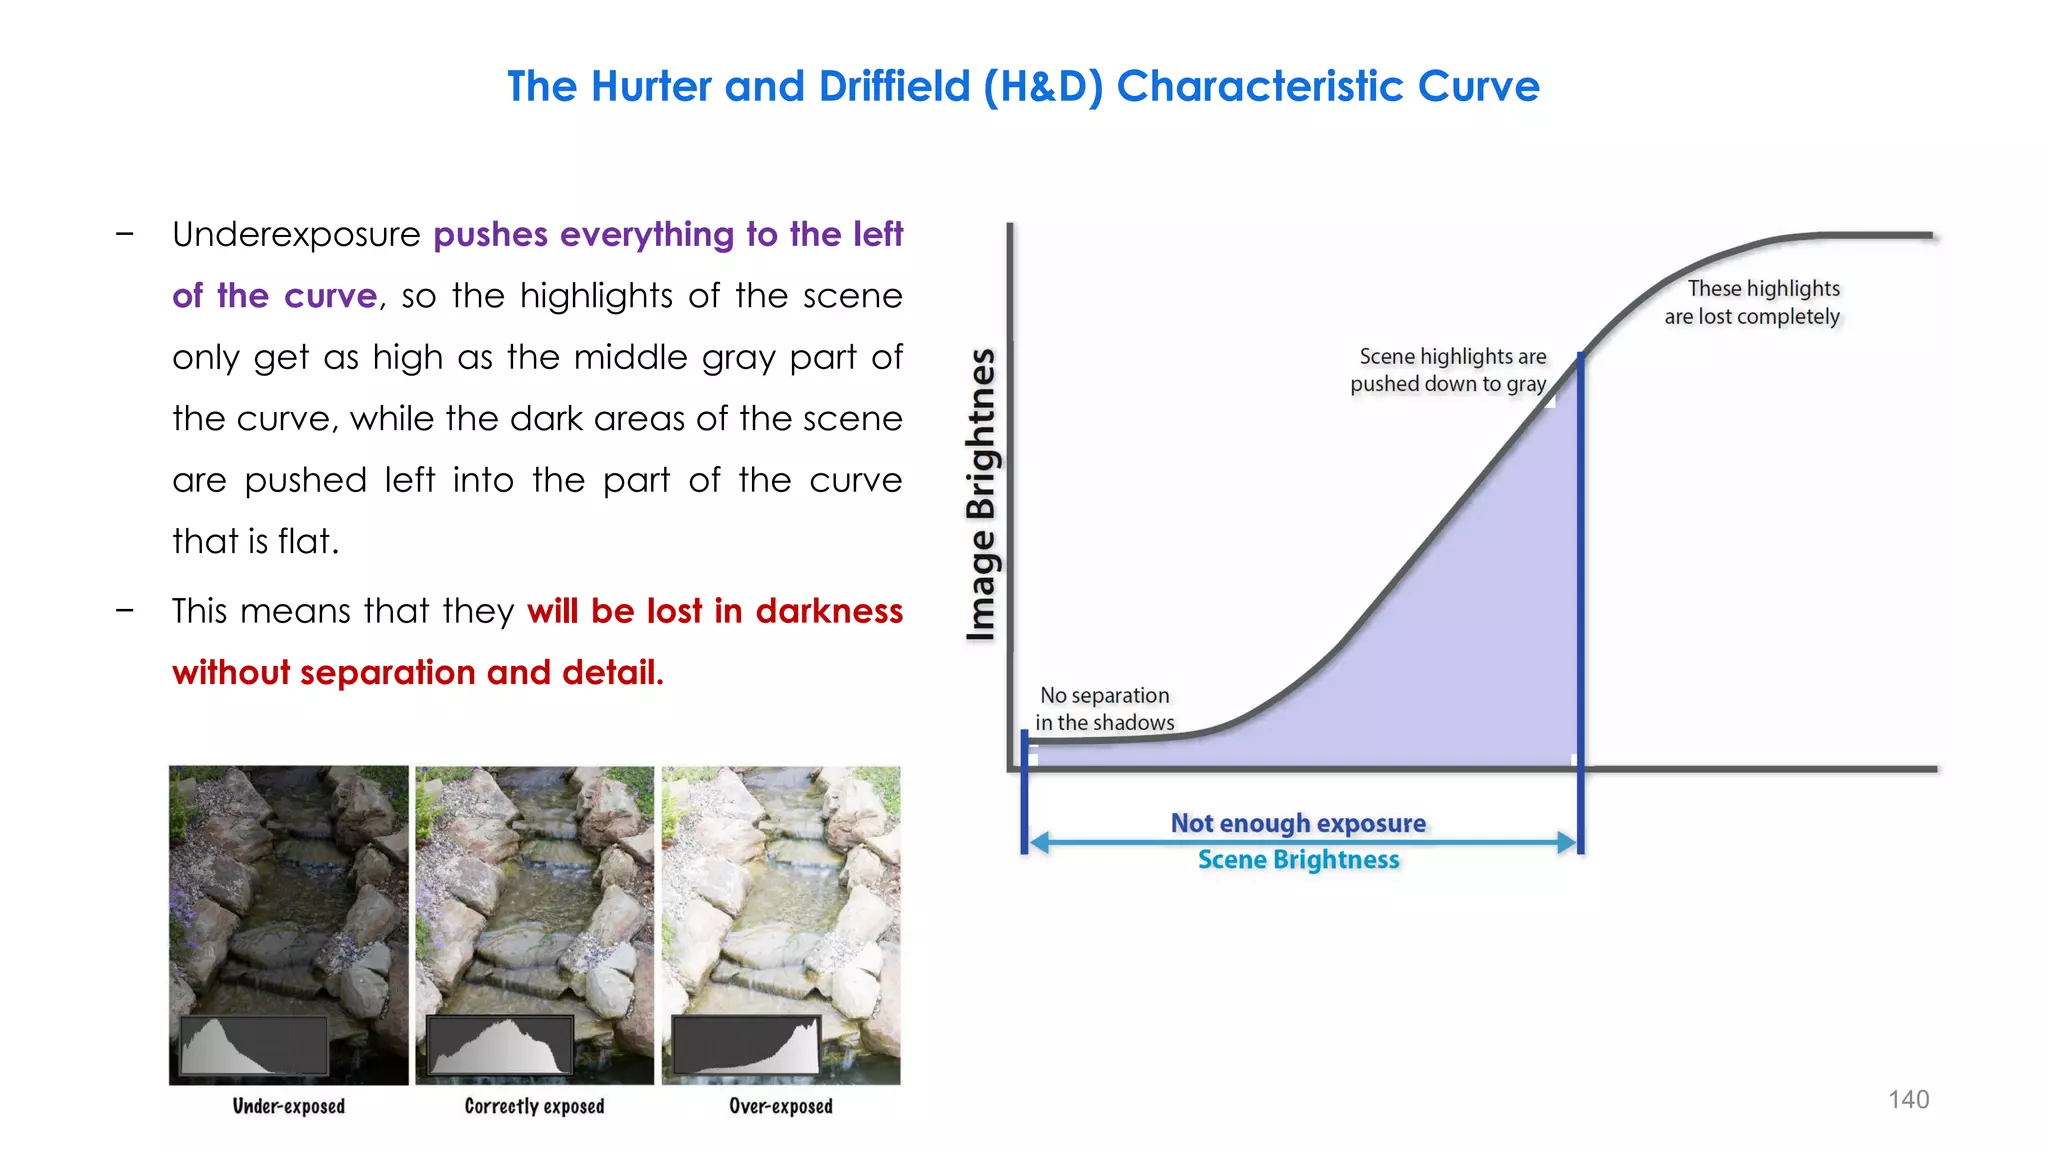
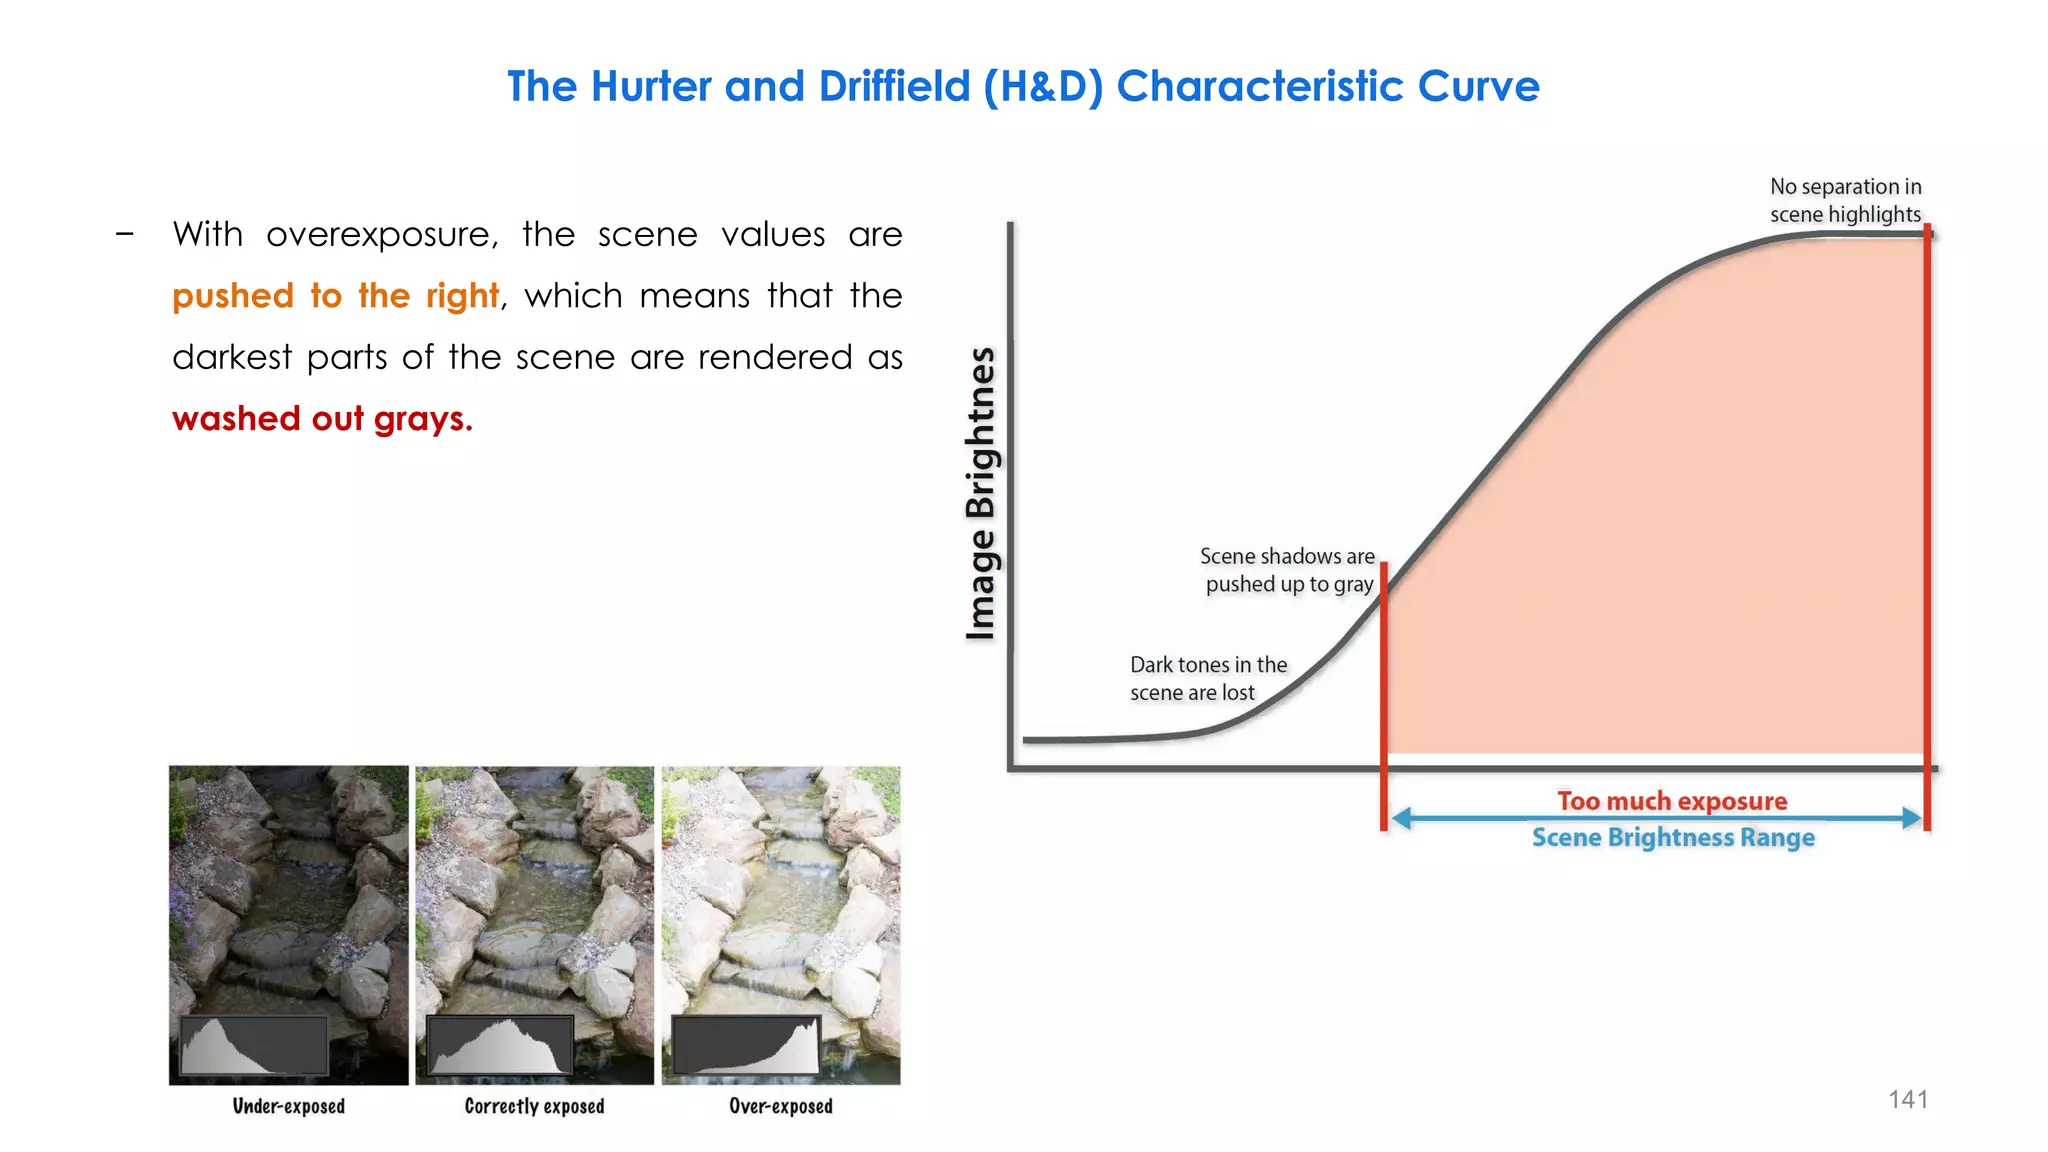
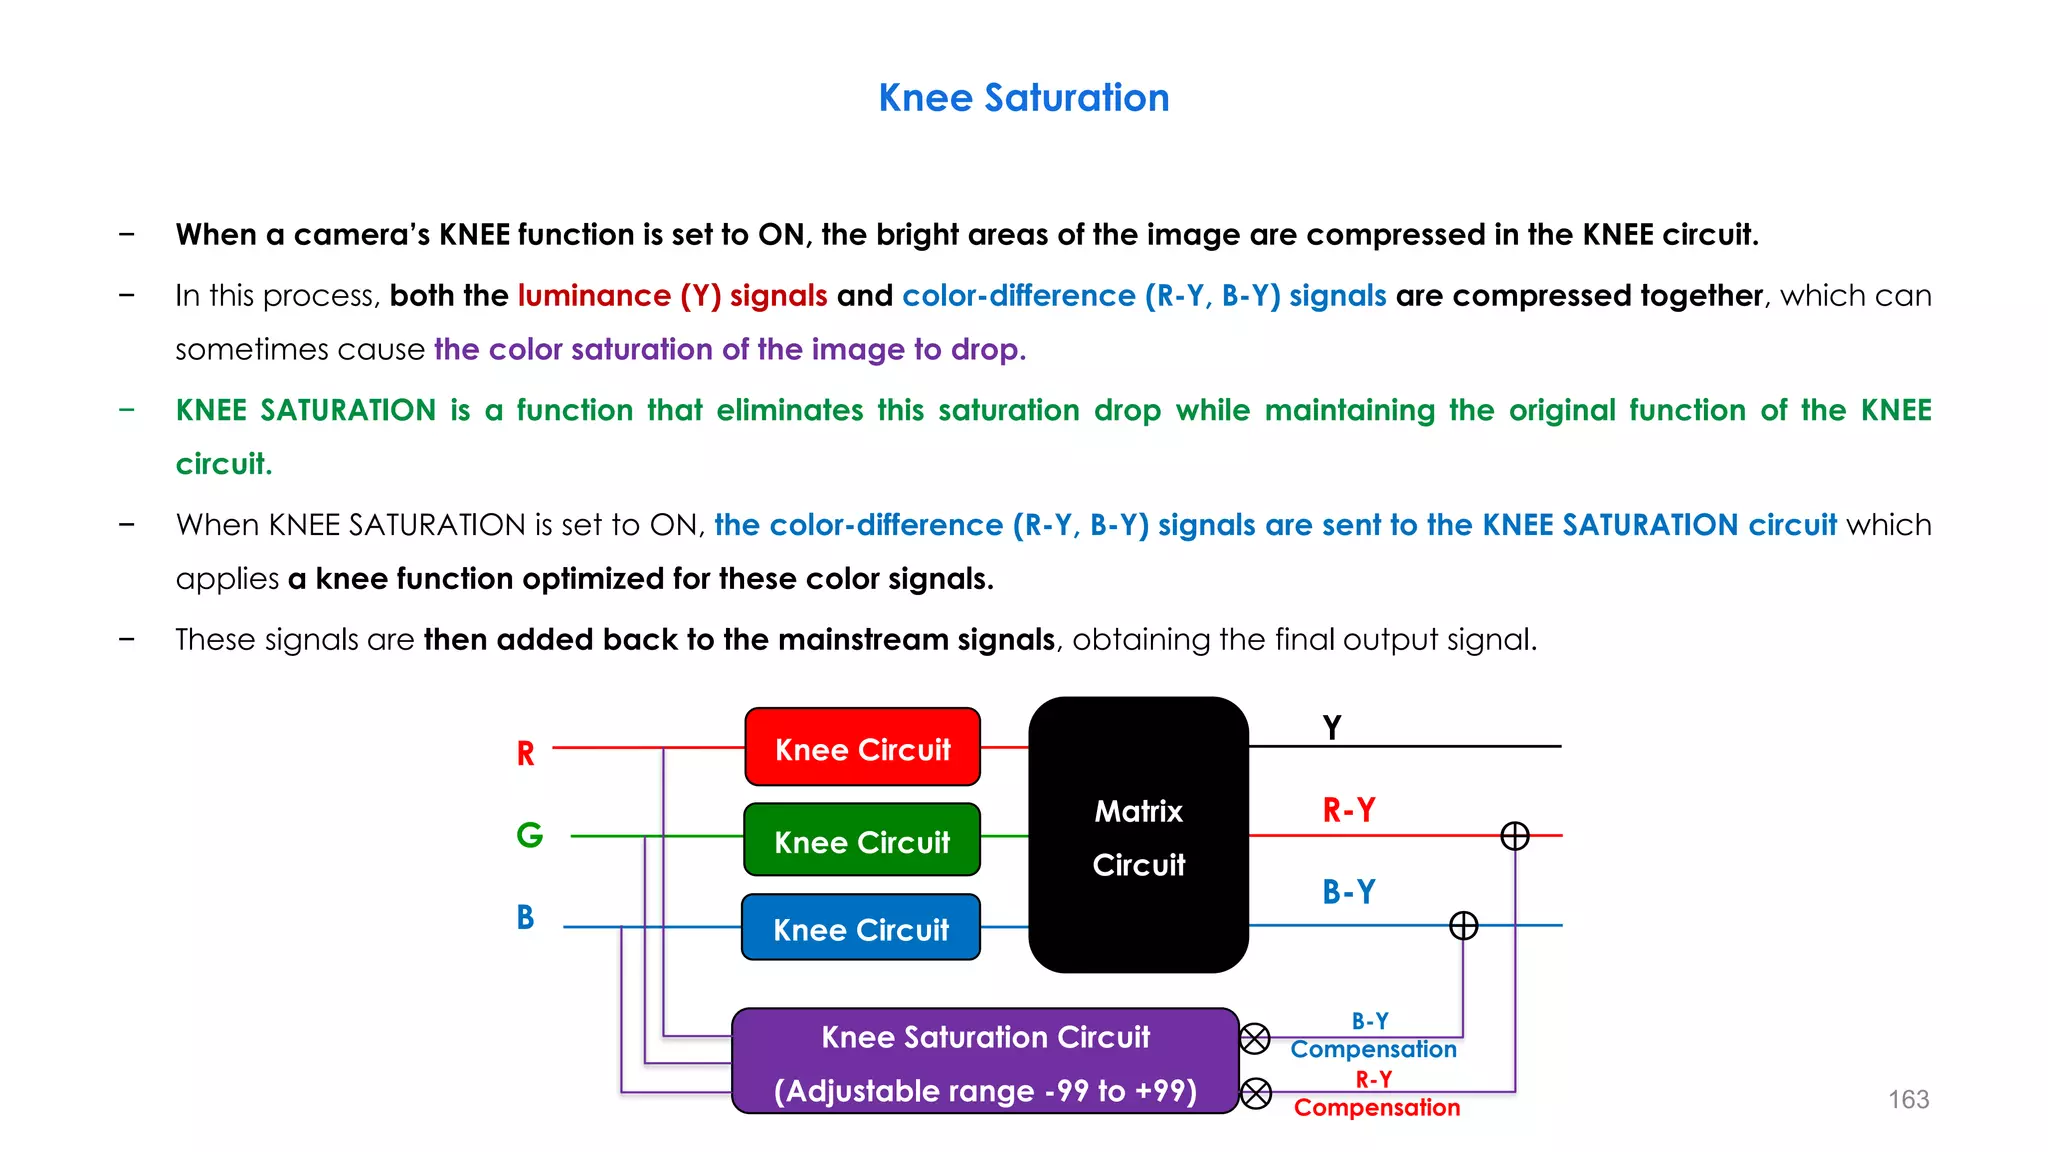
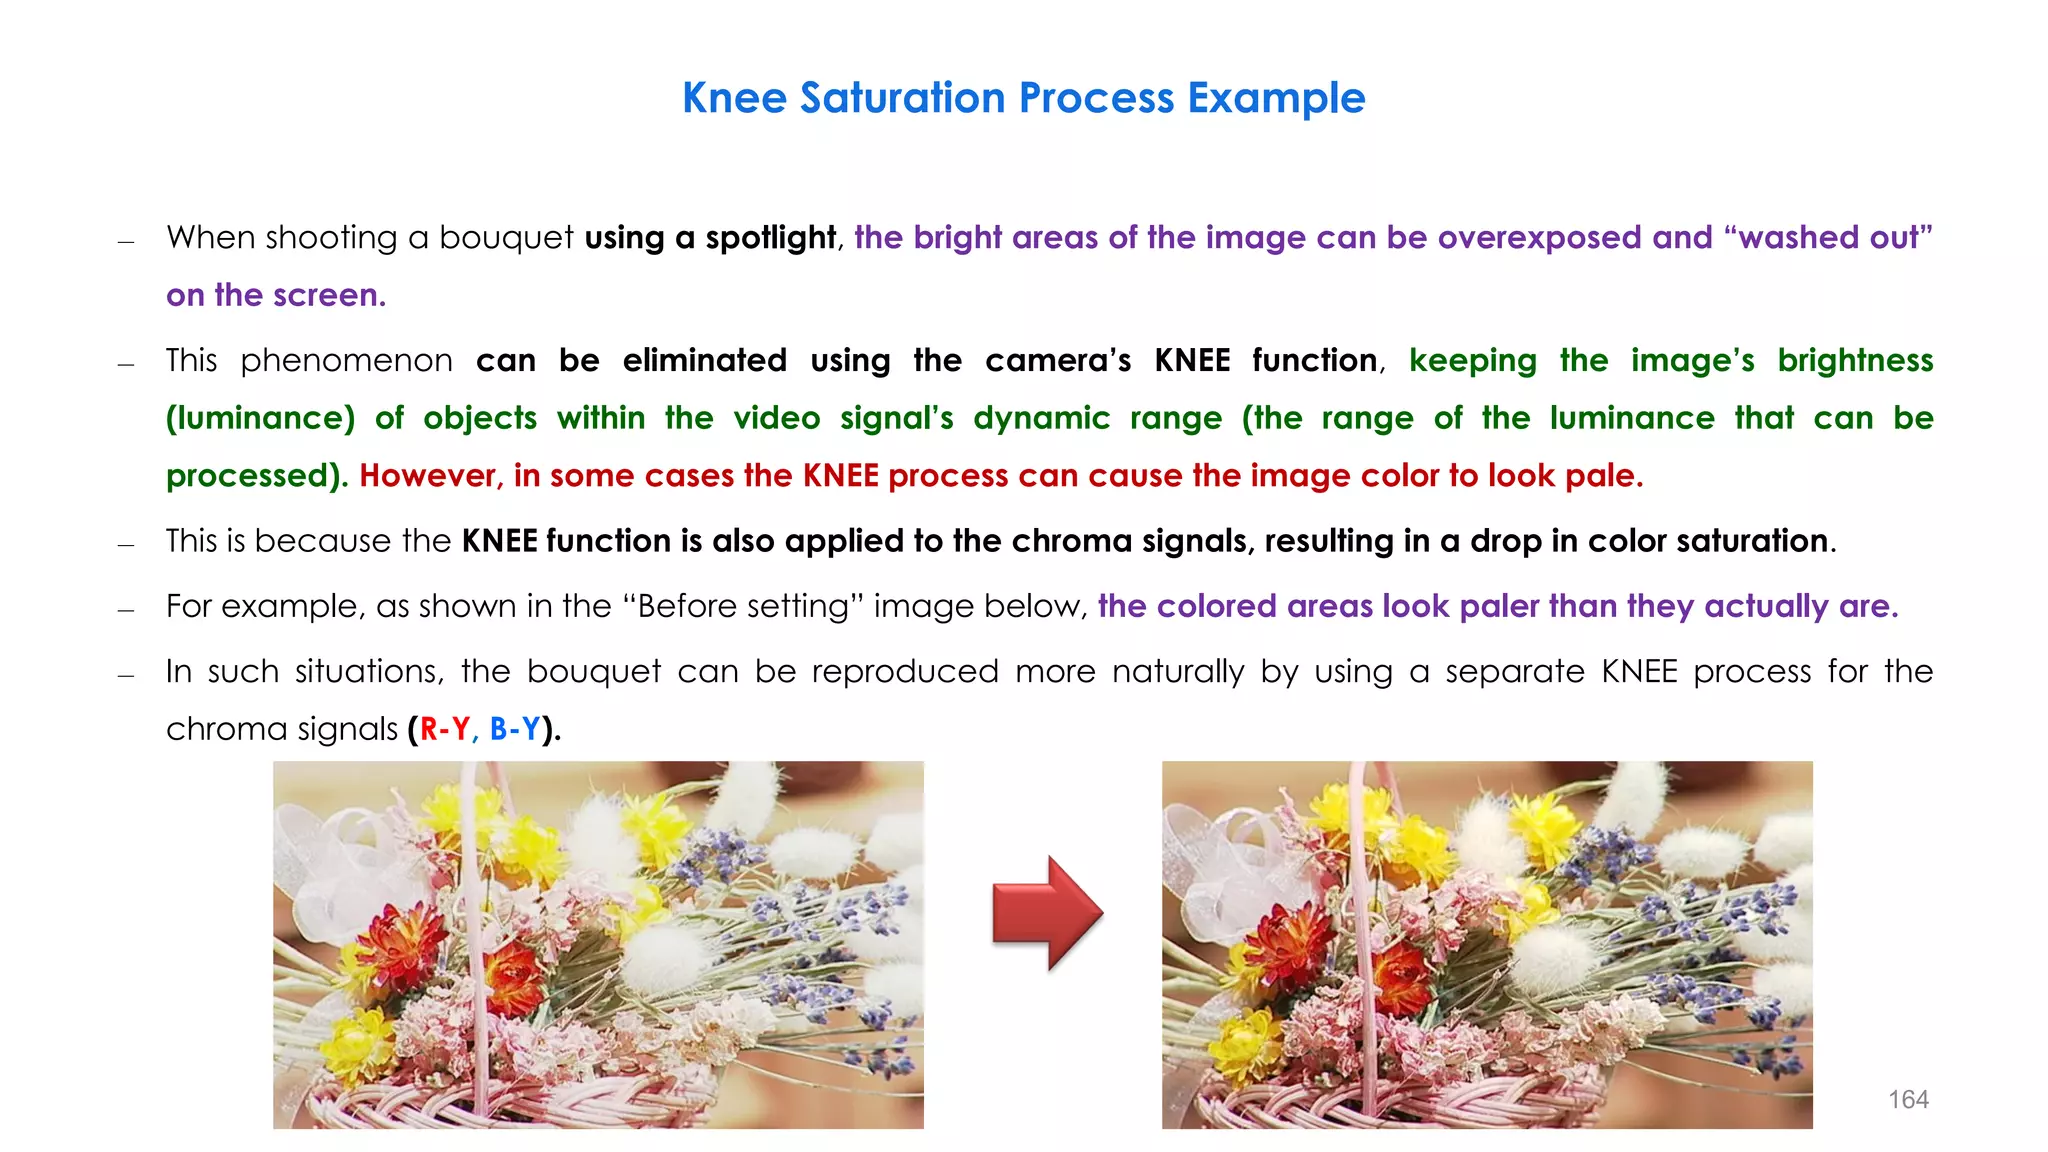
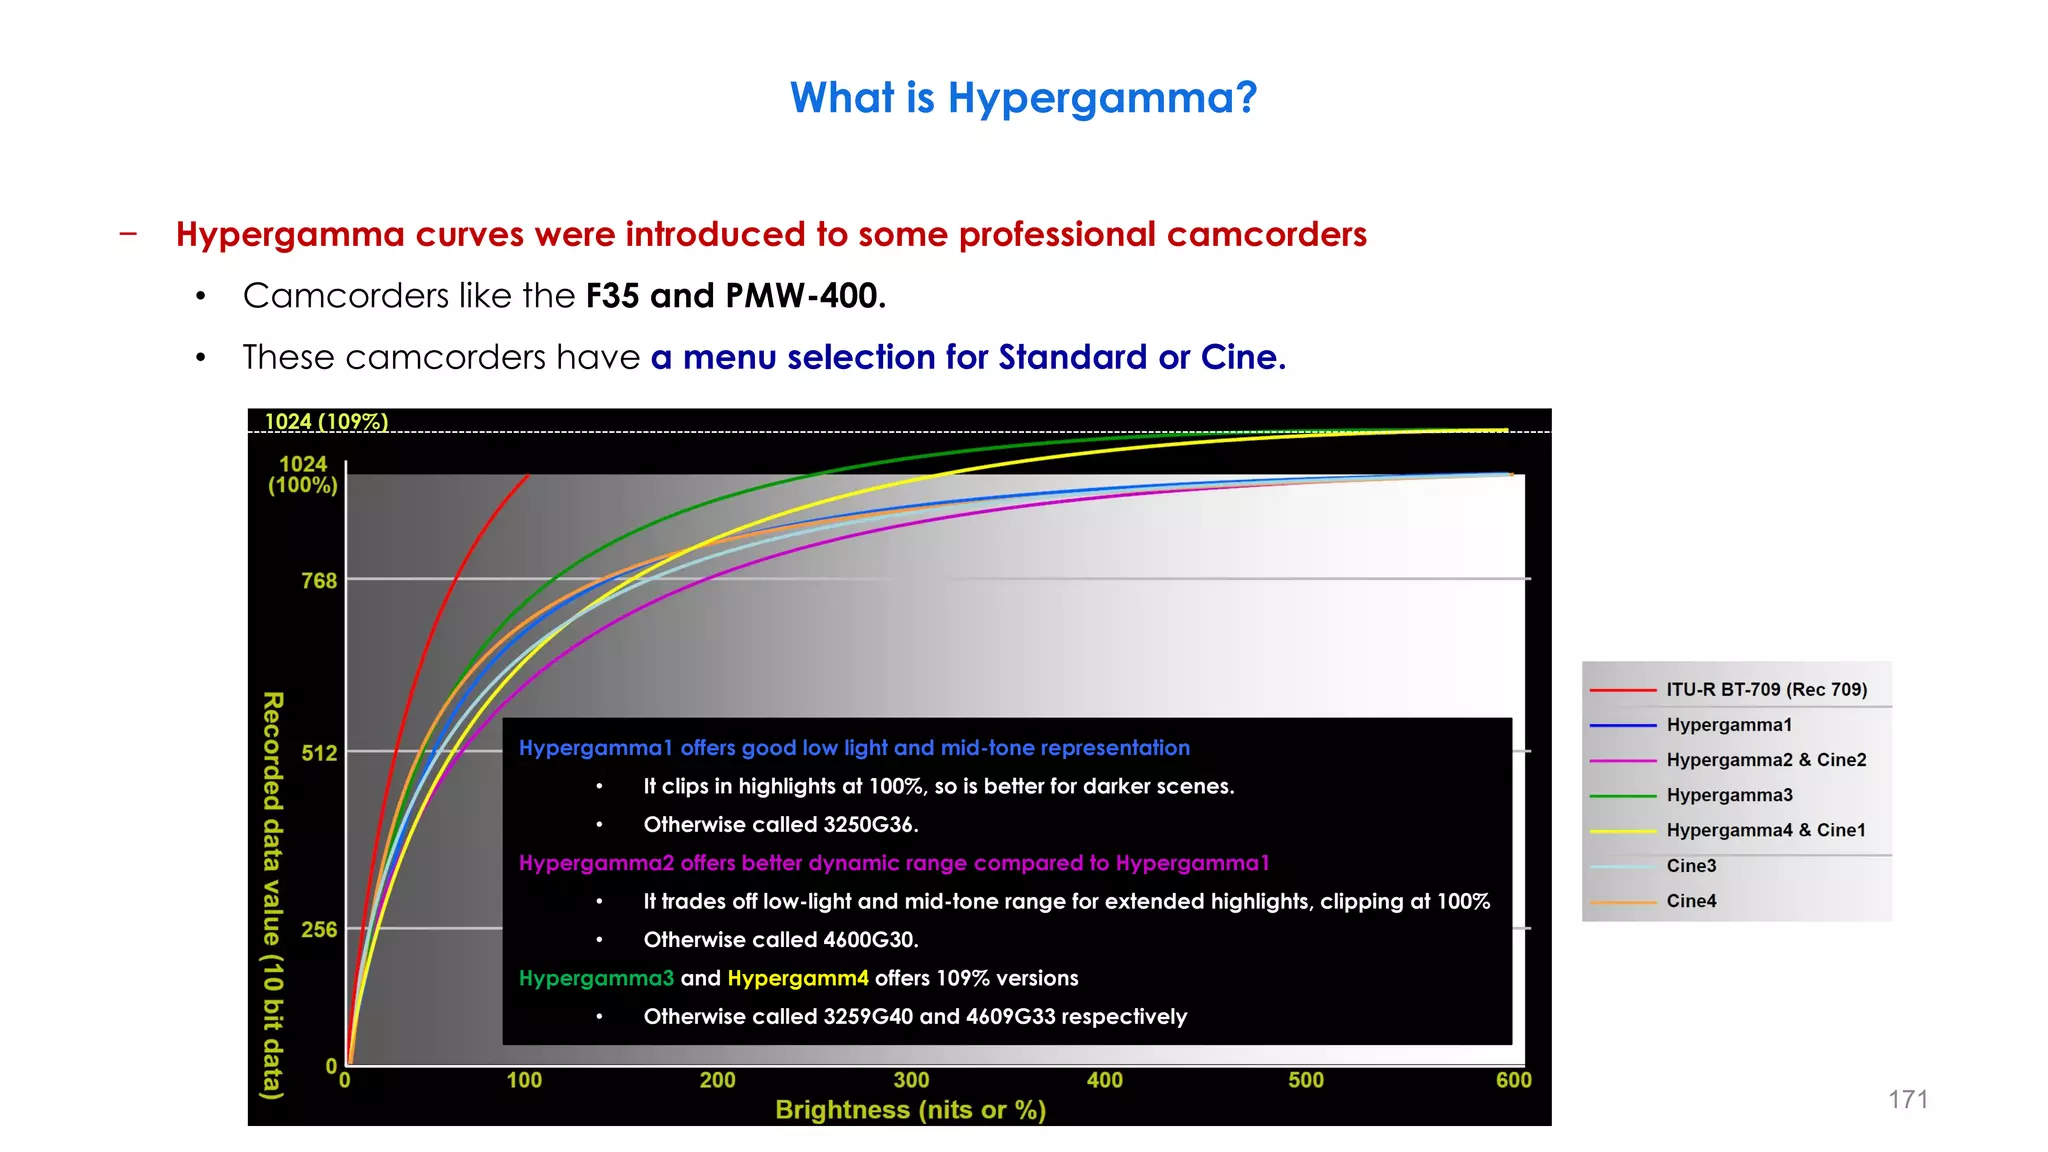
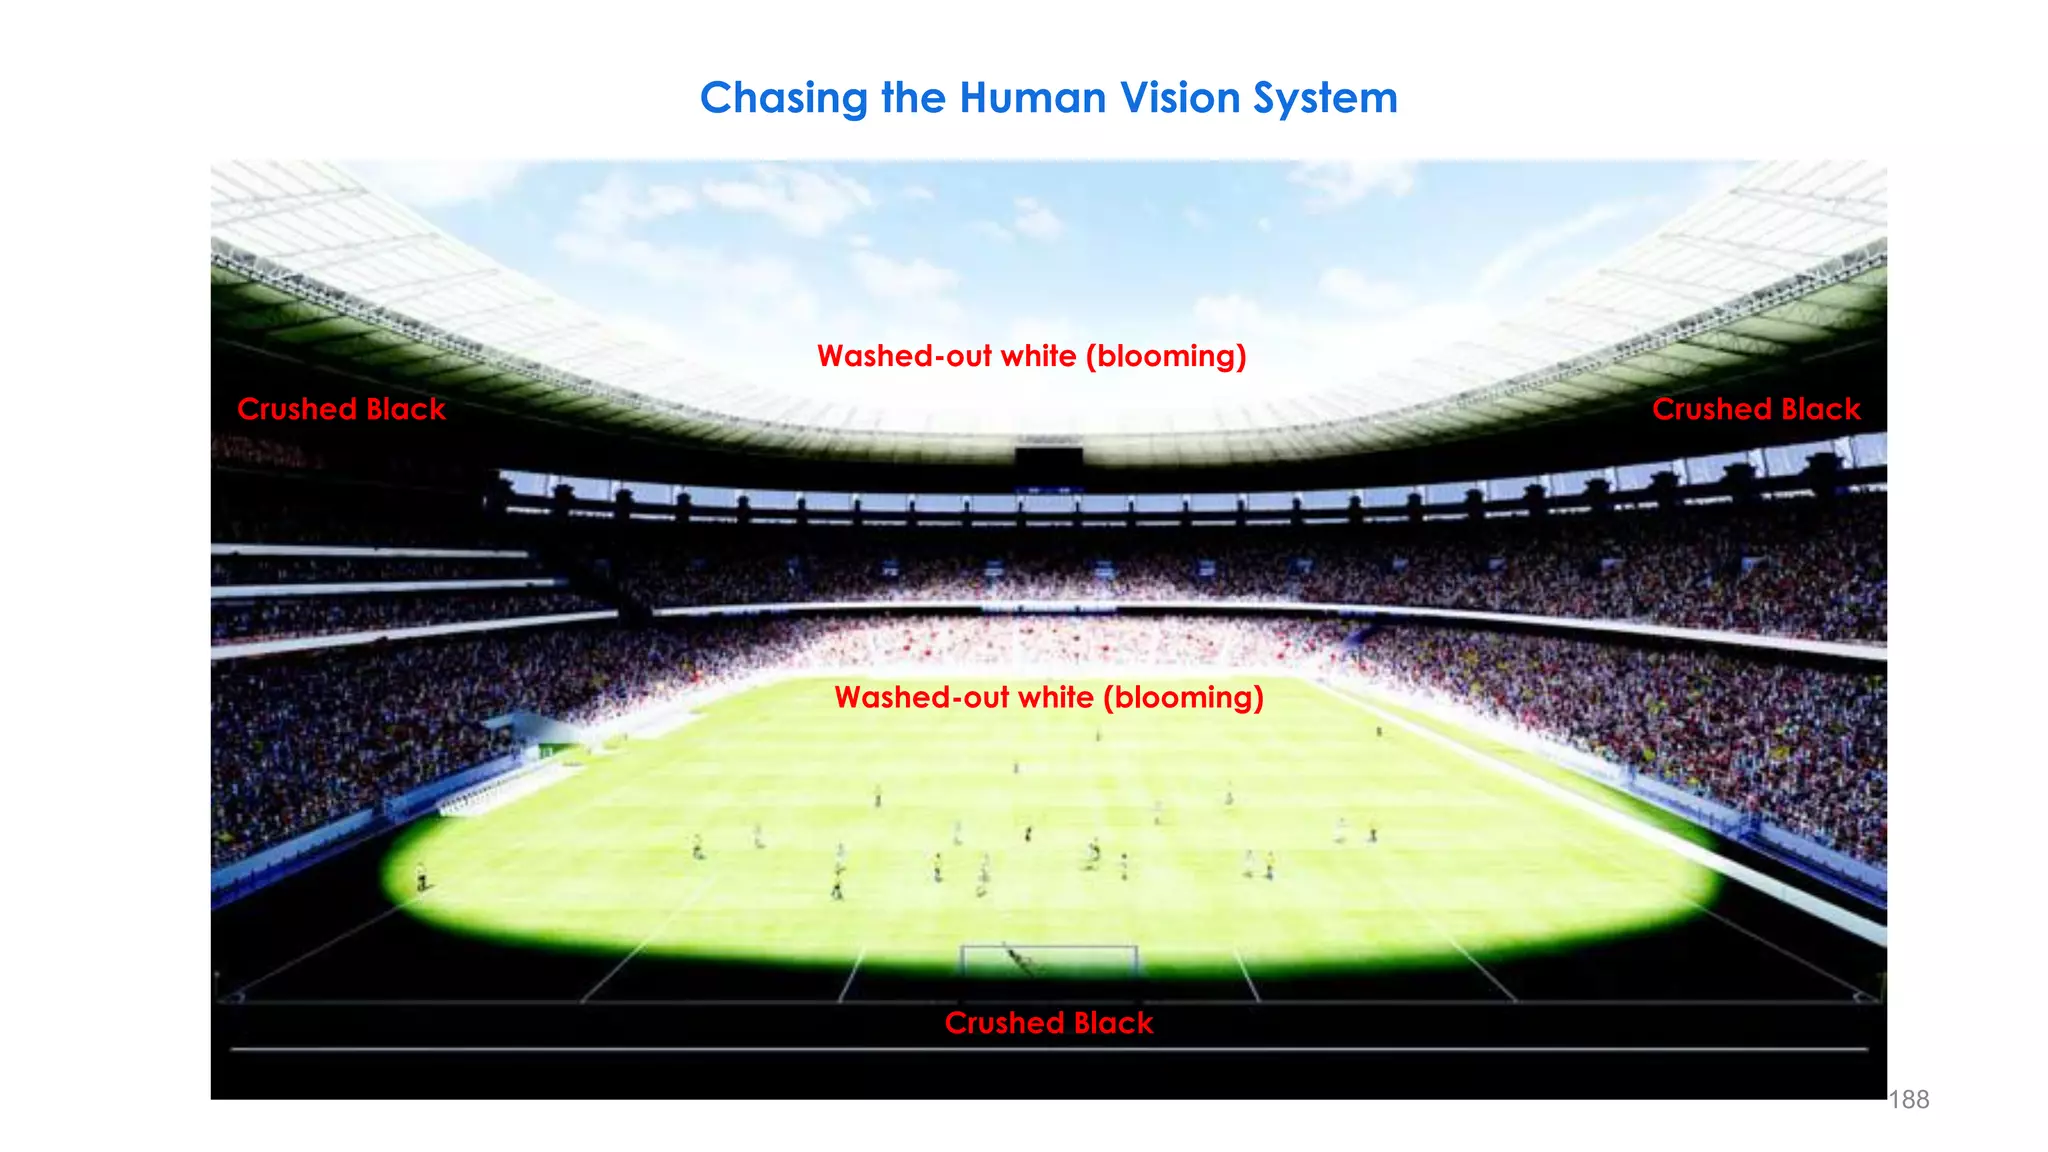
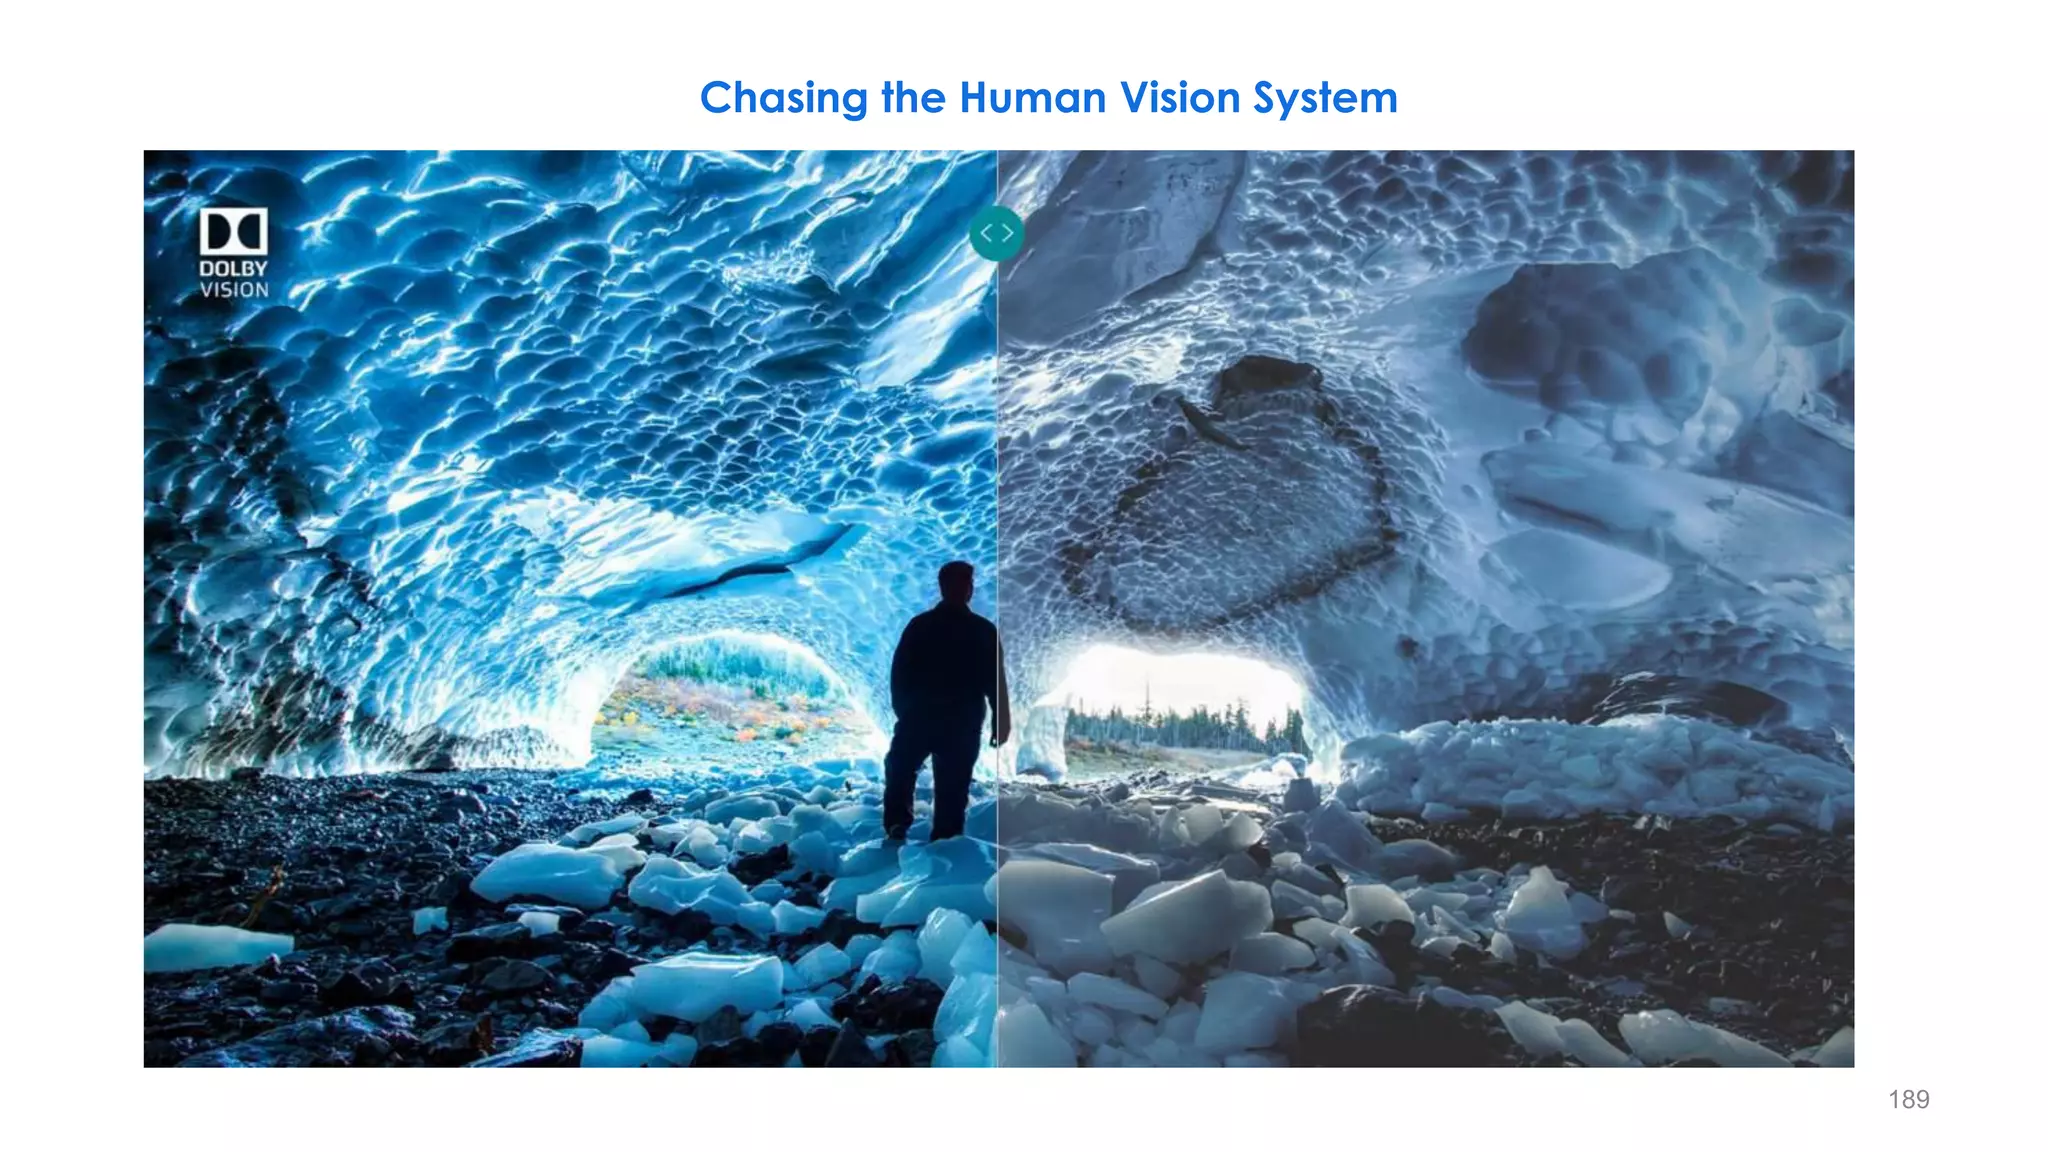
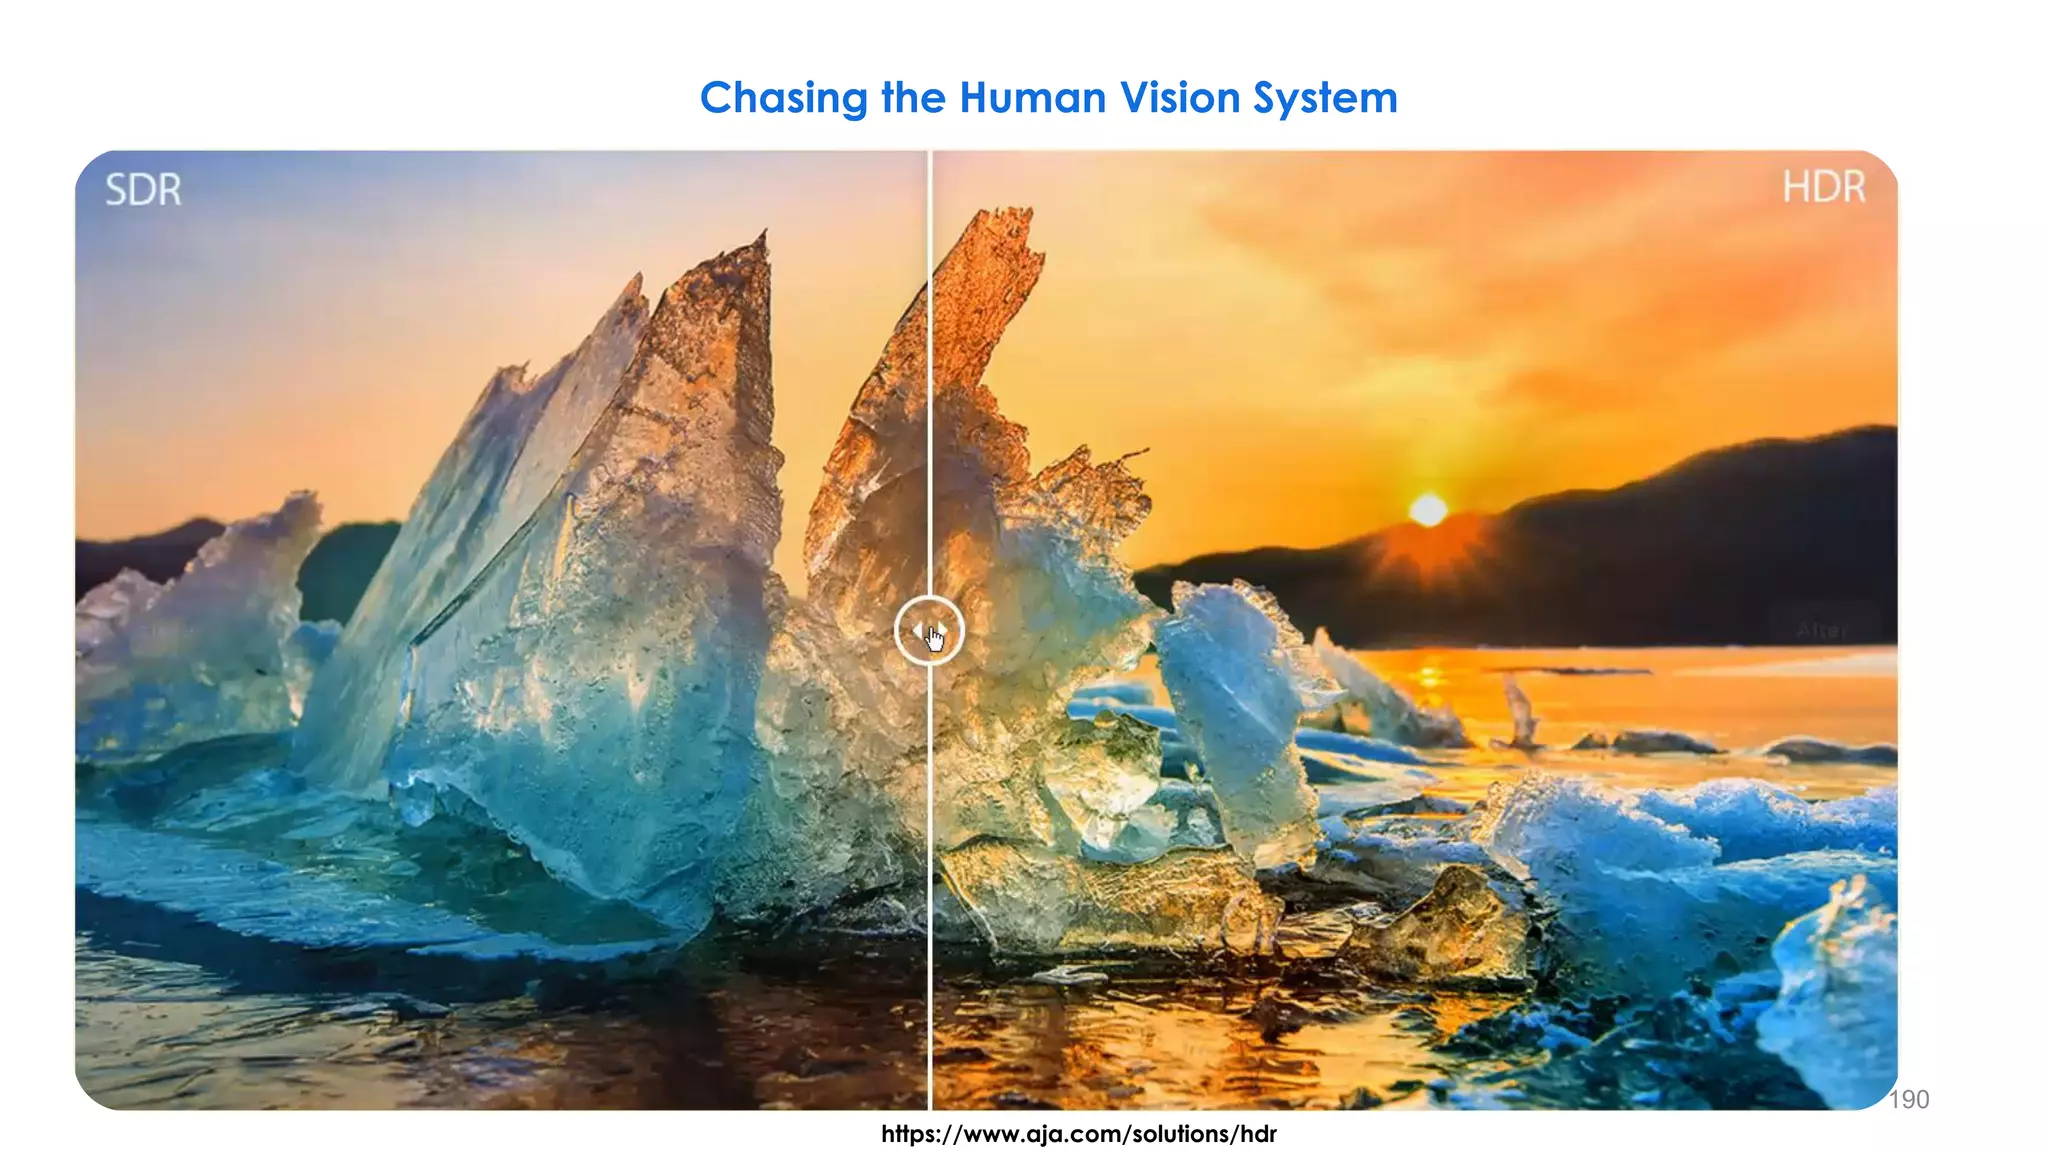
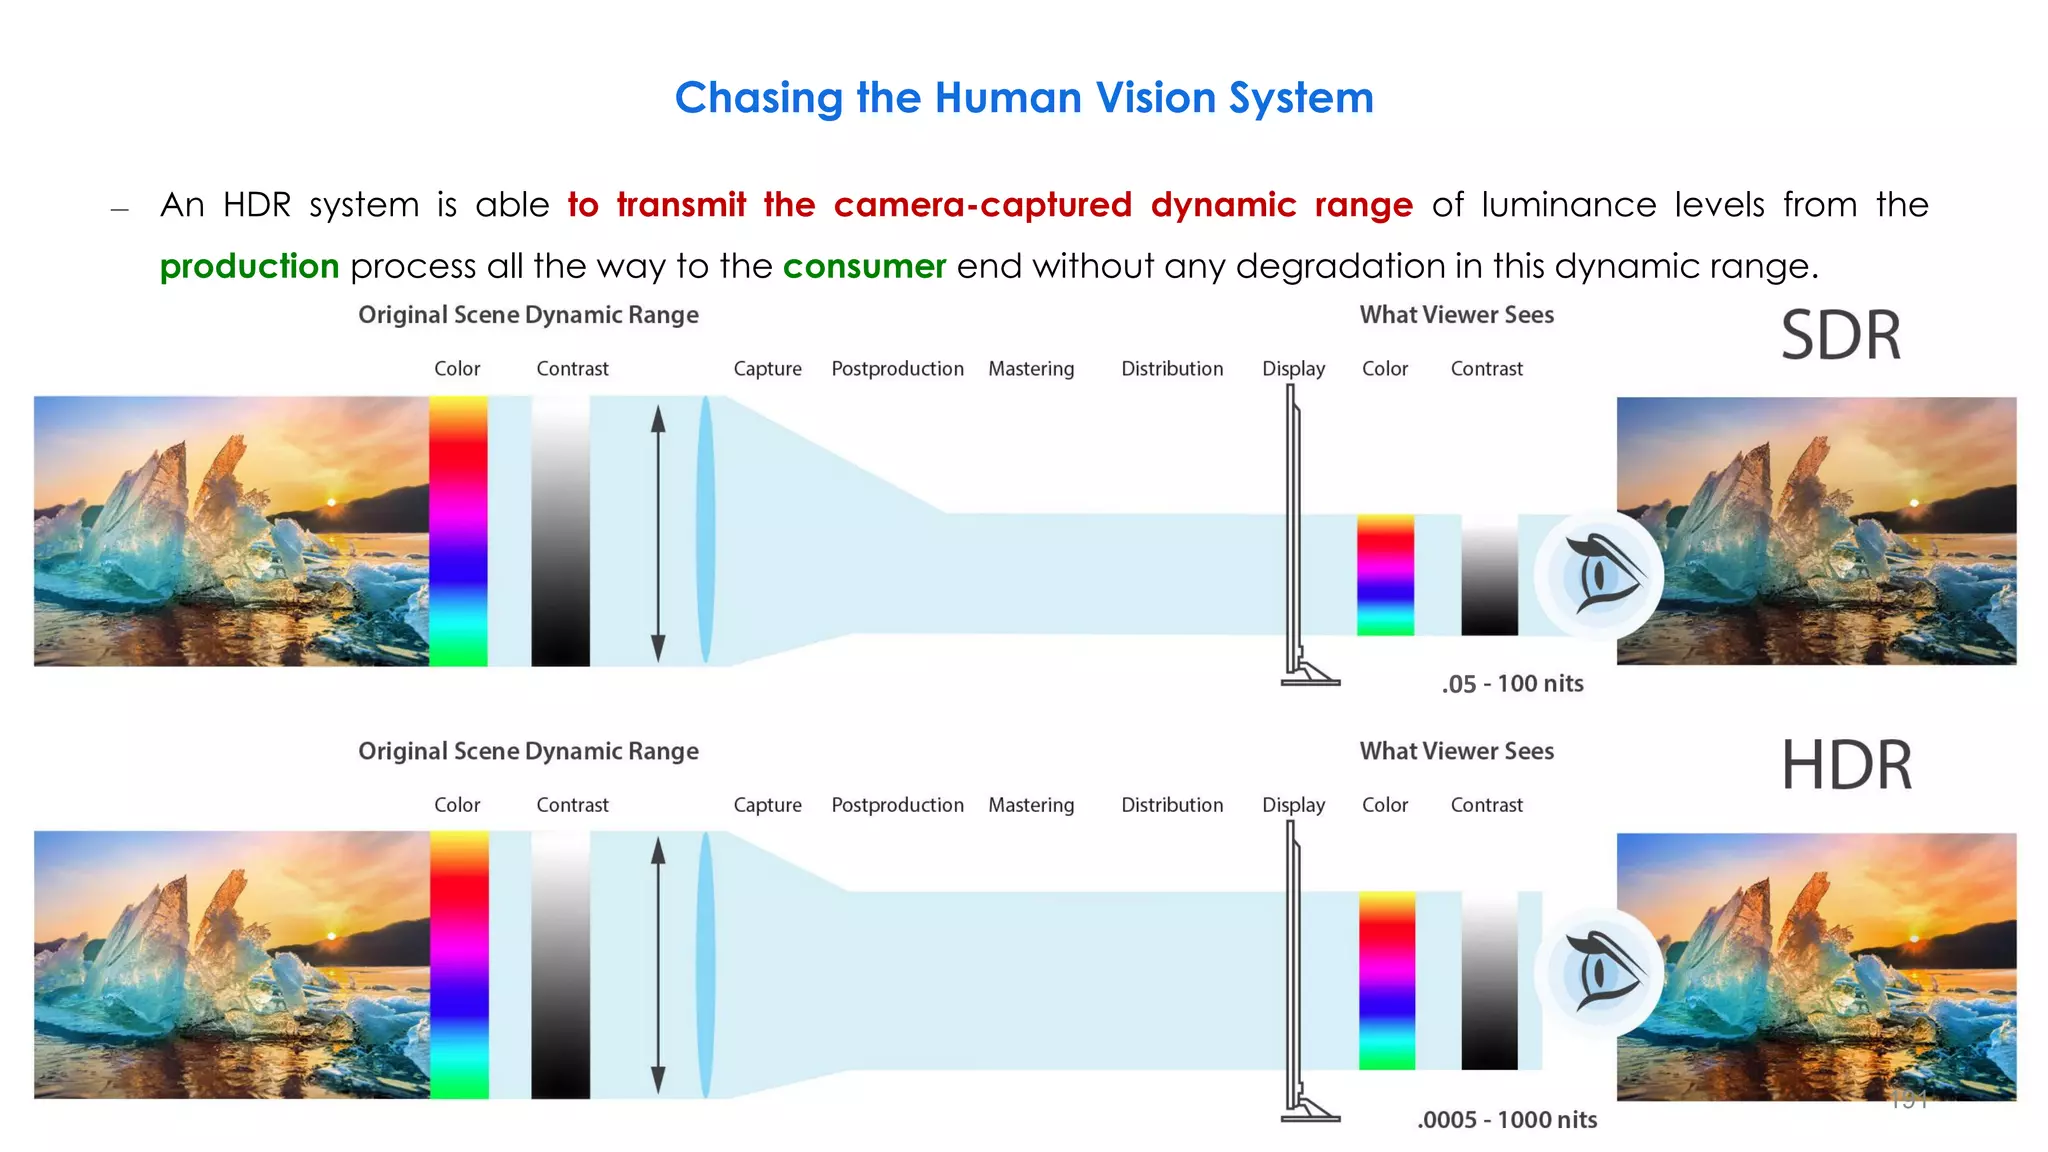
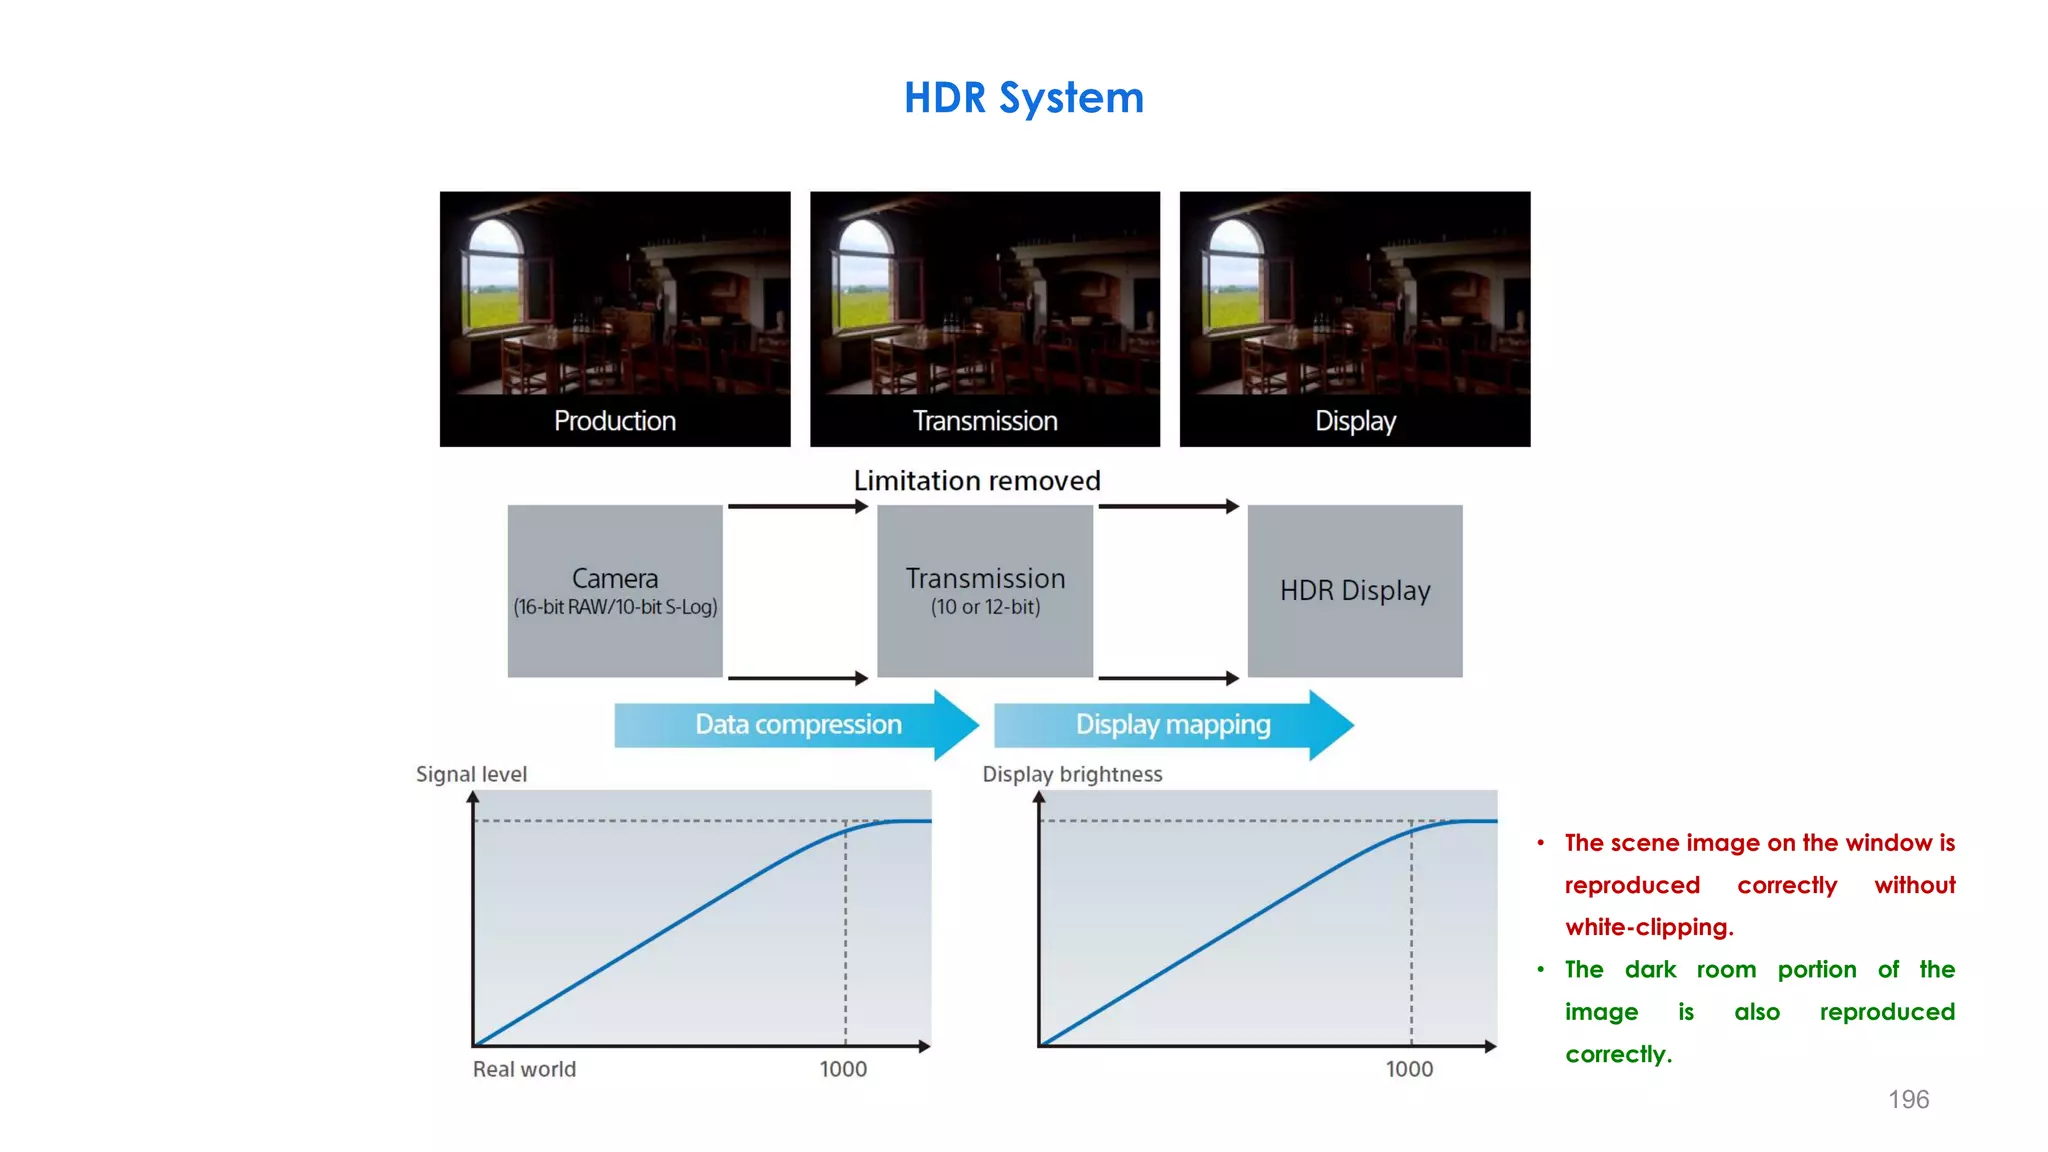
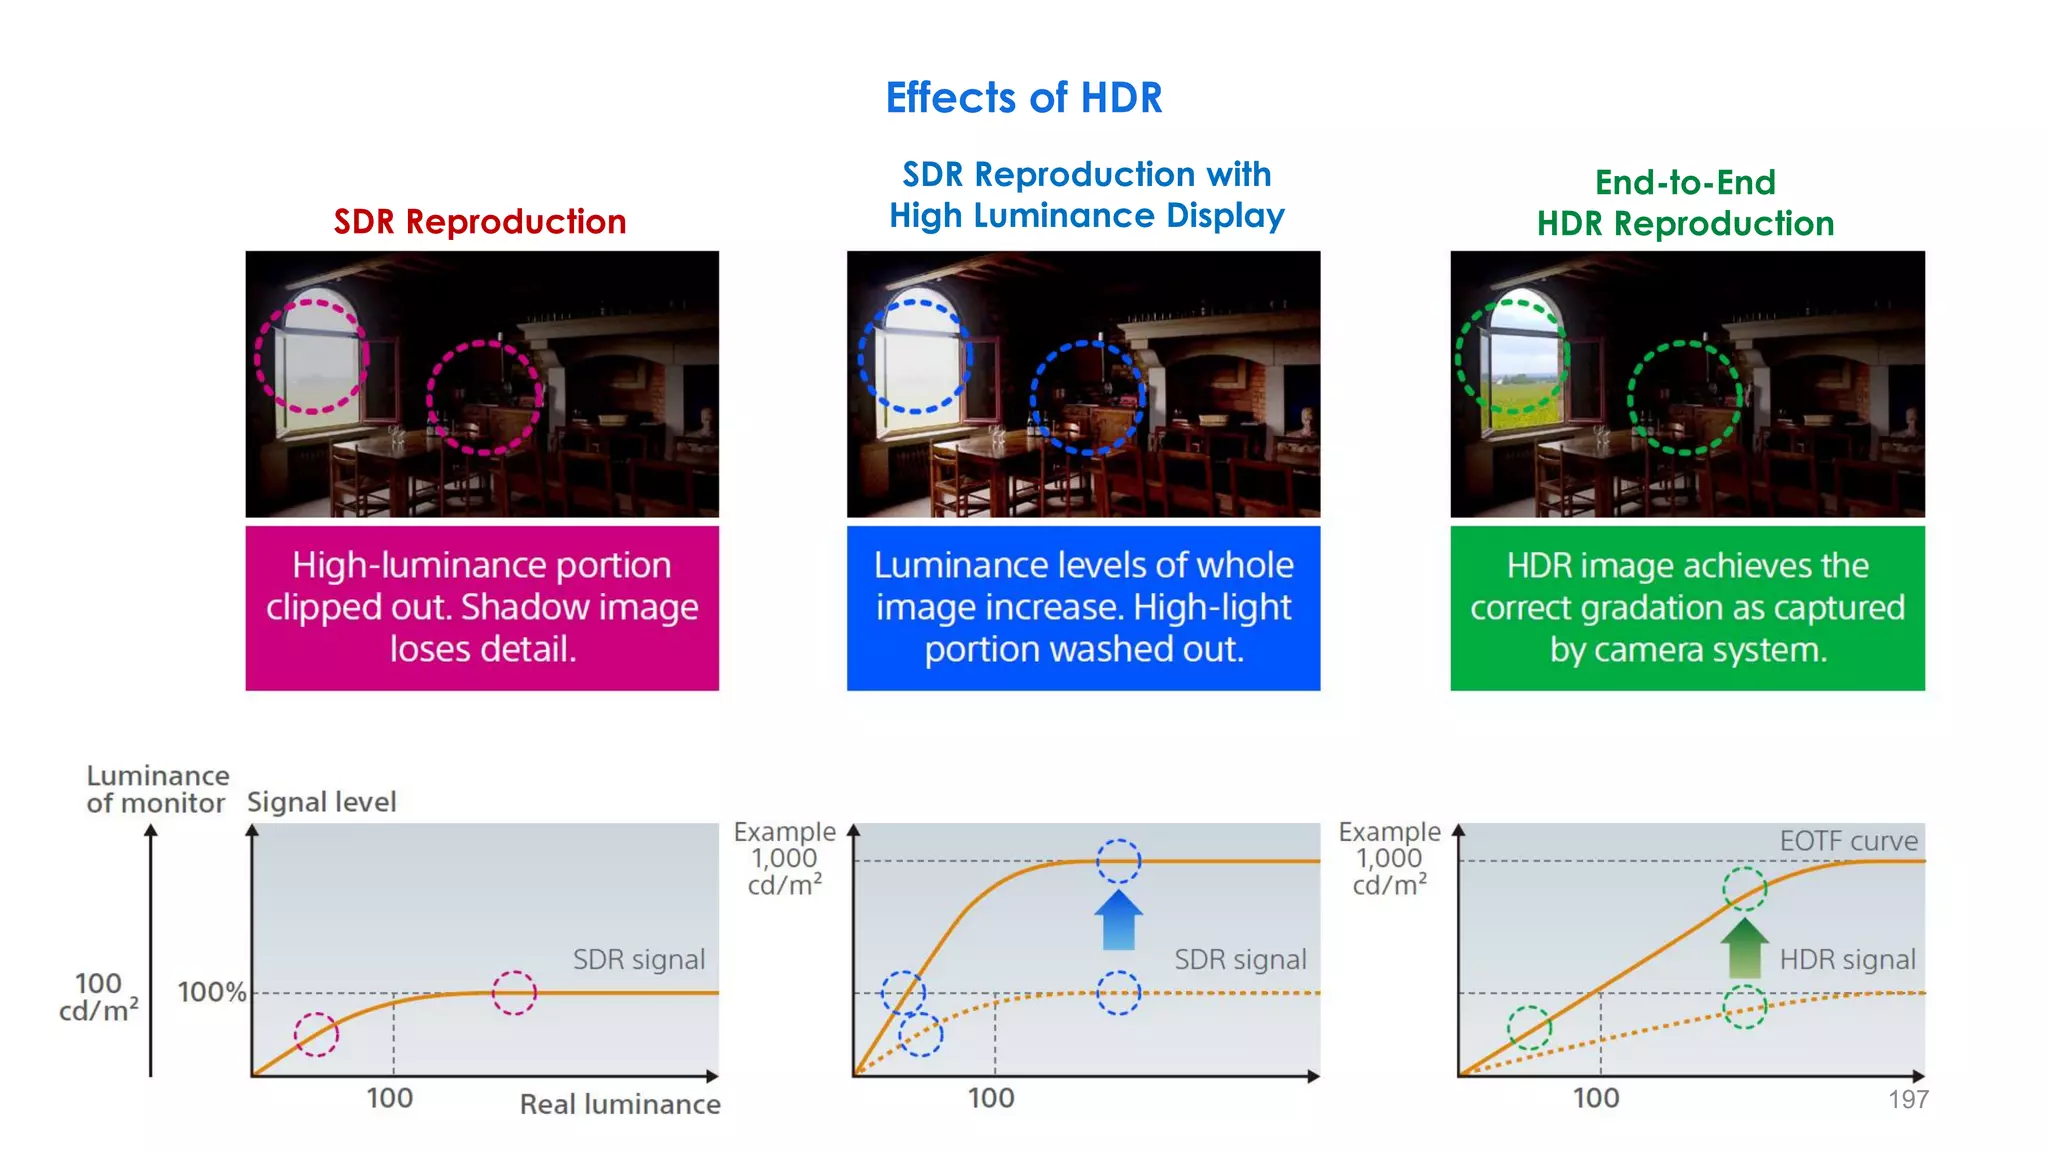
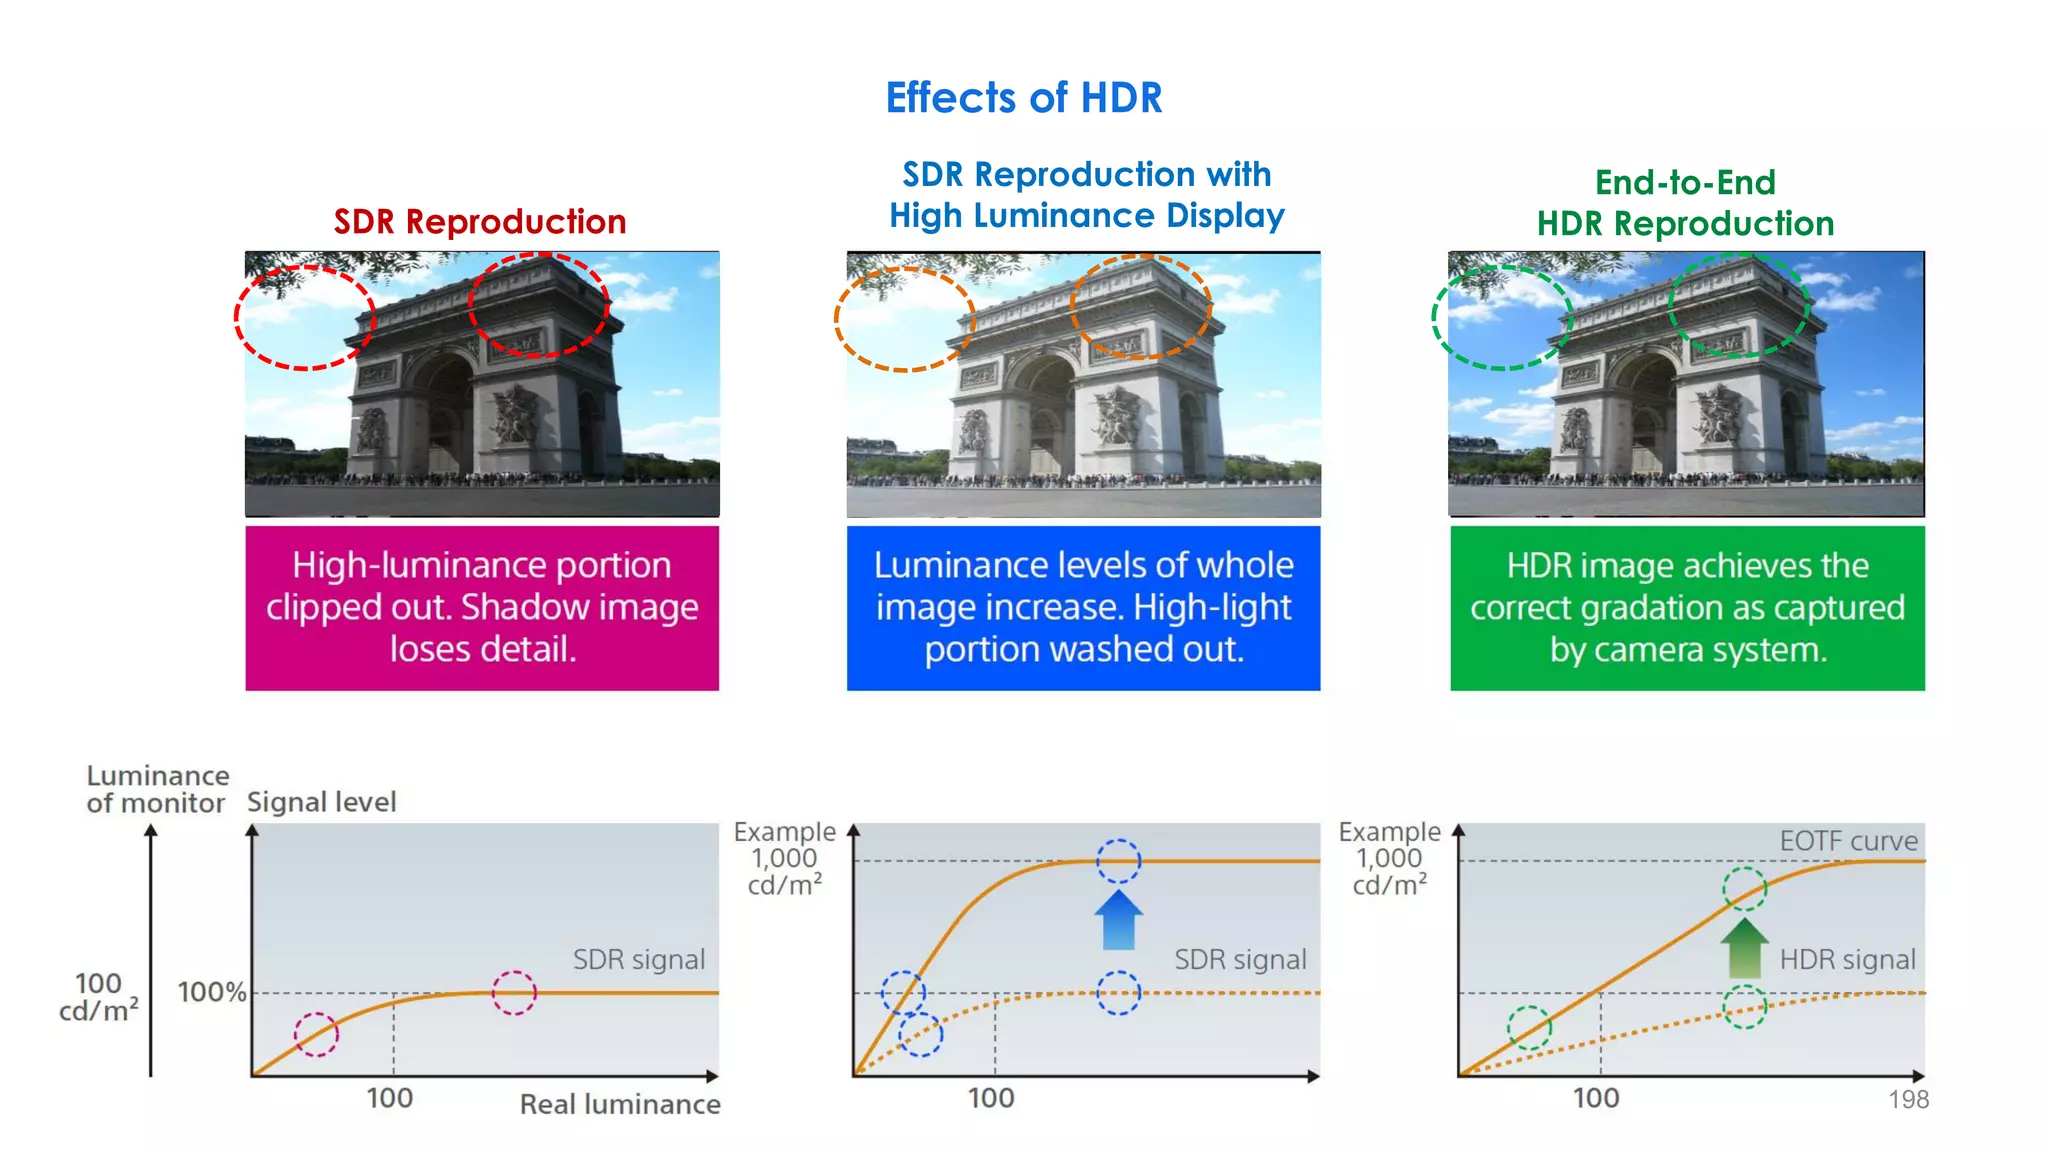
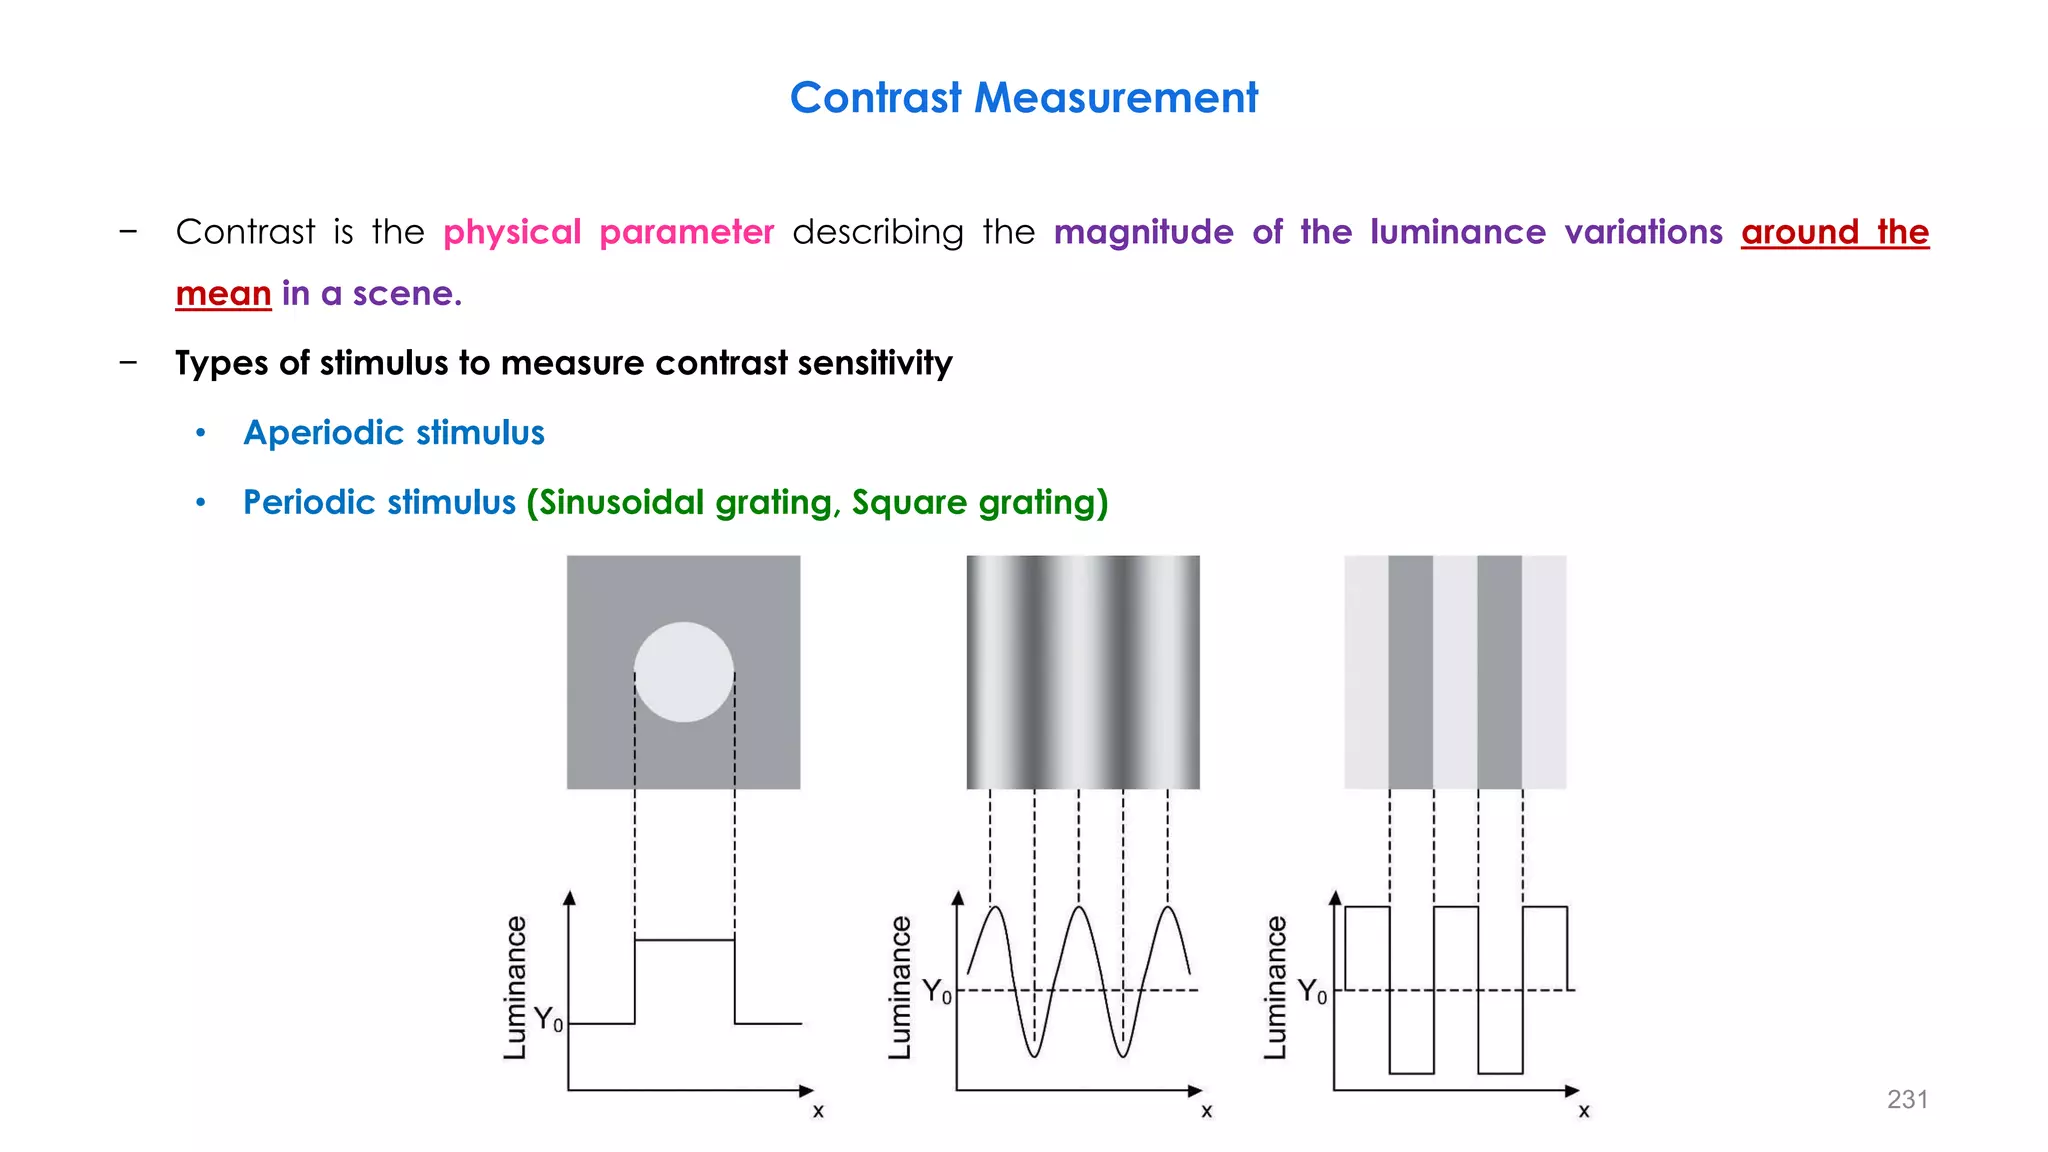
HDR, wide color gamut, and higher frame rates are new technologies that can improve image quality for ultra high definition televisions. They provide benefits like more vivid colors, deeper blacks, better shadow detail, and a more immersive viewing experience. However, supporting these new features requires significantly more data bandwidth compared to legacy standards. Future video standards will need to efficiently support higher resolutions, wider color, high dynamic range, and high frame rates to deliver next-generation picture quality while still allowing content to be economically distributed.


