Download as PDF, PPTX


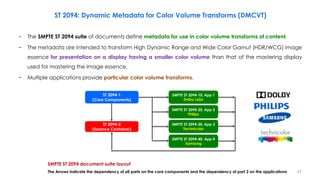
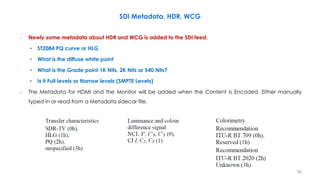
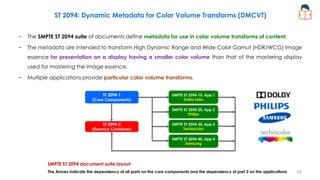
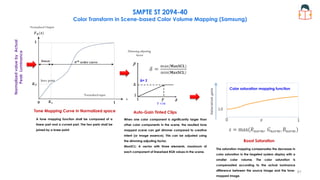
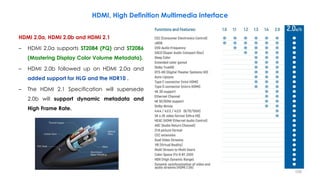
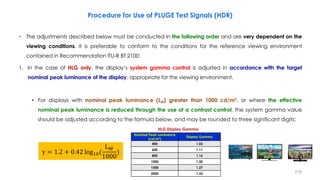
![Video Levels
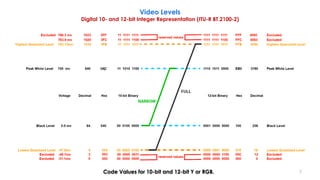
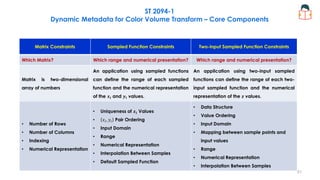
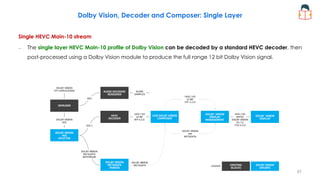
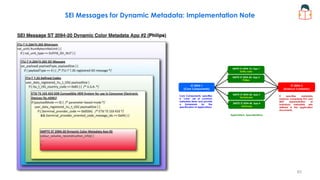
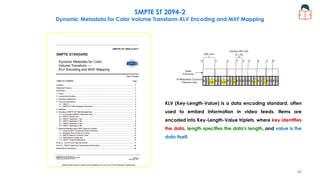
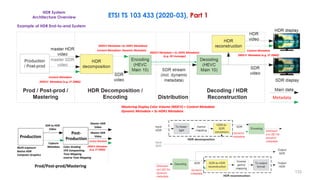
Digital 10- and 12-bit Integer Representation (ITU-R BT.2100-2)
Round( x ) = Sign( x ) * Floor( | x | + 0.5 )
Floor( x ) the largest integer less than or equal to x
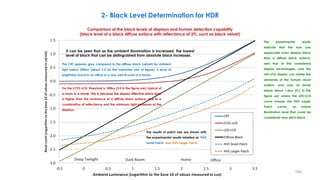
Resulting values that exceed the
video data range should be
clipped to the video data range
Narrow Range
𝑫 = 𝑹𝒐𝒖𝒏𝒅 [(𝟐𝟏𝟗𝑬′
+ 𝟏𝟔) × 𝟐𝒏−𝟖
)]
𝑫 = 𝑹𝒐𝒖𝒏𝒅 [(𝟐𝟐𝟒𝑬′
+ 𝟏𝟐𝟖) × 𝟐𝒏−𝟖
)]
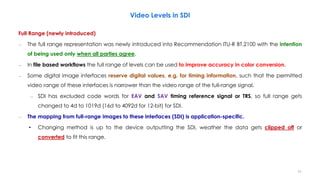
Full Range
𝑫 = 𝑹𝒐𝒖𝒏𝒅 [(𝟐𝒏
− 𝟏)𝑬′
]
𝑫 = 𝑹𝒐𝒖𝒏𝒅 [ 𝟐𝒏
− 𝟏 𝑬′
+ 𝟐𝒏−𝟏
)]
Coding 10-bit 12-bit 10-bit 12-bit
Black
(R' = G' = B' = Y' = I = 0)
DR', DG', DB', DY', DI
64 256 0 0
Nominal Peak
(R' = G' = B' = Y' = I = 1)
DR', DG', DB', DY', DI
940 3760 1023 4095
Nominal Peak
(C'B = C'R = -0.5)
DC'B, DC'R, DCT, DCP
64 256 0 0
Achromatic
(C'B = C'R = 0)
DC'B, DC'R, DCT, DCP
512 2048 512 2048
Nominal Peak
(C'B = C'R = +0.5)
DC'B, DC'R, DCT, DCP
960 3840 1023 4095
Video Data Range 4~1019 16~4079 0~1023 0~4095
6](https://image.slidesharecdn.com/hdrandwcgprinciplespart3-210615182358/85/HDR-and-WCG-Principles-Part-3-6-320.jpg)
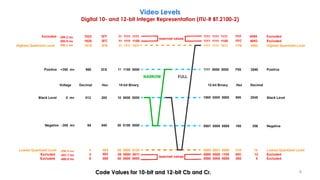
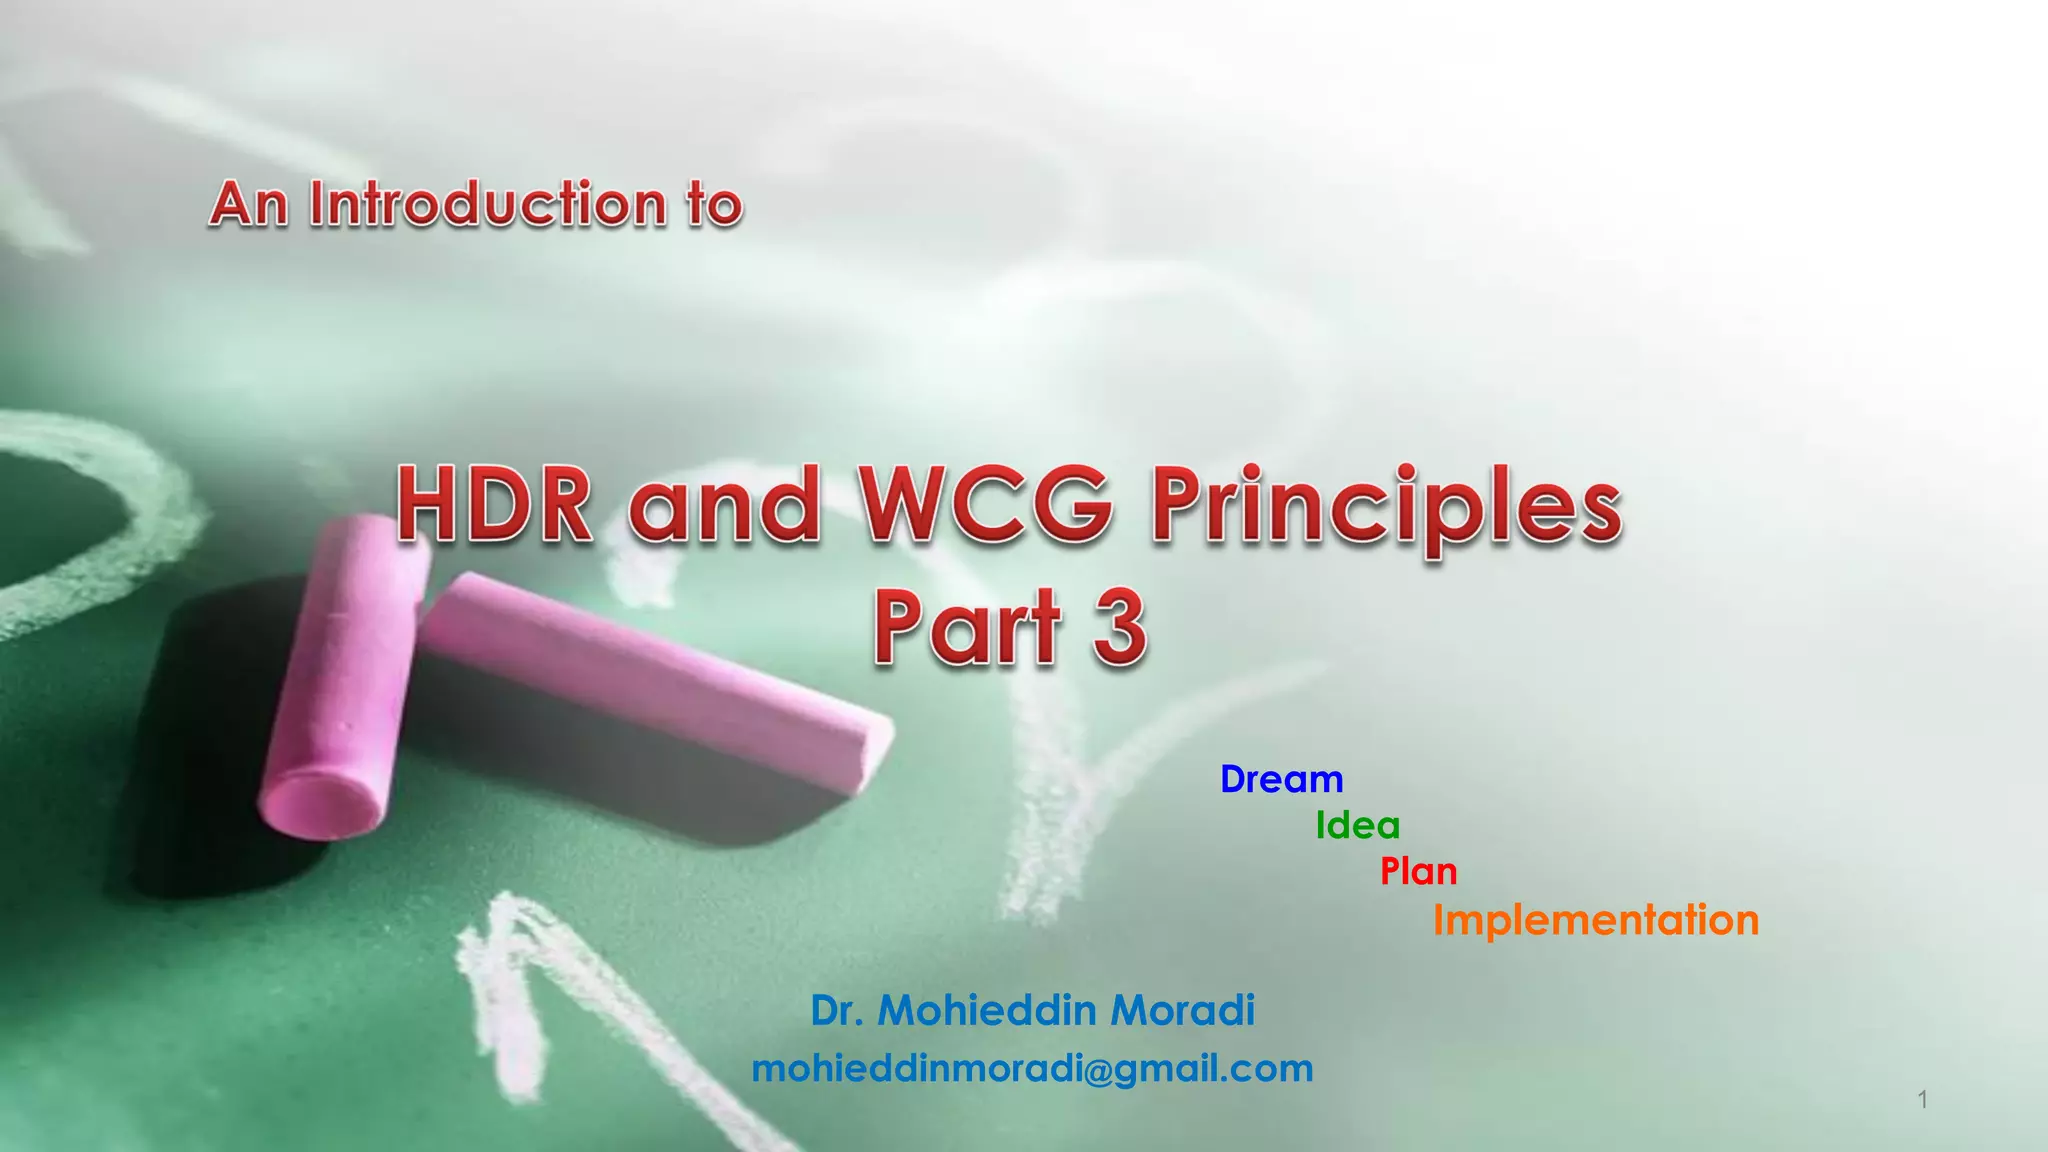
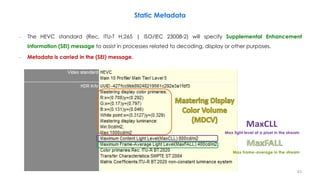
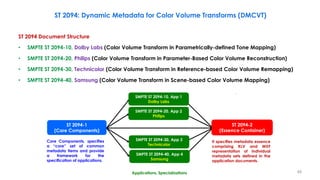
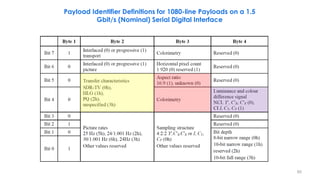
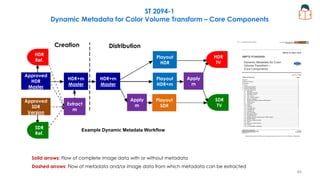
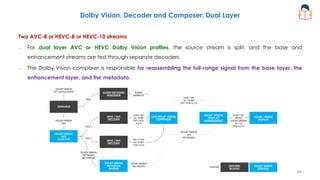
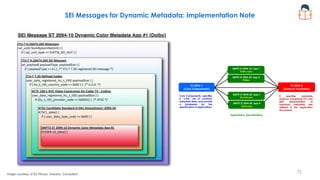
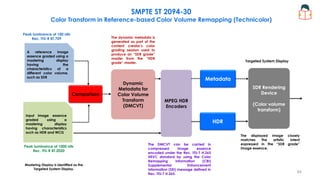
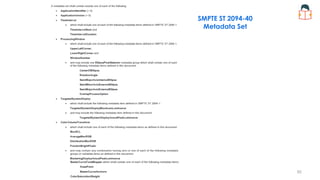
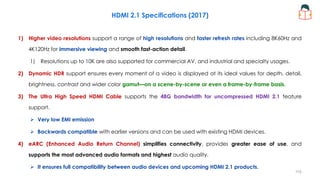
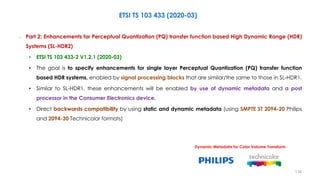
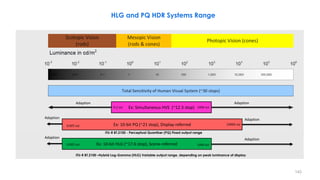
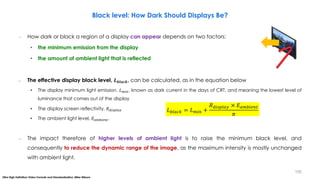
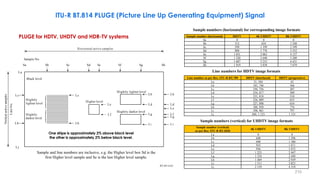
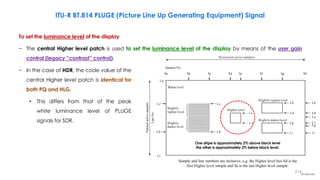
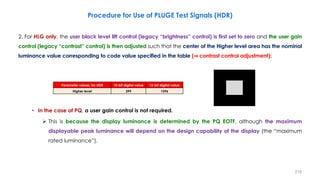
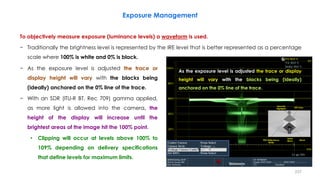
![Signal Range Selection for HLG and PQ
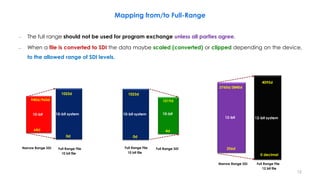
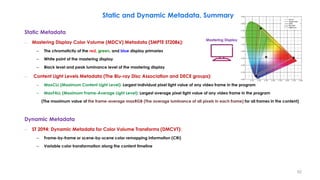
• Overshoots that extend above the nominal
peak luminance into the “super-white” region
(where the signal E′ > 1)
• Under-shoots that extend below black into
the “sub-black” region
(where the signal E′ < 0)
Common video
processing techniques
(image re-sizing, filtering,
compression
(quantization),…)
Input Video
E′: Non linear color value, encoded in HLG or PQ
space in the range [0,1].
Preferred Min.
Preferred Max.
(Narrow Range)
(White)
(Black)
(super-whites)
(sub-blacks)
In order to maintain image fidelity, it
is important that the over-shoots and
under-shoots are not clipped.
E′
E′
Output Video
13](https://image.slidesharecdn.com/hdrandwcgprinciplespart3-210615182358/85/HDR-and-WCG-Principles-Part-3-13-320.jpg)
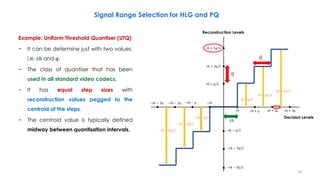
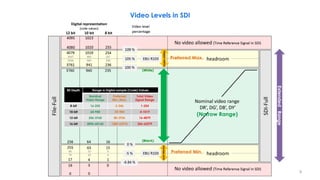
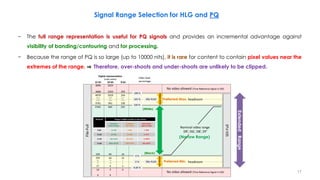
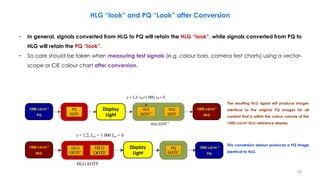
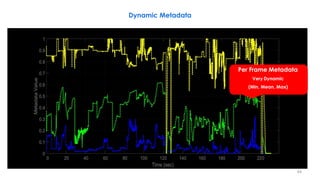
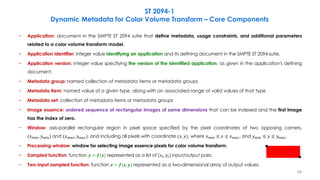
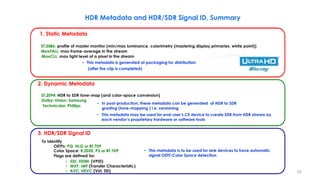
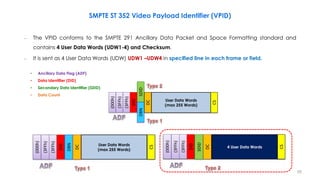
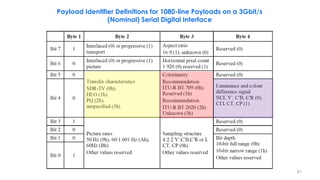
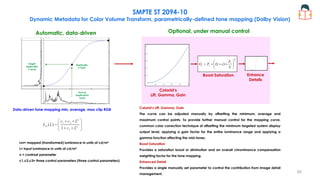
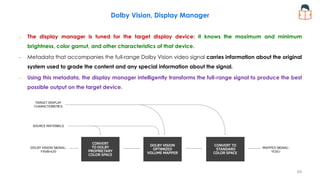
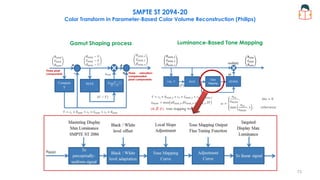
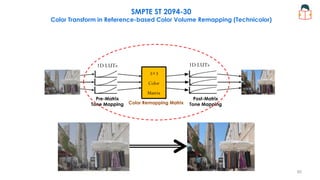
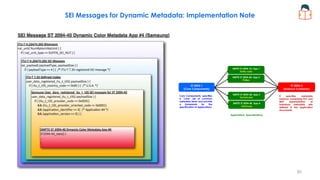
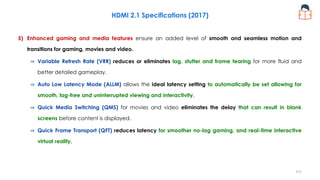
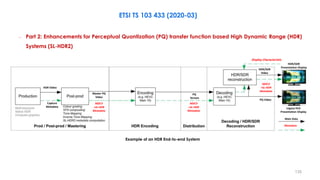
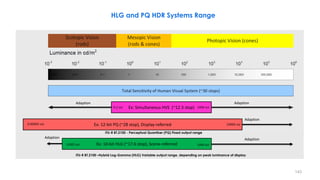
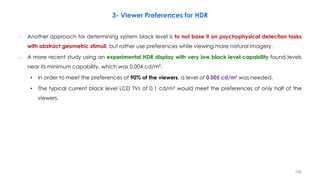
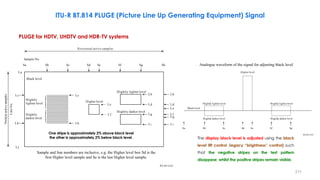
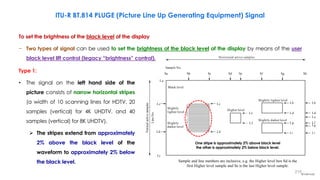
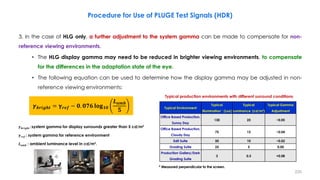
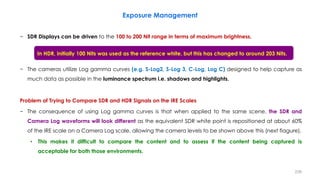
![− The use of narrow range signals is
strongly preferred for HLG:
• to preserve the signal fidelity
• to reduce the risk of mistaking full
range for narrow range signals (and
vice versa) in production
− Because the range of HLG is limited to
1000 nits, it is regular for content to
contain pixel values near the extremes of
the range.
Signal Range Selection for HLG and PQ
Therefore, over-shoots and under-shoots
are likely to be clipped if full-range
signals were used for HLG Signal.
Common video processing
techniques
(image re-sizing, filtering,
compression (quantization),…)
Input Video
E′
E′
Output Video
E′
E′: Non linear color value, encoded in HLG or PQ space in the range [0,1].
15](https://image.slidesharecdn.com/hdrandwcgprinciplespart3-210615182358/85/HDR-and-WCG-Principles-Part-3-15-320.jpg)
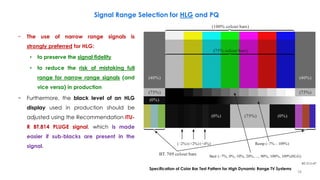

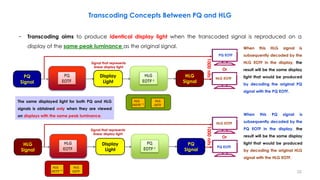
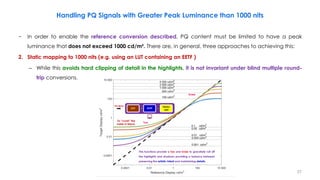
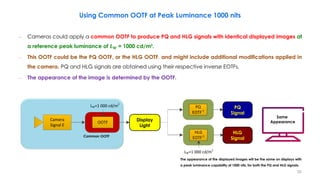
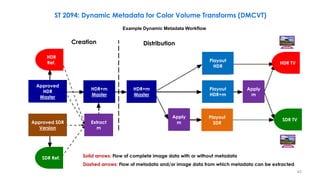
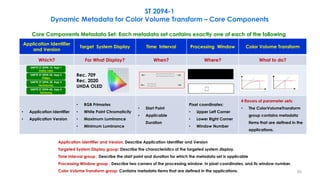
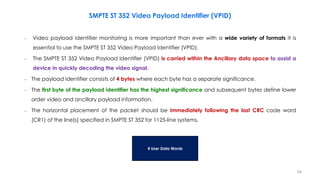
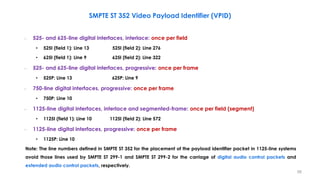
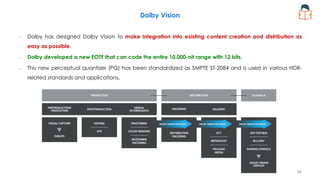
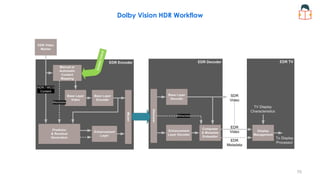
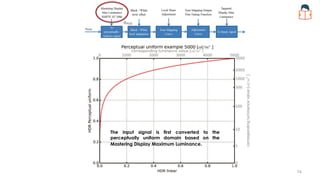
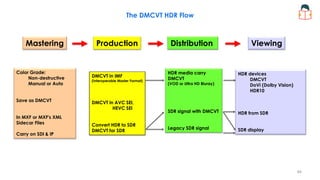
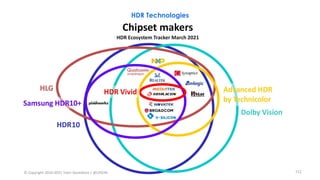
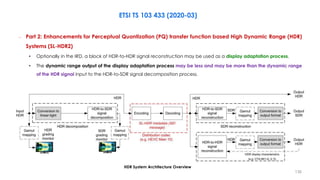
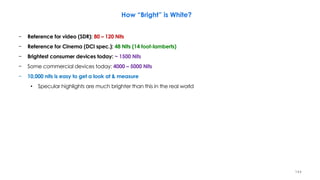
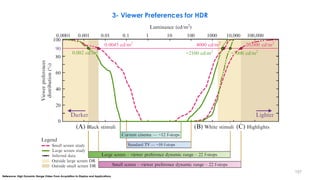
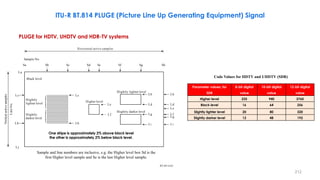
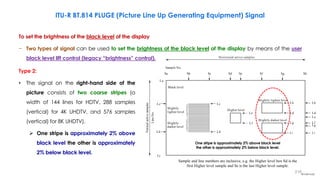
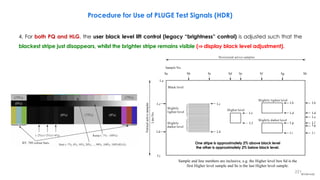
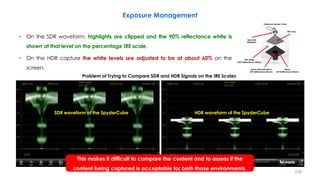
![– However, the difference in the way that PQ and HLG signals are rendered on displays of different peak
luminance complicates the conversion between PQ and HLG signals.
For example if PQ signals, representing different peak luminances, are simply transcoded to HLG
⇒ The signal level for diffuse white will vary (it is not 75% resultant HLG signal).
For example if HLG content is simply transcoded to PQ signal
⇒ The brightness of diffuse white will vary depending on the assumed peak luminance of the HLG
display.
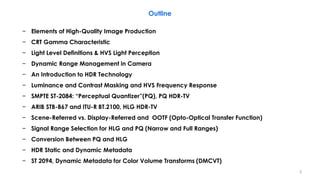
Transcoding Concepts Between PQ and HLG
To avoid such brightness
changes, it is needed to
convert, rather than simply
transcode, the signals.
Reflectance Object or Reference
(Luminance Factor, %)
Nominal Luminance Value
(PQ & HLG)
[Display Peak Luminance, 1000 nit]
Nominal
Signal Level
(%) PQ
Nominal
Signal Level
(%) HLG
Grey Card (18% Reflectance) 26 nit 38 38
Greyscale Chart Max (83% Reflectance) 162 nit 56 71
Greyscale Chart Max (90% Reflectance) 179 nit 57 73
Reference Level:
HDR Reference White (100% Reflectance)
also Diffuse White and Graphics White
203 nit 58 75
23](https://image.slidesharecdn.com/hdrandwcgprinciplespart3-210615182358/85/HDR-and-WCG-Principles-Part-3-23-320.jpg)
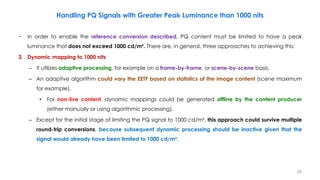

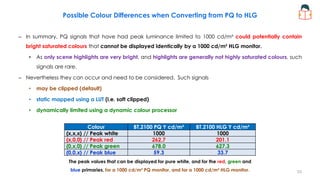
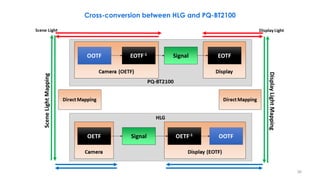
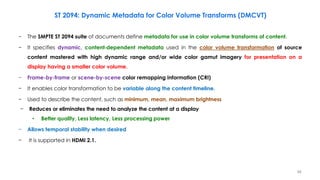
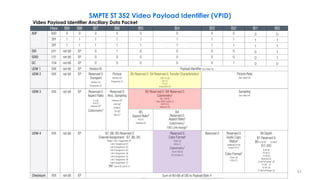
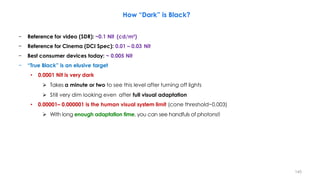
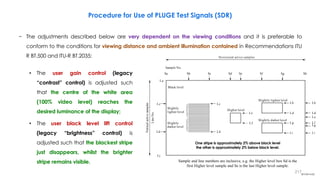
![Possible Colour Differences when Converting from PQ to HLG
– In principle, the conversion of PQ images to HLG could give rise to hue shifts or desaturation on bright
highly saturated areas of the picture, although such effects are believed to be rare in practice.
– Mathematically, this arises because the OOTF applied in the display for HLG is a function of overall
luminance rather than identical functions of R, G, and B.
– Consider the equations for luminance in both the display and scene domains along with the EOTF for HLG:
𝒀𝑫 = 𝟎. 𝟐𝟔𝟐𝟕𝑹𝑫 + 𝟎. 𝟔𝟕𝟖𝟎𝑮𝑫 + 𝟎. 𝟎𝟓𝟗𝟑𝑩𝑫
𝒀𝒔 = 𝟎. 𝟐𝟔𝟐𝟕𝑹𝒔 + 𝟎. 𝟔𝟕𝟖𝟎𝑮𝒔 + 𝟎. 𝟎𝟓𝟗𝟑𝑩𝒔
𝑹𝑫 = 𝛂𝒀𝑺
𝜸−𝟏
𝑹𝑺
𝑮𝑫 = 𝛂𝒀𝑺
𝜸−𝟏
𝑮𝑺
𝑩𝑫 = 𝛂𝒀𝑺
𝜸−𝟏
𝑩𝑺
𝑭𝑫: luminance of a displayed linear component {𝑅𝐷, 𝐺𝐷, or 𝐵𝐷}, in cd/m²
𝑬: signal for each colour component {𝑅𝑆, 𝐺𝑆, 𝐵𝑆} proportional to scene linear light and scaled by camera exposure, normalized to the range [0:1].
𝜶 : user adjustment for the luminance of the display, commonly known in the past as a “contrast control”.
• It represents 𝑳𝑾, the nominal peak luminance of a display for achromatic pixels in cd/m².
𝜸 : is an exponent, which varies depending on 𝐿𝑊, and which is equal to 1.2 at the nominal display peak luminance of 1000 cd/m²
𝑭𝑫 = 𝑶𝑶𝑻𝑭 𝑬 = 𝛂𝒀𝑺
𝜸−𝟏
𝑬
PQ
Signal
HLG
Signal
Converter
Hue shifts or desaturation on bright highly
saturated areas of the picture
31](https://image.slidesharecdn.com/hdrandwcgprinciplespart3-210615182358/85/HDR-and-WCG-Principles-Part-3-31-320.jpg)
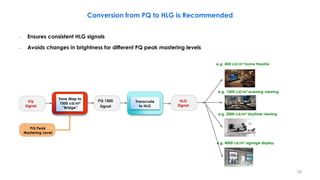
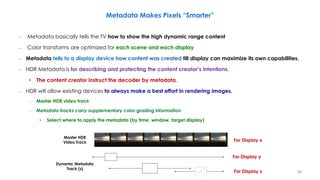
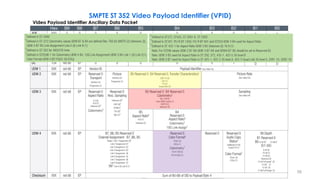
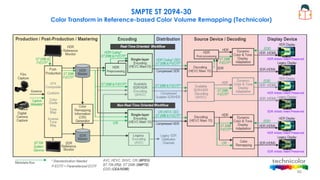
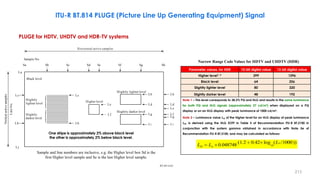
![Possible Colour Differences when Converting from PQ to HLG
– The value ‘𝑥’ is the signal value required such that when 𝑹 = 𝑮 = 𝑩 = 𝒙 the resulting white is 1000 cd/m².
• For a 1000 cd/m² PQ display, this occurs when 𝒙 ≈ 𝟎. 𝟕𝟔
• For a 1000 cd/m² HLG display, this occurs when 𝒙 = 𝟏
– For a 1000 cd/m² PQ display, the maximum luminance of each of these colours is calculated using 𝒀𝑫.
– For a 1000 cd/m² HLG display, the EOTF can be simplified by normalizing scene colours within [0,1]. Thus:
– This determines 𝑹𝑫, 𝑮𝑫, and 𝑩𝑫, and the resulting luminance is calculated using 𝒀𝑫.
Colour BT.2100 PQ Y cd/m² BT.2100 HLG Y cd/m²
{x,x,x} // Peak white 1000 1000
{x,0,0} // Peak red 262.7 201.1
{0,x,0} // Peak green 678.0 627.3
{0,0,x} // Peak blue 59.3 33.7
𝑹𝑫 = 𝟏𝟎𝟎𝟎𝒀𝑺
𝜸−𝟏
𝑹𝒔
𝑮𝑫 = 𝟏𝟎𝟎𝟎𝒀𝑺
𝜸−𝟏
𝑮𝒔 𝑩𝑫 = 𝟏𝟎𝟎𝟎𝒀𝑺
𝜸−𝟏
𝑩𝒔
The peak values that can be displayed for pure white, and for the red, green and
blue primaries, for a 1000 cd/m² PQ monitor, and for a 1000 cd/m² HLG monitor. 32](https://image.slidesharecdn.com/hdrandwcgprinciplespart3-210615182358/85/HDR-and-WCG-Principles-Part-3-32-320.jpg)


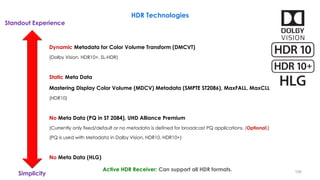
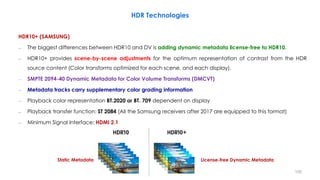
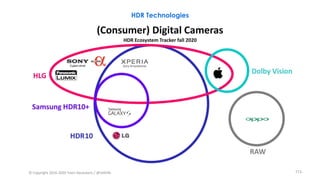
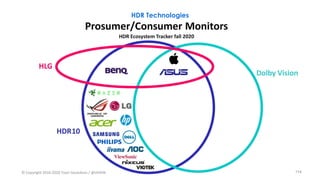
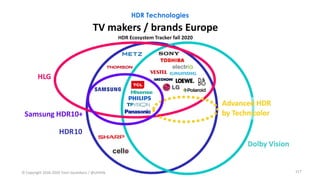
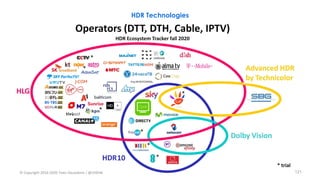
![HDR Technologies
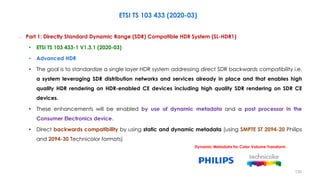
HDR10 (Announced by CTA: Consumer Technology Association)
– HDR10 is an open standard supported by a wide variety of companies which includes Ultra HD (UHD) TV
manufacturers such as LG, Samsung, Sharp, Sony, Vizio and UHD Alliance.
– Common in North of America (for VOD, Over the Top (OTT), Non Live Content))
– Based on ST 2084 (PQ), Bit depth: 10-bits, Mastered over a range of 0.05 – 1000 nits (20,000:1)
– HDR10 has static metadata [reference display ST 2086 metadata+ MaxFALL+ MaxCLL]
• In live program, because of non accessibility to MaxCLL & MaxFALL, they will set in default values.
• The TV gets one set of instructions at the beginning of the show or movie.
• If a movie, say, has a wide variety of scenes, this single piece of metadata might not allow for the best image.
– It is adopted by the Blu-ray Disc Association (BDA) for 4K Ultra HD.
– Wide Color Gamut (WCG) color space (ITU-R Rec. 2020 and 2100)
– HDR10 can not support Dolby Vision HDR video.
– Minimum Signal Interface: HDMI 2.0a
104](https://image.slidesharecdn.com/hdrandwcgprinciplespart3-210615182358/85/HDR-and-WCG-Principles-Part-3-104-320.jpg)
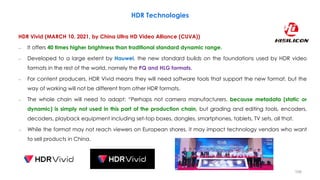
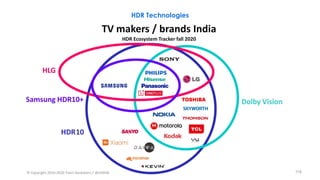
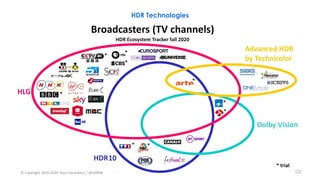
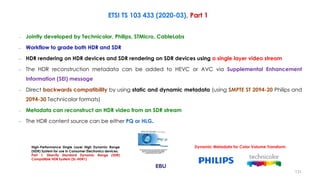

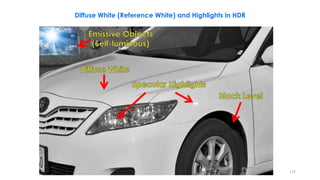
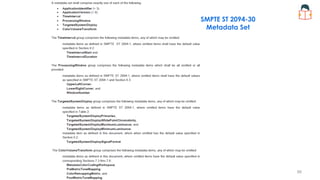
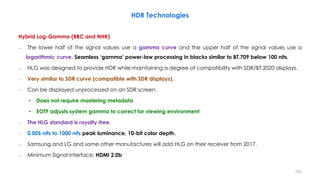
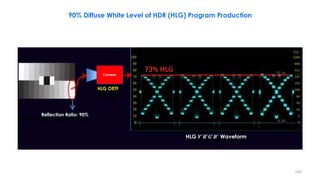
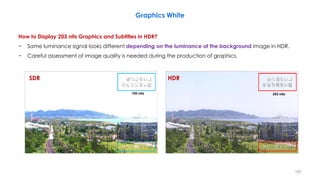
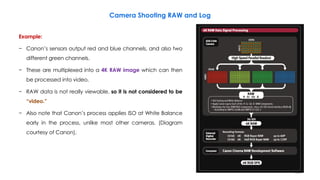
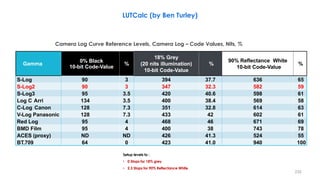
![90% Diffuse White Level of HDR (HLG) Program Production
HLG Input Normalized to the Range [0:1]
Video
Signal
in
the
Range
[0:1]
SDR Input [0:1]
73% HLG
100% SDR
0.73
0.239
0
0
0 1
0.2 0.4
0.2
1
0.8
0.6
0.4
1
0.8
0.6
Greyscale Chart Max (90% Reflectance)
182](https://image.slidesharecdn.com/hdrandwcgprinciplespart3-210615182358/85/HDR-and-WCG-Principles-Part-3-182-320.jpg)
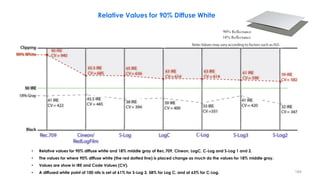
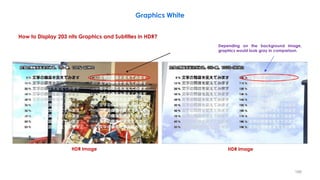
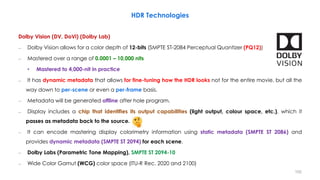
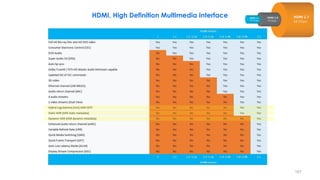
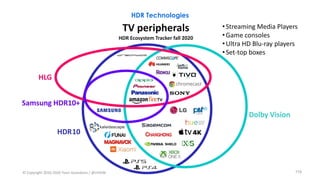
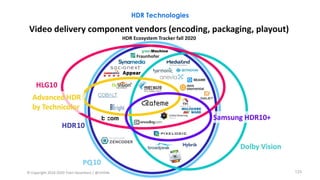
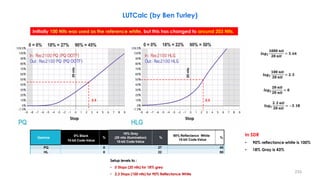
![Reflectance Object or Reference
(Luminance Factor, %)
Nominal Luminance Value
(PQ & HLG)
[Display Peak Luminance, 1000 nit]
Nominal Signal
Level (%)
PQ
Nominal Signal
Level (%)
HLG
Grey Card (18% Reflectance) 26 nit 38 38
Greyscale Chart Max (83% Reflectance) 162 nit 56 71
Greyscale Chart Max (90% Reflectance) 179 nit 57 73
Reference Level:
HDR Reference White (100% Reflectance) also Diffuse White
and Graphics White
203 nit 58 75
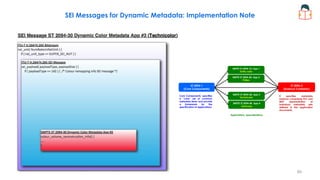
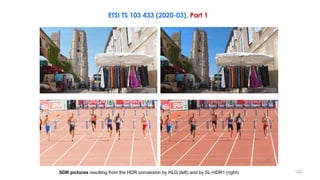
Nominal signal levels for shading [Display Peak Luminance, 1000 nit]
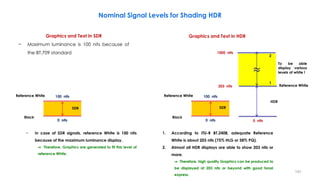
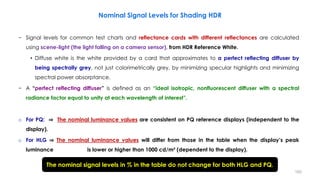
Nominal Signal Levels for Shading HDR
− The values are nominal recommendations for test charts and graphics for PQ and HLG production on a
1000 cd/m² (nominal peak luminance) display, under controlled studio lighting.
• The test chart should be illuminated by forward lights and the camera should shoot the chart from a
non-specular direction.
− Signal levels in these operational practices are specified in terms of %PQ and %HLG.
• These percentages represent signal values that lie between the minimum and maximum non-linear
values normalized to the range 0 to 1.
192](https://image.slidesharecdn.com/hdrandwcgprinciplespart3-210615182358/85/HDR-and-WCG-Principles-Part-3-192-320.jpg)
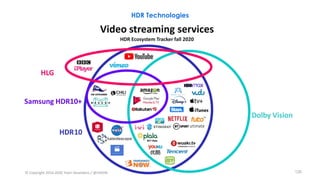
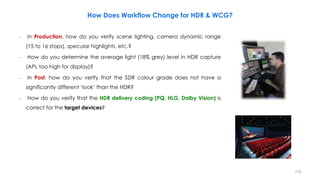
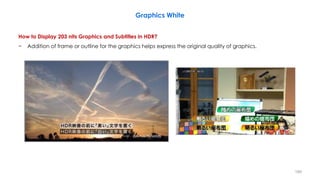
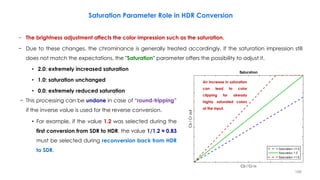
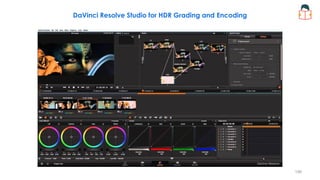
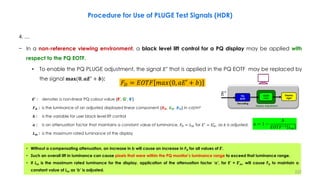
![− To adjust the luminance of the overall image. Basically, it changes the slope or lift of the luminance level.
− A value less than 0 dB reduces the brightness and a value greater than 0 dB increases the brightness.
• +12,00 dB: extremely increased brightness
• +0.00 dB: unchanged
• -12,00 dB: extremely decreased brightness
Gain [dB] Parameter Role in HDR Conversion
An increased gain can
lead to clipping of the
lights for high luminance
values at the input.
− If the image appears too dark, e.g. after an SDR-to-HDR up-
conversion, a luminance gain can be used to adjust the
image and achieve better matching to the luminance of
native HDR material.
− This processing can be undone in case of “round-tripping”
if the inverse value is used for the reverse conversion.
• For example, if the value +3.0 dB was selected during the first
conversion from SDR to HDR, the value -3.0 dB must be
selected during reconversion back from HDR to SDR.
195](https://image.slidesharecdn.com/hdrandwcgprinciplespart3-210615182358/85/HDR-and-WCG-Principles-Part-3-195-320.jpg)
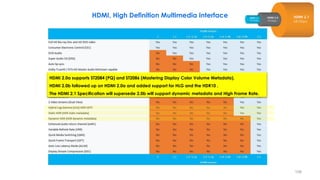
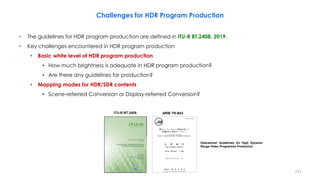
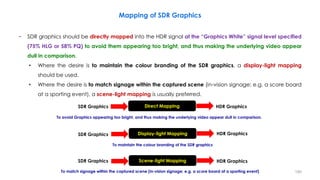
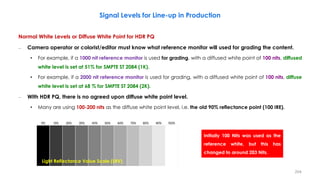
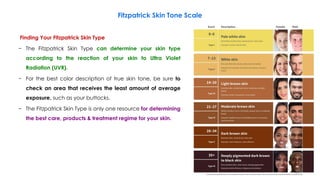
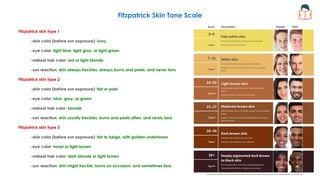
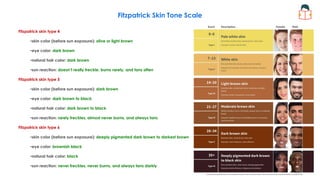
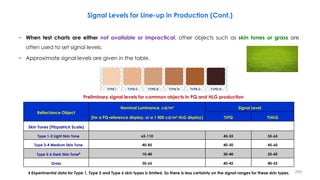
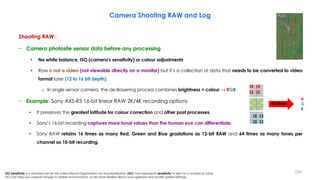
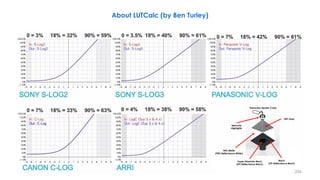
![Signal Levels for Line-up in Production
− There is a practical benefit to the use of common levels for both PQ and HLG and table reflects guidance
to use common levels.
− However, as PQ and HLG have different capabilities, and as HLG levels are influenced by a desire to
maintain a degree of compatibility with SDR displays and PQ levels are not, as experience is developed in
the use of both PQ and HLG, this guidance to use common levels may need to be adjusted.
− The luminance levels for indoor scenes were found to be typically about two thirds of the values
indicated in the table, however those for outdoor scenes were found to be brighter.
• As producers of PQ content gain more experience, it is possible that levels in PQ indoor content may increase.
INDOOR OUTDOOR
cd/m² % (IRE) cd/m² % (IRE)
18% Gray Card 17 34 57 45
Caucasian 26 38 85 49
Diffuse White 140 54 425 66
Reference Level Guidelines for PQ (BT.2100),Dolby Laboratories, Aug. 9,2016
Reflectance Object or
Reference
(Luminance Factor, %)
Nominal Luminance
Value
[Display Peak
Luminance, 1000 nit]
Nominal Signal
Level (%)
PQ
Grey Card (18% Reflectance) 26 nit 38
Diffuse White (100% Reflectance) 203 nit 58
203](https://image.slidesharecdn.com/hdrandwcgprinciplespart3-210615182358/85/HDR-and-WCG-Principles-Part-3-203-320.jpg)
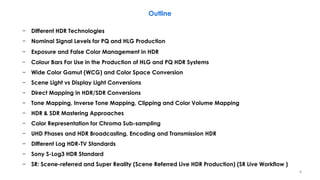
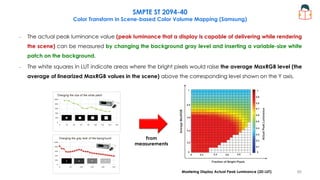
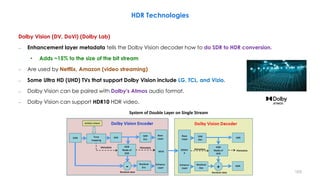
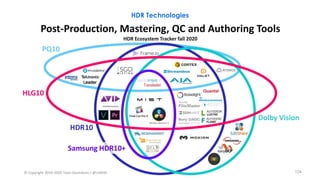
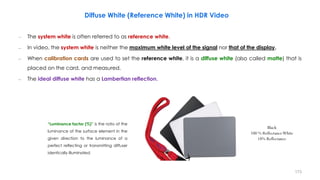
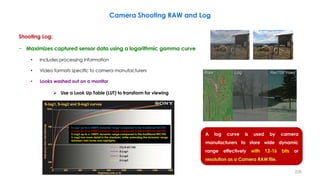
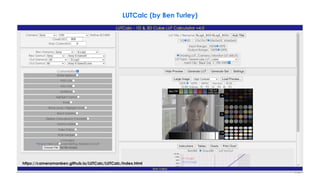
![223
Camera Dynamic Range
• Sony (S Log 1,2,3)
◦ F55
◦ F5
◦ HDC4300L
◦ FS7K
◦ FS700 (S-Log2) [13.3 Stops]
• Canon (C Log)
◦ C700 [15 Stops]
◦ C500
◦ C300 Series
• Red
◦ Weapon 8K [16.5 Stops]
◦ Epic 8K
◦ Scarlett 5K
◦ Raven 4.5K
• ARRI (Log C)
◦ Alexa 65 [>14 Stops]
◦ Alexa SXT
◦ Alexa mini
◦ Amira
• Panasonic (V-Log)
◦ VariCam LT
◦ VariCam 35 [14+ Stops]
◦ VariCam Pure
• Black Magic
◦ Ursa [15 Stops]
◦ Ursa mini
◦ Cinema Camera](https://image.slidesharecdn.com/hdrandwcgprinciplespart3-210615182358/85/HDR-and-WCG-Principles-Part-3-223-320.jpg)


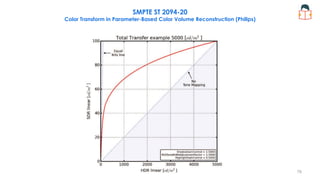
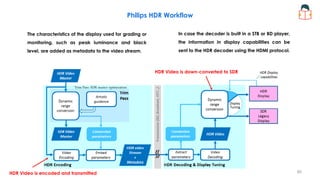
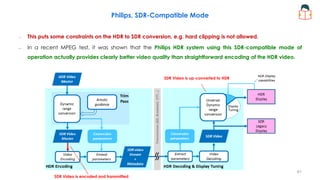
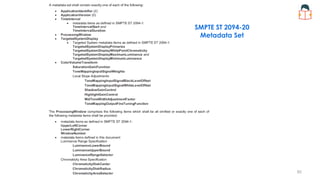
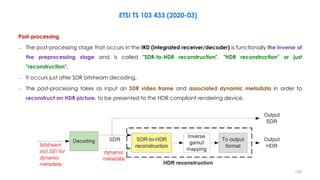
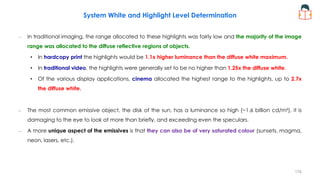
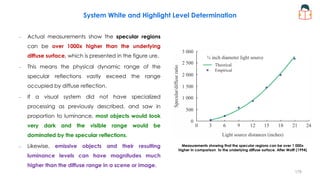
The document discusses high dynamic range (HDR) video technology including: - Different HDR formats such as SMPTE ST 2084 (PQ), ARIB STB-B67/ITU-R BT.2100 (HLG) - Code value ranges for 10-bit and 12-bit RGB and color difference signals in narrow and full ranges - Recommendations for using narrow versus full signal ranges for PQ and HLG - Transcoding concepts when converting between PQ and HLG formats - Considerations for including standard dynamic range (SDR) content in HDR programs