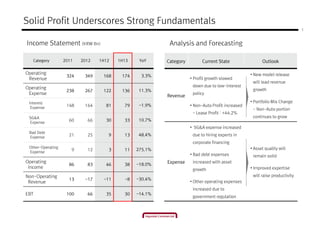
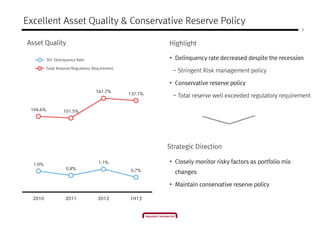
Hyundai Commercial's financial results have remained solid despite slowing profit growth. Revenue increased 3.3% in the first half of 2013 driven by growth in non-auto profits such as leasing. Expenses also increased due to hiring experts and increased regulation. Asset quality remains excellent with delinquency rates decreasing and reserves exceeding requirements. The company aims to enhance its non-auto business and maintain a conservative financial profile.
![[Appendix] Fact Sheet - HCI
(Unit : KRW Bn) 2008 2009 2010 2011 2012 1H13
Domestic
Sales of
Commercial
Vehicles
Sum(unit) 20,152 19,795 21,479 18,842 15,620 8,389
HMC/KMC M/S 54.0% 60.1% 64.2% 65.8% 62.3% 66.6%
Asset
Portfolio
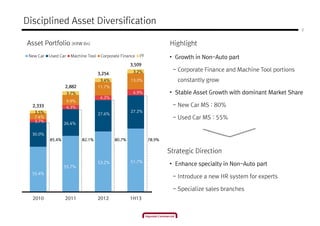
Total 1,050 1,439 2,333 2,882 3,254 3,509
Auto Sector 77.8% 86.4% 85.4% 82.1% 80.7% 78.9%
Others 22.2% 13.6% 14.6% 17.9% 19.3% 21.1%
Asset
Quality
Substandard &
Below
1.2% 0.7% 0.9% 1.2% 1.5% 1.0%
NPL 1.2% 0.6% 0.6% 1.0% 1.0% 1.0%
30+ Delinquency 2.1% 0.9% 1.0% 0.8% 1.1% 0.7%
NPL Coverage ratio 140.8% 224.7% 172.5% 84.1% 114.8% 129.4%
Profitability Operating Income 14.1 27.6 57.5 86.4 82.8 37.6
Asset &
Capital Adequacy
Ratio
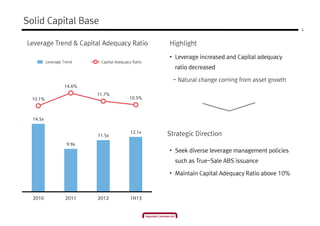
7.8% 9.3% 10.1% 14.6% 11.7% 10.5%
Leverage Borrowing Leverage 15.3X 15.0X 14.5X 9.9X 11.5X 12.1X
Funding
Portfolio
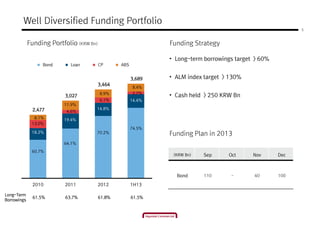
Bond / Loan 91.1% 80.9% 78.9% 83.5% 85.0% 88.9%
CP 8.9% 19.1% 13.0% 4.6% 6.1% 2.7%
ABS - - 8.1% 11.9% 8.9% 8.4%
Total 998 1,481 2,477 3,026 3,464 3, 689
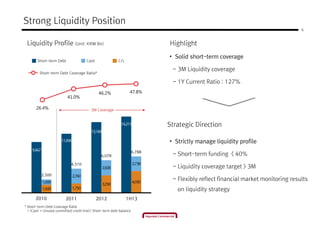
CP Coverage 124.1% 34.2% 77.4% 322.1% 289.4% 673.0%
Debt
Maturity
Debt Maturity - 1.37Y 1.69Y 1.79Y 1.66Y 1.70Y
Maturity 2013 2014 2015 2016 2017 2018~
Volume 676 1,305 774 601 120 213](https://image.slidesharecdn.com/1h13hcieng-130911200900-phpapp01/85/1-h13-hci_eng-8-320.jpg)