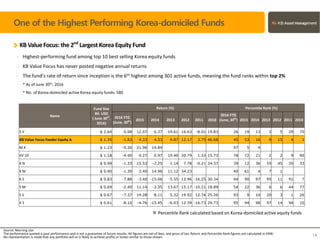
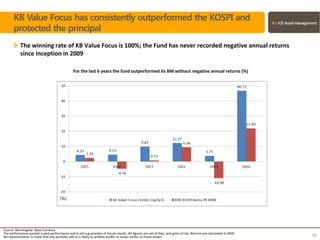
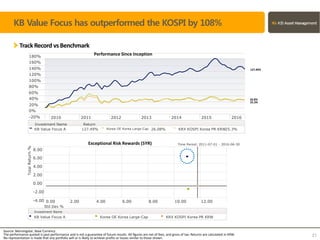
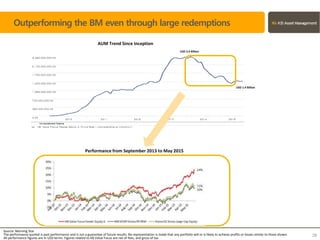
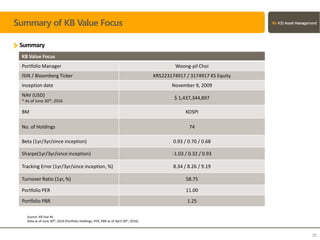
KB VALUE FOCUS KOREA
EQUITY FUND
June, 2016
Please note that marketing materials without an approval code granted from the
Compliance Division of KB Asset Management are not official materials authorized
under our internal procedure. This marketing material is for general information
purposes only and subject to change. Investors should be aware that this presentation
does not purport to be a complete explanation of risks and other risks may also be
relevant from time to time. In the future the Fund may be exposed to risks that are
currently difficult to predict. Risks that are not described in it are considered as
immaterial at the moment, but they may become substantial later on and adversely affect
the fund. KB Asset Management does not guarantee investment decisions and
investment outcomes based on the information of this marketing material.
Contact Information:
Phone : 82-2-2167-8747
E-mail : kbgm@kbfg.com
Approval Code Granted from the Compliance Division of KB Asset Management: 2015_336
FOR INTERNAL USE ONLY
Disclaimers
※ This document is for illustrative purposes only and does not represent any actual investment performance. Prior to investing,
investors must read the Fund’s prospectus in full to make an informed investment decision.
※ An investment in the Fund involves investment risks, including the possible loss of the principal amount invested. KB Asset
Management and any of related companies do not and are not obligated to guarantee principal and/or investment returns
shown in this presentation. In addition, the Fund may pay out dividends based on the Fund’s performance and gains or losses
on investments may be incurred. Such gains and losses are imputed to investors.
※ Investors should be aware that it does not purport to be a complete explanation of risks and other risks may also be relevant
from time to time. In the future the Fund may be exposed to risks that are currently difficult to predict. Risks that are not
described in it are considered as immaterial at the moment, but they may become substantial later on and adversely affect
the fund.
※ The value of the Fund’s investments is subject to change due to various factors, e.g., geopolitical landscape, unrest in the
financial market, changes in interest rates, currency risks, and credit crunch. The performance quoted here and is past
performance and is not a guarantee of future results. In addition, there is no guarantee that any forecasts or opinions will be
realized.
※ The returns illustrated in this presentation indicate returns before taxes. In addition, investors in the Fund may be subject to a
risk of double-taxation. Depending on market conditions after the Fund is set up, transaction costs that have not been
specified in this document may be incurred additionally.
KB: Consistent & Reliable
Key Figures- As of 2016 1Q
KB Financial Group
- Total Assets: USD $405.44 billion
- Client Base: 30 Million
- Market Cap: USD $10.79 billion; Listed on KOSPI and New York Stock Exchange (105560 KS Equity, KB US Equity)
Global Network
TheleadingFinancialGroup in Korea
- KB Financial Group, with commercial banking being the core business, provides comprehensive financial services encompassing
asset management, securities, life insurance, capital, venture investment, and real estate
* Legal-affiliate : Hwang-Mok Park, KIM&CHANG, SHIN&KIM
* Accounting-affiliate: Samil PriceWaterhouseCooprs
4
Business Network
Korea’s LeadingAssetManagementCompany
KB Asset Management
- Incorporation date: April 28th, 1988 (29 years of history)
- AUM: USD $46.09 billion (As of June 30th, 2016)
• The 3rd largest AMC in the market (MS: 8.26%)
* Including discretionary accounts, the 4th largest AMC
AUM by Asset Class (Billion, USD, as of June 30th, 2016)
Change in Fund M/S driven by excellent performance
Source: Morningstar, as of June 30th, 2016Source: Korea Financial Investment Association
The performance quoted is past performance and is not a guarantee of future results. All figures are in USD terms , net of fees, and gross of tax.
5
Category Name
Fund Size
million USD
Morningstar Category % Rank
2016
YTD*
2015 2014 2013 2012 2011 2010
Korea OE
Korea Large-
Cap Equity
KB Value Focus
Feeder Equity A
$ 1350.35 50 44 9 4 10 2 1
Korea OE
Korea Cautious
Allocation
KB Retirement
Pens Div 40 Fdr
Bd Bal C
$ 1589.53 24 40 1 5 1 2 1
Equity Balanced Fixed Income FoF MMF Derivatives Real Estate Special Asset
Segregated
Account
Total
9.05 4.79 16.44 0.27 8.15 1.23 1.35 4.74 0.08 46.09
Source: Korea Financial Investment Association
Thetop AMC inKorea’s fast-growingcorporate pensionfundmarket
KB Asset Management
KBAM M K.V S.S S.Y Others Total
December 31st
, 2014 11,130 10,380 11,831 7,730 4,808 14,394 60,273
December 31th
,2015
(Market Share)
20,675
(24%)
15,585
(18%)
8,973
(10%)
9,618
(11%)
5,901
(7%)
26,902
(31%)
87,653
(100%)
Growth rate 86% 50% -24% 24% 23% 87% 45%
- Market Share: 24% (Largest MS) as of 2015Q4
- Growth Rate: 86%
A firm grip of globalbusinessbasedon a long-term globalpartnership
Market Leader in the Korean corporate pension fund market
Partner
Global Lombard Oider
US Palisade Capital Management, L.L.C.
Europe Blackfriars Asset Management Ltd / Pioneer Investment Management Limited
Japan DLIBJ Asset Management Co.,Ltd
China JF Asset Management Ltd / GAM Hong Kong Ltd / Hamon Investment Management Ltd
ASEAN
Vietnam
Fullerton Fund Management Company Ltd
Russia HSBC Global Asset management(UK) Ltd
Brazil BNY Mellon ARX Investmentos Ltda
India JF Asset Management Ltd
MENA EFG-Hermes UAE Ltd
Source: Korea Financial Investment Association (unit: KRW 100mil)
6
KB Asset Management
Integrity as wellas expertiseis valuedwhenchoosingour investmentprofessionals
7
As of March 31st, 2016
Total Number of Employees : 198
As of June 30th, 2016
Operations
Infra. 1
Compliance
Div.
Infrastructure
Div.
Retail
Marketing 2
Product
Strategy
KB Synergy
Institution
3
Global
Marketing
CM
Strategy
IT
Global
Investment 1
Value
Investment
1
Active
Management
2
26
Value
Investment
2
Strategic
Planning
Fixed Income
3
Fixed Income
4
Trading
Fixed Income
2
Domestic
Passive
Investment 3
ETF
Strategy
Solution
Absolute
Return
Active
Management
1
Research
Investment
Strategy
Risk
Management
Private Equity
& Credit
Div.
Corp.
Administration
Div.
4
Real Estate
Management
29
Committee of
Performance Evaluation
20
Infra. 2
15
Retail
Marketing
Div.
Institution
2
Product
Strategy
Div.
Global
Investment 2
Institution
1
Retail
Marketing 1
Financial
Management
Global
Infrastructure
Fixed Income
Management
Div.
NPL
Management
CM
Strategy
Div.
3
Fixed Income
1
216 7
Audit
Div.
ETFs &
Multi-Solution
Div.
Risk
Management
Div.
11 10
Global
Investment
Div.
Corporate
Investment
Human
Resources
Acquisition
Financing
Communication
Div.
15 6
Real Estate
Investment
Equity
Investment
Div.
ETF
Management
Institutional
Marketing
Div.
Council of Sanctions
Council of Fund evaluation
Council of Risk management
Council of Products
Real Estate
Div.
Labor-Management Council
Council of Prop. Management
Energy &
Resources
Retirement
Pension
KBFG (100%)
Board Of
Director
CEO
(1)
Audit Committee
Committee of
Recommendation for
Outside director
Passive
Investment
Div.
10
Global
Passive
Investment
Standing Auditor
(1)
(Member of
Audit Committee)
Compliance
Officer (1)
Compliance
Global
Fixed Income
17 5 3
Domestic
Passive
Investment 1
Domestic
Passive
Investment 2
KB Asset Management
EquityInvestmentProfessionals– As of June 30th
, 2016
There can be no assurance that the professionals currently employed by KB Asset Management will continue to be employed by KB Asset Management. 8
Name Job Title
Division/
Team
KB Asset Management (Unit: Month) Years of Experience Including in KBAM (Unit: Month)
Months of
Experience
(Total)
Portfolio
Mgmt.
Research
Months of
Experience
(Total)
Portfolio
Mgmt.
Research Others
Woongpil Choi CIO Equity Division 80 80 0 209 198 0 11
Younghyun Jung
Portfolio Manager,
Team Head
Equity Division/
Value Team 1 80 66 14 102 66 36 0
Junbum Park Portfolio Manager
Equity Division/
Value Team 1 52 11 41 64 11 53 0
Jongeun Song Research Analyst
Equity Division/
Value Team 1 30 0 30 54 0 54 0
Younggu Nam
Portfolio Manager,
Team Head
Equity Division/
Value Team 2 64 29 35 77 42 35 0
Soohyung Kim Portfolio Manager
Equity Division/
Value Team 2 28 11 17 61 11 50 0
Insang Yoon Research Analyst
Equity Division/
Value Team 2 10 0 10 10 10 0
Hyosub Sim
Portfolio Manager,
Team Head
Equity Division/
Active Team 1 123 89 34 210 89 121 0
Sungho Yang Portfolio Manager
Equity Division/
Active Team 1 124 84 40 186 84 102 0
Jihyun Jo Portfolio Manager
Equity Division/
Active Team 1 70 34 36 120 34 86 0
Kyungjin Kim
Portfolio Manager,
Team Head
Equity Division/
Active Team 2 40 15 25 186 75 111 0
Taewhan Yoon Portfolio Manager
Equity Division/
Active Team 2 10 10 0 70 70 0 0
Heeeun Choi Portfolio Manager
Equity Division/
Active Team 2 11 11 0 58 58 0 0
Byunghoon Jung
Portfolio Manager,
Team Head
Equity Division/
AR Team 14 12 2 65 12 53 0
Jungmin Ahn Portfolio Manager
Equity Division/
AR Team 5 5 0 99 99 0 0
Eunpyo Kang Portfolio Manager
Equity Division/
AR Team 33 33 0 174 174 0 0
Kyungmin Kim
Analyst,
Team Head
Equity Division/
Research Team 64 0 64 107 24 83 0
Jiyong Lee Analyst
Equity Division/
Research Team 11 0 11 42 0 42 0
Kitae Song Analyst
Equity Division/
Research Team 11 0 11 43 0 43 0
Daegeun Kim Analyst
Equity Division/
Research Team 1 0 1 27 0 27 0
Eunyoung Nam Analyst
Equity Division/
Research Team 11 0 11 40 0 40 0
Jaekyung Kim Analyst
Equity Division/
Research Team 15 0 15 40 0 40 0
Equity Investment
Investment Philosophy
 The aim is to achieve excess returns based on thorough fundamental research & concentrated investment.
 Research capability is much stressed. Sector managers are in charge of investment universe and model
portfolio. They conduct their own company analyses and invest with conviction. The focus is on stock
selection based on bottom-up approach.
 Portfolios are managed based on a long-term perspective rather than a short-term momentum.
 Managers decide to invest preemptively based on research focusing on a long-term perspective.
 Market and credit risks are constantly monitored so that upcoming and subsequent changes are identified.
 Changes are met with appropriate responses while the effect on the stock holdings is examined.
10
Active
Management
Long-term
Approach
Thorough
Risk
Management
Investment Process
 Stock Review
• Valuation
• Growth
• Company visit (1,000 times per year)
• Non-Deal Roadshow
• Interview with Management, etc.
 Basic Criteria
• Market cap: KRW 100 billion and above
• Financial Requirements
 Stock Selection
• Strong BM, Cash flow, Franchise value and structural
growth
• Margin of safety, 30%
 Determined by the Research Team
 Reviewed on a monthly basis
 Final Call: CIO
02
Actual Portfolio
01
Universe
 Team Management
 Portfolio Management
• Monitoring valuation, earnings forecast, price
attractiveness, etc.
• Analyzing performance attribution
• Responding to market and credit risk
 Determined by the Management Team
 Final Call: Portfolio Management Team
ValueStyle
11
* Criteria to be included in the Investment Universe:
① The market cap of a stock should exceed 100 billion. The Investment Universe is reviewed and updated at least quarterly; stocks with a market cap less
than 100 billion KRW can be included depending on market condition or company fundamentals, provided that approval of CIO is obtained.
② The trading volume within last 3 months should exceed 10 billion KRW.
③ Companies that have not posted net losses in the last 3 consecutive years
④ Companies that have not been included in the investment warnings list of Korea Exchange in the last 2 years.
Investment Process
 Stock Review
• Valuation
• Growth
• Company visit (1,000 times per year)
• Non-Deal Roadshow
• Interview with Management, etc.
 Basic Criteria
• Market cap: KRW 300 billion and above
• Financial Requirements
 Stock Selection
• Focused analysis on companies by conducting
company visits and assessing financial and
managerial risks in a qualitative and
quantitative manner
 Determined by the Research Team
 Reviewed on a monthly basis
 Final Call: CIO
02
Model Portfolio
03
Actual Portfolio
01
Universe
 Determined by the Research Team
 Reviewed on a weekly basis or ad hoc
 Final Call: CIO
 Team Management
 MP Replication Ratio, 60%
• Team discretion, 40%
 Portfolio Management
• Monitoring valuation, earnings forecast,
price attractiveness, etc.
• Analyzing performance attribution
• Responding to market and credit risk
 Incentives for portfolio managers are
determined based on AP’s performance
compared to the MP
 Determined by the Management Team
 Final Call: Portfolio Management Team
 Sector Weight
• Market neutral
 Stock Selection within Each Sector
• Top picks by each sector manager
 Reaching Agreement
• Communication or debate between
portfolio and sector managers
 Incentives for research managers are
determined based on MP’s performance
compared to the market
Growth Style
* Criteria to be included in the Investment Universe:
① The market cap of a stock should exceed 300 billion. The Investment Universe is reviewed and updated at least quarterly; stocks with a market cap less
than 300 billion KRW can be included depending on market condition or company fundamentals, provided that approval of CIO is obtained.
② The trading volume within last 3 months should exceed 10 billion KRW.
③ Companies that have not posted net losses in the last 3 consecutive years
④ Companies that have not been included in the investment warnings list of Korea Exchange in the last 2 years.
12
KB Value Focus
Korea Equity Fund
One of the Highest Performing Korea-domiciled Funds
KB ValueFocus: the 2nd
LargestKorea EquityFund
- Highest-performing fund among top 10 best selling Korea equity funds
- KB Value Focus has never posted negative annual returns
- The fund’s rate of return since inception is the 6th highest among 301 active funds, meaning the fund ranks within top 2%
* As of June 30th, 2016
* No. of Korea-domiciled active Korea equity funds: 580
Source: Morning star
The performance quoted is past performance and is not a guarantee of future results. All figures are net of fees, and gross of tax. Return and Percentile Rank figures are calculated in KRW.
No representation is made that any portfolio will or is likely to achieve profits or losses similar to those shown. 14
Name
Fund Size
Bil. USD
( June 30th
,
2016)
Return (%) Percentile Rank (%)
2016 YTD
(June, 30th
)
2015 2014 2013 2012 2011 2010
2016 YTD
(June, 30th
) 2015 2014 2013 2012 2011 2010
S V $ 2.64 0.08 12.07 6.37 19.61 16.63 -8.01 19.83 26 19 13 2 5 29 70
KB Value Focus Feeder Equity A $ 1.35 -1.83 4.33 4.53 9.87 12.17 3.75 46.68 45 53 16 9 15 4 1
M K $ 1.23 -9.26 21.96 14.84 97 5 4
KV 10 $ 1.18 -4.40 0.27 0.97 19.40 20.79 1.33 15.73 78 72 21 2 2 9 90
K N $ 0.99 -1.33 15.53 -2.25 1.14 7.78 -9.21 24.37 39 12 36 55 45 35 33
K M $ 0.90 -1.39 2.40 14.96 11.12 34.23 40 61 4 7 1
K S $ 0.83 -7.88 -3.40 -15.06 -5.55 12.96 -16.25 30.34 94 90 97 95 11 91 7
S M $ 0.69 -2.40 11.14 -2.35 13.67 15.17 -10.21 18.89 54 22 36 6 6 44 77
S S $ 0.67 -7.37 19.28 8.11 5.32 19.92 12.74 25.26 93 9 10 20 3 1 26
K S $ 0.61 -8.10 -4.76 -15.45 -6.03 12.39 -16.73 29.73 95 94 98 97 14 94 10
※ Percentile Rank calculated based on Korea-domiciled active equity funds
Identical Portfolio Manager Since Inception
Thecurrent CIO of KBAM has beenmanagingthe fundsince2009
 1992-1999 Applied Statistics Department, College of Business and Economics, Yonsei University
 1998-1999 LNG Carrier Department, Hyundai Merchant Marine
 1999-2002 Sector Manager of Equity Management Team, Dongwon Securities
 2002-2004 Sector Manager of Investment Adviser Department, Dongwon Investment Management
 2004-2006 Sector Manager, Korea Investment Management
 2006-2009 Asset Management Department, Korea Investment Value Asset Management
 2009-Present CIO/Head of Equity Management Division, KB Asset Management
Currently manages KB Value Focus, KB Pension Dividend 40, and KB Small/Mid Cap Equity Fund
CIO,WoongpilChoi
Educational/Professional Background
15
Investment Professionals involved with KB Value Focus
Portfolio Managers
 2008.02 Business major, Seoul National University
 2008-2009 Asset Management Department, Korea
Investment Value Asset Management
 2009-Present Head of Value Investment Team 2, KB Asset
Management
YonghyunJung,
HeadofValueInv.Team 1
Educational/Professional Background
16
 2010.02 Computer Science and Engineering major,
Seoul National University
 2010-2011 Asset Management Department, Korea
Investment Value Asset Management
 2011-Present Head of Value Investment Team 2, KB Asset
Management
Educational/Professional Background
YoungguNam,
HeadofValueInv.Team 2
Primary Investments
Low PER
Stocks with a PER Lower
than the company’s
earnings value
Low PBR
Stocks with a PBR
Lower than the
company’s
assets value
High
Dividend
New Value
Stocks
Companies with stable
growth of earnings Based
on market dominance
17
KB ValueFocus Fundprimarilyinvestsinequitieswith…
≥
Dividend
Yields
Market
Interest
Rates
Shown for illustrative purposes only. They do not constitute investment recommendations.
18
Focus & Principle of KB Value Focus
Undervaluation is not the
only focus
Earnings value is as much
important
While maintaining our
principle of Buy & Hold
We engage in active trading
upon significant price
changes
Turnover Ratio:
2013: 56.03%
2014: 62.38%
2015: 70.53%
Rather than blindly following
the benchmark index
We primarily invest in
stocks with upside potential
We do not invest in large cap
companies just to follow the
benchmark index
 Robust Business Model
 Expected Structural Growth
 Sustainability of Earnings
Thefund’sfocus & principle
Selection of Stocks
Re-Rating
If stocks that generate stable profits based on their
franchise value or intrinsic competitive advantage are
undervalued compared to the market valuation, the
value of the stocks will eventually converge to the
intrinsic value
Market Share
Predictability of Earnings
Sustainability of Earnings
Premium
If companies that are identified to have expected
structural growth and paradigm shifts are undervalued
relative to their growth potential, their structurally
stable growth potential will eventually be recognized
by consensus and the stocks will be valued higher than
the market valuation
Probability of Market Diversification
Life Cycle
Growth Potential of Flagship Products
Focused on stock selection, not on forecasting market outlook
- Stocks that have significantly higher intrinsic value
- Companies posting stable growth of earnings
- Stocks that match these conditions are actively purchased when the prices of the stocks tumble or the stocks are neglected
19
KB Value Focus has consistently outperformed the KOSPI and
protected the principal
For the last 6 years the fund outperformed its BM without negative annual returns (%)
The winning rate of KB Value Focus is 100%; the Fund has never recorded negative annual returns
since inception in 2009
Source: Morningstar, Base Currency
The performance quoted is past performance and is not a guarantee of future results. All figures are net of fees, and gross of tax. Returns are calculated in KRW.
No representation is made that any portfolio will or is likely to achieve profits or losses similar to those shown. 20
(%)
Time Period: 2011-07-01 - 2016-06-30
TotalReturn%
Std Dev %
0.00 2.00 4.00 6.00 8.00 10.00 12.00-4.00
-2.00
0.00
2.00
4.00
6.00
8.00
Investment Name
KB Value Focus A Korea OE Korea Large-Cap KRX KOSPI Korea PR KRW
2010 2011 2012 2013 2014 2015 2016-20%
0%
20%
40%
60%
80%
100%
120%
140%
160%
180%
Investment Name Return
KB Value Focus A 127.49% Korea OE Korea Large-Cap 26.08% KRX KOSPI Korea PR KRW25.3%
Track Record vs Benchmark
Performance Since Inception
Exceptional Risk Rewards (5YR)
Source: Morningstar, Base Currency
The performance quoted is past performance and is not a guarantee of future results. All figures are net of fees, and gross of tax. Returns are calculated in KRW.
No representation is made that any portfolio will or is likely to achieve profits or losses similar to those shown.
21
127.49%
25.3%
26.8%
KB Value Focus has outperformed the KOSPI by 108%
Time Period: 2011-07-01 - 2016-06-30
TotalReturn%
Std Dev %
0.00 2.00 4.00 6.00 8.00 10.00 12.00-4.00
-2.00
0.00
2.00
4.00
6.00
8.00
Investment Name
KB Value Focus A Korea OE Korea Large-Cap KRX KOSPI Korea PR KRW
2010 2011 2012 2013 2014 2015 2016-20%
0%
20%
40%
60%
80%
100%
120%
140%
160%
180%
Investment Name Return
KB Value Focus A 127.49% Korea OE Korea Large-Cap 26.08% KRX KOSPI Korea PR KRW25.3%
Track Record vs Benchmark
Performance Since Inception
Exceptional Risk Rewards (5YR)
Source: Morningstar, Base Currency
The performance quoted is past performance and is not a guarantee of future results. All figures are net of fees, and gross of tax. Returns are calculated in KRW.
No representation is made that any portfolio will or is likely to achieve profits or losses similar to those shown.
22
127.49%
25.3%
26.8%
KB Value Focus has outperformed the KOSPI by 108%
KOSPI
EAA OE Korea Equity Korea Large-Cap
Source: Morningstar
The performance quoted is past performance and is not a guarantee of future results. No representation is made that any portfolio will or is likely to achieve profits or losses similar to those shown.
All performance figures are in USD terms. Figures related to KB Value Focus are net of fees, and gross of tax.
23
The fund’s investors have benefitted from the principle
The charts below show distribution of returns for each subscription date from November 30th, 2009 to
June 30th, 2016
- The red parts indicate negative returns
KB Value Focus
.....
Subscription
date
Evaluation
date
Nov. 30, 2009
Dec. 31, 2009
Jan. 29, 2010
Jun. 30, 2016
.....
Dec. 31, 2009
Jan. 29, 2010
Jun. 30, 2016
Distribution of returns show that KB Value Focus has successfully preserved investors’ capital
Upon inspection of downside, KB Value Focus shows superior protection of principal:
Other funds recorded a loss of 43% on average while KB Value Focus fund recorded average losses of only 16%
(From Nov. 30th 2009 to June 30th 2016)
KB Value
Focus
KOSPI
EAA OE Korea
Equity
Korea
Large-Cap
140%~160% 0.37%
120%~140% 1.33%
100%~120% 3.67%
80%~100% 5.34%
60%~80% 5.86% 0.03%
40%~60% 12.35% 1.94% 1.33% 2.07%
20%~40% 23.36% 15.15% 10.74% 14.85%
0%~20% 32.04% 42.99% 40.49% 42.75%
-20%~0% 15.43% 39.01% 44.44% 38.89%
-40%~-20% 0.15% 0.90% 2.99% 1.42%
+ 84% 60% 53% 60%
- 16% 40% 47% 40%
Average 30.42% 5.89% 2.78% 5.61%
Max. 167.50% 52.92% 58.14% 60.34%
Min. -22.54% -26.57% -30.64% -27.89%
Source: Morningstar
The performance quoted is past performance and is not a guarantee of future results. No representation is made that any portfolio will or is likely to achieve profits or losses similar to those shown.
All performance figures are in USD terms. Figures related to KB Value Focus are net of fees, and gross of tax.
24
The fund’s investors have benefitted from the principle (cont’d)
수정중
Std Dev %
0.00 2.00 4.00 6.00 8.00 10.000.00
1.00
2.00
3.00
4.00
5.00
6.00
Investment Name
KB Value Focus A K V 10 K N
Time Period: 2013-07-01 - 2016-06-30
Crosshairs: KRX KOSPI Korea PR KRW
2010 2011 2012 2013 2014 2015 2016-20%
0%
20%
40%
60%
80%
100%
120%
140%
160%
180%
Investment Name Value
KB Value Focus A 127.49 KV 10 71.74 K N 46.53
Track Record vs competition
Performance Since Inception
Risk-Rewards (3YR)
25
127.49%
46.53%
71.74%
KB Value Focus has outperformed its competitors
TotalReturn%
Source: Morningstar, Base Currency
The performance quoted is past performance and is not a guarantee of future results. All figures are net of fees, and gross of tax. Returns are calculated in KRW.
No representation is made that any portfolio will or is likely to achieve profits or losses similar to those shown.
K V 10 K N
Source: Morningstar
The performance quoted is past performance and is not a guarantee of future results. No representation is made that any portfolio will or is likely to achieve profits or losses similar to those shown.
All performance figures are in USD terms. Figures related to KB Value Focus are net of fees, and gross of tax.
26
KB Value Focus has outperformed its competitors (cont’d)
The charts below show distribution of returns for each subscription date from November 30th, 2009 to
June 30th, 2016
- The red parts indicate negative returns
KB Value Focus
.....
Subscription
date
Evaluation
date
Nov. 30, 2009
Dec. 31, 2009
Jan. 29, 2010
Jun. 30, 2016
.....
Dec. 31, 2009
Jan. 29, 2010
Jun. 30, 2016
Distribution of returns show that KB Value Focus has successfully preserved investors’ capital
Upon inspection of downside, KB Value Focus shows superior protection of principal:
KB Value Focus fund recorded average losses of only 16% while competitor funds showed losses of 20% and 25%
(From Nov. 30th 2009 to Jun. 30th 2016)
KB Value
Focus
K V 10 K N
140%~160% 0.37% 0.00% 0.00%
120%~140% 1.33% 0.06% 0.00%
100%~120% 3.67% 1.48% 0.00%
80%~100% 5.34% 5.46% 0.00%
60%~80% 5.86% 11.27% 0.15%
40%~60% 12.35% 18.02% 7.16%
20%~40% 23.36% 18.98% 18.70%
0%~20% 32.04% 24.57% 49.29%
-20%~0% 15.43% 19.60% 24.35%
-40%~-20% 0.15% 0.56% 0.34%
+ 84% 80% 75%
- 16% 20% 25%
Average 29.67% 26.55% 6.63%
Max. 156.61% 115.30% 83.08%
Min. -14.29% -25.32% -26.14%
Source: Morningstar
The performance quoted is past performance and is not a guarantee of future results. No representation is made that any portfolio will or is likely to achieve profits or losses similar to those shown.
All performance figures are in USD terms. Figures related to KB Value Focus are net of fees, and gross of tax.
27
KB Value Focus has outperformed its competitors (cont’d)
28
USD 1.4 Billion
USD 2.4 Billion
Source: Morning Star
The performance quoted is past performance and is not a guarantee of future results. No representation is made that any portfolio will or is likely to achieve profits or losses similar to those shown.
All performance figures are in USD terms. Figures related to KB Value Focus are net of fees, and gross of tax.
Performance from September 2013 to May 2015
AUM Trend Since Inception
Outperforming the BM even through large redemptions
Investment Process of KB Value Focus
InvestmentProcess
29
Quantitative Analysis
• PER & PBR : 30 % discounted compared to the
market
• Dividend Yield: Higher than 3%
• Other factors: Free Cash Flow, EBITDA, etc.
Qualitative Analysis
• Business Model Analysis: Market Share, Earnings Visibility,
Sustainability of Earnings
• Structural Growth: Market diversification and/or
expansion, Life cycle
• Paradigm Shift: Leader and or pioneer
• Companies that can retain earnings are preferred over
capital-intensive industry
Stock Evaluation
• Premium: Stocks that have good reasons to be traded at a higher valuation than the
market
• Re-rating: Stocks that are undervalued compared to intrinsic values
• Discount: Stocks that have good reasons to be cheap
Actual Portfolio
• Invest mainly in premium and re-rating stocks, occasionally picking discount stocks, if
necessary
• Decide sector weights, preferring sectors with sustainable and stable earnings
• Number of stocks in the actual portfolio ranges from 80 to 100
• Monitor market and credit risk consistently
What KB Value Focus looks into
In summary,KB ValueFocus Korea Equity Fund…
02 focuses on stock selection rather than indices or economic outlook
•The fund invests in stocks that are undervalued relative to their intrinsic values, including values of an
enterprise, assets, and earnings
•It also invests in stocks that are expected to see a stable growth in earnings while being less affected
by external changes such as economic fluctuations
•Such is a new type of value investment strategy, which has evolved from a traditional value strategy
01 invests in stocksthat are undervalued and expected to see stablegrowth
•The fund does not forecast the market or make sector bets
•Focuses on stock selection whereas portfolio composition and sector weights are results of stock selection.
•We believe that our strategy is a necessary evolution from a traditional value investment strategy
30
KOSPI
82.79%
KOSDAQ
17.21%
Portfolio of KB Value Focus
Portfolio (AsofApril30th
,2016)
Weight by KOSPI & KOSDAQ
Sector Weight (%)
Weight by Market Weight
Top 10 Holdings (Weight, %)
Source: KB Asset Management
Shown for illustrative purposes only. The inclusion of the securities mentioned above is not to be interpreted as recommendations to buy or sell and is subject to change without notice. 31
Weight(%)
KOSPI KOSDAQ
Large Cap 32.00 0.91
Middle Cap 38.11 8.43
Small Cap 12.68 7.88
Total 82.79 17.21
Stock GICS Industry Groups
Market
(%)
KB Value
Focus (%)
Difference
(%)
Com2uS Corp Software & Services 0.11 6.85 6.74
SK Telecom Co Ltd Telecommunication Services 1.09 4.50 3.40
Korea Electric Power Corp Utilities 2.61 3.91 1.30
SK Holdings Energy 1.04 3.64 2.60
Fila Korea Ltd Consumer Durables & Apparel 0.08 3.42 3.34
NAVER Corp Software & Services 1.47 3.19 1.73
Hansol Chemical Co Ltd Materials 0.05 3.03 2.97
Dongwon Industries Food, Beverage & Tobacco 0.06 2.80 2.73
Samsung Electronics Co Ltd
Technology hardware &
Equipment
11.88 2.55 -9.33
KB Capital Co Ltd Diversified Financials 0.03 2.42 2.38
GICS Sector Market (%)
KB Value
Focus (%)
Difference (%)
Information Technology 23.39 21.38 -2.01
Industrials 15.01 17.46 2.45
Consumer Discretionary 19.71 14.51 -5.19
Financials 12.41 14.02 1.61
Materials 10.21 11.65 1.45
Consumer Staples 6.21 7.99 1.78
Telecommunication
Services
2.44 4.69 2.25
Utilities 4.29 4.08 -0.21
Others 0.26 2.51 2.25
Health Care 3.51 1.46 -2.05
Energy 2.56 0.24 -2.32
Summary of KB Value Focus
Summary
32
KB Value Focus
Portfolio Manager Woong-pil Choi
ISIN / Bloomberg Ticker KR5223174917 / 3174917 KS Equity
Inception date November 9, 2009
NAV (USD)
* As of June 30th, 2016
$ 1,437,344,897
BM KOSPI
No. of Holdings 74
Beta (1yr/3yr/since inception) 0.93 / 0.70 / 0.68
Sharpe(1yr/3yr/since inception) -1.03 / 0.32 / 0.93
Tracking Error (1yr/3yr/since inception, %) 8.34 / 8.26 / 9.19
Turnover Ratio (1yr, %) 58.75
Portfolio PER 11.00
Portfolio PBR 1.25
Source: KB Star M
Data as of June 30th, 2016 (Portfolio Holdings, PER, PBR as of April 30th, 2016)
33
KB Star Funds – KB Value Focus Korea Equity
Investment Management Fee
Sales Charge /
Redemption Charge
Minimum initial investment
(USD/EUR)
A ACC USD/EUR 2.00% 5.00% 1,000
I ACC USD/EUR 0.75% N/A 5,000
I2 ACC USD/EUR 0.50% N/A 5,000,000
• Domicile: Luxembourg
• Legal Structure: UCITS SICAV
• Launch date: June 20, 2016
• Service Providers
 Depositary Bank, Administratior, Paying Agent, Registrar, and Transfer Agent: HSBC Bank Plc, Luxembourg Branch
 Management Company: Carne Global Fund Managers (Luxembourg) S.A.
 Legal Advisers: Elvinger, Hoss & Prussen
 Auditors: Deloitte Audit S.à r.l.
• Classes of shares available for subscription
Internal Control
Investment System
Star F
- An internally developed trading system
- It provides pre-transaction compliance function
KB MPuStar
- An internally developed system designed to maximize efficiency in equity management process
- KB MPStar provides a research function and enables managers to determine a portfolio and simulate returns
- It is also used as a tool to evaluate portfolio managers and sector managers
Otherinformationsystems
- Bloomberg, IBES data, Data Stream, Brokerage terminals, Market Point, Infomax, and Reuter
35
Star M
- An internally developed asset management system
- It is widely utilized by equities, fixed income and marketing professionals
Risk Management
Portfolio Managers Risk Management Division
Market Risk
 Monitor macroeconomic factors
 Monitor business environment of each sector
 Model Portfolio Replication Ratio: 60%
- Discretion of managers is limited to 40%
 Equity Turnover Ratio: Within 300% a year
- Transaction costs caused by frequent transactions are
reduced
Credit Risk
 Review and analyze fundamentals and
valuations of individual stocks
 Review on a weekly basis and ad hoc
 Investment Universe Management: Allow managers to invest
only in securities which are fully analyzed
Liquidity Risk
 Market Capitalization: Growth: KRW 300 billion and above/Value: KRW 100 billion and above
 Managers are allowed to invest primarily in large cap securities so that liquidity risk is prevented
 Stocks with market cap under KRW 300 billion (Growth) or KRW 100 billion (Value) can only be included in the
investment universe after approval of CIO is obtained
Periodic Review
 Daily and weekly monitoring
 Upon detection, violations are reported to CIO and CRO and a request for corrective action follows
36
Risk Management
Risk ManagementSystem Flow
• Risk Management Committee
– Establishes risk management strategies and procedures
– Annually renews risk tolerance reflecting market condition
• Product Committee
– Determines best risk management methods for each new investment product
• Inspecting and Evaluating Risk Factors
–
• Performance Analysis
– Attributes for performance are analyzed for each investment of a portfolio
• Periodic Reports and Reporting
– Reports on factors monitored are produced on a daily and weekly basis
– The Risk Management Committee is debriefed on reports
– Major issues are handled in the Risk Management Committee
Establish
Risk Management Policy
Measure and Evaluate Risks
of Each Portfolio
Report Present Risks and
Devise Follow-ups
Risk factors are quantitatively measured reflecting characteristics of portfolios
and relevant market risks (e.g. interest rates, duration, and credit ratings)
37
Compliance
InternalControl for BusinessCompliance
38
• Prohibition on unfair transaction
• Executives and employees’ trading of
financial investment products
• Reporting of provision/receipt of benefit
• External activities other than duty
• Compliance training (regular/irregular basis)
Code of Conduct
• Compliance with laws and regulations
• Reporting obligation
• Prioritization of clients interests
• Procedures of providing confidential information
Conflict of Interest
• A compliance pledge of the company is signed and
submitted to the compliance officer
• A system to report violation
Measures on Illegal and Unfair Practices
• An anti-money laundering system that comprehensively
covers the anti-money laundering law
Establishment of Anti-Money Laundering System
• Development of a new product
• Sales activities of the company
• Principle of handling trading orders
• Selection criteria for brokerage
Compliance Matters
for Investment Trust
Compliance (cont’d)
39
1. Pre-caution
• On a daily basis, monitoring results which may constitute a breach are reported to portfolio managers
• Soft rule is fixed beforehand (e.g. maximum X% - 1)
2. Prior approval
• All trades initiated by a portfolio manager must first go through compliance checking before each order
reaches a trader
3. Frequent Examination
• Regular and frequent examinations to make sure investment guidelines are observed
• Breaches are examined at 12:00 / 15:00/ 17:30 (KST) on a daily basis
Procedures of Pre-Check
InternalControl for BusinessCompliance
Compliance (cont’d)
InternalControl for Investment Compliance
40
In the event of a breach of a restriction, portfolio managers must rectify within 3 business days
• The measure standard
− Primary: Rectification within 3 business days is required. Identification of reasons & submission of plans
for rectification must be followed
− Secondary: If breaches are not rectified over 3 Business days, reasons must be submitted in writing
− Tertiary: If breaches are not rectified over 6 Business days, it is reported to the personnel committee
• Breaches are rated as grade
− Breaches are reflected by 10% in the performance assessment of a portfolio manager
• Bi-monthly compliance training for portfolio managers
− Bi-monthly compliance training is held
− A feedback directly goes to the portfolio manager to offer remedial measures to prevent its
reoccurrence
Disciplinary Measures on Breaches
Compliance (cont’d)
Electronicsystems are introducedandbeingoperated so thatefficiencyin internalcontrol is achieved
41
•Definition: Trading system
• Definition: Electronic approval system
Groupware
- EDMS
Star M
- Middle
system
•Characteristics: Accessing and
regularly examining all business to
make sure internal control standards
are met
• Definition: Business support system
•Characteristics: Electronically record
and store all communication related
to assigned duties
• Characteristics: Handling all orders in
a fair manner and executing trading in
accordance with principle based on
fairness
Star F
- Trading
system
Awards and
Accolades
KB Asset Management product line-up
Line-upof Funds
• Korea Value Focus
• Korea Growth Focus
• Korea Value & Growth
• Korea Small and Mid Cap
• Korea Star
• Major Groups
• Elite 20
• M&A
• Foreigners Preferred
Asia
• China
• China Focus
• China A-share
• India
• ASEAN
• Vietnam
• Japan Blue Chip Selection
Global
• Multimanager BRICs
• Global Dividend
Emerging
• Euro Convergence
• Russia Growth
• MENA
• Brazil
Domestic Equity
KB Asset Management strongly emphasizes teamwork and integrity. Active
communication and team discussion enable a dynamic portfolio strategy that
evolves with new investment ideas. We employ both bottom-up and top-down
analyses for all investments.
Overseas Equity
KB Asset Management covers all major investment areas across the globe and
provides investment solutions in both direct and FOF formats. Moreover, KB Asset
Management is one of the first domestic investment houses to introduce the
“Manager of Managers” investment concept.
43
Fixed Income & MMF
KBAM is a major player in the fixed income market with over USD 9.5 billion under
management in bond funds and MMFs. We primarily invest in government, agency,
and high quality corporate debt.
• Korea Star Government Bond
• Korea Corporate Bond
• Emerging Market Bond Plus
KB Asset Management
Line-upof Funds
• Korea index / leveage 1.5,
2.0 index
• Korea China Japan index
• China H index
• Japan index
• US S&P500 index
• Euro index
• Russia index
• MKF Commodities index
• Gold index
• KB Star 5 Major Groups
• KB Star KOSDAQ Elite 30
• KB Star Leveraged
• KB Star Government Bonds
Index
Our index strategy covers both Korean and overseas equity markets as well as
commodities.
ETF
KBAM was the first company to launch a bond ETF
44
Real Estate
We aim to provide stable returns by investing predominantly in commercial
properties and real estate developments as well as major global real estate
markets.
• Real Estate (Domestic/Overseas)
- Korea
- China
Infrastructure
Our main infrastructure funds invest in various sectors including SOC, logistics and
shipping, primarily in the form of BTL and BTO.
• Infrastructure
• Shipping
• Logistics
Private Equity
Our private equity funds invest capital raised by private placement in equities and
bonds through a negotiation process or acquisition of managerial control.
• Mezzanine
45
BEST OVERSEAS EQUITY FUND
MONEY TODAY “KOREA FUND GRAND PRIZE”
KB MENA Fund
FUND MANAGER OF THE YEAR
SEOUL ECONOMIC DAILY “KOREA BEST
SECURITIES AWARDS 2014”
KBAM’s Infrastructure Division
BEST PENSION FUND
HERALD BUSINESS “FUND GRAND PRIZE”
KB Pension Dividend 40
FUND MANAGER OF THE YEAR
HERALD BUSINESS “FUND GRAND PRIZE”
KBAM’s Infrastructure Division
BEST PERFORMING FUND
KG ZEROIN FUND RATING “KOREA FUND AWARDS”
KB Star Japan Index Fund
BEST ASSET MANAGEMENT COMPANY
ASIA BUSINESS DAILY “ASIA FUND GRAND PRIZE”
KB Asset Management
BEST OVERSEAS EQUITY INDEX FUND
ASIA BUSINESS DAILY “ASIA FUND GRAND PRIZE”
KB Star Japan Index Fund
2014BEST OVERSEAS FUND
e-DAILY “FINANCIAL INVESTMENT AWARD”
KB Asset Management
BEST PENSION FUND
KOREA ECONOMIC DAILY “KOREA FUND GRAND
AWARD”
KB Asset Management
BEST PENSION FUND
ASIA BUSINESS DAILY “ASIA FUND GRAND PRIZE”
KB Pension Fund 40
SPECIAL PRIZE FOR BEST PERFORMING FUND
KG ZEROIN FUND RATING “KOREA FUND AWARDS”
KB Mainland China Leverage Fund
EXCELLENCE AWARD FOR BOND BALANCED
FUND
KG ZEROIN FUND RATING “KOREA FUND AWARDS”
KB Pension Fund 40
BEST FUND AWARD
KG ZEROIN FUND RATING “KOREA FUND AWARDS”
KB Asset Management
2015
Awards Presented in 2015/2014
46
ASSETMANAGEMENTCOMPANYOFTHEYEAR
ASIANINVESTOR“KOREAAWARDS”
KBAssetManagement
GOLDPRIZEOF“BESTASSETMANAGER”
MKBUSINESSNEWS“BESTASSETMANAGER”,
CIOWoongpilChoiofKBValueFocusFund
BESTASSETMANAGEMENTCOMPANY
KOREAECONOMICDAILY “KOREAFUNDGRANDAWARD”
DOMESTICEQUITYFUND
BESTFUNDAWARD
ASIABUSINESSDAILY “ASIAFUNDGRANDPRIZE”
DOMESTICEQUITYFUND
BESTFUNDAWARD
KGZEROINFUNDRATING“KOREAFUNDAWARDS”
KBPensionDividend40
2012BESTFUNDAWARD– ACTIVEEQUITYFUND
MKBUSINESSNEWS“KOREAFUNDGRANDAWARD”
KBValueFocusFund
ASSETMANAGEMENTCOMPANYOFTHEYEAR
ASIANINVESTOR“KOREAAWARDS”
KBAssetManagement
BESTASSETMANAGERAWARD
MKBUSINESSNEWS“BESTASSETMANAGERAWARD”
CIOWoongpilChoiofKBValueFocusFund
BESTFUNDAWARD–DOMESTICEQUITYFUND
KOREAECONOMICDAILY “KOREAFUNDGRANDAWARD”
KBSmall/MidCapEquityFund
BESTPENSIONFUND
MONEYTODAY“KOREAFUNDGRAND PRIZE“
KBPensionDividend40
2013
Awards Presented in 2013/2012
Disclaimer
47
Risks and Disclaimers
General
The Fund is intended for long-term Investors who can accept the significant risks associated with investing in illiquid securities. An investment in the Fund
involves various risk factors, including the possibility of partial or total loss of the Fund capital, and prospective Investors should not subscribe unless they can
readily bear the consequences of such loss. There can be no assurance that the Fund will achieve its Investment Objective or Portfolio
Target Return, or that there will be any return on capital. In particular, potential investors should take into account the fact that the actual return achieved may
be more or less in any particular year, and that different returns may be achieved by different Investments, according to their different cost bases, and that
different Fund Investor Vehicles may have different returns.
Projections
The opinions stated in this presentation include some forecasted views. We believe that we are basing our expectations and beliefs on reasonable assumptions
within the bounds of what we currently know. However, there is no guarantee that any forecasts or opinions will be realized.
Portfolio
No representation is being made that any portfolio will or is likely to achieve profits or losses similar to those shown.
Portfolio holdings are subject to change at any time without notice .
Risks Involving
Investment Strategy
Opinions, estimates, forecasts, projections and statements of financial market trends that are based on current market conditions constitute our judgment and
are subject to change without notice. There can be no guarantee they will be met.
Risks Associated with
Performance
The performance quoted is past performance and is not a guarantee of future results. All figures are in USD terms, net of fees, and gross of tax. The impact of
the initial charge can be material on the performance of your investment. Performance figures including the initial charge are available upon request. The Fund
is subject to certain market risks. Investment returns and principal value of an investment will fluctuate so that an investor's shares, when redeemed, may be
worth more or less than original cost. Current performance may be higher or lower than the performance data shown. For performance current to the most
recent month-end, please send an email to the following address: kbgm@kbfg.com
Currency Risks
Changes in the rates of exchange may affect the value of investments. The Fund can invest in overseas securities which may also generate profits overseas and
pay dividends in foreign currencies, which means the fund is exposed to changes in currency rates.
Impact of
Compensation
The Fund takes its charges from the Fund. The impact of Fund charges may be material on the value of any income you receive from your investment. There is
potential for future capital erosion if insufficient income is generated by the Fund to cover these charges. Please see the prospectus for additional information
on the fees and expenses.
Tax Risks
Tax treatment will depend on the individual circumstances of clients and may be subject to change in the future. The rate and amount of tax would vary
depending on the mix and type of investments made by the Fund. Investors should consult their tax advisers regarding such tax consequences as well as any
taxes to which they may be subject in their own jurisdiction.
Limitations of Target
Returns
An investor should not expect to achieve actual returns similar to the target return shown herein. The target return is the manager’s goal based on various
manager assumptions, calculations of available data, past and current market conditions, and available investment opportunities, each of which are subject to
change. Because of the inherent limitations of the target return, potential investors should not rely on it when making a decision on whether or not to invest in
this Fund.
Risks and Disclaimers (cont’d)
※ This presentation is written with investment risks involving the parent fund taken into account.
※ Risks are not limited to the risks listed in this presentation. There can be various types of unexpected risks. 48
Risk of Concentrated
Investment in
Equities
The Fund primarily invests in equities and equity related securities and thus changes in stock prices may adversely affect the value of the Fund. A fall in prices
of the equities held by the Fund may result in a decline in the value of the Fund. If the Fund’s investment portfolio falls in value, investors’ investment in the
Fund may suffer losses.
Risk of Concentrated
Investment in
Selective Sectors
The Fund may selectively invest in stocks in a limited number of sectors while remaining in the accordance with applicable statutes. The lack of diversification
may increase the impact that a small number of stocks or sectors may have on the Fund and the volatility of the Fund, compared to the market or other same
type of funds in general.
Risk of Lack of
Liquidity
Since small- to mid-cap stocks, liquidity of which is generally limited, may be included in the portfolio, a large redemption of shares may Increase the volatility
in the Fund’s net asset value per share..
Market Risks
The Fund primarily invests in equities and thus is exposed to risks of changes in security prices and macro-economic indicators. In addition, the value of the
Fund’s assets may radically change, depending on the condition of issuers of stocks held by the fund, e.g., the status of their sales, finances, and credit.
Credit Risks
The value of the Fund’s assets may radically change when the condition of counterparties of transactions or issuers of stocks held by the fund, e.g., the status
of their sales, finances, and credit, deteriorates and subsequently, it is increasingly likely that credit ratings of the counterparties or the issuers may be
downgraded or they may default on their debt.
Risks of Taxation
Tax authorities divide gains/losses from investments into two categories: gains/losses generated from taxable assets and gains/losses generated from non-
taxable assets. Non-taxable gains/losses imply that the tax will not be imposed on gains but, at the same time, losses will not be recognized. As such, even if
the outcome of investments as a whole records a loss, the tax may be imposed, if there are gains derived from taxable assets alongside gains obtained from
non-taxable assets.
* Examples of Taxable Income: Dividends on stocks, profits from overseas investments, gains from foreign exchange, and yields and capital gains from bonds
* Examples of Non-Taxable Income: Capital gains/losses from buying/selling stocks listed in the South Korea stock market.
Risks Associated with
Redemption
Redemption of the Fund entails risks associated with the gap between the selected redemption date and the actual date of redemption, during which the
value of the Fund’s assets is subject to change. In addition, a redemption fee may be incurred upon redemption, depending on the period the Fund has been
held, and the redemption fee belongs to the Fund.
25F, 70, Yeoui-daero, Yeongdeungpo-gu,
07325 Seoul, South Korea
www.kbam.co.kr/ib/kbstarfunds
82-2-2167 – 8200
ThankYou.

KB Star Funds - Presentation Material (201606)

  • 1.
    KB VALUE FOCUSKOREA EQUITY FUND June, 2016 Please note that marketing materials without an approval code granted from the Compliance Division of KB Asset Management are not official materials authorized under our internal procedure. This marketing material is for general information purposes only and subject to change. Investors should be aware that this presentation does not purport to be a complete explanation of risks and other risks may also be relevant from time to time. In the future the Fund may be exposed to risks that are currently difficult to predict. Risks that are not described in it are considered as immaterial at the moment, but they may become substantial later on and adversely affect the fund. KB Asset Management does not guarantee investment decisions and investment outcomes based on the information of this marketing material. Contact Information: Phone : 82-2-2167-8747 E-mail : kbgm@kbfg.com Approval Code Granted from the Compliance Division of KB Asset Management: 2015_336 FOR INTERNAL USE ONLY
  • 2.
    Disclaimers ※ This documentis for illustrative purposes only and does not represent any actual investment performance. Prior to investing, investors must read the Fund’s prospectus in full to make an informed investment decision. ※ An investment in the Fund involves investment risks, including the possible loss of the principal amount invested. KB Asset Management and any of related companies do not and are not obligated to guarantee principal and/or investment returns shown in this presentation. In addition, the Fund may pay out dividends based on the Fund’s performance and gains or losses on investments may be incurred. Such gains and losses are imputed to investors. ※ Investors should be aware that it does not purport to be a complete explanation of risks and other risks may also be relevant from time to time. In the future the Fund may be exposed to risks that are currently difficult to predict. Risks that are not described in it are considered as immaterial at the moment, but they may become substantial later on and adversely affect the fund. ※ The value of the Fund’s investments is subject to change due to various factors, e.g., geopolitical landscape, unrest in the financial market, changes in interest rates, currency risks, and credit crunch. The performance quoted here and is past performance and is not a guarantee of future results. In addition, there is no guarantee that any forecasts or opinions will be realized. ※ The returns illustrated in this presentation indicate returns before taxes. In addition, investors in the Fund may be subject to a risk of double-taxation. Depending on market conditions after the Fund is set up, transaction costs that have not been specified in this document may be incurred additionally.
  • 3.
  • 4.
    Key Figures- Asof 2016 1Q KB Financial Group - Total Assets: USD $405.44 billion - Client Base: 30 Million - Market Cap: USD $10.79 billion; Listed on KOSPI and New York Stock Exchange (105560 KS Equity, KB US Equity) Global Network TheleadingFinancialGroup in Korea - KB Financial Group, with commercial banking being the core business, provides comprehensive financial services encompassing asset management, securities, life insurance, capital, venture investment, and real estate * Legal-affiliate : Hwang-Mok Park, KIM&CHANG, SHIN&KIM * Accounting-affiliate: Samil PriceWaterhouseCooprs 4 Business Network
  • 5.
    Korea’s LeadingAssetManagementCompany KB AssetManagement - Incorporation date: April 28th, 1988 (29 years of history) - AUM: USD $46.09 billion (As of June 30th, 2016) • The 3rd largest AMC in the market (MS: 8.26%) * Including discretionary accounts, the 4th largest AMC AUM by Asset Class (Billion, USD, as of June 30th, 2016) Change in Fund M/S driven by excellent performance Source: Morningstar, as of June 30th, 2016Source: Korea Financial Investment Association The performance quoted is past performance and is not a guarantee of future results. All figures are in USD terms , net of fees, and gross of tax. 5 Category Name Fund Size million USD Morningstar Category % Rank 2016 YTD* 2015 2014 2013 2012 2011 2010 Korea OE Korea Large- Cap Equity KB Value Focus Feeder Equity A $ 1350.35 50 44 9 4 10 2 1 Korea OE Korea Cautious Allocation KB Retirement Pens Div 40 Fdr Bd Bal C $ 1589.53 24 40 1 5 1 2 1 Equity Balanced Fixed Income FoF MMF Derivatives Real Estate Special Asset Segregated Account Total 9.05 4.79 16.44 0.27 8.15 1.23 1.35 4.74 0.08 46.09 Source: Korea Financial Investment Association
  • 6.
    Thetop AMC inKorea’sfast-growingcorporate pensionfundmarket KB Asset Management KBAM M K.V S.S S.Y Others Total December 31st , 2014 11,130 10,380 11,831 7,730 4,808 14,394 60,273 December 31th ,2015 (Market Share) 20,675 (24%) 15,585 (18%) 8,973 (10%) 9,618 (11%) 5,901 (7%) 26,902 (31%) 87,653 (100%) Growth rate 86% 50% -24% 24% 23% 87% 45% - Market Share: 24% (Largest MS) as of 2015Q4 - Growth Rate: 86% A firm grip of globalbusinessbasedon a long-term globalpartnership Market Leader in the Korean corporate pension fund market Partner Global Lombard Oider US Palisade Capital Management, L.L.C. Europe Blackfriars Asset Management Ltd / Pioneer Investment Management Limited Japan DLIBJ Asset Management Co.,Ltd China JF Asset Management Ltd / GAM Hong Kong Ltd / Hamon Investment Management Ltd ASEAN Vietnam Fullerton Fund Management Company Ltd Russia HSBC Global Asset management(UK) Ltd Brazil BNY Mellon ARX Investmentos Ltda India JF Asset Management Ltd MENA EFG-Hermes UAE Ltd Source: Korea Financial Investment Association (unit: KRW 100mil) 6
  • 7.
    KB Asset Management Integrityas wellas expertiseis valuedwhenchoosingour investmentprofessionals 7 As of March 31st, 2016 Total Number of Employees : 198 As of June 30th, 2016 Operations Infra. 1 Compliance Div. Infrastructure Div. Retail Marketing 2 Product Strategy KB Synergy Institution 3 Global Marketing CM Strategy IT Global Investment 1 Value Investment 1 Active Management 2 26 Value Investment 2 Strategic Planning Fixed Income 3 Fixed Income 4 Trading Fixed Income 2 Domestic Passive Investment 3 ETF Strategy Solution Absolute Return Active Management 1 Research Investment Strategy Risk Management Private Equity & Credit Div. Corp. Administration Div. 4 Real Estate Management 29 Committee of Performance Evaluation 20 Infra. 2 15 Retail Marketing Div. Institution 2 Product Strategy Div. Global Investment 2 Institution 1 Retail Marketing 1 Financial Management Global Infrastructure Fixed Income Management Div. NPL Management CM Strategy Div. 3 Fixed Income 1 216 7 Audit Div. ETFs & Multi-Solution Div. Risk Management Div. 11 10 Global Investment Div. Corporate Investment Human Resources Acquisition Financing Communication Div. 15 6 Real Estate Investment Equity Investment Div. ETF Management Institutional Marketing Div. Council of Sanctions Council of Fund evaluation Council of Risk management Council of Products Real Estate Div. Labor-Management Council Council of Prop. Management Energy & Resources Retirement Pension KBFG (100%) Board Of Director CEO (1) Audit Committee Committee of Recommendation for Outside director Passive Investment Div. 10 Global Passive Investment Standing Auditor (1) (Member of Audit Committee) Compliance Officer (1) Compliance Global Fixed Income 17 5 3 Domestic Passive Investment 1 Domestic Passive Investment 2
  • 8.
    KB Asset Management EquityInvestmentProfessionals–As of June 30th , 2016 There can be no assurance that the professionals currently employed by KB Asset Management will continue to be employed by KB Asset Management. 8 Name Job Title Division/ Team KB Asset Management (Unit: Month) Years of Experience Including in KBAM (Unit: Month) Months of Experience (Total) Portfolio Mgmt. Research Months of Experience (Total) Portfolio Mgmt. Research Others Woongpil Choi CIO Equity Division 80 80 0 209 198 0 11 Younghyun Jung Portfolio Manager, Team Head Equity Division/ Value Team 1 80 66 14 102 66 36 0 Junbum Park Portfolio Manager Equity Division/ Value Team 1 52 11 41 64 11 53 0 Jongeun Song Research Analyst Equity Division/ Value Team 1 30 0 30 54 0 54 0 Younggu Nam Portfolio Manager, Team Head Equity Division/ Value Team 2 64 29 35 77 42 35 0 Soohyung Kim Portfolio Manager Equity Division/ Value Team 2 28 11 17 61 11 50 0 Insang Yoon Research Analyst Equity Division/ Value Team 2 10 0 10 10 10 0 Hyosub Sim Portfolio Manager, Team Head Equity Division/ Active Team 1 123 89 34 210 89 121 0 Sungho Yang Portfolio Manager Equity Division/ Active Team 1 124 84 40 186 84 102 0 Jihyun Jo Portfolio Manager Equity Division/ Active Team 1 70 34 36 120 34 86 0 Kyungjin Kim Portfolio Manager, Team Head Equity Division/ Active Team 2 40 15 25 186 75 111 0 Taewhan Yoon Portfolio Manager Equity Division/ Active Team 2 10 10 0 70 70 0 0 Heeeun Choi Portfolio Manager Equity Division/ Active Team 2 11 11 0 58 58 0 0 Byunghoon Jung Portfolio Manager, Team Head Equity Division/ AR Team 14 12 2 65 12 53 0 Jungmin Ahn Portfolio Manager Equity Division/ AR Team 5 5 0 99 99 0 0 Eunpyo Kang Portfolio Manager Equity Division/ AR Team 33 33 0 174 174 0 0 Kyungmin Kim Analyst, Team Head Equity Division/ Research Team 64 0 64 107 24 83 0 Jiyong Lee Analyst Equity Division/ Research Team 11 0 11 42 0 42 0 Kitae Song Analyst Equity Division/ Research Team 11 0 11 43 0 43 0 Daegeun Kim Analyst Equity Division/ Research Team 1 0 1 27 0 27 0 Eunyoung Nam Analyst Equity Division/ Research Team 11 0 11 40 0 40 0 Jaekyung Kim Analyst Equity Division/ Research Team 15 0 15 40 0 40 0
  • 9.
  • 10.
    Investment Philosophy  Theaim is to achieve excess returns based on thorough fundamental research & concentrated investment.  Research capability is much stressed. Sector managers are in charge of investment universe and model portfolio. They conduct their own company analyses and invest with conviction. The focus is on stock selection based on bottom-up approach.  Portfolios are managed based on a long-term perspective rather than a short-term momentum.  Managers decide to invest preemptively based on research focusing on a long-term perspective.  Market and credit risks are constantly monitored so that upcoming and subsequent changes are identified.  Changes are met with appropriate responses while the effect on the stock holdings is examined. 10 Active Management Long-term Approach Thorough Risk Management
  • 11.
    Investment Process  StockReview • Valuation • Growth • Company visit (1,000 times per year) • Non-Deal Roadshow • Interview with Management, etc.  Basic Criteria • Market cap: KRW 100 billion and above • Financial Requirements  Stock Selection • Strong BM, Cash flow, Franchise value and structural growth • Margin of safety, 30%  Determined by the Research Team  Reviewed on a monthly basis  Final Call: CIO 02 Actual Portfolio 01 Universe  Team Management  Portfolio Management • Monitoring valuation, earnings forecast, price attractiveness, etc. • Analyzing performance attribution • Responding to market and credit risk  Determined by the Management Team  Final Call: Portfolio Management Team ValueStyle 11 * Criteria to be included in the Investment Universe: ① The market cap of a stock should exceed 100 billion. The Investment Universe is reviewed and updated at least quarterly; stocks with a market cap less than 100 billion KRW can be included depending on market condition or company fundamentals, provided that approval of CIO is obtained. ② The trading volume within last 3 months should exceed 10 billion KRW. ③ Companies that have not posted net losses in the last 3 consecutive years ④ Companies that have not been included in the investment warnings list of Korea Exchange in the last 2 years.
  • 12.
    Investment Process  StockReview • Valuation • Growth • Company visit (1,000 times per year) • Non-Deal Roadshow • Interview with Management, etc.  Basic Criteria • Market cap: KRW 300 billion and above • Financial Requirements  Stock Selection • Focused analysis on companies by conducting company visits and assessing financial and managerial risks in a qualitative and quantitative manner  Determined by the Research Team  Reviewed on a monthly basis  Final Call: CIO 02 Model Portfolio 03 Actual Portfolio 01 Universe  Determined by the Research Team  Reviewed on a weekly basis or ad hoc  Final Call: CIO  Team Management  MP Replication Ratio, 60% • Team discretion, 40%  Portfolio Management • Monitoring valuation, earnings forecast, price attractiveness, etc. • Analyzing performance attribution • Responding to market and credit risk  Incentives for portfolio managers are determined based on AP’s performance compared to the MP  Determined by the Management Team  Final Call: Portfolio Management Team  Sector Weight • Market neutral  Stock Selection within Each Sector • Top picks by each sector manager  Reaching Agreement • Communication or debate between portfolio and sector managers  Incentives for research managers are determined based on MP’s performance compared to the market Growth Style * Criteria to be included in the Investment Universe: ① The market cap of a stock should exceed 300 billion. The Investment Universe is reviewed and updated at least quarterly; stocks with a market cap less than 300 billion KRW can be included depending on market condition or company fundamentals, provided that approval of CIO is obtained. ② The trading volume within last 3 months should exceed 10 billion KRW. ③ Companies that have not posted net losses in the last 3 consecutive years ④ Companies that have not been included in the investment warnings list of Korea Exchange in the last 2 years. 12
  • 13.
  • 14.
    One of theHighest Performing Korea-domiciled Funds KB ValueFocus: the 2nd LargestKorea EquityFund - Highest-performing fund among top 10 best selling Korea equity funds - KB Value Focus has never posted negative annual returns - The fund’s rate of return since inception is the 6th highest among 301 active funds, meaning the fund ranks within top 2% * As of June 30th, 2016 * No. of Korea-domiciled active Korea equity funds: 580 Source: Morning star The performance quoted is past performance and is not a guarantee of future results. All figures are net of fees, and gross of tax. Return and Percentile Rank figures are calculated in KRW. No representation is made that any portfolio will or is likely to achieve profits or losses similar to those shown. 14 Name Fund Size Bil. USD ( June 30th , 2016) Return (%) Percentile Rank (%) 2016 YTD (June, 30th ) 2015 2014 2013 2012 2011 2010 2016 YTD (June, 30th ) 2015 2014 2013 2012 2011 2010 S V $ 2.64 0.08 12.07 6.37 19.61 16.63 -8.01 19.83 26 19 13 2 5 29 70 KB Value Focus Feeder Equity A $ 1.35 -1.83 4.33 4.53 9.87 12.17 3.75 46.68 45 53 16 9 15 4 1 M K $ 1.23 -9.26 21.96 14.84 97 5 4 KV 10 $ 1.18 -4.40 0.27 0.97 19.40 20.79 1.33 15.73 78 72 21 2 2 9 90 K N $ 0.99 -1.33 15.53 -2.25 1.14 7.78 -9.21 24.37 39 12 36 55 45 35 33 K M $ 0.90 -1.39 2.40 14.96 11.12 34.23 40 61 4 7 1 K S $ 0.83 -7.88 -3.40 -15.06 -5.55 12.96 -16.25 30.34 94 90 97 95 11 91 7 S M $ 0.69 -2.40 11.14 -2.35 13.67 15.17 -10.21 18.89 54 22 36 6 6 44 77 S S $ 0.67 -7.37 19.28 8.11 5.32 19.92 12.74 25.26 93 9 10 20 3 1 26 K S $ 0.61 -8.10 -4.76 -15.45 -6.03 12.39 -16.73 29.73 95 94 98 97 14 94 10 ※ Percentile Rank calculated based on Korea-domiciled active equity funds
  • 15.
    Identical Portfolio ManagerSince Inception Thecurrent CIO of KBAM has beenmanagingthe fundsince2009  1992-1999 Applied Statistics Department, College of Business and Economics, Yonsei University  1998-1999 LNG Carrier Department, Hyundai Merchant Marine  1999-2002 Sector Manager of Equity Management Team, Dongwon Securities  2002-2004 Sector Manager of Investment Adviser Department, Dongwon Investment Management  2004-2006 Sector Manager, Korea Investment Management  2006-2009 Asset Management Department, Korea Investment Value Asset Management  2009-Present CIO/Head of Equity Management Division, KB Asset Management Currently manages KB Value Focus, KB Pension Dividend 40, and KB Small/Mid Cap Equity Fund CIO,WoongpilChoi Educational/Professional Background 15
  • 16.
    Investment Professionals involvedwith KB Value Focus Portfolio Managers  2008.02 Business major, Seoul National University  2008-2009 Asset Management Department, Korea Investment Value Asset Management  2009-Present Head of Value Investment Team 2, KB Asset Management YonghyunJung, HeadofValueInv.Team 1 Educational/Professional Background 16  2010.02 Computer Science and Engineering major, Seoul National University  2010-2011 Asset Management Department, Korea Investment Value Asset Management  2011-Present Head of Value Investment Team 2, KB Asset Management Educational/Professional Background YoungguNam, HeadofValueInv.Team 2
  • 17.
    Primary Investments Low PER Stockswith a PER Lower than the company’s earnings value Low PBR Stocks with a PBR Lower than the company’s assets value High Dividend New Value Stocks Companies with stable growth of earnings Based on market dominance 17 KB ValueFocus Fundprimarilyinvestsinequitieswith… ≥ Dividend Yields Market Interest Rates Shown for illustrative purposes only. They do not constitute investment recommendations.
  • 18.
    18 Focus & Principleof KB Value Focus Undervaluation is not the only focus Earnings value is as much important While maintaining our principle of Buy & Hold We engage in active trading upon significant price changes Turnover Ratio: 2013: 56.03% 2014: 62.38% 2015: 70.53% Rather than blindly following the benchmark index We primarily invest in stocks with upside potential We do not invest in large cap companies just to follow the benchmark index  Robust Business Model  Expected Structural Growth  Sustainability of Earnings Thefund’sfocus & principle
  • 19.
    Selection of Stocks Re-Rating Ifstocks that generate stable profits based on their franchise value or intrinsic competitive advantage are undervalued compared to the market valuation, the value of the stocks will eventually converge to the intrinsic value Market Share Predictability of Earnings Sustainability of Earnings Premium If companies that are identified to have expected structural growth and paradigm shifts are undervalued relative to their growth potential, their structurally stable growth potential will eventually be recognized by consensus and the stocks will be valued higher than the market valuation Probability of Market Diversification Life Cycle Growth Potential of Flagship Products Focused on stock selection, not on forecasting market outlook - Stocks that have significantly higher intrinsic value - Companies posting stable growth of earnings - Stocks that match these conditions are actively purchased when the prices of the stocks tumble or the stocks are neglected 19
  • 20.
    KB Value Focushas consistently outperformed the KOSPI and protected the principal For the last 6 years the fund outperformed its BM without negative annual returns (%) The winning rate of KB Value Focus is 100%; the Fund has never recorded negative annual returns since inception in 2009 Source: Morningstar, Base Currency The performance quoted is past performance and is not a guarantee of future results. All figures are net of fees, and gross of tax. Returns are calculated in KRW. No representation is made that any portfolio will or is likely to achieve profits or losses similar to those shown. 20 (%)
  • 21.
    Time Period: 2011-07-01- 2016-06-30 TotalReturn% Std Dev % 0.00 2.00 4.00 6.00 8.00 10.00 12.00-4.00 -2.00 0.00 2.00 4.00 6.00 8.00 Investment Name KB Value Focus A Korea OE Korea Large-Cap KRX KOSPI Korea PR KRW 2010 2011 2012 2013 2014 2015 2016-20% 0% 20% 40% 60% 80% 100% 120% 140% 160% 180% Investment Name Return KB Value Focus A 127.49% Korea OE Korea Large-Cap 26.08% KRX KOSPI Korea PR KRW25.3% Track Record vs Benchmark Performance Since Inception Exceptional Risk Rewards (5YR) Source: Morningstar, Base Currency The performance quoted is past performance and is not a guarantee of future results. All figures are net of fees, and gross of tax. Returns are calculated in KRW. No representation is made that any portfolio will or is likely to achieve profits or losses similar to those shown. 21 127.49% 25.3% 26.8% KB Value Focus has outperformed the KOSPI by 108%
  • 22.
    Time Period: 2011-07-01- 2016-06-30 TotalReturn% Std Dev % 0.00 2.00 4.00 6.00 8.00 10.00 12.00-4.00 -2.00 0.00 2.00 4.00 6.00 8.00 Investment Name KB Value Focus A Korea OE Korea Large-Cap KRX KOSPI Korea PR KRW 2010 2011 2012 2013 2014 2015 2016-20% 0% 20% 40% 60% 80% 100% 120% 140% 160% 180% Investment Name Return KB Value Focus A 127.49% Korea OE Korea Large-Cap 26.08% KRX KOSPI Korea PR KRW25.3% Track Record vs Benchmark Performance Since Inception Exceptional Risk Rewards (5YR) Source: Morningstar, Base Currency The performance quoted is past performance and is not a guarantee of future results. All figures are net of fees, and gross of tax. Returns are calculated in KRW. No representation is made that any portfolio will or is likely to achieve profits or losses similar to those shown. 22 127.49% 25.3% 26.8% KB Value Focus has outperformed the KOSPI by 108%
  • 23.
    KOSPI EAA OE KoreaEquity Korea Large-Cap Source: Morningstar The performance quoted is past performance and is not a guarantee of future results. No representation is made that any portfolio will or is likely to achieve profits or losses similar to those shown. All performance figures are in USD terms. Figures related to KB Value Focus are net of fees, and gross of tax. 23 The fund’s investors have benefitted from the principle The charts below show distribution of returns for each subscription date from November 30th, 2009 to June 30th, 2016 - The red parts indicate negative returns KB Value Focus ..... Subscription date Evaluation date Nov. 30, 2009 Dec. 31, 2009 Jan. 29, 2010 Jun. 30, 2016 ..... Dec. 31, 2009 Jan. 29, 2010 Jun. 30, 2016
  • 24.
    Distribution of returnsshow that KB Value Focus has successfully preserved investors’ capital Upon inspection of downside, KB Value Focus shows superior protection of principal: Other funds recorded a loss of 43% on average while KB Value Focus fund recorded average losses of only 16% (From Nov. 30th 2009 to June 30th 2016) KB Value Focus KOSPI EAA OE Korea Equity Korea Large-Cap 140%~160% 0.37% 120%~140% 1.33% 100%~120% 3.67% 80%~100% 5.34% 60%~80% 5.86% 0.03% 40%~60% 12.35% 1.94% 1.33% 2.07% 20%~40% 23.36% 15.15% 10.74% 14.85% 0%~20% 32.04% 42.99% 40.49% 42.75% -20%~0% 15.43% 39.01% 44.44% 38.89% -40%~-20% 0.15% 0.90% 2.99% 1.42% + 84% 60% 53% 60% - 16% 40% 47% 40% Average 30.42% 5.89% 2.78% 5.61% Max. 167.50% 52.92% 58.14% 60.34% Min. -22.54% -26.57% -30.64% -27.89% Source: Morningstar The performance quoted is past performance and is not a guarantee of future results. No representation is made that any portfolio will or is likely to achieve profits or losses similar to those shown. All performance figures are in USD terms. Figures related to KB Value Focus are net of fees, and gross of tax. 24 The fund’s investors have benefitted from the principle (cont’d) 수정중
  • 25.
    Std Dev % 0.002.00 4.00 6.00 8.00 10.000.00 1.00 2.00 3.00 4.00 5.00 6.00 Investment Name KB Value Focus A K V 10 K N Time Period: 2013-07-01 - 2016-06-30 Crosshairs: KRX KOSPI Korea PR KRW 2010 2011 2012 2013 2014 2015 2016-20% 0% 20% 40% 60% 80% 100% 120% 140% 160% 180% Investment Name Value KB Value Focus A 127.49 KV 10 71.74 K N 46.53 Track Record vs competition Performance Since Inception Risk-Rewards (3YR) 25 127.49% 46.53% 71.74% KB Value Focus has outperformed its competitors TotalReturn% Source: Morningstar, Base Currency The performance quoted is past performance and is not a guarantee of future results. All figures are net of fees, and gross of tax. Returns are calculated in KRW. No representation is made that any portfolio will or is likely to achieve profits or losses similar to those shown.
  • 26.
    K V 10K N Source: Morningstar The performance quoted is past performance and is not a guarantee of future results. No representation is made that any portfolio will or is likely to achieve profits or losses similar to those shown. All performance figures are in USD terms. Figures related to KB Value Focus are net of fees, and gross of tax. 26 KB Value Focus has outperformed its competitors (cont’d) The charts below show distribution of returns for each subscription date from November 30th, 2009 to June 30th, 2016 - The red parts indicate negative returns KB Value Focus ..... Subscription date Evaluation date Nov. 30, 2009 Dec. 31, 2009 Jan. 29, 2010 Jun. 30, 2016 ..... Dec. 31, 2009 Jan. 29, 2010 Jun. 30, 2016
  • 27.
    Distribution of returnsshow that KB Value Focus has successfully preserved investors’ capital Upon inspection of downside, KB Value Focus shows superior protection of principal: KB Value Focus fund recorded average losses of only 16% while competitor funds showed losses of 20% and 25% (From Nov. 30th 2009 to Jun. 30th 2016) KB Value Focus K V 10 K N 140%~160% 0.37% 0.00% 0.00% 120%~140% 1.33% 0.06% 0.00% 100%~120% 3.67% 1.48% 0.00% 80%~100% 5.34% 5.46% 0.00% 60%~80% 5.86% 11.27% 0.15% 40%~60% 12.35% 18.02% 7.16% 20%~40% 23.36% 18.98% 18.70% 0%~20% 32.04% 24.57% 49.29% -20%~0% 15.43% 19.60% 24.35% -40%~-20% 0.15% 0.56% 0.34% + 84% 80% 75% - 16% 20% 25% Average 29.67% 26.55% 6.63% Max. 156.61% 115.30% 83.08% Min. -14.29% -25.32% -26.14% Source: Morningstar The performance quoted is past performance and is not a guarantee of future results. No representation is made that any portfolio will or is likely to achieve profits or losses similar to those shown. All performance figures are in USD terms. Figures related to KB Value Focus are net of fees, and gross of tax. 27 KB Value Focus has outperformed its competitors (cont’d)
  • 28.
    28 USD 1.4 Billion USD2.4 Billion Source: Morning Star The performance quoted is past performance and is not a guarantee of future results. No representation is made that any portfolio will or is likely to achieve profits or losses similar to those shown. All performance figures are in USD terms. Figures related to KB Value Focus are net of fees, and gross of tax. Performance from September 2013 to May 2015 AUM Trend Since Inception Outperforming the BM even through large redemptions
  • 29.
    Investment Process ofKB Value Focus InvestmentProcess 29 Quantitative Analysis • PER & PBR : 30 % discounted compared to the market • Dividend Yield: Higher than 3% • Other factors: Free Cash Flow, EBITDA, etc. Qualitative Analysis • Business Model Analysis: Market Share, Earnings Visibility, Sustainability of Earnings • Structural Growth: Market diversification and/or expansion, Life cycle • Paradigm Shift: Leader and or pioneer • Companies that can retain earnings are preferred over capital-intensive industry Stock Evaluation • Premium: Stocks that have good reasons to be traded at a higher valuation than the market • Re-rating: Stocks that are undervalued compared to intrinsic values • Discount: Stocks that have good reasons to be cheap Actual Portfolio • Invest mainly in premium and re-rating stocks, occasionally picking discount stocks, if necessary • Decide sector weights, preferring sectors with sustainable and stable earnings • Number of stocks in the actual portfolio ranges from 80 to 100 • Monitor market and credit risk consistently
  • 30.
    What KB ValueFocus looks into In summary,KB ValueFocus Korea Equity Fund… 02 focuses on stock selection rather than indices or economic outlook •The fund invests in stocks that are undervalued relative to their intrinsic values, including values of an enterprise, assets, and earnings •It also invests in stocks that are expected to see a stable growth in earnings while being less affected by external changes such as economic fluctuations •Such is a new type of value investment strategy, which has evolved from a traditional value strategy 01 invests in stocksthat are undervalued and expected to see stablegrowth •The fund does not forecast the market or make sector bets •Focuses on stock selection whereas portfolio composition and sector weights are results of stock selection. •We believe that our strategy is a necessary evolution from a traditional value investment strategy 30
  • 31.
    KOSPI 82.79% KOSDAQ 17.21% Portfolio of KBValue Focus Portfolio (AsofApril30th ,2016) Weight by KOSPI & KOSDAQ Sector Weight (%) Weight by Market Weight Top 10 Holdings (Weight, %) Source: KB Asset Management Shown for illustrative purposes only. The inclusion of the securities mentioned above is not to be interpreted as recommendations to buy or sell and is subject to change without notice. 31 Weight(%) KOSPI KOSDAQ Large Cap 32.00 0.91 Middle Cap 38.11 8.43 Small Cap 12.68 7.88 Total 82.79 17.21 Stock GICS Industry Groups Market (%) KB Value Focus (%) Difference (%) Com2uS Corp Software & Services 0.11 6.85 6.74 SK Telecom Co Ltd Telecommunication Services 1.09 4.50 3.40 Korea Electric Power Corp Utilities 2.61 3.91 1.30 SK Holdings Energy 1.04 3.64 2.60 Fila Korea Ltd Consumer Durables & Apparel 0.08 3.42 3.34 NAVER Corp Software & Services 1.47 3.19 1.73 Hansol Chemical Co Ltd Materials 0.05 3.03 2.97 Dongwon Industries Food, Beverage & Tobacco 0.06 2.80 2.73 Samsung Electronics Co Ltd Technology hardware & Equipment 11.88 2.55 -9.33 KB Capital Co Ltd Diversified Financials 0.03 2.42 2.38 GICS Sector Market (%) KB Value Focus (%) Difference (%) Information Technology 23.39 21.38 -2.01 Industrials 15.01 17.46 2.45 Consumer Discretionary 19.71 14.51 -5.19 Financials 12.41 14.02 1.61 Materials 10.21 11.65 1.45 Consumer Staples 6.21 7.99 1.78 Telecommunication Services 2.44 4.69 2.25 Utilities 4.29 4.08 -0.21 Others 0.26 2.51 2.25 Health Care 3.51 1.46 -2.05 Energy 2.56 0.24 -2.32
  • 32.
    Summary of KBValue Focus Summary 32 KB Value Focus Portfolio Manager Woong-pil Choi ISIN / Bloomberg Ticker KR5223174917 / 3174917 KS Equity Inception date November 9, 2009 NAV (USD) * As of June 30th, 2016 $ 1,437,344,897 BM KOSPI No. of Holdings 74 Beta (1yr/3yr/since inception) 0.93 / 0.70 / 0.68 Sharpe(1yr/3yr/since inception) -1.03 / 0.32 / 0.93 Tracking Error (1yr/3yr/since inception, %) 8.34 / 8.26 / 9.19 Turnover Ratio (1yr, %) 58.75 Portfolio PER 11.00 Portfolio PBR 1.25 Source: KB Star M Data as of June 30th, 2016 (Portfolio Holdings, PER, PBR as of April 30th, 2016)
  • 33.
    33 KB Star Funds– KB Value Focus Korea Equity Investment Management Fee Sales Charge / Redemption Charge Minimum initial investment (USD/EUR) A ACC USD/EUR 2.00% 5.00% 1,000 I ACC USD/EUR 0.75% N/A 5,000 I2 ACC USD/EUR 0.50% N/A 5,000,000 • Domicile: Luxembourg • Legal Structure: UCITS SICAV • Launch date: June 20, 2016 • Service Providers  Depositary Bank, Administratior, Paying Agent, Registrar, and Transfer Agent: HSBC Bank Plc, Luxembourg Branch  Management Company: Carne Global Fund Managers (Luxembourg) S.A.  Legal Advisers: Elvinger, Hoss & Prussen  Auditors: Deloitte Audit S.à r.l. • Classes of shares available for subscription
  • 34.
  • 35.
    Investment System Star F -An internally developed trading system - It provides pre-transaction compliance function KB MPuStar - An internally developed system designed to maximize efficiency in equity management process - KB MPStar provides a research function and enables managers to determine a portfolio and simulate returns - It is also used as a tool to evaluate portfolio managers and sector managers Otherinformationsystems - Bloomberg, IBES data, Data Stream, Brokerage terminals, Market Point, Infomax, and Reuter 35 Star M - An internally developed asset management system - It is widely utilized by equities, fixed income and marketing professionals
  • 36.
    Risk Management Portfolio ManagersRisk Management Division Market Risk  Monitor macroeconomic factors  Monitor business environment of each sector  Model Portfolio Replication Ratio: 60% - Discretion of managers is limited to 40%  Equity Turnover Ratio: Within 300% a year - Transaction costs caused by frequent transactions are reduced Credit Risk  Review and analyze fundamentals and valuations of individual stocks  Review on a weekly basis and ad hoc  Investment Universe Management: Allow managers to invest only in securities which are fully analyzed Liquidity Risk  Market Capitalization: Growth: KRW 300 billion and above/Value: KRW 100 billion and above  Managers are allowed to invest primarily in large cap securities so that liquidity risk is prevented  Stocks with market cap under KRW 300 billion (Growth) or KRW 100 billion (Value) can only be included in the investment universe after approval of CIO is obtained Periodic Review  Daily and weekly monitoring  Upon detection, violations are reported to CIO and CRO and a request for corrective action follows 36
  • 37.
    Risk Management Risk ManagementSystemFlow • Risk Management Committee – Establishes risk management strategies and procedures – Annually renews risk tolerance reflecting market condition • Product Committee – Determines best risk management methods for each new investment product • Inspecting and Evaluating Risk Factors – • Performance Analysis – Attributes for performance are analyzed for each investment of a portfolio • Periodic Reports and Reporting – Reports on factors monitored are produced on a daily and weekly basis – The Risk Management Committee is debriefed on reports – Major issues are handled in the Risk Management Committee Establish Risk Management Policy Measure and Evaluate Risks of Each Portfolio Report Present Risks and Devise Follow-ups Risk factors are quantitatively measured reflecting characteristics of portfolios and relevant market risks (e.g. interest rates, duration, and credit ratings) 37
  • 38.
    Compliance InternalControl for BusinessCompliance 38 •Prohibition on unfair transaction • Executives and employees’ trading of financial investment products • Reporting of provision/receipt of benefit • External activities other than duty • Compliance training (regular/irregular basis) Code of Conduct • Compliance with laws and regulations • Reporting obligation • Prioritization of clients interests • Procedures of providing confidential information Conflict of Interest • A compliance pledge of the company is signed and submitted to the compliance officer • A system to report violation Measures on Illegal and Unfair Practices • An anti-money laundering system that comprehensively covers the anti-money laundering law Establishment of Anti-Money Laundering System • Development of a new product • Sales activities of the company • Principle of handling trading orders • Selection criteria for brokerage Compliance Matters for Investment Trust
  • 39.
    Compliance (cont’d) 39 1. Pre-caution •On a daily basis, monitoring results which may constitute a breach are reported to portfolio managers • Soft rule is fixed beforehand (e.g. maximum X% - 1) 2. Prior approval • All trades initiated by a portfolio manager must first go through compliance checking before each order reaches a trader 3. Frequent Examination • Regular and frequent examinations to make sure investment guidelines are observed • Breaches are examined at 12:00 / 15:00/ 17:30 (KST) on a daily basis Procedures of Pre-Check InternalControl for BusinessCompliance
  • 40.
    Compliance (cont’d) InternalControl forInvestment Compliance 40 In the event of a breach of a restriction, portfolio managers must rectify within 3 business days • The measure standard − Primary: Rectification within 3 business days is required. Identification of reasons & submission of plans for rectification must be followed − Secondary: If breaches are not rectified over 3 Business days, reasons must be submitted in writing − Tertiary: If breaches are not rectified over 6 Business days, it is reported to the personnel committee • Breaches are rated as grade − Breaches are reflected by 10% in the performance assessment of a portfolio manager • Bi-monthly compliance training for portfolio managers − Bi-monthly compliance training is held − A feedback directly goes to the portfolio manager to offer remedial measures to prevent its reoccurrence Disciplinary Measures on Breaches
  • 41.
    Compliance (cont’d) Electronicsystems areintroducedandbeingoperated so thatefficiencyin internalcontrol is achieved 41 •Definition: Trading system • Definition: Electronic approval system Groupware - EDMS Star M - Middle system •Characteristics: Accessing and regularly examining all business to make sure internal control standards are met • Definition: Business support system •Characteristics: Electronically record and store all communication related to assigned duties • Characteristics: Handling all orders in a fair manner and executing trading in accordance with principle based on fairness Star F - Trading system
  • 42.
  • 43.
    KB Asset Managementproduct line-up Line-upof Funds • Korea Value Focus • Korea Growth Focus • Korea Value & Growth • Korea Small and Mid Cap • Korea Star • Major Groups • Elite 20 • M&A • Foreigners Preferred Asia • China • China Focus • China A-share • India • ASEAN • Vietnam • Japan Blue Chip Selection Global • Multimanager BRICs • Global Dividend Emerging • Euro Convergence • Russia Growth • MENA • Brazil Domestic Equity KB Asset Management strongly emphasizes teamwork and integrity. Active communication and team discussion enable a dynamic portfolio strategy that evolves with new investment ideas. We employ both bottom-up and top-down analyses for all investments. Overseas Equity KB Asset Management covers all major investment areas across the globe and provides investment solutions in both direct and FOF formats. Moreover, KB Asset Management is one of the first domestic investment houses to introduce the “Manager of Managers” investment concept. 43 Fixed Income & MMF KBAM is a major player in the fixed income market with over USD 9.5 billion under management in bond funds and MMFs. We primarily invest in government, agency, and high quality corporate debt. • Korea Star Government Bond • Korea Corporate Bond • Emerging Market Bond Plus
  • 44.
    KB Asset Management Line-upofFunds • Korea index / leveage 1.5, 2.0 index • Korea China Japan index • China H index • Japan index • US S&P500 index • Euro index • Russia index • MKF Commodities index • Gold index • KB Star 5 Major Groups • KB Star KOSDAQ Elite 30 • KB Star Leveraged • KB Star Government Bonds Index Our index strategy covers both Korean and overseas equity markets as well as commodities. ETF KBAM was the first company to launch a bond ETF 44 Real Estate We aim to provide stable returns by investing predominantly in commercial properties and real estate developments as well as major global real estate markets. • Real Estate (Domestic/Overseas) - Korea - China Infrastructure Our main infrastructure funds invest in various sectors including SOC, logistics and shipping, primarily in the form of BTL and BTO. • Infrastructure • Shipping • Logistics Private Equity Our private equity funds invest capital raised by private placement in equities and bonds through a negotiation process or acquisition of managerial control. • Mezzanine
  • 45.
    45 BEST OVERSEAS EQUITYFUND MONEY TODAY “KOREA FUND GRAND PRIZE” KB MENA Fund FUND MANAGER OF THE YEAR SEOUL ECONOMIC DAILY “KOREA BEST SECURITIES AWARDS 2014” KBAM’s Infrastructure Division BEST PENSION FUND HERALD BUSINESS “FUND GRAND PRIZE” KB Pension Dividend 40 FUND MANAGER OF THE YEAR HERALD BUSINESS “FUND GRAND PRIZE” KBAM’s Infrastructure Division BEST PERFORMING FUND KG ZEROIN FUND RATING “KOREA FUND AWARDS” KB Star Japan Index Fund BEST ASSET MANAGEMENT COMPANY ASIA BUSINESS DAILY “ASIA FUND GRAND PRIZE” KB Asset Management BEST OVERSEAS EQUITY INDEX FUND ASIA BUSINESS DAILY “ASIA FUND GRAND PRIZE” KB Star Japan Index Fund 2014BEST OVERSEAS FUND e-DAILY “FINANCIAL INVESTMENT AWARD” KB Asset Management BEST PENSION FUND KOREA ECONOMIC DAILY “KOREA FUND GRAND AWARD” KB Asset Management BEST PENSION FUND ASIA BUSINESS DAILY “ASIA FUND GRAND PRIZE” KB Pension Fund 40 SPECIAL PRIZE FOR BEST PERFORMING FUND KG ZEROIN FUND RATING “KOREA FUND AWARDS” KB Mainland China Leverage Fund EXCELLENCE AWARD FOR BOND BALANCED FUND KG ZEROIN FUND RATING “KOREA FUND AWARDS” KB Pension Fund 40 BEST FUND AWARD KG ZEROIN FUND RATING “KOREA FUND AWARDS” KB Asset Management 2015 Awards Presented in 2015/2014
  • 46.
    46 ASSETMANAGEMENTCOMPANYOFTHEYEAR ASIANINVESTOR“KOREAAWARDS” KBAssetManagement GOLDPRIZEOF“BESTASSETMANAGER” MKBUSINESSNEWS“BESTASSETMANAGER”, CIOWoongpilChoiofKBValueFocusFund BESTASSETMANAGEMENTCOMPANY KOREAECONOMICDAILY “KOREAFUNDGRANDAWARD” DOMESTICEQUITYFUND BESTFUNDAWARD ASIABUSINESSDAILY “ASIAFUNDGRANDPRIZE” DOMESTICEQUITYFUND BESTFUNDAWARD KGZEROINFUNDRATING“KOREAFUNDAWARDS” KBPensionDividend40 2012BESTFUNDAWARD–ACTIVEEQUITYFUND MKBUSINESSNEWS“KOREAFUNDGRANDAWARD” KBValueFocusFund ASSETMANAGEMENTCOMPANYOFTHEYEAR ASIANINVESTOR“KOREAAWARDS” KBAssetManagement BESTASSETMANAGERAWARD MKBUSINESSNEWS“BESTASSETMANAGERAWARD” CIOWoongpilChoiofKBValueFocusFund BESTFUNDAWARD–DOMESTICEQUITYFUND KOREAECONOMICDAILY “KOREAFUNDGRANDAWARD” KBSmall/MidCapEquityFund BESTPENSIONFUND MONEYTODAY“KOREAFUNDGRAND PRIZE“ KBPensionDividend40 2013 Awards Presented in 2013/2012
  • 47.
    Disclaimer 47 Risks and Disclaimers General TheFund is intended for long-term Investors who can accept the significant risks associated with investing in illiquid securities. An investment in the Fund involves various risk factors, including the possibility of partial or total loss of the Fund capital, and prospective Investors should not subscribe unless they can readily bear the consequences of such loss. There can be no assurance that the Fund will achieve its Investment Objective or Portfolio Target Return, or that there will be any return on capital. In particular, potential investors should take into account the fact that the actual return achieved may be more or less in any particular year, and that different returns may be achieved by different Investments, according to their different cost bases, and that different Fund Investor Vehicles may have different returns. Projections The opinions stated in this presentation include some forecasted views. We believe that we are basing our expectations and beliefs on reasonable assumptions within the bounds of what we currently know. However, there is no guarantee that any forecasts or opinions will be realized. Portfolio No representation is being made that any portfolio will or is likely to achieve profits or losses similar to those shown. Portfolio holdings are subject to change at any time without notice . Risks Involving Investment Strategy Opinions, estimates, forecasts, projections and statements of financial market trends that are based on current market conditions constitute our judgment and are subject to change without notice. There can be no guarantee they will be met. Risks Associated with Performance The performance quoted is past performance and is not a guarantee of future results. All figures are in USD terms, net of fees, and gross of tax. The impact of the initial charge can be material on the performance of your investment. Performance figures including the initial charge are available upon request. The Fund is subject to certain market risks. Investment returns and principal value of an investment will fluctuate so that an investor's shares, when redeemed, may be worth more or less than original cost. Current performance may be higher or lower than the performance data shown. For performance current to the most recent month-end, please send an email to the following address: kbgm@kbfg.com Currency Risks Changes in the rates of exchange may affect the value of investments. The Fund can invest in overseas securities which may also generate profits overseas and pay dividends in foreign currencies, which means the fund is exposed to changes in currency rates. Impact of Compensation The Fund takes its charges from the Fund. The impact of Fund charges may be material on the value of any income you receive from your investment. There is potential for future capital erosion if insufficient income is generated by the Fund to cover these charges. Please see the prospectus for additional information on the fees and expenses. Tax Risks Tax treatment will depend on the individual circumstances of clients and may be subject to change in the future. The rate and amount of tax would vary depending on the mix and type of investments made by the Fund. Investors should consult their tax advisers regarding such tax consequences as well as any taxes to which they may be subject in their own jurisdiction. Limitations of Target Returns An investor should not expect to achieve actual returns similar to the target return shown herein. The target return is the manager’s goal based on various manager assumptions, calculations of available data, past and current market conditions, and available investment opportunities, each of which are subject to change. Because of the inherent limitations of the target return, potential investors should not rely on it when making a decision on whether or not to invest in this Fund.
  • 48.
    Risks and Disclaimers(cont’d) ※ This presentation is written with investment risks involving the parent fund taken into account. ※ Risks are not limited to the risks listed in this presentation. There can be various types of unexpected risks. 48 Risk of Concentrated Investment in Equities The Fund primarily invests in equities and equity related securities and thus changes in stock prices may adversely affect the value of the Fund. A fall in prices of the equities held by the Fund may result in a decline in the value of the Fund. If the Fund’s investment portfolio falls in value, investors’ investment in the Fund may suffer losses. Risk of Concentrated Investment in Selective Sectors The Fund may selectively invest in stocks in a limited number of sectors while remaining in the accordance with applicable statutes. The lack of diversification may increase the impact that a small number of stocks or sectors may have on the Fund and the volatility of the Fund, compared to the market or other same type of funds in general. Risk of Lack of Liquidity Since small- to mid-cap stocks, liquidity of which is generally limited, may be included in the portfolio, a large redemption of shares may Increase the volatility in the Fund’s net asset value per share.. Market Risks The Fund primarily invests in equities and thus is exposed to risks of changes in security prices and macro-economic indicators. In addition, the value of the Fund’s assets may radically change, depending on the condition of issuers of stocks held by the fund, e.g., the status of their sales, finances, and credit. Credit Risks The value of the Fund’s assets may radically change when the condition of counterparties of transactions or issuers of stocks held by the fund, e.g., the status of their sales, finances, and credit, deteriorates and subsequently, it is increasingly likely that credit ratings of the counterparties or the issuers may be downgraded or they may default on their debt. Risks of Taxation Tax authorities divide gains/losses from investments into two categories: gains/losses generated from taxable assets and gains/losses generated from non- taxable assets. Non-taxable gains/losses imply that the tax will not be imposed on gains but, at the same time, losses will not be recognized. As such, even if the outcome of investments as a whole records a loss, the tax may be imposed, if there are gains derived from taxable assets alongside gains obtained from non-taxable assets. * Examples of Taxable Income: Dividends on stocks, profits from overseas investments, gains from foreign exchange, and yields and capital gains from bonds * Examples of Non-Taxable Income: Capital gains/losses from buying/selling stocks listed in the South Korea stock market. Risks Associated with Redemption Redemption of the Fund entails risks associated with the gap between the selected redemption date and the actual date of redemption, during which the value of the Fund’s assets is subject to change. In addition, a redemption fee may be incurred upon redemption, depending on the period the Fund has been held, and the redemption fee belongs to the Fund.
  • 49.
    25F, 70, Yeoui-daero,Yeongdeungpo-gu, 07325 Seoul, South Korea www.kbam.co.kr/ib/kbstarfunds 82-2-2167 – 8200 ThankYou.