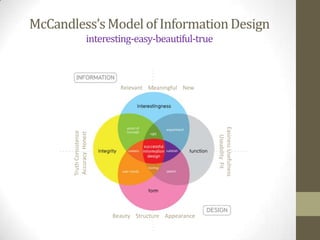
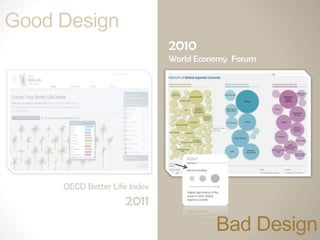
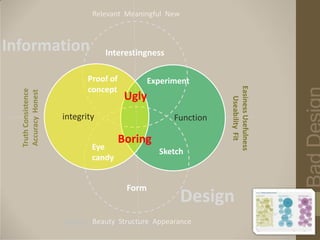
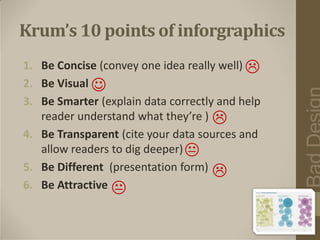
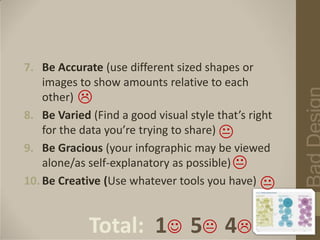
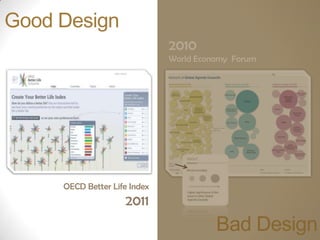
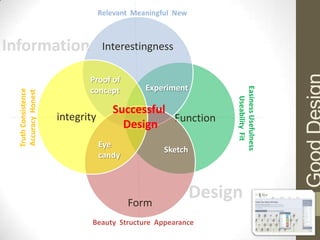
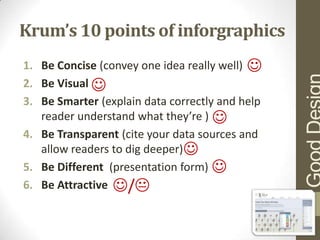
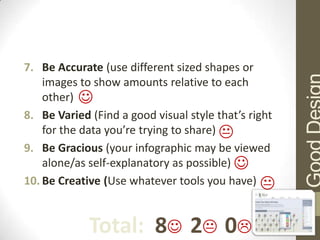
Information Design Assignment 1
     Good VS. Bad


        Ruping Kuo 2012/1/23
McCandless’s Model of Information Design
                     interesting-easy-beautiful-true


                             Relevant Meaningful New


                                                         Easiness Usefulness
       Truth Consistence
       Accuracy Honest


                           Beauty Structure Appearance      Useability Fit
Good Design
                              2010
                              World Economy Forum


     OECD Better Life Index
                    2011
                                        Bad Design
Relevant Meaningful New


Information                       Interestingness

                             Proof of           Experiment
                             concept


                                                                 Easiness Usefulness
  Truth Consistence
  Accuracy Honest


                                         Ugly


                                                                    Useability Fit
                      integrity                       Function

                                        Boring
                              Eye
                                                  Sketch
                              candy


                                         Form
                                                        Design
                             Beauty Structure Appearance
                      Beauty Structure Appearance
Krum’s 10 points of inforgraphics
1. Be Concise (convey one idea really well) 
2. Be Visual 
3. Be Smarter (explain data correctly and help
   reader understand what they’re ) 
4. Be Transparent (cite your data sources and
   allow readers to dig deeper) 
5. Be Different (presentation form) 
6. Be Attractive 
7. Be Accurate (use different sized shapes or
    images to show amounts relative to each
    other) 
8. Be Varied (Find a good visual style that’s right
    for the data you’re trying to share) 
9. Be Gracious (your infographic may be viewed
    alone/as self-explanatory as possible) 
10. Be Creative (Use whatever tools you have) 


             Total: 1 5 4
Good Design
                              2010
                              World Economy Forum


     OECD Better Life Index
                    2011
                                        Bad Design
Relevant Meaningful New


Information                        Interestingness

                             Proof of
                              Proof of        Experiment
                             concept          Experiment


                                                                 Easiness Usefulness
                              concept
  Truth Consistence
  Accuracy Honest


                                                                    Useability Fit
                                     Successful
                      integrity                 Function
                                       Design
                                Eye
                              Eye                 Sketch
                                                 Sketch
                                candy
                              candy


                                         Form
                                                            Design
                              Beauty Structure Appearance
Krum’s 10 points of inforgraphics
1. Be Concise (convey one idea really well) 
2. Be Visual 
3. Be Smarter (explain data correctly and help
   reader understand what they’re ) 
4. Be Transparent (cite your data sources and
   allow readers to dig deeper)
5. Be Different (presentation form) 
6. Be Attractive /
7. Be Accurate (use different sized shapes or
    images to show amounts relative to each
    other) 
8. Be Varied (Find a good visual style that’s right
    for the data you’re trying to share) 
9. Be Gracious (your infographic may be viewed
    alone/as self-explanatory as possible) 
10. Be Creative (Use whatever tools you have) 


             Total: 8 2 0

HCDE510 _ Assignment 1

  • 1.
    Information Design Assignment1 Good VS. Bad Ruping Kuo 2012/1/23
  • 2.
    McCandless’s Model ofInformation Design interesting-easy-beautiful-true Relevant Meaningful New Easiness Usefulness Truth Consistence Accuracy Honest Beauty Structure Appearance Useability Fit
  • 3.
    Good Design 2010 World Economy Forum OECD Better Life Index 2011 Bad Design
  • 4.
    Relevant Meaningful New Information Interestingness Proof of Experiment concept Easiness Usefulness Truth Consistence Accuracy Honest Ugly Useability Fit integrity Function Boring Eye Sketch candy Form Design Beauty Structure Appearance Beauty Structure Appearance
  • 5.
    Krum’s 10 pointsof inforgraphics 1. Be Concise (convey one idea really well)  2. Be Visual  3. Be Smarter (explain data correctly and help reader understand what they’re )  4. Be Transparent (cite your data sources and allow readers to dig deeper)  5. Be Different (presentation form)  6. Be Attractive 
  • 6.
    7. Be Accurate(use different sized shapes or images to show amounts relative to each other)  8. Be Varied (Find a good visual style that’s right for the data you’re trying to share)  9. Be Gracious (your infographic may be viewed alone/as self-explanatory as possible)  10. Be Creative (Use whatever tools you have)  Total: 1 5 4
  • 7.
    Good Design 2010 World Economy Forum OECD Better Life Index 2011 Bad Design
  • 8.
    Relevant Meaningful New Information Interestingness Proof of Proof of Experiment concept Experiment Easiness Usefulness concept Truth Consistence Accuracy Honest Useability Fit Successful integrity Function Design Eye Eye Sketch Sketch candy candy Form Design Beauty Structure Appearance
  • 9.
    Krum’s 10 pointsof inforgraphics 1. Be Concise (convey one idea really well)  2. Be Visual  3. Be Smarter (explain data correctly and help reader understand what they’re )  4. Be Transparent (cite your data sources and allow readers to dig deeper) 5. Be Different (presentation form)  6. Be Attractive /
  • 10.
    7. Be Accurate(use different sized shapes or images to show amounts relative to each other)  8. Be Varied (Find a good visual style that’s right for the data you’re trying to share)  9. Be Gracious (your infographic may be viewed alone/as self-explanatory as possible)  10. Be Creative (Use whatever tools you have)  Total: 8 2 0

Editor's Notes

  • #3 http://www.informationisbeautiful.net/2009/interesting-easy-beautiful-true/
  • #6 http://www.coolinfographics.com/blog/2010/4/27/10-tips-for-journalists-designing-infographics.html
  • #10 http://www.coolinfographics.com/blog/2010/4/27/10-tips-for-journalists-designing-infographics.html