The document provides biographies of seven authors and one technical editor of the book "Harness the Power of Big Data: The IBM Big Data Platform". It introduces their professional backgrounds, roles at IBM, areas of expertise, and education.
Flash 6X9 /Harness the Power of Big Data:The IBM Big Data Platform / Zikopoulos / 817-5
Harness the
Power of Big Data
00-FM.indd 1 04/10/12 12:19 PM
3.
Flash 6X9 /Harness the Power of Big Data:The IBM Big Data Platform / Zikopoulos / 817-5
About the Authors
Paul C. Zikopoulos, B.A., M.B.A., is the Director of Technical Professionals
for IBM Software Group’s Information Management division and addition-
ally leads the World-Wide Competitive Database and Big Data Technical
Sales Acceleration teams. Paul is an award-winning writer and speaker with
over 19 years of experience in Information Management. In 2012, Paul was
chosen by SAP as one of its Top 50 Big Data Twitter influencers (@BigData_
paulz). Paul has written more than 350 magazine articles and 16 books,
including Understanding Big Data: Analytics for Enterprise Class Hadoop and
Streaming Data; Warp Speed, Time Travel, Big Data, and More: DB2 10 New Fea-
tures; DB2 pureScale: Risk Free Agile Scaling; DB2 Certification for Dummies; and
DB2 for Dummies. In his spare time, Paul enjoys all sorts of sporting activities,
including running with his dog Chachi, avoiding punches in his MMA train-
ing, and trying to figure out the world according to Chloë—his daughter. You
can reach him at: paulz_ibm@msn.com.
Dirk deRoos, B.Sc., B.A., is IBM’s World-Wide Technical Sales Leader for
IBM InfoSphere BigInsights. Dirk spent the past two years helping customers
with BigInsights and Apache Hadoop, identifying architecture fit, and advis-
ing early stage projects in dozens of customer engagements. Dirk recently
coauthored a book on this subject area, Understanding Big Data: Analytics for
Enterprise Class Hadoop and Streaming Data (McGraw-Hill Professional, 2012).
Prior to this, Dirk worked in the IBM Toronto Software Development Lab on
the DB2 database development team where he was the Information Architect
for all of the DB2 product documentation. Dirk has earned two degrees from
the University of New Brunswick in Canada: a Bachelor of Computer Sci-
ence, and a Bachelor of Arts (Honors English). You can reach him at: dirk
.ibm@gmail.com or on Twitter at @Dirk_deRoos.
Krishnan Parasuraman, B.Sc., M.Sc., is part of IBM’s Big Data industry solu-
tions team and serves as the CTO for Digital Media. In his role, Krishnan
works very closely with customers in an advisory capacity, driving Big Data
solution architectures and best practices for the management of Internet-
scale analytics. He is an authority on the use of Big Data technologies, such
as Hadoop and MPP data warehousing platforms, for solving analytical
problems in the online digital advertising, customer intelligence, and
00-FM.indd 2 04/10/12 12:19 PM
4.
Flash 6X9 /Harness the Power of Big Data:The IBM Big Data Platform / Zikopoulos / 817-5
real-time marketing space. He speaks regularly at industry events and writes
for trade publications and blogs. Prior to his current role, Krishnan worked
in research, product development, consulting, and technology marketing
across multiple disciplines within information management. Krishnan has
enabled data warehousing and customer analytics solutions for large media
and consumer electronics organizations, such as Apple, Microsoft, and
Kodak. He holds an M.Sc. degree in computer science from the University of
Georgia. You can keep up with his musings on Twitter @kparasuraman.
Thomas Deutsch, B.A, M.B.A., is a Program Director for IBM’s Big Data
team. Tom played a formative role in the transition of Hadoop-based technol-
ogy from IBM Research to IBM Software Group and continues to be involved
with IBM Research around Big Data. Tom has spent several years helping
customers, identifying architecture fit, developing business strategies, and
managing early stage projects across more than 300 customer engagements
with technologies such as Apache Hadoop, InfoSphere BigInsights (IBM’s
Hadoop distribution), InfoSphere Streams, Cassandra, and other emerging
NoSQLtechnologies. Tom has coauthored a book and multiple thought papers
about Big Data, and is a columnist for IBM Data Management magazine. He’s a
frequent speaker at industry conferences and a member of the IBM Academy
of Technology. Prior to this, Tom worked in the Information Management
CTO’s office, focused on emerging technologies; he came to IBM through
the FileNet acquisition, where he was its flagship product’s lead product man-
ager. With more than 20 years in the industry, and as a veteran of two startups,
Tom is an expert on the technical, strategic, and business information man-
agement issues facing the enterprise today. Tom earned a B.A. degree from
Fordham University in New York and an M.B.A. degree from the University
of Maryland University College.
David Corrigan, B.A., M.B.A., is currently the Director of Product Market-
ing for IBM’s InfoSphere portfolio, which is focused on managing trusted
information. His primary focus is driving the messaging and strategy for
the InfoSphere portfolio of information integration, data quality, master
data management (MDM), data lifecycle management, and data privacy
and security. Prior to his current role, David led the product management
and product marketing teams for IBM’s MDM portfolio, and has worked in
the Information Management space for over 12 years. David holds an M.B.A.
00-FM.indd 3 04/10/12 12:19 PM
5.
Flash 6X9 /Harness the Power of Big Data:The IBM Big Data Platform / Zikopoulos / 817-5
degree from York University’s Schulich School of Business, and an under-
graduate degree from the University of Toronto.
James Giles, BSEE, B.Math, MSEE, Ph.D., is an IBM Distinguished Engineer
and currently a Senior Development Manager for the IBM InfoSphere BigIn-
sights and IBM InfoSphere Streams Big Data products. Previously, Jim man-
aged the Advanced Platform Services group at the IBM T. J. Watson Research
Center, where Jim and his team developed the technology for the System S
stream-processing prototype, which is now the basis for InfoSphere Streams.
Jim joined IBM in 2000 as a Research Staff Member and led research and devel-
opment in content distribution, policy management, autonomic computing,
and security. He received his Ph.D. in electrical and computer engineering
from the University of Illinois at Urbana-Champaign, where he studied covert
communications in data networks. Jim has several patents and is the recipient
of an IBM Corporate Award for his work on stream computing.
About theTechnical Editor
Roman B. Melnyk, B.A., M.A., Ph.D., is a senior member of the DB2 Infor-
mation Development team. During more than 18 years at IBM, Roman has
written numerous books, articles, and other related materials about DB2.
Roman coauthored DB2 Version 8: The Official Guide; DB2: The Complete Refer-
ence; DB2 Fundamentals Certification for Dummies; and DB2 for Dummies.
00-FM.indd 4 04/10/12 12:19 PM
6.
Flash 6X9 /Harness the Power of Big Data:The IBM Big Data Platform / Zikopoulos / 817-5
Harness the
Power of Big Data
The IBM Big Data Platform
Paul C. Zikopoulos
Dirk deRoos
Krishnan Parasuraman
Thomas Deutsch
David Corrigan
James Giles
New York Chicago San Francisco
Lisbon London Madrid Mexico City
Milan New Delhi San Juan
Seoul Singapore Sydney Toronto
00-FM.indd 5 04/10/12 12:19 PM
Flash 6X9 /Harness the Power of Big Data:The IBM Big Data Platform / Zikopoulos / 817-5
My sixteenth book in my nineteenth year at IBM. Looking back, as this
collection of books literally occupies an entire shelf, one thing strikes me: the
caliber of people I work with. From this authoring team (some of whom are
newfound friends), to past ones, I’m luckily surrounded by some of the
smartest and most passionate professionals in the world: IBMers—and it’s
an honor to learn from you all.
To the people who have created an environment in which I never want to
slow down (Martin Wildberger, Bob Picciano, Dale Rebhorn, and Alyse
Passarelli), thanks for your mentorship and belief in me, but also your
patience with some of those 2 a.m. run-on notes with the red markup.
It’s interesting the toll that writing a book takes on your life. For example, I
found that my golf handicap experienced double-digit percentage growth
after I started to write this one, leaving my retirement portfolio green with
envy. (I’d be remiss if I didn’t thank Durham Driving Range’s Dave
Dupuis for always greeting me with a smile and listening to me complain
as he watches the odd—perhaps more than odd—ball shank hard right.)
Although that stuff doesn’t matter, the personal impact and trade-offs you
have to make to write a book lead me to my most important thank-you I’ve
got to give: to my family, Chloë, Kelly, and the spirit of Grace. You gals keep
me strong and in overdrive.
—Paul Zikopoulos
To Sandra, Erik, and Anna: the truly wonderful people I have in my life.
Thanks for giving me the time to help make this happen and for your
patience with me! I would also like to dedicate my work on this book to my
beloved Netherlands national football team, who, yet again, broke my heart
this year. May the collaboration of the many authors on this book be an
example to you of what teamwork looks like! (Mental note: Never work on a
book with a fellow Dutchman.)
—Dirk deRoos
I would like to thank the Netezza team for all the fond memories and good
times; and to Brad Terrell…for being my Force Field.
—Krishnan Parasuraman
00-FM.indd 7 04/10/12 12:19 PM
9.
Flash 6X9 /Harness the Power of Big Data:The IBM Big Data Platform / Zikopoulos / 817-5
I would like to thank (again) my slightly less patient (from last year when I
thanked them) family for their patience during this process. I would also like
to thank Paul Zikopoulos; I’ve lost count of the number of drinks I owe him.
Finally, thanks to Nagui Halim, John McPherson, Hamid Pirahesh, and
Neil Isford for being such good dance partners in emerging compute spaces.
—Thomas Deutsch
I’d like to thank Karen, Kaitlyn, and Alex for all of their love and support.
I’d also like to thank all of my integration and governance colleagues for
continuing to drive a strategy that makes this a market-leading platform
and a very interesting place to work.
—David Corrigan
I would like to dedicate this book to the tireless IBM Big Data development
and research teams worldwide. This book would not be possible without the
countless innovations and commitment to building great technology for the
enterprise. Thank you all!
—James Giles
00-FM.indd 8 04/10/12 12:19 PM
10.
Flash 6X9 /Harness the Power of Big Data:The IBM Big Data Platform / Zikopoulos / 817-5
ix
CONTENTS
Foreword . . . . . . . . . . . . . . . . . . . . . . . . . . . . . . . . . . . . . . . xvii
Preface . . . . . . . . . . . . . . . . . . . . . . . . . . . . . . . . . . . . . . . . . xxi
Acknowledgments . . . . . . . . . . . . . . . . . . . . . . . . . . . . . . . . xxv
About This Book . . . . . . . . . . . . . . . . . . . . . . . . . . . . . . . . . . xxvii
Part I
The Big Deal About Big Data
1 What Is Big Data? . . . . . . . . . . . . . . . . . . . . . . . . . . . . . . 3
Why Is Big Data Important? . . . . . . . . . . . . . . . . . . . . . . . . . . 3
Now, the “What Is Big Data?” Part . . . . . . . . . . . . . . . . . . . . 4
Brought to You by the Letter V:
How We Define Big Data . . . . . . . . . . . . . . . . . . . . . . . 9
What About My Data Warehouse
in a Big Data World? . . . . . . . . . . . . . . . . . . . . . . . . . . . . . 15
Wrapping It Up . . . . . . . . . . . . . . . . . . . . . . . . . . . . . . . . . . . 19
2 Applying Big Data to Business Problems:
A Sampling of Use Cases . . . . . . . . . . . . . . . . . . . . . . . . . 21
When to Consider a Big Data Solution . . . . . . . . . . . . . . . . . 21
Before We Start:
Big Data, Jigsaw Puzzles, and Insight . . . . . . . . . . . . . . . . . 24
Big Data Use Cases:
Patterns for Big Data Deployment . . . . . . . . . . . . . . . . . . . . 26
You Spent the Money to
Instrument It—Now Exploit It! . . . . . . . . . . . . . . . . . . . . 26
IT for IT:
Data Center, Machine Data, and Log Analytics . . . . . . . 28
What, Why, and Who? Social Media Analytics . . . . . . . . . 30
Understanding Customer Sentiment . . . . . . . . . . . . . . . . . 31
Social Media Techniques
Make the World Your Oyster . . . . . . . . . . . . . . . . . . . . . 33
Customer State:
Or, Don’t Try to Upsell Me When I Am Mad . . . . . . . . . 34
00-FM.indd 9 04/10/12 12:19 PM
11.
x Contents
Flash6X9 / Harness the Power of Big Data:The IBM Big Data Platform / Zikopoulos / 817-5
Fraud Detection:
“Who Buys an Engagement Ring at 4 a.m.?” . . . . . . . . . . 36
Liquidity and Risk:
Moving from Aggregate to Individual . . . . . . . . . . . . . . . 38
Wrapping It Up . . . . . . . . . . . . . . . . . . . . . . . . . . . . . . . . . . . 39
3 Boost Your Big Data IQ: The IBM Big Data Platform . . . . . 41
The New Era of Analytics . . . . . . . . . . . . . . . . . . . . . . . . . . . 41
Key Considerations for the Analytic Enterprise . . . . . . . . . 43
The Big Data Platform Manifesto . . . . . . . . . . . . . . . . . . . 45
IBM’s Strategy for Big Data and Analytics . . . . . . . . . . . . . . . 49
1. Sustained Investments in
Research and Acquisitions . . . . . . . . . . . . . . . . . . . . . . . 49
2. Strong Commitment to Open Source Efforts
and a Fostering of Ecosystem Development . . . . . . . . . . 50
3. Support Multiple Entry Points to Big Data . . . . . . . . . . . 52
A Flexible, Platform-Based Approach to Big Data . . . . . . . 56
Wrapping It Up . . . . . . . . . . . . . . . . . . . . . . . . . . . . . . . . . . . 59
Part II
Analytics for Big Data at Rest
4 A Big Data Platform for High-Performance
Deep Analytics: IBM PureData Systems . . . . . . . . . . . . . . 63
Netezza’s Design Principles . . . . . . . . . . . . . . . . . . . . . . . . . 66
Appliance Simplicity: Minimize the Human Effort . . . . . . 66
Hardware Acceleration:
Process Analytics Close to the Data Store . . . . . . . . . . . . 67
Balanced, Massively Parallel Architecture:
Deliver Linear Scalability . . . . . . . . . . . . . . . . . . . . . . . . 67
Modular Design: Support Flexible
Configurations and Extreme Scalability . . . . . . . . . . . . . 67
What’s in the Box? The Netezza Appliance
Architecture Overview . . . . . . . . . . . . . . . . . . . . . . . . . . . . 68
A Look Inside the Netezza Appliance . . . . . . . . . . . . . . . . 69
The Secret Sauce: FPGA-Assisted Analytics . . . . . . . . . . . 72
Query Orchestration in Netezza . . . . . . . . . . . . . . . . . . . . 73
Platform for Advanced Analytics . . . . . . . . . . . . . . . . . . . . . . 77
Extending the Netezza Analytics
Platform with Hadoop . . . . . . . . . . . . . . . . . . . . . . . . . . 79
00-FM.indd 10 04/10/12 12:19 PM
12.
Contents xi
Flash 6X9/ Harness the Power of Big Data:The IBM Big Data Platform / Zikopoulos / 817-5
Customers’ Success Stories: The Netezza Experience . . . . . . 81
T-Mobile: Delivering Extreme Performance
with Simplicity at the Petabyte Scale . . . . . . . . . . . . . . . 82
State University of New York: Using Analytics
to Help Find a Cure for Multiple Sclerosis . . . . . . . . . . . 83
NYSE Euronext: Reducing Data Latency
and Enabling Rapid Ad-Hoc Searches . . . . . . . . . . . . . . 84
5 IBM’s Enterprise Hadoop: InfoSphere BigInsights . . . . . . . 85
What the Hadoop! . . . . . . . . . . . . . . . . . . . . . . . . . . . . . . . . 87
Where Elephants Come From:
The History of Hadoop . . . . . . . . . . . . . . . . . . . . . . . . . 88
Components of Hadoop and Related Projects . . . . . . . . . 89
Hadoop 2.0 . . . . . . . . . . . . . . . . . . . . . . . . . . . . . . . . . . . 89
What’s in the Box: The Components of
InfoSphere BigInsights . . . . . . . . . . . . . . . . . . . . . . . . . . . . 90
Hadoop Components Included in
InfoSphere BigInsights 2.0 . . . . . . . . . . . . . . . . . . . . . . . 91
The BigInsights Web Console . . . . . . . . . . . . . . . . . . . . . . 92
The BigInsights Development Tools . . . . . . . . . . . . . . . . . 93
BigInsights Editions: Basic and Advanced . . . . . . . . . . . . . 94
Deploying BigInsights . . . . . . . . . . . . . . . . . . . . . . . . . . . . . . 94
Ease of Use: A Simple Installation Process . . . . . . . . . . . . 94
A Low-Cost Way to Get Started: Running
BigInsights on the Cloud . . . . . . . . . . . . . . . . . . . . . . . . 95
Higher-Class Hardware: IBM PowerLinux
Solution for Big Data . . . . . . . . . . . . . . . . . . . . . . . . . . . 96
Cloudera Support . . . . . . . . . . . . . . . . . . . . . . . . . . . . . . . 96
Analytics: Exploration, Development,
and Deployment . . . . . . . . . . . . . . . . . . . . . . . . . . . . . . . . . 97
Advanced Text Analytics Toolkit . . . . . . . . . . . . . . . . . . . . 98
Machine Learning for the Masses:
Deep Statistical Analysis on BigInsights . . . . . . . . . . . . . 99
Analytic Accelerators: Finding Needles in
Haystacks of Needles? . . . . . . . . . . . . . . . . . . . . . . . . . . 99
Apps for the Masses: Easy Deployment
and Execution of Custom Applications . . . . . . . . . . . . . . 100
Data Discovery and Visualization: BigSheets . . . . . . . . . . 100
The BigInsights Development Environment . . . . . . . . . . . 103
The BigInsights Application Lifecycle . . . . . . . . . . . . . . . . 105
00-FM.indd 11 04/10/12 12:19 PM
Flash 6X9 /Harness the Power of Big Data:The IBM Big Data Platform / Zikopoulos / 817-5
00-FM.indd 16 04/10/12 12:19 PM
This page intentionally left blank
18.
Flash 6X9 /Harness the Power of Big Data:The IBM Big Data Platform / Zikopoulos / 817-5
xvii
FOREWORD
“Big Data” is a curious phrase. Since I first encountered it some three-and-a-
half years ago, it has come to be one of the IT industry’s dominant trends,
and yet I don’t believe I have come across a single person in that time who
will admit to liking the term.
Attend any data management conference or webinar and you’ll hear the
same thing: vendors, practitioners, commentators, and analysts describing
how unsuitable the term Big Data is, before launching into an explanation of
how important Big Data is to their business, or the reverse. Unlike many
other industry buzzwords, the origins of Big Data cannot be traced back to a
specific vendor or individual. It is not uncommon, therefore, to hear those
vendors, practitioners, commentators, and analysts complaining about the
lack of definition before introducing their own description of what Big Data
means to them.
There is very rarely a significant difference from one definition to the next,
however. While the term Big Data might be almost universally unloved, it is also
now almost universally understood to refer to the realization of greater business
intelligence by storing, processing, and analyzing data that was previously
ignored due to the limitations of traditional data management technologies.
Those limitations have come to be defined by a combination of words
beginning with the letter “V”: typically volume, variety, and velocity, but
with others increasingly added to the mix (more about this in a moment).
The increased use of interactive applications and websites—as well as sen-
sors, meters, and other data-generating machines—means that an increasing
volume of data is being produced. At the same time, the cost of storage, pro-
cessing, and bandwidth has dropped enormously, while network access has
increased significantly.
The result is that it is now more economically feasible to store, process,
and analyze data that was previously ignored or under-utilized—such as
web and network log data, or social media content—to ensure that the business
is performing adequately and efficiently, and to track customer sentiment
and generate new revenue-generation opportunities.
00-FM.indd 17 04/10/12 12:19 PM
19.
xviii Foreword
Flash6X9 / Harness the Power of Big Data:The IBM Big Data Platform / Zikopoulos / 817-5
Much of the data that is being produced by these interactive applications
and data-generating machines lacks the structure to make it suitable for storage
and analysis in traditional relational databases and data warehouses. In
addition to this variety, the data is also being produced at a velocity that is
often beyond the performance limits of traditional systems.
It is interesting to note that since the first edition of this book, the authors
have added a fourth “V”: veracity. This succinctly highlights the fact that
tried and tested data management principles—data quality, data cleansing,
master data management, and data governance—are not completely redun-
dant in a world of Big Data. In fact, they are increasingly being seen as critical
factors in the ability of users to ensure they can create another “V”—value—
from this increased volume, variety, and velocity of data.
The ongoing importance of existing data management techniques also
illustrates another important point about Big Data: that new data manage-
ment and analytic technologies are being implemented to complement rather
than replace traditional approaches to data management and analytics.
Thus Apache Hadoop does not replace the data warehouse and NoSQL
databases do not replace transactional relational databases, while neither
MapReduce nor streaming analytics approaches replace existing SQL-based
reporting and analytics tools. As stated earlier, Big Data is about adopting
new technologies that enable the storage, processing, and analysis of data
that was previously ignored.
It is also about the adoption of new business processes and analytics
approaches that take advantage of that data. As an industry analyst company
focused on innovation and the development and adoption of new technolo-
gies, 451 Research has observed that the adoption of nontraditional data
management technologies is being driven not just by the volume, variety,
velocity, and veracity of data, but also by changes in the manner in which
users want to interact with their data.
451 Research uses the term “Total Data” to describe the management
approach being embraced by early adopters to process and explore Big Data
using the range of new technologies available. “Total Data” is not an alterna-
tive to “Big Data.” We believe that if your data is “big,” the way you manage
it should be “total.”
Specifically, we look at three key aspects of the way in which users want
to interact with their data: totality, exploration, and frequency. Totality refers
00-FM.indd 18 04/10/12 12:19 PM
20.
Foreword xix
Flash 6X9/ Harness the Power of Big Data:The IBM Big Data Platform / Zikopoulos / 817-5
to the increased desire to process and analyze all available data, rather than
analyzing a sample of data and extrapolating the results; exploration relates to
analytic approaches in which the schema is defined in response to the nature
of the query; and frequency refers to the desire to increase the rate of analysis
in order to generate more accurate and timely business intelligence.
Since it is important to consider the ongoing importance of existing data
management, processing, and analytic approaches, we add a fourth factor:
dependency, which relates to the need to balance investment in existing tech-
nologies and skills with the adoption of new techniques.
While the authors of this book may not use the term “Total Data,” we see
evidence of these four factors influencing the technology and business process
choices being made by businesses in the numerous Big Data success stories
contained within these pages, as well as the portfolio of technologies being
assembled by IBM to address its customers’ Big Data needs.
This brings us back to definitions, and the futility of getting hung up on
the meaning of Big Data rather than embracing the associated new data man-
agement technologies and approaches. IBM’s research has highlighted that
companies that invest in analytics and understanding their business and
their customers are significantly more likely to achieve competitive advan-
tage over their rivals.
Whatever you might think of the term Big Data, the adoption of new data
processing technologies and techniques that complement established analytics
approaches promises to deliver new levels of business intelligence, customer
service, and revenue opportunities. Many companies are finding that is not
something they can afford to ignore.
Matt Aslett
Research Manager, Data Management and Analytics, 451 Research
00-FM.indd 19 04/10/12 12:19 PM
21.
Flash 6X9 /Harness the Power of Big Data:The IBM Big Data Platform / Zikopoulos / 817-5
00-FM.indd 16 04/10/12 12:19 PM
This page intentionally left blank
22.
Flash 6X9 /Harness the Power of Big Data:The IBM Big Data Platform / Zikopoulos / 817-5
xxi
PREFACE
Executive Letter from Bob Picciano
When the technology market shifts, big things happen. Opportunities arise
and risks are confronted. Organizations and practitioners need to understand
and prepare for such change. Part of this process includes being on the look-
out for the emerging “factoids” that tell us in advance that we’re approach-
ing a shift, lift, rift, or cliff. But even more interesting is that emotional sense
of promise for what a new space might bring. In our industry, we often see
the predictive data, and we’re told about the perils in failing to act. But rarely
do we also get that sense of pure excitement about a whole new frontier that
is being invented, discovered, forged, and fostered. When both elements are
present simultaneously, really interesting things start to happen. Think about
it for a moment…when was the last time you had the opportunity to be part
of an inflection point? Big Data is one of those rare opportunities.
Studies strongly indicate marked performance differences in those orga-
nizations that embrace the opportunities around the broad space of analyt-
ics. Our own study, conducted jointly by IBM and MIT, showed that orga-
nizations that focus on analytics significantly outperform their segment
peers on the key business metrics of growth, earnings, and performance.
Consider the emotional side of this. For years, so many of us in the field of
analytics and information management have worked to rapidly turn any
type of structured or unstructured data into useful insights to differentiate
performance. Now, with the emergence of Big Data, for the first time we
can really get a sense that the hurdles of volume, variety, velocity, and
veracity can be tackled and overcome.
Big Data represents a huge opportunity for businesses across many prob-
lem domains. As a new wave of technology emerges to help realize the
promise, there also comes a set of challenges. There is a need for new skills;
a need to handle larger data volumes, strains on data quality, and countless
evolutions of data types, among a host of other challenges. Very few compa-
nies can afford to hire and train thousands of new workers just to address
00-FM.indd 21 04/10/12 12:19 PM
23.
xxii Preface
Flash6X9 / Harness the Power of Big Data:The IBM Big Data Platform / Zikopoulos / 817-5
this new challenge as a sideline. Our clients demand a short time to value for
their Big Data investments because they seek leadership in their respective
marketplaces. One of the most compelling ways to do that is through a plat-
form with a maniacal focus on consumability, instantiated by a well thought
out and planned tools ecosystem, declarative languages, and techniques
that accelerate the ability to quickly drive results. This is exactly what IBM is
focusing on and delivering to our clients and partners…today.
Some aspects of the traditional ways in which data is structured and man-
aged also apply in the Big Data arena. But new demands will be placed on
areas like data governance, the integration of traditional sources, and secu-
rity. IBM is focused on delivering in these domain areas, in addition to the
mainstream Big Data areas.
IBM has long believed in “workload optimized systems.” You see this
manifested today in our IBM PureSystems and IBM PureData Systems fam-
ily, which delivers extraordinary economies of scale while reducing labor
impact and increasing compute density. The same dynamics are needed in
the world of Big Data. There are different tasks to perform, and we have a set
of finely tuned, highly consumable engines for them. We have a non-forked
version of Hadoop (InfoSphere BigInsights), so the implementation remains
pure, with a number of committers contributing assets across the entire
Apache Hadoop ecosystem. Looking at our one hundred plus years of his-
tory, it’s evident that IBM is also committed to providing the most open sys-
tems possible, and it’s key for us to contribute to the Big Data open source
movement. Besides Hadoop, IBM’s open source contributions include
Apache Derby, Lucene, Jakarta, Geronimo, Eclipse, DRDA, Xerces, parts of
Linux, and much more. In fact, many of the open source contributions, along
with IBM differentiating technologies, were showcased in unison by the
famous Watson win on the popular game show Jeopardy! Quite simply,
we believe that strong partnership with the open source community helps
the entire domain innovate at a more rapid rate, in service of what our clients
need to solve the more challenging business problems that they face.
IBM has workload-optimized systems for deep analytics and operational
analytics. And if you want to apply analytics to data in motion, we have that
too (InfoSphere Streams), because one of the most important opportunities
resides within the emerging field of in-motion analytics. Today, most imple-
mentations that we see are in the area of at-rest analytics. While IBM is a
00-FM.indd 22 04/10/12 12:19 PM
24.
Preface xxiii
Flash 6X9/ Harness the Power of Big Data:The IBM Big Data Platform / Zikopoulos / 817-5
leader in that space; showcased by the family of analytics-based IBM Pure-
Data Systems (which incorporate Netezza and DB2 technologies), InfoSphere
BigInsights, and more. But the analytics of data in motion will also drive more
valuable insight and decision making for front office systems of engagement,
where seconds—even micro-seconds—can matter. IBM is perhaps the only
innovator combining in-motion and at-rest analytics in one platform.
Finally, organizations seem to really struggle in trying to get their hands
around the data assets that they already own, and are often guilty of not
knowing what they could already know. Enterprise discovery and search
services are needed, and they have to be built from the ground up for Big
Data. InfoSphere Data Explorer (technology acquired through IBM’s Vivisi-
mo acquisition) has specialized indexing techniques and social algorithms
that provide exactly this.
Big Data is flowing like an enormous river, a huge, nearly untapped,
resource. What are you doing to tap that stream and make Big Data work for
you? You have to decide how you will improve your skills, capabilities, and
involvement to take advantage of all that Big Data has to offer. This book is
an excellent way to start your journey.
I would like to thank Paul, Dirk, Krishnan, Tom, David, and James for
writing this book. They are an outstanding group whose dedication to our
clients and to their fellow IBMers is unmatched. Behind them is a large eco-
system of IBMers that make the IBM Big Data platform possible. It’s a privi-
lege, not a right, to work with good people. The team behind the IBM Big
Data platform is an outstanding group of people who are passionate about
our customers’ success, dedicated to their work, and continually innovate.
Thank you, and enjoy the book.
Bob Picciano
IBM, General Manager, Software Sales
00-FM.indd 23 04/10/12 12:19 PM
25.
Flash 6X9 /Harness the Power of Big Data:The IBM Big Data Platform / Zikopoulos / 817-5
00-FM.indd 16 04/10/12 12:19 PM
This page intentionally left blank
26.
Flash 6X9 /Harness the Power of Big Data:The IBM Big Data Platform / Zikopoulos / 817-5
xxv
ACKNOWLEDGMENTS
Collectively, we want to thank the following people, without whom this
book would not have been possible: John Choi, Nancy Kopp, Phil Francisco,
Shivakumar (Shiv) Vaithyanathan, Roger Rea, Robert Uleman, Tina Chen,
Bert Van der Linden, Hui Liao, Klaus Roder, Kevin Foster, Nagui Halim, Cindy
Saracco, Vijay R. Bommireddipalli, Tony Curcio, Mike Spicer, Mike
Koranda, Stewart Tate, Gary Robinson, Kayla Martell, Bill O’Connell, Anshul
Dawra, Andrey Balmin, Manny Corniel, our Research and Development
teams, and all the others in our business who make personal sacrifices day in
and day out to bring you the IBM Big Data platform. We also want to thank
Dan Wolfson, Jeff Pollock, Rick Clements, Paula Sigmon, Aarti Borkar, and
the entire InfoSphere Information Integration and Governance team for their
help as well.
Tracey Mustacchio, Jerome Pesenti, and Mark Myers joined IBM as part of
the Vivisimo acquisition and helped us with this information—welcome and
thanks! There’s a special team of Big Data superstars at our disposal, we use
and abuse them, and they seem to love it. So we wanted to thank Stephen
Brodsky, Anjul Bhambhri, Shankar Venkataraman, and Rafael Coss too.
Jeff Jonas deserves a special thanks for his puzzle inspiration; if you ever
get a chance to see this guy speak, don’t miss it: you’ll be wildly entertained
and begin to think differently about certain things—albeit not just technology.
A special thanks to Linda Snow and Lauri Saft, for their passion and for
being our pro-bono (we forgot to tell them that ahead of time) side-reviewers.
We also want to specifically thank Chris Eaton, Steven Sit, and George Lapis
for working with some of us on the last book; some of that effort can be found
in this one.
To our technical editor, Roman Melnyk; he’s like the Betamax of technical
editors, they just don’t make them like that anymore, and we thank you for
your dedication to our project. We don’t pay you nearly enough (and we
don’t have the money to pay more, so don’t even ask); we’ll pay you back
with our tax-exempt words of thanks.
00-FM.indd 25 04/10/12 12:19 PM
27.
xxvi Acknowledgments
Flash6X9 / Harness the Power of Big Data:The IBM Big Data Platform / Zikopoulos / 817-5
Finally, we want to thank (although at times we cursed) Susan Visser,
Steve Miller, and Linda Currie for getting the book in place; an idea is an
idea, but it takes people like this to help get an idea off a Buffalo wings–stained
napkin and into your hands without the mess. Our editing and production
team—Harleen Chopra, Jean Bodeaux, Janet Walden, Margaret Berson, and
Emilia Thiuri—all played a key role behind the scenes and we want to extend
our thanks for that. Our thanks isn’t enough—when they had to deal with
unfair requests in the moments before print, these ladies put it into overdrive
to get this book in the hands of our clients sooner than later. It means a lot
to work with such success-oriented professionals. And, of course, to our
McGraw-Hill guru, Paul Carlstroem—there’s a reason why we specifically
wanted to work with you: passion, credibility, and knowing when to push
and pull (by the way, that extra week came in handy!).
00-FM.indd 26 04/10/12 12:19 PM
28.
Flash 6X9 /Harness the Power of Big Data:The IBM Big Data Platform / Zikopoulos / 817-5
xxvii
ABOUT THIS BOOK
This book provides an overview of the IBM Information Management Big
Data platform. It’s intended for a broad audience, ranging from those who
are brand new to Big Data, to those on the business and management side, to
architects, and to developers who want a glimpse into the technical details
that underpin this platform. That said, we couldn’t cover everything in this
book. Harness the Power of Big Data: The IBM Big Data Platform is meant to be
a jumping-off point, igniting a desire to explore more of this platform and
leave you with a strong understanding of what makes it so different. You
don’t have to read this book from front to back, because it’s organized into
six parts that enable you to jump into the specific topics in which you’re inter-
ested. That said, we do reference other parts of the book, so you will benefit
the most if you read it from front to back.
The chapters in Part I, “The Big Deal About Big Data,” show you how to
identify and define what Big Data is (Chapter 1), apply usage patterns to
business scenarios to avoid the doomsday Big Data “science project”
(Chapter 2), and articulate the key components that make up the IBM Big
Data platform (Chapter 3). Having a strong understanding of the IBM
Big Data platform capabilities gives you some insight into how and why we
built it the way we did (integrated, governed, well tooled, accelerated, con-
sumable, and capable). That said, even if you don’t make IBM a partner on
your Big Data journey, you’re going to discover the right questions to ask
whatever partner you choose. (We think when you ask these question to other
vendors, you’ll start to really appreciate what IBM has to offer in this space.)
Unfortunately, some folks believe that Big Data is just Hadoop; after reading
Chapter 3, we think that you’ll be able to articulate why Hadoop is critical to
a Big Data platform, but only as part of a much broader ecosystem that
includes many Big Data capabilities, such as analytics, visualization, search,
and more.
In Part II, “Analytics for Big Data at Rest,” we cover the optimized IBM Big
Data platform repositories for data at rest. Chapter 4 describes the IBM
00-FM.indd 27 04/10/12 12:19 PM
29.
xxviii AboutThis Book
Flash6X9 / Harness the Power of Big Data:The IBM Big Data Platform / Zikopoulos / 817-5
PureData System for Analytics (formerly known as Netezza) and some light
references to the IBM PureData System for Operational Analytics (formerly
known as the IBM Smart Analytics System). The family of IBM PureData
Systems represents the culmination of years of learned expertise and deploy-
ment patterns, packaged together as an expertly integrated system with an
optimized and balanced runtime engine for any Big Data tasks at hand.
Chapter 5 describes Hadoop. You’ll learn about IBM’s commitment to Hadoop,
IBM’s Hadoop distribution (called IBM InfoSphere BigInsights), enterprise
hardening features that IBM delivers for Hadoop (some of which can be run
on Cloudera’s Hadoop distribution), and more.
“Analytics for Big Data in Motion” is the title of Part III, and it’s an area in
which IBM has differentiated itself from any other vendor in the market-
place. In fact, few Big Data vendors even talk about it. IBM is well travelled
in this area, with a high-velocity Big Data engine, called InfoSphere Streams,
which we cover in Chapter 6. We show you how it integrates with at-rest
repositories, enabling you to move harvested at-rest analytic artifacts from
the interior of the business to the frontier, thereby transforming your analysis
from a forecast model to a nowcast model.
Part IV, “Unlocking Big Data,” details the components of the IBM Big Data
platform that come from the Vivisimo acquisition earlier in 2012. InfoSphere
Data Discovery (Data Discovery) is the IBM name for this suite of technolo-
gies that includes industry-leading enterprise search, security consider-
ations, a front-end tooling framework for customization of personalized
push/pull search, and more. Data Discovery presents an interesting oppor-
tunity for many companies to get started with Big Data; after all, shouldn’t
you have a crisp understanding of what Big Data assets you already have
before starting a new Big Data project? The Vivisimo technology literally
took the enterprise landscape by storm with its uncanny ability to find data
assets of different variety, size, and shape. We talk about this technology in
Chapter 7, as well as highlighting a number of very compelling client success
stories. After reading this chapter, we think you’ll agree that the word
Vivisimo! could replace Eureka! (for “I found it!”).
We cover many of the things that IBM has put in place to make the IBM
Big Data platform consumable. We highlight that term because it’s core to our
platform. Quite simply, our clients don’t have unlimited pools of resources to
get Big Data solutions working for them. For that reason, the IBM Big Data
00-FM.indd 28 04/10/12 12:19 PM
30.
AboutThis Book xxix
Flash6X9 / Harness the Power of Big Data:The IBM Big Data Platform / Zikopoulos / 817-5
platform comes with a rich set of toolkits and accelerators for text analytics
and machine learning (among others), a vast array of samples, enriched tool-
ing environments, and declarative languages that are purpose-built and
optimized for specific Big Data tasks at hand. Collectively, these efforts
flatten the time to analytics, enabling our clients to monetize their data
with unprecedented speed and agility—showcasing some of these IBM Big
Data platform characteristics is the focus of Part V.
Chapter 8 provides details about the Advanced Text Analytics Toolkit.
Text analytics requires a different set of optimization choices than a Big Data
workload that crunches through millions of files. In the Hadoop benchmark
world, you see many references to grep or terasort, which stress the I/O
characteristics of the cluster. However, text analytics is heavily dependent on
CPU. The IBM Big Data platform has a declarative language called Annotated
Query Language (AQL), which is part of this toolkit. Writing AQL programs
is facilitated by an Eclipse plug-in that provides design-time assistance, context-
sensitive help, and other rapid application development features that are
associated with a typical IDE. The toolkit includes a cost-based optimizer
that understands the resource requirements of text analysis and optimizes
the execution plan with this consideration (IBM, the company that invented
SQL and its associated cost-based optimization processing engines is doing
the same for AQL).
You’ll build your analytical text-based Big Data applications 50 percent
faster than using alternative approaches, they will run up to ten times faster
(that’s what we found when we compared it to some alternatives), and the
results you get will be more precise and complete (read Chapter 8 for more
details).
Chapter 9 describes the three accelerators that IBM has delivered for specific
Big Data usage patterns: machine data, social media, and call detail records
(CDRs). These accelerators reflect years of client interaction and are packaged
together for quick deployment. What’s more, they showcase the component
integration of the IBM Big Data platform, combining text analytics, Streams,
and BigInsights.
The book finishes with Part VI, “Integration and Governance in a Big
Data World.” What’s true in the relational world applies to the Big Data
world as well. Chapter 10 provides a brief overview of Big Data governance,
from reducing the surface area security profile of data at rest, to archiving, to
00-FM.indd 29 04/10/12 12:19 PM
31.
xxx AboutThisBook
Flash 6X9 / Harness the Power of Big Data:The IBM Big Data Platform / Zikopoulos / 817-5
trusting the lineage of that data, and more. Chapter 11 highlights the various
integration components within the IBM Big Data platform itself, and across
other IBM and non-IBM products.
We recognize that your time is precious and we thank you for the time that
you’re about to invest in reading this book. We hope that we’ve provided
technical readers with enough information to understand the capabilities of
the IBM Big Data platform, and business readers with sufficient high-level
strategic information. We believe that by the time you’ve read this book,
you’ll not only be well versed in Big Data, its usage patterns, and the technol-
ogy criteria that should be applied to the platform of choice, but you’ll have
the knowledge and confidence to contribute to your company’s Big Data
strategy. In short, you’ll THINK BIGger!
00-FM.indd 30 04/10/12 12:19 PM
32.
Flash 6X9 /Harness the Power of Big Data:The IBM Big Data Platform / Zikopoulos / 817-5
1
Part I
The Big Deal
About Big Data
01-ch01.indd 1 04/10/12 10:53 AM
33.
Flash 6X9 /Harness the Power of Big Data:The IBM Big Data Platform / Zikopoulos / 817-5
00-FM.indd 16 04/10/12 12:19 PM
This page intentionally left blank
34.
Flash 6X9 /Harness the Power of Big Data:The IBM Big Data Platform / Zikopoulos / 817-5
3
1
What Is Big Data?
The term Big Data is a bit of a misnomer. Truth be told, we’re not even big
fans of the term—despite the fact that it’s so prominently displayed on the
cover of this book—because it implies that other data is somehow small
(it might be) or that this particular type of data is large in size (it can be, but
doesn’t have to be). For this reason, we think it’s best to devote an entire
chapter to the task of explaining exactly what Big Data is.
Why Is Big Data Important?
Before you try to understand what Big Data is, you should know why Big
Data matters to business. In a nutshell, the quest for Big Data is directly
attributable to analytics, which has evolved from being a business initiative to
a business imperative.
In fact, we’d say that analytics has caused a bifurcation of industry partici-
pants: some are leaders and some are followers. It’s hard to overlook the impact
that analytics has had on organizations during the last decade or so. IBM’s
Institute of Business Value, in partnership with MIT’s Sloan Management Review,
published the results of a study in a paper called The New Intelligent Enterprise.
This paper concluded that organizations that achieve a competitive advantage
with analytics are over two times more likely to substantially outperform
their industry peers. Think about that for a moment: Analytics (specifically,
analytics enriched with Big Data) will help you to outperform your competitors,
so if your business is simply curious about Big Data, and your competitors are
more than curious—well, you get the point.
01-ch01.indd 3 04/10/12 10:53 AM
35.
4 Harnessthe Power of Big Data: The IBM Big Data Platform
Flash 6X9 / Harness the Power of Big Data:The IBM Big Data Platform / Zikopoulos / 817-5
Big Data is all about better analytics on a broader spectrum of data, and
therefore represents an opportunity to create even more differentiation
among industry peers. This is a key point that’s often overlooked: no one has
ever delivered a single penny of value out of storing data. Many vendors are
talking about Big Data, but we’re not seeing much more than the ability to
store large volumes of data, leaving the organization to “roll their own”
applications without much help to make sense of it all. Real value can only
emerge from a consumable analytics platform that saves you from having to
build applications from scratch—one that effectively flattens the time-to-
insight curve. Big Data is truly all about analytics.
The joint IBM/MIT study described in The New Intelligent Enterprise also
found that the number of enterprises using analytics in an attempt to create
a competitive advantage had jumped by almost 60 percent since its previous
iteration, which was conducted one year earlier. The study concludes with
the observation that nearly six out of ten organizations are now differentiat-
ing through analytics.
Quite simply, early analytics adopters are extending their leadership. If
you want to lead, you have to know analytics, and if you want to be on the
forefront of analytics, you have to put your arms around Big Data.
Now, the “What Is Big Data?” Part
A number of years ago, IBM introduced its Smarter Planet campaign (“Instru-
mented, Interconnected, and Intelligent”), which foreshadowed the Big Data
craze that hit the IT landscape just a few short years later.
We think that Walmart’s push to use radio frequency identification (RFID)
tags for supply chain optimization is a great story that illustrates the dawn of
the Big Data era. RFID is a great example of machine-speed-generated data
that could be collected and analyzed. Today, the world has become much
more instrumented and interconnected thanks to many technologies, includ-
ing RFID tagging. Examples of RFID technology today include tracking
products at the skid level or the stock-keeping unit (SKU) level; tracking live-
stock; using badges to track conference attendees; monitoring the tempera-
ture of food in transit; tracking luggage (from our experience as frequent
travelers, there’s lots of room for improvement here); monitoring the health
of a bridge’s concrete structure; and monitoring the heat-related expansion
of railroad tracks for speed regulation, among thousands of other use cases.
01-ch01.indd 4 04/10/12 10:53 AM
36.
What Is BigData? 5
Flash 6X9 / Harness the Power of Big Data:The IBM Big Data Platform / Zikopoulos / 817-5
In 2005, there were an estimated 1.3 billion RFID tags in circulation; by the
end of 2011, this number had risen to 30 billion! Now consider that RFID
price points are expected to drop below 1 US cent by 2015, and that there are
all kinds of other sensory and measurement technologies already available;
in fact, we’d argue at this point, the world can pretty much measure almost
anything it wants.
From an instrumentation perspective, what doesn’t have some amount of
coding in it today? Just look at your car: you can’t diagnose a problem these
days without hooking a computer up to it. Today’s hardware network switches
have more software code than components in them. The latest passenger air-
planes are instrumented with over one billion lines of code that generates
about 10 terabytes (TB) of data, per engine, during every half hour of opera-
tion. Let’s put that in perspective: A single flight from London’s Heathrow
Airport to John F. Kennedy in New York would generate about 650TB of data!
That’s likely more data than what you have sitting in your warehouse today.
Most of this data is likely never looked at, unless disaster strikes. Imagine the
efficiencies, potential disaster prevention, insights, and other optimization
opportunities if all of the data were cost-effectively analyzed.
One important enterprise differentiator is the ability to capture data that’s
getting “dropped to the floor”; this type of data can yield incredible insights
and results, because it enriches the analytics initiatives going on in your
organization today. Data exhaust is the term we like to use for this kind of
data: it’s generated in huge amounts (often terabytes per day) but typically
isn’t tapped for business insight. Online storefronts fail to capture terabytes
of generated clickstreams to perform web sessionization, optimize the “last
mile” shopping experience, and perhaps understand why online shopping
baskets are getting abandoned. Mountains of data could be collected and
analyzed to judge the health of an oil rig. Log files for your most important
networks could be analyzed for trends when nothing obvious has gone
wrong to find the “needle in the stack of needles” that potentially indicates
downstream problems. There’s an “if ” here that tightly correlates with the
promise of Big Data: “If you could collect and analyze all the data…” We like
to refer to the capability to analyze all the data as whole population analytics.
It’s one of the value propositions of Big Data. It’s a consideration on the kind
of predictions and insights your analytic programs could make if they
weren’t restricted to samples and subsets of the data.
01-ch01.indd 5 04/10/12 10:53 AM
37.
6 Harnessthe Power of Big Data: The IBM Big Data Platform
Flash 6X9 / Harness the Power of Big Data:The IBM Big Data Platform / Zikopoulos / 817-5
Today, many utilities are moving to smart meters and grids as part of long-
range plans to ensure a reliable energy supply, incorporate distributed genera-
tion resources, and enable customers to have more control over their energy
use. Many are deploying smart meter systems as a first step, which presents an
immediate technical challenge: Going from one meter reading a month to
smart meter readings every 15 minutes works out to 96 million reads per day
for every million meters: a 3,000-fold increase in data collection rates! As you
can imagine, such rates could be crippling if not properly managed.
There’s an upside, of course. The additional data opens up new opportu-
nities, enabling energy companies to do things they never could do before.
Data gathered from smart meters can provide a better understanding of cus-
tomer segmentation and behavior, and of how pricing influences usage—but
only if companies have the ability to use such data. For example, time-of-use
pricing encourages cost-savvy energy consumers to run their laundry facili-
ties, air conditioners, and dishwashers at off-peak times. But the opportuni-
ties don’t end there. With the additional information that’s available from
smart meters and smart grids, it’s possible to transform and dramatically
improve the efficiency of electrical generation and scheduling.
Smart meters are smart because they can communicate, not only with the
consumer about electricity usage and pricing, but also with the utility pro-
vider about fluctuations in power or the precise location of outages. Smart
meters are generating a wealth of new information that’s fundamentally
changing the way that utility companies interact with their customers.
What about the advent of the prosumer, a new consumer class that’s also a
producer. Prosumers generate power through solar panels and sell it back to
the grid; this too has ripple effects across the supply chain. Using predictive
analytics on their data, companies can make a wide range of forecasts, such as
excess energy calculations with sell and transmittal considerations, typical fail-
ure points and grid downtime locations, and which clients are likely to feed
energy back to the grid and when they are likely to do so.
Now consider the additional impact of social media. A social layer on top of
an instrumented and interconnected world generates a massive amount of
data too. This data is more complex, because most of it is unstructured (images,
Twitter tweets, Facebook posts, micro-blog commentaries, and so on). If you
eat Frito-Lay SunChips, you might remember its move to the world’s first
biodegradable environmentally friendly chip bag; you might also remember
01-ch01.indd 6 04/10/12 10:53 AM
38.
What Is BigData? 7
Flash 6X9 / Harness the Power of Big Data:The IBM Big Data Platform / Zikopoulos / 817-5
how loud the packaging was. Customers created thousands of YouTube videos
showing how noisy the environmentally friendly bag was. A “Sorry, but I can’t
hear you over this SunChips bag” Facebook page had over 50,000 likes, and
bloggers let their feelings be known. In the end, Frito-Lay introduced a new qui-
eter SunChips bag, demonstrating the power and importance of social media.
For a number of years, Facebook was adding a new user every three
seconds; today these users collectively generate double-digit terabytes of data
every day. In fact, in a typical day, Facebook experiences over 2.5 billion likes
and 300 million photo uploads. The format of a Facebook post is indeed struc-
tured data; it’s marked up in the JavaScript Object Notation (JSON) format:
{
"data": [
{ "id": "53423432999_23423423_19898799",
"from": { "name": "Paul Zikopoulos", "id": "Z12" },
"message": "Thinking of surprising my wife with a quality time gift that
lets her know she's special, any ideas? I thought about taking her to
the driving range, perhaps play a round and caddie my game.",
"created_time": "2012-08-02T21:27:44+0000", "likes: 5,"
"comments": { "data": [ { "id": 2847923942_723423423",
"from": { "name": "MaryAnne Infanti", "id": "948574763" },
"message": "Paul! Purses and gold! Costco’s got a great Kate Spade purse
on sale this week that says I love you without having to lift a pen.
If you go with your idea, the only thing driving will be you: alone! ",
"created_time 2012-00-02T11:27:44+0000", "likes: 64 } }
Although there is no doubt that this Facebook posting is structured, it’s
the unstructured part that has even more potential value; it holds the intent of
a bad plan and commentary that strongly suggests what a better plan might
be. The structured data is easy to store and analyze; however, analyzing its
unstructured components for intent, sentiment, and so on is very hard, but
it’s got the potential to be very rewarding, if…
Twitter is another phenomenon. The world has taken to generating double-
digit terabytes of short opinions (140 characters or less) and commentary (often
unfiltered) about sporting events, sales, images, politics, and more. Twitter is yet
another medium that provides enormous amounts of data that’s structured in
format, but it’s the unstructured part within the structure that holds most of the
untapped value. Consider that Noah Kravitz (@noahkravitz), prior to leaving
his company for a competitor, had over 25,000 followers when he worked for a
certain company. When he resigned, that former employer sued him, claiming
that Mr. Kravitz’s Twitter followers represented a client list belonging to
01-ch01.indd 7 04/10/12 10:53 AM
39.
8 Harnessthe Power of Big Data: The IBM Big Data Platform
Flash 6X9 / Harness the Power of Big Data:The IBM Big Data Platform / Zikopoulos / 817-5
the employer (imagine your own name the subject of a court case). This case is
before the courts today and will certainly set a precedent, but it illustrates that
there is at least perceived, if not factual, value (we think it’s the latter) embodied
within the Twitter ecosystem.
Most of today’s collected data is also temporally and spatially enriched.
For example, we know where one of the stars of the television show Myth
Busters lives—not because he told us, but because he tweeted a picture of his
car with location-based services (LBS) enabled on his smart device and ended
up sharing his home’s geographic (LAT/LONG) coordinates with over
650,000 of his closest friends! Most people don’t know what LBS is, but they
have it turned on because they’re using some mobile mapping application.
These days, folks just let you know when they’ve checked in at the gym or
what restaurant they’re in through social apps that just convert geographic
coordinates into easily identifiable places. Such data often has built-in loca-
tion awareness, which represents another tremendous opportunity for finer
granularities of personalization or profiled risk assessment, if… Today, a
number of major credit card companies have programs based on this
approach that you can join; for example, if you purchase a coffee using your
credit card, they will profile your location (via LBS), your purchase history,
and make an offer that is tailored to you from a retailer in the proximity of
your current location.
Time stamps are ubiquitous, and include, among others, the autodating
metadata on the pictures that were taken with your camera or smart phone,
the time of your Facebook posts, and the times when you turn on your smart
phone or watch your favorite show, and so on; in fact, it’s getting kind of easy
to construct a timeline of your life. If you consider that, on average, commuters
in London, England will have their picture taken over 150 times a day as they
make their way home from London’s downtown core, and then add that to
the variety of sentiment, temporal, and spatial data that’s generated during
that time frame, you’ve got a lot of information—Big Data information—at
your disposal.
01-ch01.indd 8 04/10/12 10:53 AM
40.
What Is BigData? 9
Flash 6X9 / Harness the Power of Big Data:The IBM Big Data Platform / Zikopoulos / 817-5
Brought toYou by the Letter V:
How We Define Big Data
To keep things simple, we typically define Big Data using four Vs; namely,
volume, variety, velocity, and veracity. We added the veracity characteristic
recently in response to the quality and source issues our clients began facing
with their Big Data initiatives. Some analysts include other V-based descriptors,
such as variability and visibility, but we’ll leave those out of this discussion.
No Question About It: Data Volumes Are on the Rise
Volume is the obvious Big Data trait. At the start of this chapter we rhymed
off all kinds of voluminous statistics that do two things: go out of date the
moment they are quoted and grow bigger! We can all relate to the cost of
home storage; we can remember geeking out and bragging to our friends
about our new 1TB drive we bought for $500; it’s now about $60; in a couple
of years, a consumer version will fit on your fingernail.
The thing about Big Data and data volumes is that the language has
changed. Aggregation that used to be measured in petabytes (PB) is now
referenced by a term that sounds as if it’s from a Star Wars movie: zettabytes
(ZB). A zettabyte is a trillion gigabytes (GB), or a billion terabytes!
Since we’ve already given you some great examples of the volume of data
in the previous section, we’ll keep this section short and conclude by refer-
encing the world’s aggregate digital data growth rate. In 2009, the world had
about 0.8ZB of data; in 2010, we crossed the 1ZB marker, and at the end of
2011 that number was estimated to be 1.8ZB (we think 80 percent is quite the
significant growth rate). Six or seven years from now, the number is esti-
mated (and note that any future estimates in this book are out of date the
moment we saved the draft, and on the low side for that matter) to be around
35ZB, equivalent to about four trillion 8GB iPods! That number is astonish-
ing considering it’s a low-sided estimate. Just as astounding are the chal-
lenges and opportunities that are associated with this amount of data.
Variety Is the Spice of Life
The variety characteristic of Big Data is really about trying to capture all of the
data that pertains to our decision-making process. Making sense out of
unstructured data, such as opinion and intent musings on Facebook, or analyz-
ing images, isn’t something that comes naturally for computers. However, this
01-ch01.indd 9 04/10/12 10:53 AM
41.
10 Harnessthe Power of Big Data: The IBM Big Data Platform
Flash 6X9 / Harness the Power of Big Data:The IBM Big Data Platform / Zikopoulos / 817-5
kind of data complements the data that we use to drive decisions today. Most
of the data out there is semistructured or unstructured. (To clarify, all data has
some structure; when we refer to unstructured data, we are referring to the sub-
components that don’t have structure, such as the freeform text in a comments
field or the image in an auto-dated picture.)
Consider a customer call center; imagine being able to detect the change in
tone of a frustrated client who raises his voice to say, “This is the third outage
I’ve had in one week!” A Big Data solution would not only identify the terms
“third” and “outage” as negative polarity trending to consumer vulnerability,
but also the tonal change as another indicator that a customer churn incident
is trending to happen. All of this insight can be gleaned from unstructured
data. Now combine this unstructured data with the customer’s record data
and transaction history (the structured data with which we’re familiar), and
you’ve got a very personalized model of this consumer: his value, how brittle
he’s become as your customer, and much more. (You could start this usage
pattern by attempting to analyze recorded calls not in real time, and mature
the solution over time to one that analyzes the spoken word in real time.)
An IBM business partner, TerraEchos, has developed one of the most
sophisticated sound classification systems in the world. This system is used
for real-time perimeter security control; a thousand sensors are buried under-
ground to collect and classify detected sounds so that appropriate action can
be taken (dispatch personnel, dispatch aerial surveillance, and so on) depend-
ing on the classification. Consider the problem of securing the perimeter of
a nuclear reactor that’s surrounded by parkland. The TerraEchos system can
near-instantaneously differentiate the whisper of the wind from a human
voice, or the sound of a human footstep from the sound of a running deer.
In fact, if a tree were to fall in one of its protected forests, TerraEchos can affirm
that it makes a sound even if no one is around to hear it. Sound classification
is a great example of the variety characteristic of Big Data.
How Fast CanYou Analyze?The Velocity of Your Data
One of our favorite but least understood characteristics of Big Data is velocity.
We define velocity as the rate at which data arrives at the enterprise and is
processed or well understood. In fact, we challenge our clients to ask them-
selves, once data arrives at their enterprise’s doorstep: “How long does it
take you to do something about it or know it has even arrived?”
01-ch01.indd 10 04/10/12 10:53 AM
42.
What Is BigData? 11
Flash 6X9 / Harness the Power of Big Data:The IBM Big Data Platform / Zikopoulos / 817-5
Think about it for a moment. The opportunity cost clock on your data
starts ticking the moment the data hits the wire. As organizations, we’re tak-
ing far too long to spot trends or pick up valuable insights. It doesn’t matter
what industry you’re in; being able to more swiftly understand and respond
to data signals puts you in a position of power. Whether you’re trying to
understand the health of a traffic system, the health of a patient, or the health
of a loan portfolio, reacting faster gives you an advantage. Velocity is per-
haps one of the most overlooked areas in the Big Data craze, and one in
which we believe that IBM is unequalled in the capabilities and sophistica-
tion that it provides.
In the Big Data craze that has taken the marketplace by storm, everyone
is fixated on at-rest analytics, using optimized engines such the Netezza
technology behind the IBM PureData System for Analytics or Hadoop to
perform analysis that was never before possible, at least not at such a large
scale. Although this is vitally important, we must nevertheless ask: “How
do you analyze data in motion?” This capability has the potential to provide
businesses with the highest level of differentiation, yet it seems to be somewhat
overlooked. The IBM InfoSphere Streams (Streams) part of the IBM Big Data
platform provides a real-time streaming data analytics engine. Streams is a
platform that provides fast, flexible, and scalable processing of continuous
streams of time-sequenced data packets. We’ll delve into the details and
capabilities of Streams in Part III, “Analytics for Big Data in Motion.”
You might be thinking that velocity can be handled by Complex Event
Processing (CEP) systems, and although they might seem applicable on the
surface, in the Big Data world, they fall very short. Stream processing enables
advanced analysis across diverse data types with very high messaging data
rates and very low latency (µs to s). For example, one financial services sector
(FSS) client analyzes and correlates over five million market messages/
second to execute algorithmic option trades with an average latency of 30
microseconds. Another client analyzes over 500,000 Internet protocol detail
records (IPDRs) per second, more than 6 billion IPDRs per day, on more than
4PB of data per year, to understand the trending and current-state health of their
network. Consider an enterprise network security problem. In this domain,
threats come in microseconds so you need technology that can respond and
keep pace. However you also need something that can capture lots of data
01-ch01.indd 11 04/10/12 10:53 AM
43.
12 Harnessthe Power of Big Data: The IBM Big Data Platform
Flash 6X9 / Harness the Power of Big Data:The IBM Big Data Platform / Zikopoulos / 817-5
quickly, and analyze it to identify emerging signatures and patterns on the
network packets as they flow across the network infrastructure.
Finally, from a governance perspective, consider the added benefit of a Big
Data analytics velocity engine: If you have a powerful analytics engine that
can apply very complex analytics to data as it flows across the wire, and you
can glean insight from that data without having to store it, you might not
have to subject this data to retention policies, and that can result in huge sav-
ings for your IT department.
Today’s CEP solutions are targeted to approximately tens of thousands of
messages/second at best, with seconds-to-minutes latency. Moreover, the
analytics are mostly rules-based and applicable only to traditional data
types (as opposed to the TerraEchos example earlier). Don’t get us wrong;
CEP has its place, but it has fundamentally different design points. CEP is a
non-programmer-oriented solution for the application of simple rules to
discrete, “complex” events.
Note that not a lot of people are talking about Big Data velocity, because
there aren’t a lot of vendors that can do it, let alone integrate at-rest technolo-
gies with velocity to deliver economies of scale for an enterprise’s current
investment. Take a moment to consider the competitive advantage that your
company would have with an in-motion, at-rest Big Data analytics platform,
by looking at Figure 1-1 (the IBM Big Data platform is covered in detail in
Chapter 3).
You can see how Big Data streams into the enterprise; note the point at
which the opportunity cost clock starts ticking on the left. The more time
that passes, the less the potential competitive advantage you have, and the
less return on data (ROD) you’re going to experience. We feel this ROD
metric will be one that will dominate the future IT landscape in a Big Data
world: we’re used to talking about return on investment (ROI), which
talks about the entire solution investment; however, in a Big Data world,
ROD is a finer granularization that helps fuel future Big Data investments.
Traditionally, we’ve used at-rest solutions (traditional data warehouses,
Hadoop, graph stores, and so on). The T box on the right in Figure 1-1
represents the analytics that you discover and harvest at rest (in this case,
it’s text-based sentiment analysis). Unfortunately, this is where many
01-ch01.indd 12 04/10/12 10:53 AM
44.
What Is BigData? 13
Flash 6X9 / Harness the Power of Big Data:The IBM Big Data Platform / Zikopoulos / 817-5
vendors’ Big Data talk ends. The truth is that many vendors can’t help you
build the analytics; they can only help you to execute it. This is a key
differentiator that you’ll find in the IBM Big Data platform. Imagine being
able to seamlessly move the analytic artifacts that you harvest at rest and
apply that insight to the data as it happens in motion (the T box by the
lightning bolt on the left). This changes the game. It makes the analytic
model adaptive, a living and breathing entity that gets smarter day by day
and applies learned intelligence to the data as it hits your organization’s
doorstep. This model is cyclical, and we often refer to this as adaptive
analytics because of the real-time and closed-loop mechanism of this
architecture.
The ability to have seamless analytics for both at-rest and in-motion data
moves you from the forecast model that’s so tightly aligned with traditional
warehousing (on the right) and energizes the business with a nowcast model.
The whole point is getting the insight you learn at rest to the frontier of the
business so it can be optimized and understood as it happens. Ironically, the
more times the enterprise goes through this adaptive analytics cycle,
0101001010100111001010011110010001001000100100010001001
01011001100011101001001001001
11000100101001001011001001010
01100100101001001010100010010
01100100101001001010100010010
11000100101001001011001001010
01100100101001001010100010010
01100100101001001010100010010
Opportunity Cost
Starts Here
01100100101001001010100010010
01100100101001001010100010010
11000100101001001011001001010
01100100101001001010100010010
01100100101001001010100010010
01100100101001001010100010010
01100100101001001010100010010
01100100101001001010100010010
11000100101001001011001001010
01100100101001001010100010010
01100100101001001010100010010
01100100101001001010100010010
11000100101001001011001001010
1
1
10
01
01
01
01
01
01
01
1
1
101
01
01
01
01010
010
010
010
010
010
010
010
01
010
010
010
010
010
010
0
00
0
0
0
0
0
0
0
0
0
0
1010
0
0
0
0
0
0
0
0
0010
010
010
010010
010
010
0
01011
1010
0
0
0
0010
10
10
10
0
0
0
0
0
10
10
1
1 010
010
010
0
010
1
1
0
0
0
0
0
0
0
0 10
1010
0
0
0
0
0
0
0
0
10
10
0
10
1
10
0
0
0010
0
010
0
0
0
010
010
0
010
010
0
01
010
010
010
010
010
0
0 010
0
010
010
0
0
0
0
0
0
0
0 10
1010
10
10
10
10
10
10
1
10
10
10
0
1
10
0
10
0
1 010
0
010
1
1
01
1
0
0
0
0
01
0
01
010
01
01
0 010
010
0
0
0
0
01
1
1010
1010
01
01
01
01
01
1
1
01
1 01001011
1100
1
100
00
0101
1
101
101
101
101
101
101
101
1
1
101
101001
0
0
01
01
01
1
1
11
1
1
1
1
01
1
1
1
01
1
1
Adaptive
Analytics
Model
Forecast
Nowcast
Bootstrap
Enrich
Data
Ingest
Figure 1-1 A real-time analytics-processing (RTAP) ecosystem
01-ch01.indd 13 04/10/12 10:53 AM
45.
14 Harnessthe Power of Big Data: The IBM Big Data Platform
Flash 6X9 / Harness the Power of Big Data:The IBM Big Data Platform / Zikopoulos / 817-5
the more intelligent it becomes. If you’re familiar with control systems or
control theory, which adapt based on observations, it’s a similar kind of loop-
ing process. As a simple analogy, think about how much easier it is to finish
a puzzle when it’s almost done, or even when you have the outside framed.
In an RTAP system, the more pieces you identify and bring to the frontier of
the business, the more complete a picture you have of the topic of interest,
and you have it earlier in the cycle.
Data Here, DataThere,
Data, Data Everywhere:The Veracity of Data
Veracity is a term that’s being used more and more to describe Big Data; it
refers to the quality or trustworthiness of the data. Tools that help handle Big
Data’s veracity transform the data into trustworthy insights and discard
noise.
Collectively, a Big Data platform gives businesses the opportunity to ana-
lyze all of the data (whole population analytics), and to gain a better under-
standing of your business, your customers, the marketplace, and so on. This
opportunity leads to the Big Data conundrum: although the economics of
deletion have caused a massive spike in the data that’s available to an orga-
nization, the percentage of the data that an enterprise can understand is on
the decline. A further complication is that the data that the enterprise is try-
ing to understand is saturated with both useful signals and lots of noise (data
that can’t be trusted, or isn’t useful to the business problem at hand), as
shown in Figure 1-2.
We all have firsthand experience with this; Twitter is full of examples of
spambots and directed tweets, which is untrustworthy data. The
Figure 1-2 As the amount of data that is available to an organization increases, the
relative amount of data that it can process decreases.
01-ch01.indd 14 04/10/12 10:53 AM
46.
What Is BigData? 15
Flash 6X9 / Harness the Power of Big Data:The IBM Big Data Platform / Zikopoulos / 817-5
2012 presidential election in Mexico turned into a Twitter veracity example
with fake accounts, which polluted political discussion, introduced de-
rogatory hash tags, and more. Spam is nothing new to folks in IT, but you
need to be aware that in the Big Data world, there is also Big Spam poten-
tial, and you need a way to sift through it and figure out what data can and
can’t be trusted. Of course, there are words that need to be understood in
context, jargon, and more (we cover this in Chapter 8).
As previously noted, embedded within all of this noise are useful signals:
the person who professes a profound disdain for her current smartphone
manufacturer and starts a soliloquy about the need for a new one is express-
ing monetizable intent. Big Data is so vast that quality issues are a reality, and
veracity is what we generally use to refer to this problem domain. The fact
that one in three business leaders don’t trust the information that they use to
make decisions is a strong indicator that a good Big Data platform needs to
address veracity.
What About My Data Warehouse
in a Big Data World?
There are pundits who insist that the traditional method of doing analytics is
over. Sometimes these NoSQL (which really means Not Only SQL) pundits
suggest that all warehouses will go the way of the dinosaur—ironic, consid-
ering a lot of focus surrounding NoSQL databases is about bringing SQL inter-
faces to the runtime. Nothing could be further from the truth. We see a number
of purpose-built engines and programming models that are well suited for
certain kinds of analytics. For example, Hadoop’s MapReduce programming
model is better suited for some kinds of data than traditional warehouses.
For this reason, as you will learn in Chapter 3, the IBM Big Data platform
includes a Hadoop engine (and support for other Hadoop engines as well,
such as Cloudera). What’s more, IBM recognizes the flexibility of the
programming model, so the IBM PureData System for Analytics (formerly
known as Netezza) can execute MapReduce programs within a database. It’s
really important in the Big Data era that you choose a platform that provides
the flexibility of a purpose-built engine that’s well suited for the task at hand
(the kind of analytics you are doing, the type of data you are doing it on, and
so on). This platform must also allow you to seamlessly move programming
01-ch01.indd 15 04/10/12 10:53 AM
47.
16 Harnessthe Power of Big Data: The IBM Big Data Platform
Flash 6X9 / Harness the Power of Big Data:The IBM Big Data Platform / Zikopoulos / 817-5
skills, APIs, and assets across the platform so that the analytics can be applied
to an engine that’s optimized for the data at hand. For example, the IBM Big
Data platform lets you take text analytics that are built via its Annotated
Query Language (AQL) and seamlessly deploy them from an at-rest Ha-
doop engine into its Streams Big Data velocity engine. Most of the MapRe-
duce programs that you code in Hadoop can be run in the IBM PureData
System for Analytics; the SQL reports that you generate on IBM pureSys-
tems for Operational Analytics (formerly known as the IBM Smart Analytics
System) can pretty much be deployed without change on DB2 for z/OS.
When you consider where data should be stored, it’s best to first under-
stand how data is stored today and what features characterize your persis-
tence options. Data that’s stored in a traditional data warehouse goes through
a lot of processing before making it into the warehouse. The data is expected
to be of high quality once it lands in the warehouse, and so it’s cleaned up
through enrichment, matching, glossaries, metadata, master data manage-
ment, modeling, and other quality services that are attached to the data before
it’s ready for analysis. Obviously, this can be an expensive process, and the
data that lands in a warehouse is viewed as having both high value and
broad purpose: it’s going places and will appear in reports and dashboards
where accuracy is key.
In contrast, data in some of the newer Big Data repositories rarely under-
goes (at least initially) such rigorous preprocessing because that would be
cost-prohibitive, and the work in these repositories is subject to more discov-
ery than known value. What’s more, each repository has different character-
istics with different tradeoffs. One might prioritize on the application of ACID
(atomicity, consistency, isolation, and durability) properties, and another might
operate in a relaxed consistency state where the BASE properties (basically
available, soft state, and eventually consistent) can be tolerated.
We like to use a gold mining analogy to articulate the opportunity of Big
Data. In the “olden days” (which, for some reason, our kids think is a time
when we were their age), miners could easily spot nuggets or veins of gold,
as they were visible to the naked eye. Let’s consider that gold to be “high
value-per-byte data”; you can see its value and therefore you invest resources
to extract it. But there is more gold out there, perhaps in the hills nearby or
miles away; it just isn’t visible to the naked eye, and trying to find this hidden
01-ch01.indd 16 04/10/12 10:53 AM
48.
What Is BigData? 17
Flash 6X9 / Harness the Power of Big Data:The IBM Big Data Platform / Zikopoulos / 817-5
gold becomes too much of a gambling game. Sure, history has its gold rush
fever stories, but nobody ever mobilized millions of people to dig everywhere
and anywhere; that would be too expensive. Today’s miners work differently.
Gold mining leverages massive capital equipment that can process millions
of tons of dirt (low value-per-byte data) to find nearly invisible strands of
gold (ore grades of 30 ppm are usually needed before gold is visible to the
naked eye). In other words, there’s a great deal of gold (high value-per-byte
data) in all of this dirt (low value-per-byte data), and with the right equip-
ment, you can economically process lots of dirt and keep the flakes of gold
that you find. The flakes of gold are taken for processing (perhaps to your
data warehouse or another insight engine) and combined to make a bar of
gold, which is stored and logged in a place that’s safe, governed, valued, and
trusted. The gold industry is working on chemical washes that aim to reveal
even finer granularizations of gold to find more value out of previously
extracted dirt (now think data). We think this analogy fits well into our Big
Data story because we’re willing to bet that if you had a corpus composed of
ten years of your transaction data, new analytic approaches will let you
extract more insight out of it three years from now than you can with
today’s technology.
In addition, if you look at the access patterns that characterize a data ware-
house and a Hadoop repository, one differentiator you’ll find is that a data
warehouse is often characterized by response times that allow you to work
with the system interactively. Indeed, terms such as “speed-of-thought
response times” aren’t the descriptors you’re going to find associated with a
batch system, which is what Hadoop is, for now.
A Big Data platform lets you store all of the data in its native business
object format and get value out of it through mass parallelism on commodity
components. For your interactive navigational needs, you’ll continue to pick
and choose sources, cleanse that data, and keep it in warehouses. But you can
get more value out of having a large amount of lower-fidelity data by pulling
in what might seem to be unrelated information to form a more robust pic-
ture. In other words, data might sit in Hadoop for a while, and when its value
becomes proven and sustainable, it can be migrated to the warehouse.
The difference between observed value and discovery is not as black and
white as we have described here. For example, a common use case for a
01-ch01.indd 17 04/10/12 10:53 AM
49.
18 Harnessthe Power of Big Data: The IBM Big Data Platform
Flash 6X9 / Harness the Power of Big Data:The IBM Big Data Platform / Zikopoulos / 817-5
Hadoop engine is to provide database archiving services to a data warehouse,
taking data that’s no longer “warm” or “hot” and moving it to a lower-cost
storage platform that is backed by Hadoop. For example, a customer profiling
system keeps hot data for two years, but all of the data collected over the
course of a 20-year relationship might still be valuable. An insurance company
could benefit from understanding how your profile has evolved from being a
single person, then married, then with kids, while considering current trends
or events (this is especially true with wealth management portfolios).
Of course, the portability of the query API is of key importance in this
scenario; for example, not having to recode your SQL-based applications
when accessing cold data that was moved to Hadoop (the IBM Big Data plat-
form lets you do this). Another example, and Big Data platform requirement,
is the integration between the SQL and NoSQL worlds. You might have a
consumer vulnerability job running in your relational warehouse but choose
to launch a Hadoop-based sentiment job on your brand that could impact the
final vulnerability assessment. At the same time, you might have a running
Hadoop job that is analyzing terabytes of clickstream log data, and you now
want to extract purchase information from the system of record to under-
stand what other factors lead to a successful purchase or abandonment of
past online shopping carts. (Now consider if you can take that logic and
apply it to shopping carts as they are being populated in real time.)
Traditional engines and new data processing engines (Hadoop and others)
will become the left and right arm of an organization. The key is ensuring that
your Big Data platform provider delivers integration technologies that enable
those arms to be used in tandem.
As a final analogy, consider a baseball player. A typical baseball player is
very strong at throwing with one hand and catching with the other; the brain
coordinates the activities of these limbs for optimized results. If a baseball
player were to try to throw or catch a ball with his nondominant hand, he
might be able to do it, but it won’t be smooth, crisp, or look very professional.
And with the exception of a few professional baseball players who have only
one hand (such as JimAbbott, www.jimabbott.net), you don’t really see baseball
players catch a ball, and then take their glove off to throw the ball with the same
hand. This is the NoSQL and SQL analogy; each is optimized for specific tasks
and data and it’s important to play ball with two hands.
01-ch01.indd 18 04/10/12 10:53 AM
50.
What Is BigData? 19
Flash 6X9 / Harness the Power of Big Data:The IBM Big Data Platform / Zikopoulos / 817-5
Wrapping It Up
In this chapter, we provided a general framework that you can use to identify
Big Data. We explained why the enhanced analytic capability that can be de-
rived from it represents an inflection point. We used the terms volume, variety,
velocity, and veracity to give you an easy-to-remember way to understand
and classify a Big Data opportunity. The Big Data era is all about enhancing
analytics through a purpose-built Big Data platform that introduces new
methods and techniques and synergizes them with just as important tradi-
tional solutions you have running today. As such, Big Data discussions should
never start out with “let’s migrate off our current warehouse technology.”
These approaches complement one another, and just like the athlete who coor-
dinates multiple skills for superb performance, so too will the IBM Big Data
platform power-up the instantiation of your successful and business-differen-
tiating Big Data initiatives.
01-ch01.indd 19 04/10/12 10:53 AM
51.
Flash 6X9 /Harness the Power of Big Data:The IBM Big Data Platform / Zikopoulos / 817-5
00-FM.indd 16 04/10/12 12:19 PM
This page intentionally left blank
52.
Flash 6X9 /Harness the Power of Big Data:The IBM Big Data Platform / Zikopoulos / 817-5
21
2
Applying Big Data to
Business Problems: A
Sampling of Use Cases
This chapter’s title describes exactly what we’re going to cover: how Big
Data can be applied to help solve business problems. We’ll illustrate Big Data’s
ability to enhance the business and solve previously insurmountable (or greatly
simplify difficult) problems using selected use cases and some commentary on
the mechanics of getting going with Big Data. We’ll touch on how we helped
clients develop new applications and what potential approaches you can use to
solve previously difficult challenges. We’ll also talk about how new ways of
doing things can fundamentally change your approach to problem solving.
When to Consider a Big Data Solution
Are you limited by your current platform or environment because you can’t
process the amount of data that you want to process? Do you want to involve
new sources of data in the analytics paradigm, but you can’t, because it
doesn’t fit into schema-defined rows and columns without sacrificing fidelity
or the richness of the data? Do you need to ingest data as quickly as possible
and need to work with a schema-on-demand paradigm? Are you being forced
into a schema-on-write approach (the schema must be created before data is
loaded), but you need to ingest data quickly, or perhaps in a discovery process,
and want the cost benefits of a schema-on-read approach (data is simply
02-ch02.indd 21 03/10/12 7:00 PM
53.
Flash 6X9 /Harness the Power of Big Data:The IBM Big Data Platform / Zikopoulos / 817-5
22 Harness the Power of Big Data: The IBM Big Data Platform
copied to the file store, and no special transformation is needed) until you
know that you’ve got something that’s ready for analysis? Is the data arriving
too fast at your organization’s doorstep for the current analytics platform
to handle? If your answers to any of these questions are “yes,” you need to
consider a Big Data solution.
In Chapter 1, we outlined the characteristics that help you spot Big Data
(velocity, volume, veracity, and variety). We also noted that most of the new
Big Data solutions that you might hear about are more likely to complement,
rather than replace, your current analytics platform (such as a trusted data
warehouse). Together, such complementary approaches can help boost your
company’s Big Data IQ.
Let’s begin with a good example of how we helped solve a business problem
with Big Data technology. We helped a major company in the financial service
sector (FSS) understand why they were experiencing increasing attrition and
defection rates. We started by examining an entire month’s worth of email
(about 40 million messages) from their Customer Service center. In this case,
the volume of stored data wasn’t large by any means, but we still used IBM
InfoSphere BigInsights (BigInsights)—IBM’s nonforked Hadoop distribu-
tion—because the compute capacity required to perform the analytics was
large. A different approach was needed to chew through the emails quickly
and accurately. Moreover, we didn’t know what to expect, so we wanted
maximum flexibility in the scale, types of information, and methods we
could use to performance the analysis. We also didn’t know what we would
find, and we wanted the flexibility of acquiring insight by “snapping in”
other data sources; in this case, web browsing behavior, structured accounting
data, and account performance history. It’s this sort of flexibility that’s often
key in solving problems and moving projects forward. We wanted to start
with this example because it highlights some of the recurring use case pat-
terns that we often see. Specifically this use case provides examples of the
following patterns:
• Need to move from a small history (months) to several years
• Inclusion of mixed information types, in this case structured account
history along with email
• Cross system workflows that required specific file export formatting
that was accomplished in a scripting language that was different than
how the data was originally prepared
02-ch02.indd 22 03/10/12 7:00 PM
54.
Applying Big Datato Business Problems: A Sampling of Use Cases 23
Flash 6X9 / Harness the Power of Big Data:The IBM Big Data Platform / Zikopoulos / 817-5
• Utilization of compute intensive NLP (natural language processing)
and Machine Learning techniques.
Of course the work done on this use case led us to a set of challenges that
seem to show up every time we end up recommending a Big Data solution,
specifically:
• Big Data solutions are ideal for analyzing not just raw structured data,
but also semistructured and unstructured data from a wide variety of
sources—our insights came from the intersection of all of these sources.
• Big Data solutions are ideal when you’re not content with the
effectiveness of your algorithms or models; when all, or most, of the
data needs to be analyzed; or when a sampling of the data isn’t going
to be nearly as effective. They are also helpful when you’re not content
to just sample the data—you want to look at every interaction because
you believe it will yield a competitive advantage (it’s that whole
population analytics theme we talked about in Chapter 1).
• When business measures on the data are not predetermined, Big Data
solutions are ideal for iterative and exploratory analysis—we
deliberately took an iterative/agile approach to learning.
• Big Data solutions are ideal when you aren’t completely sure where
the investigation will take you, and you want elasticity of compute,
storage, and the types of analytics that will be pursued—all of these
became useful as we added more sources and new methods.
What’s important, really important, to notice here is that we augmented
the power of the existing analytics investment. It’s not appropriate to rip and
replace in most cases; rather, clients we work with want to increase the yields
of their current investments. With this client, we used a Big Data solution to
leverage data that was not suitable for their traditional warehouse environ-
ment along with what we knew from the warehouse.
Big Data technologies are also well suited for solving information chal-
lenges that don’t natively fit within a traditional relational database approach.
It’s important to understand that conventional database technologies are
key and relevant, and part of an overall analytic solution. In fact, they become
even more vital when used in conjunction with your Big Data platform. We
always say: “Big Data isn’t just Hadoop.” With that said, some problems
02-ch02.indd 23 03/10/12 7:00 PM
55.
Flash 6X9 /Harness the Power of Big Data:The IBM Big Data Platform / Zikopoulos / 817-5
24 Harness the Power of Big Data: The IBM Big Data Platform
can’t be addressed through traditional databases, at least not at first. And
there’s data that we’re not sure we want in the warehouse, because we don’t
know whether it’s rich in value—it’s unstructured, it’s too voluminous,
perhaps its shelf life is too short, or it just might simply be too early to know
how to formalize its structure.
Before We Start:
Big Data, Jigsaw Puzzles, and Insight
Before getting into the use cases, let’s touch on how a Big Data approach to
solving problems can be more effective when compared to conventional ap-
proaches. Before you read this section, we’ll ask you to consider these two
questions: “Is finding patterns easier or slower when dealing with Big Data?”
and “Is finding outliers easier or harder as data volumes and velocity in-
crease?” Consider your answers before reading this section, and then answer
them after reading this section.
When you first open a 2,000-piece jigsaw puzzle box and empty its con-
tents on a table, the puzzle pieces are all mixed up. By applying some basic
grouping, you can easily find the straight edges and corner pieces that frame
the puzzle. When the puzzle frame is complete, you still have about 1,900
pieces or so to fill in; just as with data, analytics are required to complete the
picture.
You can think of this simple pattern matching as traditional reporting, which
is focused on predictable, neatly shaped data that easily fits together and is
ordered. If, when you opened the puzzle box, all border shapes came wrapped
in a separate bag, and all the pieces that were yellow came in their own bag,
and so on, the puzzle wouldn’t be very hard to solve. But this isn’t how puzzles
are packaged, nor how data, for that matter, arrives at your organization’s
doorstep.
Let’s assume at this point you’ve worked on your puzzle for a couple of
hours. The outside is framed, and the middle is taking shape. You can see
some of the picture. Which state of the puzzle contains more data? When it’s
dumped out of the box into a pile of pieces, or when you can see some (but
not all) of the picture?
We suspect many people initially feel that they both contain the same
amount of data—after all, the total number of puzzle pieces hasn’t changed.
But data isn’t just about the number of rows you have, or petabytes of
02-ch02.indd 24 03/10/12 7:00 PM
56.
Applying Big Datato Business Problems: A Sampling of Use Cases 25
Flash 6X9 / Harness the Power of Big Data:The IBM Big Data Platform / Zikopoulos / 817-5
information; it’s about context and understanding. Indeed, as the puzzle
takes shape, we gain a better understanding of the problem domain. Infer-
ences can be made, relationships spotted, and we’re provided with a much
richer set of information. That said, we now have more data (and metadata)
to manage, even though we have the same number of puzzle pieces. Let us
explain: as surely as data coming together yields more insight, new relation-
ships and patterns must be managed (something you don’t have to do with
a puzzle). So, it’s fair to say that when the puzzle is 35 percent complete,
there’s more information than when it was fresh out of the box. Although we
all initially assume that dealing with more data is harder and more challeng-
ing, with patterns discovery, more data makes a problem easier to solve.
Now suppose that someone throws in some pieces from another puzzle
without your knowledge. (This experiment comes from Jeff Jonas, IBM’s Chief
Scientist for Entity Analytics; his subjects were his unsuspecting family and
friends. Be wary if Jeff breaks out a puzzle after dinner.) Faced with a heap of
puzzle pieces in which 5 percent of the pieces don’t fit, when would it be easier
to determine that the puzzle was contaminated? With the initial pile, or after
some of pieces had already been connected? Of course, the connected pieces
help illustrate the patterns, making it easier to find the contaminated outliers
and easier to solve the rest of the puzzle by eliminating those outliers. Having
more data makes outliers easier to find. Think about it for a moment: the more
complete the puzzle, the easier it is to identify patterns and the easier it is to
spot outliers (foreign pieces). See how organizations can take advantage of
more data?
Now let’s suppose that we’ve asked you to solve the world’s biggest puzzle,
which has 32,256 pieces (manufactured by Ravensburger AG in 2010). How
long would that take using two people? How about if we added two more
people (processors) and gave them a complementary but discrete task such as
looking for all the pieces that have an element of a face? How about if we
added another two people whose sole task is to look at another discrete part of
the puzzle, and so on? You get the idea, and that’s exactly how we use machines
to scale out work instead of relying on a limited number of processors. At this
point, we hope you’re starting to see why new Big Data technologies are so
important for completing the puzzle, be it the puzzle of next best offer, next
best action, curing a disease, and so on. We can’t begin to fathom how many
pieces would be part of a Big Data–era puzzle, and so scale-out, machine
learning, and massive analytical systems are needed to frame the edge, sort
and group the pieces, and discover patterns.
02-ch02.indd 25 03/10/12 7:00 PM
57.
Flash 6X9 /Harness the Power of Big Data:The IBM Big Data Platform / Zikopoulos / 817-5
26 Harness the Power of Big Data: The IBM Big Data Platform
You might be wondering about the answers to the questions we asked you
to consider at the start of this section; our answer is likely to match yours at
this point—faster and easier. Solutions that utilize large data sets are often
more helpful than those constrained to smaller data sets.
Big Data Use Cases:
Patterns for Big Data Deployment
We debated over what use cases to cover in this chapter; we started by trying
to figure out what industries don’t have use case fits for Big Data. We thought
we had a winner when someone blurted out “the Disc Jockey industry,” but
then we had one student on BigDataUniversity.com pull his entire music col-
lection into BigInsights and subsequently build some pretty cool analytics on
his music files, including a musical genomics-oriented application. So much
for that approach to narrowing the field—this led us to select use cases that
help tap patterns that appear to be common and cross-industry. For example,
reaching for new kinds of data and applying analytics as the data streams off
the collection units rigged with sensors can be used to gain better insight into
traffic systems, networks, the health of a newborn baby, loan book valua-
tions, and more.
The use patterns detailed here involve BigInsights, IBM InfoSphere Streams
(Streams), and a combination of new age Big Data engines with traditional
warehousing, such as the IBM PureData System for Analytics (formerly
known as Netezza) or the IBM PureData System for Operational Analytics
platforms. There’s a common trend across all of the cases that we cover: they
all involve a new way of doing things that’s more practical (and now finally
possible) with a Big Data platform.
You Spent the Money to
Instrument It—Now Exploit It!
In Chapter 1 we gave you all kinds of metrics and examples that illustrate
just how instrumented our world is: from bridges, to rail tracks, livestock,
conference badges, running shoes, and more, the world can collect some
kind of data from just about anything, anywhere, at any time.
02-ch02.indd 26 03/10/12 7:00 PM
58.
Applying Big Datato Business Problems: A Sampling of Use Cases 27
Flash 6X9 / Harness the Power of Big Data:The IBM Big Data Platform / Zikopoulos / 817-5
Take, for example, a typical oil drilling platform that can have 20,000 to
40,000 sensors on board.All of these sensors are streaming data about the health
of the oil rig, quality of operations, and so on. Not every sensor is actively
broadcasting at all times, but some are reporting back many times per second.
Now take a guess at what percentage of those sensors are actively utilized. If
you’re thinking in the 10 percent range (or even 5 percent), you’re either a
great guesser or you’re getting the recurring theme for Big Data that spans
industry and use cases: clients aren’t using all of the data that’s available to
them in their decision-making process. Of course, when it comes to energy
data (or any data for that matter) collection rates, it really begs the question:
“If you’ve bothered to instrument the user, device, or rig, in theory, you’ve
done it on purpose, so why are you not capturing and leveraging the infor-
mation you are collecting?”
In this usage pattern, it’s about applying the analytics you harvested at
rest and getting them applied in motion, to better understand the domain.
The University of Ontario Institute of Technology (UOIT) lead researcher (Dr.
Carolyn McGregor) partnered with The Hospital for Sick Children, Toronto,
to find a better way to predict the onset of a specific hospital-borne illness
affecting newborn babies. You can imagine these fragile babies are connected
to machines that continually collect data. Some hospitals record hourly or
half hourly spot readings and discard it after 72 hours or so; thereby missing
the ability to discover trends at rest and apply analytics in motion at a more
granular level. UOIT’s lead research, Dr. Carolyn McGregor, leveraged IBM’s
Streams technology to create an in-motion analytics platform that analyzes
over 1,000 pieces of unique medical diagnostic information per second.
Imagine the amount of sensor data for 120 babies; that’s 120,000 messages
per second, 178.8 million messages per day, analyzed! You can find more
details on this wonderful success story on the Web (search for “IBM data
baby”). Now consider expanding this approach to outpatients hooked up
to a sensor who are free to go about their daily activities, or monitoring
people at risk of chronic disease states. Quite simply, Big Data has the poten-
tial to be a game changer and a life saver.
Sensor data—it’s amazing to see how many things the world has instru-
mented (electrical grids, oil rigs, traffic flows, toll routes, and more), which
means their intention was to collect data: Big Data now lets you do some-
thing with it.
02-ch02.indd 27 03/10/12 7:00 PM
59.
Flash 6X9 /Harness the Power of Big Data:The IBM Big Data Platform / Zikopoulos / 817-5
28 Harness the Power of Big Data: The IBM Big Data Platform
IT for IT:
Data Center, Machine Data, and Log Analytics
Hadoop-based log analytics has become a common use case, but that doesn’t
mean it’s deployment is as widespread as it should be. Log analytics is actually
a pattern that IBM established after working with a number of companies,
initially in FSS. We’ve since seen this use case come up across all industries; for
that reason, we’ll call this pattern IT for IT.
Big Data–enriched IT for IT helps clients to gain better insight into how
their systems are running, and when and how things break down. For example,
one financial firm affectionately refers to the traditional way of figuring out
how an application went sideways as “Whack-A-Mole.” When things go
wrong in their heavily SOA-based environment, it’s hard to determine what
happened, because more than 20 systems are involved in the processing of a
given transaction. (We’ve all seen this movie, everyone running around the
war room saying, “I didn’t do it!” There’s also a scene in that movie where
everyone is pointing fingers…at you!)
One client we helped with this usage pattern ended up with the capability
to analyze approximately 1TB of log data each day, with less than 5 minutes
latency (this use case is just as applicable with much larger or smaller log
generation rates). Today, this client is able to decipher exactly what’s happen-
ing across their entire IT stack, within each and every transaction. When one
of their customer’s transactions, spawned from their mobile or Internet
banking sites, fails, they’re able to tell exactly where it happened and what
component contributed to the problem. As you can imagine, this flattens
time to resolution metrics.
This client could take the insights that they’ve harvested at-rest, and leverage
Streams to investigate the health of their networks in real time. For example, if
constant consumption of a memory heap in the Hibernate layer is strongly
correlated with a stack overflow in the application server, being able to pick
up this issue at its genesis could save the transaction or prevent the network
from experiencing an outage. As an example, one of our telecommunications
customers uses Streams to analyze machine data in real time to find misbe-
having mobile computing applications that are harming the networks, so the
offending applications can be terminated.
02-ch02.indd 28 03/10/12 7:00 PM
60.
Applying Big Datato Business Problems: A Sampling of Use Cases 29
Flash 6X9 / Harness the Power of Big Data:The IBM Big Data Platform / Zikopoulos / 817-5
Sometimes, we like to refer to all those logs and the trace data that’s gener-
ated by the operation of your IT solutions as data exhaust. Enterprises have
lots of data exhaust, and like any pollutant, it gets discarded because it’s
viewed as waste. Log data is often too strongly associated with high storage
costs. However, logs contain a great deal of potential insight, not only into
what’s happening to your servers now, but what will happen.
Take a moment to consider how your organization does infrastructure
budgeting. You’d like to think that it’s fact-based, but is it really? Do you have
a clear view of system utilization across the end-to-end platforms, including
trending? Do you understand the impact of seasonality and other events
across all groups and departments? We were able to show one of our customers
that they were planning new server acquisitions based on peak load
volumes that could be handled by existing idle systems. We helped them to
save several million dollars, resulting in a triple-digit ROI in the first year.
We helped another customer set up a central log clearinghouse rather than
letting each subgroup roll their own solution. This customer was storing logs
in a two-week window, then flushing them to avoid the cost of storage. Depart-
ments and application development teams that depended on these systems,
knowing that the logs were going to be flushed, would grab them and place
the logs on expensive SANs. There was no corporate-wide retention policy
or consistency in how the logs were being used by the various departments.
It’s ironic when we think about it. These logs were being flushed because
they incurred storage expense, yet they ended up being placed, in triplicate
or more, on expensive SANs without a planned purging mechanism. This
customer used BigInsights to create a centralized log clearinghouse, and real-
ized over one million dollars in savings. Specifically, they arbitraged BigIn-
sights storage for the SAN and implemented a nine-month rolling retention
policy; after this time period, there was little value in retaining the logs. They
didn’t stop there, however. Now that the logs were in one place and for a
reasonable amount of time, they were able to determine holistic trends and
issues; in short, they were able to connect the dots.
But there’s more to this use case than detecting problems. This client is
now compiling a body of knowledge so that they can better anticipate failures
and understand the interaction between failures. Their service bureau can
generate best-practice remediation steps for specific problems, or tune the in-
frastructure to eliminate them. This is about discoverable preventive mainte-
nance. Some of our large insurance and retail clients need to know the
02-ch02.indd 29 03/10/12 7:00 PM
61.
Flash 6X9 /Harness the Power of Big Data:The IBM Big Data Platform / Zikopoulos / 817-5
30 Harness the Power of Big Data: The IBM Big Data Platform
answers to such questions as “What are the precursors to failure?” or “How
are these systems related?” These are the types of questions that conventional
monitoring doesn’t answer; a Big Data solution finally offers the opportunity
to get new and better insights into the problems at hand
What, Why, and Who? Social Media Analytics
Perhaps the most talked-about Big Data use pattern involves social media
and customer sentiment analysis—it’s also perhaps the most overhyped and
misunderstood. Although Big Data can help you to figure out what customers
are saying about your brand (or your competitor’s brand), we think that the
current focus needs to expand.
Social media analytics is a pretty hot topic, but we’re already starting to see
“buyer fatigue,” because the realities of current practice don’t live up to the
constant hype around this use case. Simply put, there’s a big difference between
what people are saying or thinking and why they said or thought it. Your social
media Big Data analytics project should attempt to answer both the “what”
and the “why” to provide you with the analytics payoff that you seek.
We were recently able to identify some negative buzz that was specifically
targeted to a financial company that we were helping. We wanted to find out
why the negative buzz was there in the first place—why were people in a
such a state that they used technology to spread this negative sentiment?
More importantly, was this impacting sales, what could be done about it, and
how would we know if a particular response made things better? We call this
closed loop analytics. If you simply listen to what people are saying, but don’t
have the ability to analyze the information and respond accordingly, you’re
still flying largely blind.
Understanding why people are saying something about your organiza-
tion involves cross-correlating everything: promotions, product mixes, pric-
ing changes, policy changes, marketing, corporate responsibility, and a whole
host of other activities that contribute to consumers’ opinions in the first
place. There’s a fundamental requirement that too few companies are talking
about: you need to combine external and internal information flows in the
same analytics pipeline. That’s where you’ll start to gain real insight and re-
alize an uplift; as it turns out, there are few (if any) external services that
provide social media offerings to do this since they can’t handle the internal
structured sources, or they lack the analytics to combine the two—the IBM
Big Data platform can do this.
02-ch02.indd 30 03/10/12 7:00 PM
62.
Applying Big Datato Business Problems: A Sampling of Use Cases 31
Flash 6X9 / Harness the Power of Big Data:The IBM Big Data Platform / Zikopoulos / 817-5
Understanding Customer Sentiment
Some industries or products have disloyal customers with very high churn
rates. We worked with one telecommunications company that experiences
more than 50 percent annual customer churn. They wanted to enhance reten-
tion by identifying which types of customers are most vulnerable earlier in
the billing cycle. For this client, even small improvements in the conversion
rate to more stable plans would double one of their offerings’ revenue stream.
Quite simply, they didn’t have to hit a home run to be more successful; they
just needed to get a base hit. Of course, that’s easier said than done, however,
because of how transient the opportunity is with the customer. When you’re
dealing with those levels of churn and massive volumes, being able to find,
trap, respond, and interact is not a small challenge.
The key to making this happen is being able to detect loyalty decay and
work that into your client engagements and next-best-action modeling before
the next contact with the customer. It isn’t quite real time, but what we call
customer time. Customer time is simply the notion of being able to process
everything needed before the next customer interaction so it looks seamless
in the eyes of your client. However with Smartphones, customer time is getting
close to real time because there are always opportunities such as sending an
e-mail, text message, or offer.
In addition to operating in customer time, this use case provides another
example of the value of capturing all of the available information to look at
events that help to build context. After you’ve captured one aspect of the
communication spectrum, you can move on to the next and start correlating
that with everything from emails to social media and other things that we’ve
talked about in this chapter; you can even correlate it with back-office service
quality reports to see whether people are calling and expressing dissatisfac-
tion with you based on your back-end systems. If you’re able to identify a
pattern that shows where your systems have been slow or haven’t behaved
properly, and that just happens to be the reason why a particular individual
is calling to cancel services without explicitly mentioning it, you can estab-
lish a correlation with what the customer is saying. In fact, a goal of one of
our FSS clients is to have a good idea why you’re calling before they even talk
to you so they can “pre-resolve” your issue and inform you of the fix rather
than having to even talk to you about your problem!
02-ch02.indd 31 03/10/12 7:00 PM
63.
Flash 6X9 /Harness the Power of Big Data:The IBM Big Data Platform / Zikopoulos / 817-5
32 Harness the Power of Big Data: The IBM Big Data Platform
We’re sure that you can relate to the following scenario: You call a service
provider’s customer service department after getting disconnected twice.
You have to reauthenticate and then repeat your whole story to yet another
agent because when you got cut off, the original agent didn’t finish making
notes. Now imagine calling back and hearing the agent say, “We’re sorry,
we’ve been having some telephony issues and noticed that you’ve been dis-
connected twice. I apologize that I have to reauthenticate you, but I under-
stand why you are calling and here’s what we can do to help resolve it…”
We’re willing to bet that such a response would exceed your expectations.
Another example: How many times have you called your Internet service
provider to complain about your high-speed Internet service, only to get
the impression that the customer service representative’s (CSR) job is to make
you feel unimportant and to get you off the phone as quickly as possible?
From a business perspective, you have to wonder if the service issues are really
being captured. Perhaps the agent handling a call fills out a form that outlines
the basic service complaint, but will it be correlated with point-in-time quanti-
tative reports that indicate how the systems were running? If you have a Big
Data platform, you can derive insight and predict issues before complaints
surface. In the case of an Internet service, quality of service (QoS) is simple to
measure—is the provider’s technical support department analyzing Internet
protocol detail records (IPDRs) to understand the health of the network, and
then alerting customer service whenever there’s a QoS issue in a certain part
of town?
Admittedly, the previous scenario is pretty advanced for call centers to-
day, but in the Big Data world, there’s still room to grow, such as tonal change
or text analysis to identify exasperation (“This is the third time I’ve called!”),
or real-time correlation to identify trends in sentiment with a determination
of how trends in the call center are related to the rest of the business opera-
tions. If you need to explain this is the third time you’ve had to call on the
same issue, shouldn’t all of the interactions with the provider reflect that,
even if you chose to use a different channel?
Understanding customer sentiment is a really interesting Big Data use
case, because it can be applied to what is possible today (using analytics on
data that’s in motion or at rest) and to emerging capabilities. You can use one
of the IBM Big Data platform at-rest analytic engines, such as BigInsights,
02-ch02.indd 32 03/10/12 7:00 PM
64.
Applying Big Datato Business Problems: A Sampling of Use Cases 33
Flash 6X9 / Harness the Power of Big Data:The IBM Big Data Platform / Zikopoulos / 817-5
to discover and build your models and to gain business insight. Then you have
the option of continuing to use at-rest analytics to harvest call interactions at
much lower latency, or to build up these models and then promote them
back to the frontier of the business, using Streams to examine and analyze
calls as quickly as they can be converted, so that insights can be acquired in
near-real time. This transforms the business from forecasting (we think cus-
tomers will leave if…) to nowcasting (we know this customer is about to leave
because…). The results of Streams analytics flow back into BigInsights, creat-
ing a closed-loop feedback mechanism, because BigInsights can then iterate
over the results to improve the models.
Social MediaTechniques
Make the WorldYour Oyster
In the previous section we talked about social media analytics drawing a lot
of chatter and fatigue—it’s potentially too hyped up. We thought we’d expand
your scope of where this fits in; indeed, if you have the technology to draw
structure and understanding from unstructured text, you can imagine an
endless number of usage patterns.
The same text analytics technology used for social media can be applied to
do a number of different things. For example, one client wanted to investi-
gate the dissemination of piracy and copyright infringement of their intel-
lectual property (it was video-based). It’s a very interesting area because in
social media there are often discussions about types of piracy, and this client
was able to build patterns that identify these kinds of conversations that take
place in various micro-blog sites around the world. This ultimately led them
to web sites that contain illegally posted copyrighted materials that belonged
to our client. How did they do it? They developed dictionaries and patterns
that identified the names of sports teams involved in the “stolen” materials,
“pull” language that surrounds enticing links for free content, URL resolu-
tion from shortened URLS (tinyURLs) to actual sites, and so on. So while
they weren’t analyzing who said what, they did create structure around a
problem domain from unstructured text-based data. Same technology, same
toolset, same approach, just a different use case.
02-ch02.indd 33 03/10/12 7:00 PM
65.
Flash 6X9 /Harness the Power of Big Data:The IBM Big Data Platform / Zikopoulos / 817-5
34 Harness the Power of Big Data: The IBM Big Data Platform
While we covered one vendor’s move to limit the piracy of their intellec-
tual property, you can see how a Big Data analytics platform such as the one
provided by IBM could be applied in various ways. For example, one “watch-
dog” client sifted through countless web-posted pages of a country’s parlia-
mentary attendance and voting records to draw strong correlations and shine
the spotlight on a particular representative’s behavior in an elected position
(which was underwhelming in this case because of the number of votes the
representative missed).
Another client used the same concepts of building a dictionary of verbiage
around sentiment and applied it to creating an understanding of log files (we
talk about this usage pattern later in this chapter). For example, an IP address
has a certain structure to it (IPv4 or IPv6), a monitoring agent has a name
(such as Nagios), and so on. Is there a correlation between the name of the
monitoring agent on the application server and the database server?
Finally, an investment house is scraping IT-based company’s public text-
based (HTML) earning reports to look for “tells” or signs within the disclo-
sure as to the health of the business, or guidance in commentary about its
future performance and so on. You can imagine comparing the services rev-
enue stream across different companies (such as Hewlett Packard and IBM)
could be very useful, but each company is likely to name these divisions dif-
ferently; for example, Hewlett Packard calls it “HP Enterprise Services” and
IBM calls it “IBM Global Services.” It’s a daunting task to manually assemble
this information across a large scale of market participants, but it’s a much
easier one if you built text extractors that defined how to identify a company’s
name and services department name, then perhaps crawled the Web with
Nutch (an open source web search engine based on Apache Lucene) to pull
the commentary relating to that division for each company of interest.
Customer State:
Or, Don’tTry to Upsell Me When I Am Mad
Studies seem to indicate that customer service is getting worse, whether it’s
due to outsourcing, aggressive time-to-resolution metrics, the economy, or
cutbacks, among others. Many people find it hard to recall the last time they
had a great customer experience. The quality of service is often up to an indi-
vidual, rather than the business. (We’ve all had that experience: calling back
02-ch02.indd 34 03/10/12 7:00 PM
66.
Applying Big Datato Business Problems: A Sampling of Use Cases 35
Flash 6X9 / Harness the Power of Big Data:The IBM Big Data Platform / Zikopoulos / 817-5
with the same information or problem yields a different result, depending on
the CSR’s attitude and training.) Many of us have been conditioned to expect
mediocre customer experiences as the rule. It doesn’t have to be that way,
however, and as consumers become more vocal about not wanting to be pun-
ished because the companies they do business with have been cutting service
to improve their profitability in tough economic times, something is going to
have to change. We’ve been busy helping firms with this—and the good
news is that in our experience, companies want to provide good service, and
Big Data technologies can both help improve service and lower cost at the
same time.
The key is to re-image how the whole process works by making use of all
the available information; to help the business do the right thing, at the right
time, and in the right context. This is not a new goal, of course, but the ability
to actually do it, and to do it well, is greatly facilitated by Big Data.
Most customer engagement data is ignored. Little, if any, context from call
center interactions is captured. The same can be said about clickstream data
that passes through your company’s web site. Isn’t that a form of communi-
cation? In this case, customers are saying that you’ve done something that’s
interested them enough to learn more about your company or product. This
type of data is usually used at an aggregate level—we look at what customers
are doing as a whole; for example, what products are your customers viewing,
what’s been added to a shopping cart, and what carts are being abandoned.
Why not instead use this data at a more personal level to discover what the
customer is actually doing? For example, are carts consistently being abandoned
at the shipping calculation phase of the order process, or after searches that
don’t seem to yield results? This type of granular data isn’t typically kept and
analyzed because it requires too much storage, perhaps its considered to
have too short of a shelf life to invest in, or can’t be processed quickly enough
to be useful at the individual customer level. As another example, consider
the last time you emailed a service provider and it actually changed how
they interacted with you. Shouldn’t it? You bet it should! In the Big Data era,
storage and processing concerns that forced a trade-off to lower service lev-
els can start to be addressed.
Now consider a scenario in which you can combine what the warehouse
knows about a customer with these communication events: you’d end up with a
much richer, informed, and timely understanding of what we call the customer
state. A great example of customer state mismatch was recently experienced by
02-ch02.indd 35 03/10/12 7:00 PM
67.
Flash 6X9 /Harness the Power of Big Data:The IBM Big Data Platform / Zikopoulos / 817-5
36 Harness the Power of Big Data: The IBM Big Data Platform
one of the authors of this book. He had an issue with a company that was incor-
rectly billing to his credit card, but the bank told him that he had to resolve the
issue with the vendor. The bank would not stop the billing because it was a pre-
authorized charge. He emailed, then chatted, then called the bank over the
course of a couple days, all with increasing levels of frustration. After no luck
with this resolution method, he walked into a local branch that promptly tried to
upsell him on a new card feature. This clearly wasn’t the right time to offer him
a promotion—he wasn’t in the right customer state—but the poor CSR had no
idea this was the wrong time to do this. This bank experience is far from unique
(and our author wants you to know they are generally pretty darn good to deal
with), but it’s a fact: most firms don’t pick up the signals customers send them.
Fraud Detection:
“Who Buys an Engagement Ring at 4 a.m.?”
When was the last time you bought an engagement ring at 4 a.m.? (We’re
excluding any purchases made in Las Vegas.) Not very common, is it? This is
a good example of the concept of outliers, which are key to finding and trying
to predict fraud. You search for outliers all the time. Consider your smart
phone’s detailed bill—you certainly don’t look at hundreds of calls when
trying to figure out how you blew 2,000 minutes; but we’re willing to bet you
spot that 70-minute phone call when the others are all measured in single-
digit minutes. Fraud and risk are part of cross-industry Big Data use cases
that are not restricted to the FSS. Big Data platforms, as we will see, are very
well suited to finding outliers. What’s more, highly dynamic environments
commonly have cyclical fraud patterns that come and go in hours, days, or
weeks. If the data that’s used to identify new fraud detection models isn’t
available with low latency, by the time you discover these new patterns, it’s
too late and some damage has already been done.
Several challenges to fraud detection are directly attributable to the sole
utilization of conventional technologies. The most common theme you’ll see
across all Big Data patterns are limits on what (amount and type) can be
stored, and what compute resources are available to process your intentions.
In other words, models to predict fraud often are either too laser focused due
to compute constraints and miss things, or they are not as refined as they
could (or should) be because the dimensions of the model have to be
02-ch02.indd 36 03/10/12 7:00 PM
68.
Applying Big Datato Business Problems: A Sampling of Use Cases 37
Flash 6X9 / Harness the Power of Big Data:The IBM Big Data Platform / Zikopoulos / 817-5
artificially constrained. After all, it’s harder to find outliers when you don’t
store data profiling the attributes of those outliers. That said, having a larger
set of data and attributes is only useful if you can handle the compute capa-
bilities that are required to churn through them and find the signals that are
buried within the noise. It’s also critical to load and process data quickly
enough to trap fast-moving events.
Fraud cases traditionally involve the use of samples and models to iden-
tify customers that exhibit a certain kind of profile. Although it works, the
problem with this approach (and this is a trend that you’re going to see in a
lot of these use cases) is that you’re profiling a segment and not at the indi-
vidual transaction or person level. Making a forecast based on a segment is
good, but making a decision that’s based upon the actual particulars of an indi-
vidual and correlate their transaction is obviously better. To do this, you need
to work up a larger set of data than is possible with traditional approaches.
We estimate that less than 50 percent (and usually much less than that) of the
available information that could be useful for fraud modeling is actually being
used. You might think that the solution would be to load the other 50 percent
of the data into your traditional analytic warehouse. The reasons why this
isn’t practical seem to come up in most Big Data usage patterns, namely: the
data won’t fit; it’ll contain data types that the warehouse can’t effectively use;
it’ll most likely require disruptive schema changes; and it could very well
slow your existing workloads to a crawl.
If stuffing the rest of the data into existing warehouses isn’t going to work,
then what will? We think that the core engines of the IBM Big Data platform
(BigInsights, Streams, and the analytics-based IBM PureData Systems) give
you the flexibility and agility to take your fraud models to the next level. BigIn-
sights addresses the concerns we outlined in the previous paragraph, because
it will scale to just about any volume and handle any data type required. Be-
cause it doesn’t impose a schema on-write, you’ll have maximum flexibility
in how you organize your data, and your work won’t impact existing work-
loads and other systems. Finally, BigInsights is highly scalable; you can start
small and grow in a highly cost-effective manner (trust us when we say that
your CIO will like this part).
Now that you have BigInsights to provide an elastic and cost-effective
repository for all of the available data, how do you go about finding those
outliers?
02-ch02.indd 37 03/10/12 7:00 PM
69.
Flash 6X9 /Harness the Power of Big Data:The IBM Big Data Platform / Zikopoulos / 817-5
38 Harness the Power of Big Data: The IBM Big Data Platform
We’re going to keep things simple here, because this topic itself could fill
an entire book, but the first step is to load all of the useful data into BigIn-
sights. Notice that we didn’t qualify that by data type. Second, build a base
customer profile with as much detail and as many dimensions of behavior as
possible. Third, start building models of what “normal” looks like, and then
start figuring out what an outlier looks like and how “out” it needs to lie
before it’s worth flagging. In the first iteration, we expect that some of your
outliers will be incorrect, but iteration- and experience-based learning is
what we’re after. Back testing, of course, is part of this process but so is test-
ing against current data flows, which you can do by pushing models to
Streams (Predictive Model Markup Language is one way to do this) so that
you can score against a live stream of data to accelerate the learning process.
As models are discovered and validated, you’ll promote them into your day-
to-day high performance analytics platform, which brings traditional ware-
house technologies into the picture. Finding outliers will provide additional
insights into what your “normal” customers do, and it’s rare when customer
segmentation models aren’t improved as a result; of course, after that hap-
pens, you’ll want to unleash your teams to start working with that data too.
We said at the beginning of this chapter that there are literally hundreds of
usage patterns out there, but that we can’t cover them all in this chapter. In
fact, fraud detection has massive applicability. Think about fraud in health
care markets (health insurance fraud, drug fraud, medical fraud, and so on)
and the ability to get in front of insurer and government fraud schemes (both
claimants and providers). This is a huge opportunity; the US Federal Bureau
of Investigation (FBI) estimates that health care fraud costs US taxpayers
over $60 billion a year. Think about fraudulent online product or ticket sales,
money transfers, swiped bankcards, and more.
Liquidity and Risk:
Moving from Aggregate to Individual
The fact that there’s room for improvement in risk modeling and manage-
ment in a number of industries is probably not shocking. Risk modeling
brings into focus a recurring question when it comes to the Big Data usage
patterns that are discussed throughout chapter: “How much of your data do
02-ch02.indd 38 03/10/12 7:00 PM
70.
Applying Big Datato Business Problems: A Sampling of Use Cases 39
Flash 6X9 / Harness the Power of Big Data:The IBM Big Data Platform / Zikopoulos / 817-5
you use in your modeling?” and “How long does it take to iterate and refresh
over these models?” Current modeling methodologies are held back by sys-
tem constraints, which dictate the architecture and preclude pursuing the
path to optimal results. It’s not that companies don’t recognize that there are
a lot of potential insights available from undiscovered data, but their current
systems don’t always support them. Doubling, tripling, or quadrupling the
size of an analytic warehouse isn’t going to work, because they’re usually
already bursting at the seams or fully utilized. Capital constraints and regu-
latory requirements are forcing adoption of interesting new approaches in
this space, and we thought we’d share some of them with you in this section.
Consider a multinational client that needed to move from line-of-
business–organized stovepipes to individual-level risk management. Their
current data is a month-old snapshot of their credit exposure; useful data for
sure, but slow and expensive to bring through their current manual process.
We proposed a new architecture that includes BigInsights, IBM Information
Server, and Netezza (the name of the IBM PureData Systems for Analytics at
the time). We used their existing IBM Information Server Data Stage plat-
form to transform the raw data, and loaded the enriched data into HBase
(a column-oriented data store that’s included in the BigInsights product).
HBase enables you to persist and present data as a key/value pair. Client
credit exposure was written out as a time series that was expanded as new
products were offered. Using this approach, BigInsights was able to maintain
a current representation of the client’s credit positions in an environment
that’s both elastic in sizing and performance, and significantly less expen-
sive. The Netezza analytics environment can request data from BigInsights,
whenever needed, to enrich modeling without having to be concerned with
how the client evolved the process of acquiring and storing their data.
Wrapping It Up
We can’t possibly do justice to this topic in such a short amount of space. The
bottom line, however, is that having more data can’t just give you deeper
analytical insights, but actually accelerate the analytics process as a whole—
you just need to have a platform that helps you to contain the side effects of
more volume, variety, veracity, and velocity—more data. The IBM Big Data
02-ch02.indd 39 03/10/12 7:00 PM
71.
Flash 6X9 /Harness the Power of Big Data:The IBM Big Data Platform / Zikopoulos / 817-5
40 Harness the Power of Big Data: The IBM Big Data Platform
platform is such a platform, because it provides search, development, gover-
nance, and analytics services for Big Data in motion and Big Data at rest.
We hope that the few Big Data use cases that we included in this chapter
help you to realize that adding more high-fidelity data to the analytics pro-
cess and broadening the reach of data to include traditional and nontradi-
tional sources will reward you with a highly adaptive analytics model.
02-ch02.indd 40 03/10/12 7:00 PM
72.
Flash 6X9 /Harness the Power of Big Data:The IBM Big Data Platform / Zikopoulos / 817-5
41
3
Boost Your Big Data IQ: The
IBM Big Data Platform
Today’s organizations understand the value of analytics. In Chapter 1,
we talked about the impact of analytics as a means of identifying the ultimate
leaders in various market segments. We talked about the joint IBM/MIT
Sloan study, The New Intelligent Enterprise, which made it quite clear that
strong positive correlations exist between market leadership and an enter-
prise’s analytics IQ (which Big Data can boost). Indeed, it’s fair to say that
much of the attention around Big Data is associated with companies that
have a vested interest in “upping” their analytics IQ to differentiate them-
selves in the marketplace. So much so, that many organizations now believe
that gleaning deep analytical insights from data has become a survival
imperative in a global economy.
The New Era of Analytics
Now ask yourself “What happens when an increasing number of organiza-
tions embrace analytics?” Do they lose their competitive edge because they
are all competing with increased insight? For example, over a decade ago,
the Oakland Athletics embraced analytics and data-driven approaches to
player valuation—they used this approach to gain advantage over other
teams in Major League Baseball (MLB). Indeed, the A’s were leaders among
their peers, demonstrating exceptional payroll to performance and net revenue
per seat indicators. They set themselves apart from their industry peers using
analytics. In fact, their story was so compelling and generated so much
03-ch03.indd 41 03/10/12 7:00 PM
73.
Flash 6X9 /Harness the Power of Big Data:The IBM Big Data Platform / Zikopoulos / 817-5
42 Harness the Power of Big Data: The IBM Big Data Platform
interest that it was told through the best-selling book and blockbuster movie
hit Moneyball, starring Brad Pitt. Eventually, other teams caught up. Today,
there isn’t a single team in MLB that doesn’t use sophisticated analytics.
Widespread adoption of analytics within MLB has neutralized any advan-
tage that the Oakland A’s once had in this domain.
It’s fair to say that we’re now entering an era in which analytics will be
considered to be a “table stakes” capability for most organizations. Let’s look
at a specific example of how an organization is taking the use of analytics to a
whole new level. Using analytics to measure customer support effectiveness is
a common practice among many customer-centric organizations. It enables
them to monitor customer satisfaction, drive retention, and manage the cost of
support. The traditional approach involves analyzing all of the data associated
with a support incident, such as call duration and speed of resolution, and
then identifying opportunities for improvement. It also involves conducting
surveys and collecting satisfaction metrics. One such metric, the net promoter
score, can be a very effective tool in gauging a customer’s perception of the
company or product based on their interactions with support personnel.
Although this traditional approach can be effective in improving customer
satisfaction and reducing churn, the analytical cycle time (the time interval
between a support call and the actual process improvements that get pushed
to the front line) can be quite long. During that time, other customers might
have similarly poor support experiences that could cause them to churn. The
opportunity for organizations to differentiate and compete revolves around
not only the use of deep analytics at the core of their business, but also the
analytical cycle time. Like a giant snowball rolling down a hill, the impact of
analytics on your business is slow at first, but with every rotation, the poten-
tial impact becomes greater and greater.
With this in mind, the question really becomes, “Is it possible to take the
analytical models and processes that have been built on historical data sets
and apply them in real time to streaming data?”
One of our clients is currently in the process of doing exactly that. They have
an intelligent intercept agent that monitors all telephone conversations between
customers and customer support representatives (CSRs). This agent monitors
the conversation, applies sentiment analysis to that conversation, and provides
recommendations to the CSR in real time. For example, if a customer uses tonal
inflection to ask a question, or uses sarcasm to express displeasure, the auto-
mated agent is able to detect that immediately and provide specific guidance to
03-ch03.indd 42 03/10/12 7:00 PM
74.
BoostYour Big DataIQ:The IBM Big Data Platform 43
Flash 6X9 / Harness the Power of Big Data:The IBM Big Data Platform / Zikopoulos / 817-5
the CSR. The advice could be to answer the question differently, escalate the call
to the next level, provide specific incentives to the customer, or simply to be
more polite.
By intercepting, monitoring, and analyzing such calls in real time, this client
is able to vastly improve support effectiveness by taking immediate remedial
action to improve customer satisfaction. We want to emphasize that these
capabilities don’t replace traditional offline analytics; rather, they augment
them by incorporating new varieties of data (voice in this case) and performing
analytics in real time.
Key Considerations for the Analytic Enterprise
Differentiating on analytics means using data-driven insights to enhance organi-
zational strategies and using analytics in ways that were previously impossible.
Limitations that used to restrict where and how organizations could run analytics
are being eliminated. Moreover, some of today’s most “analytic enterprises” are
changing their analytic deployment models to find new competitive advan-
tages and differentiate themselves from their peers.
In this section, we share with you the key tenet for enterprise analytics: if
you want to boost your Big Data IQ, you’ve got to start with the right ingredients.
We will describe these “ingredients” using real-life customer examples.
Run Analytics Against Larger Data Sets
Historically, performing analytics on large data sets has been a very cumber-
some process. As a result, organizations resorted to running their analytics
on a sampled subset of available data. Although the models that they built
and the predictions that they generated were good enough, they felt that using
more data would improve their results. They recognized that the sampling
process could sometimes lead to errors or biased conclusions.
Organizations that can run analytics, at scale, against their entire data sets,
definitely have an advantage over those that do not. Pacific Northwest National
Lab’s Smart Grid Demonstration project is a great example of this. The project
hopes to spur a vibrant new smart grid industry and a more cost-effective reli-
able electricity supply, both of which are drivers of US economic growth and
international competitiveness. They plan to collect large amounts of data—
specifically event data from 60,000 metered customers across five states—and
run complex analytical models on them. Using IBM’s Big Data technologies,
they expect to validate new smart grid technologies and business models.
03-ch03.indd 43 03/10/12 7:00 PM
75.
Flash 6X9 /Harness the Power of Big Data:The IBM Big Data Platform / Zikopoulos / 817-5
44 Harness the Power of Big Data: The IBM Big Data Platform
Run Analytics Blazingly Fast
Running analytics is a multistep process. It involves data exploration, data
cleansing and transformation, creating analytical models, deploying and
scoring those models, publishing outcomes, and then refining the models.
It’s also an iterative process. If the underlying analytical system performs
poorly while running analytical queries, this adds latency to the overall pro-
cess. Hence, having the ability to run complex analytics on large data sets
extremely quickly has distinct advantages.
First, it enables greater business agility and dramatically cuts down on overall
decision-making times. A stock exchange client of ours, NYSE Euronext,
cut the time to run deep trading analytics on 2PB of data from 26 hours to 2
minutes! They were running deep analytic queries that required significant
data access and computation. This boost in performance not only helped
them react to market changes faster, but it also enabled them to increase the
complexity of their analytical models.
Second, it improves analyst productivity. Another client, Catalina
Marketing—a large retail marketing services provider—was able to
increase their analysts’ productivity by a factor of six. They did this by
reducing their average analytical model scoring time from 4.5 hours to
60 seconds. As a result, they were able to run more analytical models,
using the same staff, and deliver deeper, transformative business
insights. Pause for a moment…and consider the impact of being able to
score one hundred more models while trying to predict churn, risk, fraud,
weather patterns, or wildfire smoke dispersion rates—this is the oppor-
tunity of Big Data.
Run Analytics in RealTime
Having the ability to run analytics in real time, as events occur, has a profound
impact on how an organization reacts to change. As we discussed in Chapter 2,
UOIT employs analytics on data in motion with the goal of predicting the
onset of potentially life-threatening conditions up to 24 hours earlier, which
can make a huge difference in patient outcomes. They do this by analyzing
streamed data from various monitors and vital sign indicators. A telecom-
munications client of ours is able to analyze streaming network traffic data in
real time to detect bottlenecks, and is able to apply preventive maintenance
to the network. By moving analytics “closer to the action,” organizations
create tremendous opportunities for differentiation.
03-ch03.indd 44 03/10/12 7:00 PM
76.
BoostYour Big DataIQ:The IBM Big Data Platform 45
Flash 6X9 / Harness the Power of Big Data:The IBM Big Data Platform / Zikopoulos / 817-5
Run Analytics on a Broader Variety of Data
Earlier in this chapter, we described a client who achieved enormous customer
support effectiveness by analyzing voice data from support conversations in
real time. The ability to incorporate newer varieties of data, such as voice, text,
video, and other unstructured data types, along with structured relational
sources, opens up possibilities for improving efficiencies and differentiation.
One of our retail clients is now correlating social media data with their point-
of-sale data in the data warehouse. Before launching a new brand, they know
what type of buzz it’s generating, and they use that information to forecast
product sales by geography and to ensure that merchandise is stocked to that
level. They are running deep analytic queries on inventory levels and models
that require heavy computations.
The Big Data Platform Manifesto
To enable the key considerations of the analytic enterprise, it’s important to
have a checklist of the imperatives of a Big Data platform—introducing our
Big Data platform manifesto. The limitations of traditional approaches have
resulted in failed projects, expensive environments, and nonscalable deploy-
ments. A Big Data platform has to support all of the data and must be able to
run all of the computations that are needed to drive the analytics. To achieve
these objectives, we believe that any Big Data platform must include the six
key imperatives that are shown in Figure 3-1.
1. Data Discovery and Exploration
The process of data analysis begins with understanding data sources, figuring
out what data is available within a particular source, and getting a sense of
its quality and its relationship to other data elements. This process, known as
data discovery, enables data scientists to create the right analytic model and
computational strategy. Traditional approaches required data to be physi-
cally moved to a central location before it could be discovered. With Big Data,
this approach is too expensive and impractical.
To facilitate data discovery and unlock resident value within Big Data, the
platform must be able to discover data “in place.” It has to be able to support
the indexing, searching, and navigation of different sources of Big Data. It
has to be able to facilitate discovery of a diverse set of data sources, such as
databases, flat files, content management systems—pretty much any persis-
tent data store that contains structured, semistructured, or unstructured data.
03-ch03.indd 45 03/10/12 7:00 PM
77.
Flash 6X9 /Harness the Power of Big Data:The IBM Big Data Platform / Zikopoulos / 817-5
46 Harness the Power of Big Data: The IBM Big Data Platform
And don’t forgot, the security profile of the underlying data systems needs to be
strictly adhered-to and preserved. These capabilities benefit analysts and data
scientists by helping them to quickly incorporate or discover new data sources in
their analytic applications.
2. Extreme Performance:
Run Analytics Closer to the Data
Traditional architectures decoupled analytical environments from data envi-
ronments.Analytical software would run on its own infrastructure and retrieve
data from back-end data warehouses or other systems to perform complex
analytics. The rationale behind this was that data environments were opti-
mized for faster access to data, but not necessarily for advanced mathematical
computations. Hence, analytics were treated as a distinct workload that had to
be managed in a separate infrastructure. This architecture was expensive to
manage and operate, created data redundancy, and performed poorly with
increasing data volumes.
The analytic architecture of the future needs to run both data processing
and complex analytics on the same platform. It needs to deliver petabyte-
scale performance throughput by seamlessly executing analytic models inside
Big Data Platform Imperatives
1
2
3
4
5
6
Discover, explore, and
navigate Big Data sources
Federated Discovery, Search, and
Navigation
Massively Parallel Processing
Analytic appliances
Hadoop File System/MapReduce
Text Analytics
Stream Computing
In-Database Analytics Libraries
Big Data Visualization
Integration, Data Quality, Security,
Lifecycle Management, MDM, etc
Extreme performance–run
analytics closer to data
Manage and analyze
unstructured data
Analyze data in motion
Rich library of analytical
functions and tools
Integrate and govern
all data sources
Technology Capability
Figure 3-1 The Big Data platform manifesto: imperatives and underlying technologies
03-ch03.indd 46 03/10/12 7:00 PM
78.
BoostYour Big DataIQ:The IBM Big Data Platform 47
Flash 6X9 / Harness the Power of Big Data:The IBM Big Data Platform / Zikopoulos / 817-5
the platform, against the entire data set, without replicating or sampling
data. It must enable data scientists to iterate through different models more
quickly to facilitate discovery and experimentation with a “best fit” yield.
3. Manage and Analyze Unstructured Data
For a long time, data has been classified on the basis of its type—structured,
semistructured, or structured. Existing infrastructures typically have barriers
that prevented the seamless correlation and holistic analysis of this data; for
example, independent systems to store and manage these different data
types. We’ve also seen the emergence of hybrid systems that often let us
down because they don’t natively manage all data types.
One thing that always strikes us as odd is that nobody ever affirms the
obvious: organizational processes don’t distinguish between data types. When
you want to analyze customer support effectiveness, structured information
about a CSR conversation (such as call duration, call outcome, customer satis-
faction, survey response, and so on) is as important as unstructured informa-
tion gleaned from that conversation (such as sentiment, customer feedback, and
verbally expressed concerns). Effective analysis needs to factor in all compo-
nents of an interaction, and analyze them within the same context, regardless of
whether the underlying data is structured or not. A game-changing analytics
platform must be able to manage, store, and retrieve both unstructured and
structured data. It also has to provide tools for unstructured data exploration
and analysis.
4. Analyze Data in RealTime
Performing analytics on activity as it unfolds presents a huge untapped
opportunity for the analytic enterprise. Historically, analytic models and
computations ran on data that was stored in databases. This worked well
for transpired events from a few minutes, hours, or even days back. These
databases relied on disk drives to store and retrieve data. Even the best-
performing disk drives had unacceptable latencies for reacting to certain
events in real time. Enterprises that want to boost their Big Data IQ need
the capability to analyze data as it’s being generated, and then to take
appropriate action. It’s about deriving insight before the data gets stored
on physical disks. We refer to this this type of data as streaming data, and
the resulting analysis as analytics of data in motion. Depending on time of
03-ch03.indd 47 03/10/12 7:00 PM
79.
Flash 6X9 /Harness the Power of Big Data:The IBM Big Data Platform / Zikopoulos / 817-5
48 Harness the Power of Big Data: The IBM Big Data Platform
day, or other contexts, the volume of the data stream can vary dramatically.
For example, consider a stream of data carrying stock trades in an exchange.
Depending on trading activity, that stream can quickly swell from 10 to 100
times its normal volume. This implies that a Big Data platform not only has
to be able to support analytics of data in motion, but also has to scale effec-
tively to manage increasing volumes of data streams.
5. A Rich Library of Analytical Functions
and Tool Sets
One of the key goals of a Big Data platform should be to reduce the analytic
cycle time, the amount of time that it takes to discover and transform data,
develop and score models, and analyze and publish results. We noted earlier
that when your platform empowers you to run extremely fast analytics, you
have a foundation on which to support multiple analytic iterations and speed
up model development (the snowball gets bigger and rotates faster). Although
this is the desired end goal, there needs to be a focus on improving devel-
oper productivity. By making it easy to discover data, develop and deploy
models, visualize results, and integrate with front-end applications, your
organization can enable practitioners, such as analysts and data scientists, to
be more effective in their respective jobs. We refer to this concept as the art of
consumability. Let’s be honest, most companies aren’t like LinkedIn or Face-
book, with hundreds (if not thousands) of developers on hand, who are
skilled in new age technologies. Consumability is key to democratizing Big
Data across the enterprise. You shouldn’t just want, you should always demand
that your Big Data platform flatten the time-to-analysis curve with a rich set
of accelerators, libraries of analytic functions, and a tool set that accelerates
the development and visualization process.
Because analytics is an emerging discipline, it’s not uncommon to find
data scientists who have their own preferred mechanisms for creating and
visualizing models. They might use packaged applications, use emerging
open source libraries, or adopt the “roll your own” approach and build the
models using procedural languages. Creating a restrictive development
environment curtails their productivity. ABig Data platform needs to support
interaction with the most commonly available analytic packages, with deep
integration that facilitates pushing computationally intensive activities from
03-ch03.indd 48 03/10/12 7:00 PM
80.
BoostYour Big DataIQ:The IBM Big Data Platform 49
Flash 6X9 / Harness the Power of Big Data:The IBM Big Data Platform / Zikopoulos / 817-5
those packages, such as model scoring, into the platform. It needs to have a
rich set of “parallelizable” algorithms that have been developed and tested
to run on Big Data. It has to have specific capabilities for unstructured data
analytics, such as text analytics routines and a framework for developing
additional algorithms. It must also provide the ability to visualize and publish
results in an intuitive and easy-to-use manner.
6. Integrate and Govern All Data Sources
Over the last few years, the information management community has made
enormous progress in developing sound data management principles. These
include policies, tools, and technologies for data quality, security, gover-
nance, master data management, data integration, and information lifecycle
management. They establish veracity and trust in the data, and are extremely
critical to the success of any analytics program.
A Big Data platform has to embrace these principles and make them a part
of the platform. It’s almost scary how many times we’ve seen data quality
and governance considered to be afterthoughts that are “bolted” onto exist-
ing processes. We need to treat these principles as foundational and intrinsic
to the platform itself.
IBM’s Strategy for Big Data and Analytics
In the previous section, we discussed how a new era of analytics is driving
competitive differentiation within organizations and how that translates into
specific considerations for an analytic enterprise. We also looked at what a
Big Data platform for delivering the next generation analytic capabilities
should define as its key imperatives. In this section, we cover how IBM has
applied those considerations and imperatives to create the IBM Big Data
platform.
1. Sustained Investments in
Research and Acquisitions
IBM believes that Big Data has the potential to significantly change how
organizations use data and run analytics. Business analytics and Big Data are
strategic bets for IBM, who recognizes the huge potential to demonstrate
leadership in this space and create shareholder value.
03-ch03.indd 49 03/10/12 7:00 PM
81.
Flash 6X9 /Harness the Power of Big Data:The IBM Big Data Platform / Zikopoulos / 817-5
50 Harness the Power of Big Data: The IBM Big Data Platform
IBM is driving its commitment to Big Data and analytics through sustained
investments and strategic acquisitions. In 2011, IBM committed a $100 million
investment in the research and development of services and solutions that
facilitate Big Data analytics. Look around the Big Data space. How many
vendors have spent over $16 billion (as of the time this book was written—
like Big Data numbers, it’s out of date by the time you are reading this, and
moving up), across 30 analytics-based acquisitions, in the last five years?
We often find people equating Big Data with Hadoop, and quite frankly
it’s a huge mistake to think that way. Hadoop is one of many technologies
that is purpose-built for specific tasks. The value in Big Data (what your C-level
executive branch really cares about) revolves around how it can be monetized.
It’s great to store 1PB of data, but if you can’t analyze it, what do you have?
A lot of data. Big Data is about analytics, and no other vendor is strategically
investing in analytics like IBM. IBM’s two most recent acquisitions, Netezza
(whose main appliance has been rebranded as the IBM PureData System for
Analytics) and Vivisimo (whose products have been rebranded as InfoSphere
Data Explorer), had developed market-leading innovative technologies that
have now been integrated into the IBM Big Data platform. IBM also has the
largest commercial research organization on earth: hundreds of mathemati-
cians and data scientists developing leading-edge analytics. Finally, IBM has
the largest patent portfolio in the world, almost exceeding the combined total
of the next four biggest patent-receiving companies!
Many of the research themes and innovations that pertain to unstructured
data management, text analytics, image feature extraction, large-scale data
processing have been incorporated into IBM’s Big Data platform. To be frank,
when you consider the strategic alignments around Big Data, there aren’t
many other organizations in the world that are capable of delivering a compre-
hensive end-to-end Big Data platform like IBM.
2. Strong Commitment to Open Source Efforts
and a Fostering of Ecosystem Development
The open source community has been a major driving force for innovation in
Big Data technologies. The most notable of these is Hadoop, a software frame-
work that enables the processing of data-intensive computational tasks, in par-
allel and at scale. The Hadoop ecosystem consists of other related open source
projects that provide supporting utilities and tools. These projects provide
03-ch03.indd 50 03/10/12 7:00 PM
82.
BoostYour Big DataIQ:The IBM Big Data Platform 51
Flash 6X9 / Harness the Power of Big Data:The IBM Big Data Platform / Zikopoulos / 817-5
specialized functions that enable better access to data in Hadoop’s distributed
file system (HDFS), facilitate workflow and the coordination of jobs, support
data movement between Hadoop and other systems, implement scalable ma-
chine learning and data mining algorithms, and so on. These technologies are
all part of the Apache Software Foundation (ASF) and are distributed under a
commercially friendly licensing model.
Apache Hadoop is still in early stages of its evolution. While it does pro-
vide a scalable and reliable solution for Big Data, most enterprises may find
that it has missing features, lacks specific capabilities, or requires specialized
skills to adopt for their needs.
Hence, technology solution providers, including IBM, are making efforts
to bridge the gap and make Apache Hadoop easier for enterprise adoption.
These technology solution providers can take one of two different approaches
to achieving this goal. The first approach is to take the Apache Hadoop open
source code base as a starting point, and then modify it appropriately to
address gaps and limitations. In software development parlance, this process
is known as forking. Vendors adopting this approach effectively create a vendor-
specific proprietary Hadoop distribution that’s somewhat closed and insulated
from the innovations and improvements that are being applied to the open
source components by the community. This makes interoperability with oth-
er complementary technologies much more difficult.
The second approach is to retain the open source Apache Hadoop compo-
nents as is, without modifying the code base, while adding other layers and
optional components that augment and enrich the open source distribution.
IBM has taken this second approach with its InfoSphere BigInsights (BigIn-
sights) product, which treats the open source components of Apache Hadoop
as a “kernel” layer, and builds value-added components around it. This enables
IBM to quickly adopt any innovations or changes to the core open source
projects in its distribution. It also makes it easy for IBM to certify third-party
technologies that integrate with open source Apache Hadoop.
This modular strategy of incorporating other open source–based Hadoop
distributions into its own offering enables IBM to both maintain the integrity
of the open source components and to address their limitations. BigInsights
is an IBM-certified version of Apache Hadoop. Moreover, many of the value
components that BigInsights offers (such as BigSheets and the Advanced
03-ch03.indd 51 03/10/12 7:00 PM
83.
Flash 6X9 /Harness the Power of Big Data:The IBM Big Data Platform / Zikopoulos / 817-5
52 Harness the Power of Big Data: The IBM Big Data Platform
Text Analytics Toolkit) are supported for use on Cloudera’s distribution of
Hadoop components. (Other distributions are currently under consideration.)
Sometimes we field questions about IBM’s commitment to open source.
This kind of catches us off-guard, not because the question is hard—on the
contrary, we’re caught off-guard because we realize that perhaps IBM hasn’t
done a good enough job of evangelizing what it does in this space, so we
decided to do it here (albeit briefly). For the record, IBM �������������������
is 100 percent com-
mitted to open source, and IBM is 100 percent committed to Hadoop.
Anumber of our engineers contribute pieces of code to the Apache Hadoop
open source project and its associated ecosystem (they are called committers
in the open source world). IBM has a long history of inventing technologies
and donating them to the open source community as well; examples include
Apache Derby, Apache Geronimo, Apache Jakarta, DRDA, XERCES; the list
goes on and on. The de facto tool set for open source, Eclipse, came from IBM.
Text analytics is a major use case around Big Data, and IBM contributed the
Unstructured Information Management Architecture (UIMA). Search is a Big
Data prerequisite enabler, and IBM is a major contributor to Lucene (search
technology that was showcased in the winning Watson technology on the
television program Jeopardy!). We don’t have the space to detail IBM’s commit-
ment to open source in this book, but we think we made our point.
IBM has also built a strong ecosystem of solution providers in the Big Data
space. Currently, its partners—including technology vendors and system
integrators that are trained and certified on the IBM Big Data platform—
number in the triple digits.
3. Support Multiple Entry Points to Big Data
Big Data technologies can solve multiple business problems for an organiza-
tion. As a result, organizations often grapple with the best approach to adop-
tion. As practitioners, we sometimes see IT organizations embark on a Big
Data initiative as though it were a science experiment in search of a problem;
and we’ll tell you, in our experience, lack of focus and unclear expectations
typically lead to unfavorable outcomes (it’s not good for job security). In our
opinion, the most successful Big Data projects start with a clear identification
of a business problem, or a pain point, followed by the application of appro-
priate technology to address that problem. After all, we’ve yet to see a client
03-ch03.indd 52 03/10/12 7:00 PM
84.
BoostYour Big DataIQ:The IBM Big Data Platform 53
Flash 6X9 / Harness the Power of Big Data:The IBM Big Data Platform / Zikopoulos / 817-5
get excited about software because they love the look of it. (Although we
think that Netezza was definitely the first product to make hardware look
cool.) Getting started in the right place is crucial. In fact, the success of your
first Big Data project can determine how widely and how quickly this tech-
nology is adopted across the rest of your organization.
We’ve identified some of the most common pain points (that effectively
act like Big Data project “triggers”) that we come across in our client engage-
ments. For this reason, we refer to the IBM Big Data platform as having five
Big Data entry points, as shown in Figure 3-2.
The IBM Big Data platform provides quantifiable benefits as you move
from an entry point to a second and third project, because it’s built on a set
of shared components with integration at its core. We find it typical that
assets being used in one Big Data project not only increase your chances of
success with downstream projects, but accelerate their delivery as well. For
STA
RT
A
T
M
O
S
T
C
R
I
T
I
C
A
L
N
E
E
D
S
i
m
p
l
i
f
y
Y
o
u
r
W
a
r
e
h
o
u
s
e
Analyze Raw Data
R
e
d
u
c
e
C
o
s
t
s
w
i
t
h
H
a
d
o
o
p
I
B
M
N
e
t
e
z
z
a
InfoSphere BigInsights
I
n
f
o
S
p
h
e
r
e
B
i
g
I
n
s
i
g
h
t
s
Unlock Big
D
a
t
a
A
n
a
l
y
z
e
Streaming Data
InfoSphere Data
E
x
p
l
o
r
e
r
I
n
f
o
S
p
here Streams
Big Data
Platform
Figure 3-2 IBM’s Big Data platform supports multiple entry points.
03-ch03.indd 53 03/10/12 7:00 PM
85.
Flash 6X9 /Harness the Power of Big Data:The IBM Big Data Platform / Zikopoulos / 817-5
54 Harness the Power of Big Data: The IBM Big Data Platform
example, you might develop a sentiment analysis package for an application
that crunches millions of emails for a service desk application. A subsequent
project could take this asset (data harvested at rest) and transparently deploy
it to a data-in-motion application that assesses a live Twitter stream for
trending sentiment.
Finally, it’s worth noting that the IBM Big Data platform is not an all-or-
nothing proposition. Quite the contrary: you can get started with a single
product, a subset of products, or the entire platform, giving you the flexibil-
ity and agility that you need to successfully deliver that initial project, and
then incrementally “up” your Big Data IQ from there. In the remainder of
this section, we discuss each of the IBM Big Data platform entry points.
Unlock Big Data
How many times have you not been able to find content on your laptop that
you knew you had? How many times have you stumbled across one file
while you were looking for another file that you had completely forgotten
about? If you can’t really get a handle on the data assets that are on your own
laptop, imagine this pain point for a large enterprise! To be honest, we find
that enterprises are often guilty of not knowing what they could already
know because they don’t know what they have. In other words, they have
the data, but they can’t get to it. This is the pain point that’s associated with
“unlock Big Data.”
This problem is compounded for organizations that have access to multi-
ple sources of data, but don’t have the infrastructure to get all of that data to
a central location, or the resources to develop analytical models to gain in-
sights from it. In these cases, the most critical need might be to quickly un-
lock the value resident in this data without moving it anywhere, and to use
the Big Data sources in new information-centric applications. This type of
implementation can yield significant business value, from reducing the man-
ual effort to search and retrieve Big Data, to gaining a better understanding
of existing Big Data sources before further analysis. The payback period is
often short. This entry point enables you to discover, navigate, view, and
search Big Data in a federated manner.
Reduce Costs with Hadoop
Organizations might have a particular pain point around reducing the over-
all cost of their data warehouse. They might be retaining certain groups of
03-ch03.indd 54 03/10/12 7:00 PM
86.
BoostYour Big DataIQ:The IBM Big Data Platform 55
Flash 6X9 / Harness the Power of Big Data:The IBM Big Data Platform / Zikopoulos / 817-5
data that are seldom used but take up valuable storage capacity. These data
groups could be possible candidates for extension (sometimes called queryable
archive) to a lower-cost platform that provides storage and retrieval, albeit
with poorer performance. Moreover, certain operations, such as transformations,
could be offloaded to a more cost-efficient platform to improve the efficiency
of either the ETL (extract, transform, and load) process or the data warehouse
environment. An entry point for this type of problem might be to start with
Hadoop, a data-at-rest engine. The primary area of value creation here is cost
savings. By selectively pushing workloads and data sets onto a Hadoop plat-
form, organizations are able to preserve their queries and take advantage of
Hadoop’s cost-effective processing capabilities for the right kinds of data and
workloads.
Analyze Raw Data
There might be situations in which an enterprise wants to extend the value of
its data warehouse by bringing in new types of data and driving new types
of analysis. Their primary need might be to analyze unstructured data from
one or multiple sources. They might want to overcome the prohibitively high
cost of converting unstructured data sources to a structured format by ana-
lyzing data in its raw format. A Hadoop-based analytics system could be the
right entry point for this type of problem. Enterprises often gain significant
value with this approach, because they can unlock insights that were previ-
ously unknown. Those insights can be the key to retaining a valuable customer,
identifying previously undetected fraud, or discovering a game-changing
efficiency in operational processes.
SimplifyYour Warehouse
We often come across situations in which business users are hampered by the
poor performance of analytics in a general-purpose enterprise warehouse
because their queries take hours to run. The cost associated with improving
the performance of the data warehouse can be prohibitively high. The enter-
prise might want to simplify its warehouse and get it up and running quickly.
In such cases, moving to a purpose-built, massively parallel, data warehous-
ing and analytics appliance could be the perfect entry point to Big Data.
Many organizations realize a 10- to-100-fold performance boost on deep ana-
lytics, with reduced cost of ownership and improved employee efficiency, by
using our technology.
03-ch03.indd 55 03/10/12 7:00 PM
87.
Flash 6X9 /Harness the Power of Big Data:The IBM Big Data Platform / Zikopoulos / 817-5
56 Harness the Power of Big Data: The IBM Big Data Platform
Analyze Streaming Data
An organization might have multiple sources of streaming data and want to
quickly process and analyze perishable data, and take action, in real time.
Often they will be unable to take full advantage of this data simply because
there might be too much of it to collect and store before analysis. Or the latency
associated with storing it on disk and then analyzing it might be unaccept-
able for the type of real-time decisions that they want to drive. The ability to
harness streaming data and turn it into actionable insight could be another
Big Data entry point. The benefits would be the ability to make real-time
decisions and to drive cost savings by analyzing data in motion and only
storing what’s necessary.
A Flexible, Platform-Based Approach to Big Data
We finish this chapter by mapping the services that are available from the
IBM Big Data platform (shown in Figure 3-3) to the products that deliver
them, with pointers to more detailed information elsewhere in the book.
Visualization
& Discovery
Hadoop
System
Stream
Computing
Data Warehouse
Appliance
Application
Development
Systems
Management
1
5
2
6
3 4
Analytic Accelerators
Information Integration & Governace
I
Figure 3-3 The IBM Big Data platform
03-ch03.indd 56 03/10/12 7:00 PM
88.
BoostYour Big DataIQ:The IBM Big Data Platform 57
Flash 6X9 / Harness the Power of Big Data:The IBM Big Data Platform / Zikopoulos / 817-5
1. Visualization and Discovery:
IBM InfoSphere Data Explorer Powered by Velocity
For organizations that need to understand the scope and content of their data
sources, IBM InfoSphere Data Explorer (Data Explorer) is a good starting
point. It enables them to unlock the data that they have available, both inside
and outside of the enterprise, through federated search, discovery, and navi-
gation. It enables everyone—from management to knowledge workers to
front-line employees—to access all of the information that they need in a single
view, regardless of format or location. Rather than wasting time accessing
each silo separately, Data Explorer enables them to discover and navigate
seamlessly across all available sources, and provides the added advantage of
cross-repository visibility. It secures the information, so that users see only
the content that they are permitted to see as if they were logged directly into
the target application. In addition, Data Explorer gives users the ability to
comment, tag, and rate content, as well as to create folders for content that
they would like to share with other users. All of this user feedback and social
content is then fed back into Data Explorer’s relevance analytics to ensure
that the most valuable content is presented to users. Enterprises like Procter
and Gamble have been able to streamline their support and operations by
providing employees visibility into over 30 data repositories using this
technology.
Data Explorer is a great place to start the Big Data journey, because you
can quickly discover and examine the data assets that you have on hand to
determine what other parts of the platform you will need next. We talk about
this technology in Chapter 7.
2. Hadoop System: IBM InfoSphere BigInsights
Hadoop is an ideal technology for organizations that want to combine a
variety of data types, both structured and unstructured, in one place for
deep analysis. It also enables organizations to reduce the cost of their data
management infrastructure by offloading data and workloads. IBM’s Info-
Sphere BigInsights builds on top of open source Hadoop and augments it
with mandatory capabilities that are needed by enterprises. It has optimi-
zations that automatically tune Hadoop workloads and resources for faster
performance. It has an intuitive spreadsheet-style user interface for data
03-ch03.indd 57 03/10/12 7:00 PM
89.
Flash 6X9 /Harness the Power of Big Data:The IBM Big Data Platform / Zikopoulos / 817-5
58 Harness the Power of Big Data: The IBM Big Data Platform
scientists to quickly examine, explore, and discover data relationships. It
provides security and governance capabilities to ensure that sensitive data
is protected and secured. BigInsights is prepackaged with development
tooling that makes it easier for technical teams to create applications without
first having to go through exhaustive training to become Hadoop experts.
We will describe IBM’s Hadoop distribution in Chapter 5.
3. Stream Computing: IBM InfoSphere Streams
Stream computing enables organizations to immediately respond to chang-
ing events, especially when analyzing stored data isn’t fast enough. It also
enables them to be more efficient in prefiltering and selectively storing high-
velocity data. IBM InfoSphere Streams (Streams) delivers this capability by
enabling organizations to analyze streaming data in real time. Streams has a
modular design that has unlimited scalability and can process millions of
events per second. It has the ability to analyze many data types simultane-
ously and to perform complex calculations in real time. We will describe
Streams and analytics in motion in Chapter 6.
4. Data Warehouse Appliance: IBM PureData System
for Analytics Powered by NetezzaTechnology
We often find enterprises struggling with the complexity of their data ware-
housing environments. Their data warehouses tend to be glutted with data
and not suited for one particular task. Gaining deep analytical insights might be
too complex or expensive. IBM addresses this pain point through an anaytics-
based IBM PureData System. The IBM PureData System for Analytics (the
new name for the latest generation Netezza appliance) is a purpose-built
appliance for complex analytical workloads on large volumes of structured
data. It’s designed with simplicity in mind and needs minimal administra-
tion and no performance tuning. It uses a unique hardware-assisted query
processing mechanism that enables users to run complex analytics at blister-
ing speeds. We talk about this technology in Chapter 4.
5. Analytic Accelerators
One of the objectives of IBM’s platform-based approach is to reduce time to
value for Big Data projects. The IBM Big Data platform achieves this by pack-
aging prebuilt analytics, visualization, and industry-specific applications as
part of the platform. The analytic accelerators contain a library of pre-built
03-ch03.indd 58 03/10/12 7:00 PM
90.
BoostYour Big DataIQ:The IBM Big Data Platform 59
Flash 6X9 / Harness the Power of Big Data:The IBM Big Data Platform / Zikopoulos / 817-5
functions that analyze data in its native format, where it lives, and with the
appropriate engine: InfoSphere BigInsights, InfoSphere Streams, or an
analytics-based IBM PureData System. The library of prebuilt functions
includes algorithms for processing text, image, video, acoustic, time series,
geospatial, and social data. The functions span mathematical, statistical,
predictive, and machine learning algorithms. The accelerators also include the
appropriate development tools to enable the market to develop analytic appli-
cations for the Big Data platform. We cover text analytics in Chapter 8, and
in Chapter 9, we talk about the three Big Data analytic accelerators that are
designed to get you moving on a Big Data project…fast. Discovery tools, such
as BigSheets, are covered in Chapter 5, along with the BigInsights product.
6. Information Integration and Governance
The IBM Big Data platform includes purpose-built connectors for multiple
data sources. It has adapters for common file types, databases, and sources of
unstructured and streaming data. It also has deep integration between its
data processing engines, which enables data to be moved seamlessly be-
tween an analytics-based IBM PureData System, InfoSphere BigInsights, and
InfoSphere Streams.
Security and governance are key aspects of Big Data management. The Big
Data platform might contain sensitive data that needs to be protected, retention
policies that need to be enforced, and data quality that needs to be governed.
IBM has a strong portfolio of information lifecycle management, master data
management, and data quality and governance services. These services are inte-
grated and available for use within the Big Data platform. We cover this topic in
Chapters 10 and 11.
Wrapping It Up
We started this chapter by describing the foundational components of any
enterprise. We believe that these core capabilities are the DNA of any Big
Data platform—whether you are looking at IBM’s offering in this space, or
another vendor’s, our vast experiences suggest that this is what you’re going
to need to boost your Big Data IQ. Our Big Data manifesto sits on top of these
foundational components.
We concluded this chapter by introducing you to the IBM Big Data plat-
form, a solution that provides you with a flexible adoption plan for Big Data
03-ch03.indd 59 03/10/12 7:00 PM
91.
Flash 6X9 /Harness the Power of Big Data:The IBM Big Data Platform / Zikopoulos / 817-5
60 Harness the Power of Big Data: The IBM Big Data Platform
that’s aligned with specific business challenges. The real benefit of the plat-
form is the ability to leverage reusable components (analytics, accelerators,
and policies) as you adopt new capabilities from one implementation to the
next. The platform gives you the ability to manage all of your enterprise data
with a single integrated platform, provides multiple data engines (each opti-
mized for a specific workload), and uses a consistent set of tools and utilities
to operate on Big Data. The preintegrated components within the platform
also reduce implementation time and costs. IBM is the only vendor with this
broad and balanced view of Big Data and the needs of a Big Data platform.
IBM has delivered its Big Data platform through a “Lego block” approach.
For example, if a customer has challenges with an existing data warehouse
and is unable to process structured data at scale, their initial starting point
would be a purpose-built data warehousing appliance. This can then be
expanded to either include Hadoop to analyze raw data at rest, or stream
computing to analyze data in motion. Finally, IBM delivers distinct capabili-
ties that are aligned with each of the trigger pain points. We believe that there
is no comparably complete, consumable, and capable Big Data platform in
the marketplace.
03-ch03.indd 60 03/10/12 7:00 PM
92.
Flash 6X9 /Harness the Power of Big Data:The IBM Big Data Platform / Zikopoulos / 817-5
61
Part II
Analytics for Big
Data at Rest
04-ch04.indd 61 03/10/12 7:01 PM
93.
Flash 6X9 /Harness the Power of Big Data:The IBM Big Data Platform / Zikopoulos / 817-5
00-FM.indd 16 04/10/12 12:19 PM
This page intentionally left blank
94.
Flash 6X9 /Harness the Power of Big Data:The IBM Big Data Platform / Zikopoulos / 817-5
63
4
A Big Data Platform
for High-Performance
Deep Analytics:
IBM PureData Systems
Data warehousing systems and technologies are intended to give orga-
nizations access to information on demand, help them react to it faster, and
facilitate quicker decisions. Indeed, the language used to describe the size
of data warehouses has changed from gigabytes to terabytes and petabytes,
workloads have evolved from being primarily operational to increasingly
analytic, and numbers describing concurrency have gone from hundreds to
thousands. These changes create a realization for many that the traditional
approaches to data warehousing can’t scale to meet today’s challenges.
Organizations expect that when they need critical information urgently,
the platform that delivers it should be the last thing on their minds. After all,
when you turn on the lights at your house, do you consider the wiring and
circuitry that makes it happen? Obviously not. You expect to be able to con-
sume what you need to get the job done without effort (well, you have to flip
the light switch, but you get the point). To support the escalating complexity,
concurrency, and volumes of today’s data warehouses, IT organizations are
demanding a platform that’s simple, reliable, and able to handle almost any
workload without complexity getting in the way.
04-ch04.indd 63 03/10/12 7:01 PM
95.
64 Harnessthe Power of Big Data: The IBM Big Data Platform
Flash 6X9 / Harness the Power of Big Data:The IBM Big Data Platform / Zikopoulos / 817-5
The first generation of data warehouse technologies was modeled after
OLTP-based databases running on large symmetric multiprocessing (SMP)
machines. These machines had inherent architectural limitations that prevented
them from becoming a viable platform for analytics. Subsequent iterations
tried to incorporate parallel processing techniques and distributed storage
subsystems into the architecture. The resulting complexity of operation (vari-
ous kinds of indexes, indexes on indexes, optimization hints, and the like)
made these systems even more complex to operate and expensive to maintain.
Achieving consistent performance against increasing data volumes and
diverse workloads without a significant increase in total cost of ownership
(TCO) has always been the biggest challenge in data warehousing technolo-
gies. Invariably, the biggest bottleneck across all data warehouse operations
was the speed at which the database engine could read from and write data
to disk, known as disk I/O bottleneck.
When warehouses were piece-parts, various providers delivered a num-
ber of I/O innovations in an attempt to address this bottleneck; however,
these innovations were brought to market independently and exhibited little
synergy across warehouse tiers: the relational database management system
(RDBMS), storage subsystem, and server technologies. For example, using
caching in the storage subsystem, faster network fabric on the servers, and
software optimizations, such as partitioning and indexing, are all optimiza-
tions that were brought to market to minimize disk I/O. And although they
addressed the issues locally and that helped a bit, they weren’t collectively
optimized to significantly improve disk I/O. In addition, these optimization
techniques relied on the data warehouse designers to second-guess query
patterns and retrieval needs up-front so that they could tune the system for
performance. This not only impacted business agility in meeting new report-
ing and analytics requirements, but it also required significant manual effort
to maintain, tune, and configure the data warehouse tiers. As a result, col-
lectively these systems became expensive to manage and brutal to maintain.
The IBM PureData System for Analytics appliance—formerly known as the
IBM Netezza Data Warehouse Appliance, often just referred to as Netezza—
was developed to overcome these specific challenges. (Since this chapter talks
about the history of the Netezza technology that is the genesis for this IBM
PureData System appliance, we’ll refer to both the appliance and technology
simply as Netezza for the remainder of this chapter.) In fact, it’s fair to say
that Netezza started what has now become the appliance revolution in data
04-ch04.indd 64 03/10/12 7:01 PM
96.
A Big DataPlatform for High-Performance Deep Analytics 65
Flash 6X9 / Harness the Power of Big Data:The IBM Big Data Platform / Zikopoulos / 817-5
warehousing by integrating the database, processing, and storage components
in a flexible, compact, purpose-built, and optimized system for analytical
workloads. This innovative platform was built to deliver an industry-leading
price-performance ratio with appliance simplicity. As a purpose-built appli-
ance for high-speed Big Data analytics, its power comes not from the most
powerful and expensive components (which would increase the slope of its
cost-benefit curve) but from how the right components are assembled and
work together to maximize performance. In short, the goal wasn’t to build a
supercomputer, but rather an elegantly designed system to address common-
place bottlenecks with the unequalled ability to perform analytics. Netezza
did this by combining massively parallel processing (MPP) stream and multi-
core CPUs with Netezza’s unique hardware acceleration (we refer to this as
Netezza’s secret sauce) to minimize disk I/O bottlenecks and deliver perfor-
mance and expert tuning that much more expensive systems could never
match, or even approach. We want to clarify the word streams in the previous
sentence. In this context, we are talking about streaming data from database
components on disk into memory for processing. You will learn about streams
that reference continuous processing of data in motion using InfoSphere
Streams in Chapter 6.
It’s important to note that Netezza didn’t take an old system with known
shortcomings and balance it with a storage tier. It was built from the ground
up, specifically for running complex analytics on large volumes of structured
data. As an easy-to-use appliance, the system delivers its phenomenal results
out of the box, with no indexing or tuning required. Appliance simplicity
extends to application development, enabling rapid innovation and the abil-
ity to bring high-performance analytics to the widest range of users and pro-
cesses. For users and their organizations, it means the best intelligence to all
who seek it, even as demands escalate from all directions.
Looking back at the history of Netezza and today’s Big Data era, we think
it’s safe to assert that Netezza took the CFO/CIO discussion from “spending
money to save money,” to “spending money to make money”: it handed
businesses, both large and small, the ability to democratize deep analytics,
while flattening the cost curve that was once associated with this domain.
In this chapter we’re going to get a little more technical than the previous
chapters you’ve read. This will allow us to better explain concepts and illus-
trate the “secret sauce” that’s made the industry-leading Netezza technology
so special.
04-ch04.indd 65 03/10/12 7:01 PM
97.
66 Harnessthe Power of Big Data: The IBM Big Data Platform
Flash 6X9 / Harness the Power of Big Data:The IBM Big Data Platform / Zikopoulos / 817-5
Netezza’s Design Principles
Netezza’s approach to data analysis is patented and proven. Its goal has
always been to minimize data movement, while processing it at “physics
speed,” in parallel, and on a massive scale—all delivered within an easy-to-
use appliance at a low cost. The Netezza appliance has undergone multiple
iterations since its inception (it’s latest refresh includes a name change to the
IBM PureData System for Analytics), but its architecture has always been
based on a core set of design principles. These design principles have been a
hallmark of Netezza’s price-performance leadership in the industry, and
we’ll cover them in this section.
Appliance Simplicity: Minimize the Human Effort
Enterprises are spending more and more money to pay people to manage
their systems. Now consider this observation in an environment where
cheaper labor is presumably available through a globally distributed deliv-
ery model, and you can see that the required amount of human effort is a
problem.
Appliances are dedicated devices that are optimized for a very specific
purpose. They are self-contained and ready to go. They are very fast to install
and easy to operate. They have standard interfaces that enable other systems
to interoperate with them. All of these characteristics make appliances a very
elegant vehicle for delivering IT solutions. In certain areas, such as network
and storage solutions, appliances are the preferred means for delivering spe-
cific capabilities.
Netezza pioneered the concept of appliances in the data warehousing and
analytics realm. All of its technologies are delivered in an appliance form,
shielding end users from the underlying complexity of the platform. Simplic-
ity rules whenever there is a design tradeoff with any other aspect of the
appliance. Unlike other solutions, the appliance just runs, handling demand-
ing queries and mixed workloads at blistering speeds. Even normally time-
consuming tasks, such as installation, upgrade, and ensuring high-availability
and business continuity, are vastly simplified, saving precious time and
resources, and mitigates operational risk.
04-ch04.indd 66 03/10/12 7:01 PM
98.
A Big DataPlatform for High-Performance Deep Analytics 67
Flash 6X9 / Harness the Power of Big Data:The IBM Big Data Platform / Zikopoulos / 817-5
Hardware Acceleration:
Process Analytics Close to the Data Store
Netezza’s architecture is based on a fundamental principle of computer sci-
ence: when operating on large data sets, don’t move data unless you abso-
lutely have to. Moving large data sets from physical storage units to compute
nodes increases latency and affects performance. Netezza minimizes data
movement by using innovative hardware acceleration; for example, it uses
field-programmable gate arrays (FPGA) to filter out extraneous data as early
in the data stream as possible, and basically as fast as data can be streamed
off the disk. This process of data elimination close to the data source removes
I/O bottlenecks and keeps downstream components, such as the CPU, mem-
ory, and network, from having to process superfluous data; this produces a
significant multiplier effect on system performance.
Balanced, Massively Parallel Architecture:
Deliver Linear Scalability
Every component of Netezza’s architecture, including the processor, FPGA,
memory, and network, is carefully selected and optimized to service data as
fast as the physics of the disk allows, while minimizing cost and power con-
sumption. The Netezza software orchestrates these components to operate
concurrently on the data stream in a pipeline fashion, thus maximizing utili-
zation and extracting the utmost throughput from each MPP node. Although
the use of open, blade-based components enables Netezza to incorporate
technology enhancements very quickly, the turbo-charger effect of the FPGA,
a balanced hardware configuration, and tightly coupled intelligent software
combine to deliver overall performance gains far greater than those of the
individual elements. In fact, Netezza has delivered more than four-fold per-
formance improvements every two years since its introduction, far outpac-
ing other well-established vendors.
Modular Design: Support Flexible
Configurations and Extreme Scalability
One of the key concerns with traditional appliance-based architectures has
been their ability to scale after data volumes outgrow the physical capacity of
the appliance. Netezza addresses this concern with a modular appliance
04-ch04.indd 67 03/10/12 7:01 PM
99.
68 Harnessthe Power of Big Data: The IBM Big Data Platform
Flash 6X9 / Harness the Power of Big Data:The IBM Big Data Platform / Zikopoulos / 817-5
design that simply scales from a few hundred gigabytes to tens of petabytes of
user data that can be queried. In fact, the system has been designed to be highly
adaptable, and to serve the needs of different segments of the data warehouse
and analytics market. The use of open blade-based components enables the
disk-processor-memory ratio to be easily modified in configurations that cater
to performance or storage-centric requirements. This same architecture also
supports memory-based systems that provide extremely fast, real-time analytics
for mission-critical applications. In the remainder of this chapter, we’ll delve
into just how these design principles translate into practice.
What’s in the Box?The Netezza Appliance
Architecture Overview
Netezza architecture is based on an asymmetric massively parallel process-
ing (AMPP) methodology that combines the best elements of symmetric mul-
tiprocessing (SMP) and MPP to create a purpose-built appliance for running
blazingly fast analytics on petabytes of data.
Disk Enclosures
SMP Hosts
Snippet Blades
(S-Blades)
Slice of User Data
Swap and Mirror Partitions
High-Speed Data Streaming
SQL, Query Plan,
Optimize, Admin
Processor & Streaming DB logic
High-performance database
engine, streaming joins,
aggregations, sorts, etc....
Figure 4-1 The IBM Netezza appliance (now known as the IBM PureData System for
Analytics)
04-ch04.indd 68 03/10/12 7:01 PM
100.
A Big DataPlatform for High-Performance Deep Analytics 69
Flash 6X9 / Harness the Power of Big Data:The IBM Big Data Platform / Zikopoulos / 817-5
Asingle rack Netezza system is shown in Figure 4-1.As you can see, it has two
high-end rack-mounted servers called hosts, which function both as the external
interface to the Netezza appliance and the controller for the massively parallel
infrastructure. The hosts are connected through an internal network fabric to a
set of snippet blades (we’ll often refer to them simply as S-blades), where the bulk
of the data processing is performed. The S-blades are connected through a high-
speed interconnect to a set of disk enclosures where the data is stored.
If any component fails, be it the host, disk, or S-blade, recovery is automatic.
The range of automatic failure detection and recovery options demonstrates
the advantages of an appliance approach. Netezza has built-in component
and operational redundancy, and the system responds automatically and
seamlessly to the failure of critical components.
A Look Inside the Netezza Appliance
Every component of Netezza’s AMPP architecture, including the processor,
FPGA, memory, and network is carefully selected and integrated to yield a
balanced overall system. In addition to raw performance, this balanced
architecture can deliver linear scalability to more than a thousand processing
streams executing in parallel, while offering a very economical TCO. These
parallel streams work together to “divide and conquer” the workload. Let’s
examine the key components of a Netezza system, as shown in Figure 4-2.
Netezza Hosts
Hosts are the primary interfaces to the system. The hosts are high-perfor-
mance Linux servers that are set up in an active-passive configuration for
high availability (note that Figure 4-2 has two of them stacked on top of each
other). The host compiles SQL queries into executable code segments called
snippets, creates optimized query plans, and distributes the snippets to the
MPP nodes for execution. The active host presents a standardized interface to
external tools and applications, such as business intelligence reporting tools,
data integration and ETL tools, advanced analytics packages, backup and
recovery tools, and so on. These external applications use ubiquitous proto-
cols, such as JDBC, ODBC, and OLE DB, to interface with the Netezza host.
Hosts run both high-availability (HA) clustering software and mirroring
technology. All write operations to the active host are mirrored to the standby
host, preparing it to take over system processing at any moment if a failure
should occur. The standby host monitors the active host through Ethernet
links and assumes the primary role should the active host fail.
04-ch04.indd 69 03/10/12 7:01 PM
101.
70 Harnessthe Power of Big Data: The IBM Big Data Platform
Flash 6X9 / Harness the Power of Big Data:The IBM Big Data Platform / Zikopoulos / 817-5
S-blades
S-blades are intelligent processing nodes that make up the MPP engine of the
Netezza appliance. Each S-blade is an independent server that contains pow-
erful multicore CPUs, multiengine FPGAs, and gigabytes of RAM, all bal-
anced and working concurrently to deliver peak performance.
Netezza protects against S-blade failures as well. The system management
software continuously monitors each S-blade and, if a failure is detected, the
S-blade is taken out of service and its processing load is automatically trans-
ferred to the spare S-blade. Monitoring of the S-blade includes error correc-
tion code (ECC) checking on the blade memory. If the system management
software detects that ECC errors have exceeded a failure threshold, it takes
the S-blade out of service.
Disk Enclosures
The system’s disk enclosures (which each contain slices of a table’s data)
contain high-density, high-performance disks that are RAID protected. Disk
FPGA CPU
Host
Memory
FPGA CPU
Memory
FPGA CPU
Memory
S-Blades Network
Fabric
External Applications
IBM Netezza data warehouse appliance
(IBM PureData System for Analytics)
Disk
Enclosures
Advanced
Analytics
BI
ETL
Loader
Figure 4-2 The Netezza AMPP architecture
04-ch04.indd 70 03/10/12 7:01 PM
102.
A Big DataPlatform for High-Performance Deep Analytics 71
Flash 6X9 / Harness the Power of Big Data:The IBM Big Data Platform / Zikopoulos / 817-5
enclosures are connected to the S-blades through high-speed interconnects
that enable all of the disks in Netezza to simultaneously stream data to the
S-blades at the maximum rate possible.
There are two independent data paths from each S-blade in the chassis to
each disk. Each drive is mirrored in a RAID 1 configuration. In the event of a
disk failure, processing is completed on the mirror without any interruption
of service. I/O is simply redirected to the mirror drive by the storage subsys-
tem. Spare drives are included in each appliance so that it can transparently
self-heal by selecting a spare to take the place of the failed drive and regener-
ating its contents to restore redundancy.
Network Fabric
Internode communication across Netezza’s MPP grid occurs on a network
fabric running a customized IP-based protocol that fully utilizes the total
cross-sectional bandwidth of the fabric and eliminates congestion even under
sustained, bursty network traffic. The network is optimized to scale to more
than a thousand nodes, while allowing each node to initiate a large data
transfer to every other node simultaneously.
Netezza’s custom network protocol is designed specifically for the data
volumes and traffic patterns that are associated with high-volume data ware-
housing. It ensures maximum utilization of the network bandwidth without
overloading it, thereby allowing predictable performance close to the data
transmission speed of the network.
Traffic in a Netezza system flows smoothly in three distinct areas:
• From the host to the snippet processors (1 to 1000+) in broadcast mode
• From snippet processors to the host (1000+ to 1), with aggregation in
the S-blades and at the system rack level
• Between snippet processors (1000+ to 1000+), with data flowing freely
on a massive scale for intermediate processing
The Netezza network fabric infrastructure has the same level of redun-
dancy as the other major components. In fact, each Netezza appliance has
two completely independent networks, and because each of the redundant
hosts is connected to one of these redundant networks, the loss of any piece
of the network fabric can be overcome by switching to the standby host. The
data network is not only redundant, but also physically distinct from the
separate management network, enabling the system to assess the health of its
components even if the data network experiences problems.
04-ch04.indd 71 03/10/12 7:01 PM
103.
72 Harnessthe Power of Big Data: The IBM Big Data Platform
Flash 6X9 / Harness the Power of Big Data:The IBM Big Data Platform / Zikopoulos / 817-5
The Secret Sauce: FPGA-Assisted Analytics
The FPGA is a critical enabler of the price-performance advantages of the
Netezza appliance. An FPGA is a semiconductor chip equipped with a large
number of internal gates that can be programmed to implement almost all
logical functions. After an FPGAis programmed, it operates more like special-
built hardware than a general-purpose processor giving it optimum perfor-
mance for narrowly defined tasks. FPGAs are particularly effective at man-
aging special purpose stream processing tasks, and are extensively used in
such applications as digital signal processing, medical imaging, and speech
recognition. In fact, it’s likely the case that you’ve got an FPGA in your house
and didn’t even know it! Do you watch DVDs or Blu-ray discs? An FPGA is
likely behind the scenes, facilitating reads of high-quality compressed digital
data off the spinning disc without the jitters. An FPGA is tiny in size (about
1" × 1" of square silicon) but performs programmed tasks with enormous
efficiency, drawing little power and generating little heat.
Figure 4-3 illustrates FPGA-enabled processing within each S-blade. A
dedicated high-speed interconnect from the storage array enables data to be
delivered to memory as quickly as it can stream off the disk. Compressed
data is cached in memory using a smart algorithm, which ensures that the
most commonly accessed data is served right out of memory instead of re-
quiring disk access.
Each FPGA contains embedded engines that perform filtering and
transformation functions on the data stream. These engines are dynami-
cally reconfigurable (enabling them to be modified or extended through
software), are customized for every snippet through instructions provided
during query execution, and act on the data stream at extremely high speeds.
All of the engines that you see in the FPGA box in Figure 4-3 run in parallel
and deliver the net effect of decompressing and filtering out 95 to 98 percent
of table data at physics speed, thereby only keeping the data that’s relevant
Memory
Compress
Project and Restrict
CPU NIC
Visibility
FPGA
D
M
A
Figure 4-3 FPGA-assisted snippet processing in Netezza
04-ch04.indd 72 03/10/12 7:01 PM
104.
A Big DataPlatform for High-Performance Deep Analytics 73
Flash 6X9 / Harness the Power of Big Data:The IBM Big Data Platform / Zikopoulos / 817-5
to the query. The CPU cores shown in the figure also run in parallel and pro-
cess the remaining data in the stream concurrently. We kept this figure simple
to make it easy to read, but the process described here is repeated on about
one hundred of these parallel snippet processors running in the appliance.
On a ten-rack system, this would represent up to one thousand parallel snip-
pet processors, with performance that exceeds that of much more expensive
systems by orders of magnitude.
The FPGA includes the following embedded engines:
• The compression engine All data in Netezza is stored compressed
on disk. The compression engine resides inside the FPGA and
decompresses data at the transmission speed of the network, instantly
transforming each block on disk into 4 to 8 blocks in memory. The use
of semiconductor-based technology, and not software, to achieve
compression and decompression of data boosts system performance
by a factor of 4 to 8, which results in significant acceleration of the
slowest component in any data warehouse, the disk.
• The project and restrict engine This engine further enhances
performance by filtering out columns and rows, based on parameters
in the SELECT and WHERE clauses of an SQL query.
• The visibility engine Netezza maintains ACID (atomicity,
consistency, isolation, and durability) compliance at streaming speeds,
and uses its visibility engine to filter out rows that should not be
“seen” by a query (for example, rows belonging to a transaction that’s
not yet committed).
Query Orchestration in Netezza
All queries and analyses enter Netezza through the host machine where the
optimizer, the compiler, and the scheduler decompose them into many dif-
ferent snippets whose instructions are subsequently distributed into the mul-
tiple S-blades (all of which then process their workload simultaneously
against their locally managed slice of data). In this section, we discuss these
individual steps in greater detail using Figure 4-4.
Query Optimization
The intelligence of the Netezza optimizer is one of its greatest strengths. It
was engineered to create query execution plans specifically optimized for
04-ch04.indd 73 03/10/12 7:01 PM
105.
74 Harnessthe Power of Big Data: The IBM Big Data Platform
Flash 6X9 / Harness the Power of Big Data:The IBM Big Data Platform / Zikopoulos / 817-5
Netezza’s AMPP architecture. The optimizer makes use of all MPP nodes in
the system to gather detailed up-to-date statistics on every database table
that is referenced in a query. A majority of these metrics are captured during
query execution with very low overhead, yielding just-in-time statistics that
are specific to each query. The optimizer uses these statistics to transform
queries before processing begins, which helps to minimize disk I/O and data
movement. Typical transformation operations performed by the optimizer
include: determining the correct join order, rewriting expressions, and removing
redundancy from SQL operations.
The appliance nature of Netezza, with integrated components that are
able to communicate with each other, enables its cost-based optimizer to
more accurately measure disk, processing, and network costs associated with
an operation. By relying on accurate data, instead of heuristics alone, the opti-
mizer is able to generate query plans that utilize all components with extreme
efficiency. One example of optimizer intelligence is the ability to determine the
best join order in a complex join. For example, when joining multiple small
Execution Engine
FPGA Engines
Execution Engine
FPGA Engines
Execution Engine
FPGA Engines
Object Cache
Scheduler
Scheduling
Optimizer
Compiler
Query Analysis
S-Blades Network
Fabric
Host
Disk
Enclosures
System Catalog
Figure 4-4 Query orchestration in Netezza
04-ch04.indd 74 03/10/12 7:01 PM
106.
A Big DataPlatform for High-Performance Deep Analytics 75
Flash 6X9 / Harness the Power of Big Data:The IBM Big Data Platform / Zikopoulos / 817-5
tables to a large fact table, the optimizer can choose to broadcast the small tables
in their entirety to each S-blade, while keeping the large table distributed
across all snippet processors. This approach minimizes data movement while
taking advantage of the AMPP architecture to parallelize the join.
Snippet Compilation
A compiler converts a query plan into executable code segments, called snip-
pets. Query segments are executed by snippet processors in parallel across all
of the data streams in the appliance. Each snippet has two elements: com-
piled code that’s executed by individual CPU cores, and a set of FPGA pa-
rameters that customize the embedded engines’ filtering for that particular
snippet. This snippet-by-snippet customization enables Netezza to provide,
in effect, a hardware configuration that is optimized on the fly for individual
queries.
The host uses a feature called the object cache to further accelerate query
performance. This is a large cache of previously compiled snippet code that
supports parameter variations. For example, a snippet with the clause WHERE
NAME='Bob' might use the same compiled code as a snippet with the clause
WHERE NAME='Jim' but with settings that reflect the different name. This
approach eliminates the compilation step for over 99 percent of snippets.
Just-In-Time Scheduling
The Netezza scheduler balances execution across complex workloads to
meet the objectives of different users, while maintaining maximum utiliza-
tion and throughput. It considers a number of factors, including query prior-
ity, size, and resource availability in determining when to execute snippets
on the S-blades. The appliance architecture enables the scheduler to gather
more up-to-date and accurate metrics about resource availability from each
component of the system. Sophisticated algorithms are at the heart of this
scheduler and empower Netezza to maximize system throughput by utiliz-
ing close to 100 percent of the disk bandwidth while ensuring that memory
and network resources don’t get overloaded and cause the system to lose
efficiency. This important characteristic of the Netezza appliance ensures
that the system keeps performing at peak throughput even under very heavy
loads. When the scheduler gives the “green light,” the snippet is broadcast to
all snippet processors throughout the intelligent network fabric.
04-ch04.indd 75 03/10/12 7:01 PM
107.
76 Harnessthe Power of Big Data: The IBM Big Data Platform
Flash 6X9 / Harness the Power of Big Data:The IBM Big Data Platform / Zikopoulos / 817-5
Massively Parallel Snippet Processing
Every S-blade’s snippet processor receives the specific instructions that it
needs to execute its portion of the snippet. In addition to the host scheduler,
the snippet processors have their own smart pre-emptive scheduler that allows
snippets from multiple queries to execute simultaneously. This scheduler
takes into account the priority of the query and the resources set aside for the
user or group that issued the query to decide when and for how long to
schedule a particular snippet for execution. The following steps outline the
sequence of events associated with snippet processing:
1. The processor core on each snippet processor configures the FPGA
engines with parameters contained in the query snippet and sets up
a data stream.
2. The snippet processor reads table data from the disk array into
memory. It also interrogates the cache before accessing the disk for a
data block, avoiding a scan if the data is already in memory. The
snippet processor uses a Netezza innovation called ZoneMap
acceleration to reduce disk scans.
ZoneMap acceleration exploits the natural ordering of rows in a
data warehouse to accelerate performance by orders of magnitude.
The technique avoids scanning rows with column values outside the
start and end range of a query. For example, if a table contains two
years of weekly records (~100 weeks), and a query is looking for
data for only one week, ZoneMap acceleration can improve
performance up to 100 times. Unlike typical indexes associated with
optimizations in traditional data warehousing technology,
ZoneMaps are automatically created and updated for each database
table, without incurring any administrative overhead.
3. The FPGA acts on the data stream. First, it accelerates it four- to
eight-fold by decompressing data stream at the transmission speed
of the network. Next, its embedded engines filter out any data that’s
not relevant to the query. The remaining data is streamed back to
memory for concurrent processing by the CPU core (as we show in
Figure 4-3). The resultant data at this stage is typically a tiny fraction
(2 to 5 percent) of the original stream, greatly reducing the execution
time that’s required by the processor core.
04-ch04.indd 76 03/10/12 7:01 PM
108.
A Big DataPlatform for High-Performance Deep Analytics 77
Flash 6X9 / Harness the Power of Big Data:The IBM Big Data Platform / Zikopoulos / 817-5
4. The processor core picks up the data stream and performs core
database operations such as sorts, joins, aggregations, and so on. It
also applies complex algorithms that are embedded in the snippet
processor for advanced analytics. Results of each snippet processor’s
work are assembled in memory to produce a subresult for the entire
snippet. With more than a thousand snippet processors working
simultaneously, hundreds or thousands of query snippets can
execute in parallel. Snippet processors use the intelligent network
fabric to communicate with the host (and with each other) and
perform intermediate calculations and aggregations. Some highly
complex algorithms, such as matrix computations, require
communication among nodes. For this reason, Netezza engineered a
message-passing interface to communicate interim results and to
produce the final result.
5. Finally, the host assembles the intermediate results received from
the snippet processors, compiles the final result set, and returns it
to the application. Of course, during this time, other queries are
streaming through the system at various stages of completion.
This gives Netezza another point of optimization: because the
original compressed data blocks are still in memory, they can be
automatically reused in later queries requiring similar data
through the table cache—an automated mechanism requiring no
administrator involvement.
Platform for Advanced Analytics
Traditionally, analytics had to be built and deployed on separate analytics
servers. These servers would run computationally intensive analytical algo-
rithms and interface with a data repository, such as a data warehouse, on the
back end. This architecture lengthens the time from model inception to deploy-
ment, and requires data movement from the data repository to the analytics
server. Not only does this process take too much time, but it’s inefficient,
limits the data that can be used to derive insight, constrains the scope of the
analytic modeling, and impedes the ability to experiment iteratively.
Netezza offers a distinctive and simple-to-use approach for serious ana-
lytics on structured data with IBM Netezza Analytics, an advanced
04-ch04.indd 77 03/10/12 7:01 PM
109.
78 Harnessthe Power of Big Data: The IBM Big Data Platform
Flash 6X9 / Harness the Power of Big Data:The IBM Big Data Platform / Zikopoulos / 817-5
analytics platform that’s shipped free inside every Netezza appliance. With
IBM Netezza Analytics, analytic activities such as data exploration, discov-
ery, transformation, model building, and scoring can all be performed right
where the data resides—in the data warehouse. This reduces the time that
it takes to build and deploy analytic models throughout an enterprise. By
shrinking the time from model inception to deployment, companies can move
to enterprise-wide, fact-based decisions by infusing more of their decisions
with insightful on-demand analytics. This also enables practitioners to
experimentally iterate through different analytical models more quickly to
find the best fit. After a model is developed, it can seamlessly be executed
against all of the relevant data in the enterprise. The prediction and scoring
can be done right where the data resides, inside the data warehouse. Users
can get the results of prediction scores in near-real time, helping to
operationalize advanced analytics and making it available throughout the
enterprise.
IBM NetezzaAnalytics supports multiple tools, languages, and frameworks.
It enables analytic applications, visualization tools, and business intelligence
tools to harness parallelized advanced analytics through a variety of program-
ming methods such as SQL, Java, MapReduce, Python, R, C, C++, and Fortran;
all can be used to deliver powerful, insightful analytics. The comprehensive
advanced analytics environment makes it easy to derive benefit from this plat-
form, giving you the flexibility to use your preferred tools for ad-hoc analysis,
prototyping, and production deployment of advanced analytics.
The Netezza analytics platform enables the integration of its robust set of
built-in analytics with leading analytics tools from such vendors as Revolu-
tion Analytics (who ship a commercial version of R), SAS, IBM SPSS, Fuzzy
Logix, and Zementis. Additionally, you can develop new capabilities using
the platform’s user-defined extensions. The entire Netezza analytics plat-
form is shown in Figure 4-5.
IBM Netezza Analytics includes a built-in library of parallelized analytic
functions, purpose-built for large data volumes, that flattens the time-to-
development curve for any analytics project. Table 4-1 summarizes some of
these key built-in analytic functions and their benefits.
04-ch04.indd 78 03/10/12 7:01 PM
110.
A Big DataPlatform for High-Performance Deep Analytics 79
Flash 6X9 / Harness the Power of Big Data:The IBM Big Data Platform / Zikopoulos / 817-5
Extending the Netezza Analytics
Platform with Hadoop
As previously mentioned, the principle of massive parallelism and close-to-
source data processing (embodied by all parts of the IBM Big Data platform,
including Netezza, InfoSphere BigInsights [Hadoop], InfoSphere Streams,
and InfoSphere Data Explorer) provides enormous benefits for advanced
analytics running on large data sets. Because Hadoop and Netezza both
work on stored data, we want to explain when to use each, and how the two
technologies work together. Hadoop’s ability to run on commodity servers,
Transformations Execute in-database data transformations to realize significant
performance gains.
Mathematical Perform deep in-database mathematical calculations to leverage MPP
processing.
Statistics Calculate rich statistics without moving the data.
Time series Create forecasts and identify trends using rich histories to improve
model accuracy.
Data mining Use more data, or all of the data, to discover new and emerging insights.
Predictive Move from batch processing to near-real-time speed-of-thought analytics
to predict with great accuracy and speed.
Geospatial Implement location-based analytics on Big Data with immediate
feedback.
Table 4-1 In-Database Analytics Built into IBM Netezza Analytics
IBM
InfoSphere
Streams
Software
Development
Kit
User-Defined
Extensions
(UDF, UDA,
UDTF, UDAP)
IBM SPSS
DBLytix by
Fuzzy Logix
Universal
PMML Plug-
In by Zementis
SAS 9.3+
Language
Support
(MapReduce,
Java, Python,
R, Lua, Perl,
C, C++,
Fortran,
PMML)
Third-Party
In-Database
Analytics
Netezza
In-Database
Analytics
Transformations
Mathematical
IBM SPSS
SAS
Revolution
Analytics
Eclipse
BI Tools
Visualization
Tools
IBM Netezza AMPP Platform
IBM
InfoSphere
BigInsights
Cloudera
Apache Hadoop
Tanay GPU
Appliance
by Fuzzy
Logix
Geospatial
Predictive
Statistics
Time Series
Data Mining
Figure 4-5 The IBM Netezza analytics platform
04-ch04.indd 79 03/10/12 7:01 PM
111.
80 Harnessthe Power of Big Data: The IBM Big Data Platform
Flash 6X9 / Harness the Power of Big Data:The IBM Big Data Platform / Zikopoulos / 817-5
store a wide variety of data types, process analytic queries through MapReduce,
and predictably scale with increased data volumes is a very attractive solu-
tion set for Big Data analytics. Netezza’s ability to embed complex non-SQL
algorithms in the processing elements of its MPP stream, without the typical
intricacies of Hadoop programming, enables low-latency access to high
volumes of structured data that can be integrated with a wide variety of
enterprise BI and ETL tools. These principles make Netezza the ideal platform
for the convergence of data warehousing and advanced analytics. To leverage
the best of both worlds, Netezza offers different connectivity solutions with a
Hadoop cluster (we cover Hadoop in Chapter 5).
Because the IBM Big Data platform is so flexible, we thought it would be
worthwhile to discuss some typical scenarios that use Hadoop in conjunction
with Netezza.
Exploratory Analysis
Sometimes an organization encounters a new source of data that needs to be
analyzed. They might have little to no knowledge about the format of this
new data source, the data types that it contains, or the relationships it encap-
sulates. For example, suppose that the marketing department has launched a
new multichannel campaign and wants to integrate responses from Face-
book and Twitter with other sources of data that they might have. If you’ve
never used Facebook or Twitter APIs, or are not familiar with their data feed
structures, it might take some experimentation (data discovery) to figure out
what to extract from this feed and how to integrate it with other sources.
Hadoop’s ability to process data feeds for which a schema has not yet been
defined is ideal in this scenario. So if you want to explore relationships within
data, especially in an environment where the schema is constantly evolving,
Hadoop provides a mechanism by which you can explore the data until a
formal, repeatable ETL process is defined. After that process is defined and
structure is established, the data can be loaded into Netezza for standardized
reporting or ad-hoc analysis.
Hadoop Is the NewTape:The Queryable Archive
Big Data analytics tend to bring large volumes of data under investigation.
Quite often we find that a significant percentage of this data might not be of
interest on a regular basis. Such data might be of an historical nature or very
granular data that has subsequently been summarized within the data
04-ch04.indd 80 03/10/12 7:01 PM
112.
A Big DataPlatform for High-Performance Deep Analytics 81
Flash 6X9 / Harness the Power of Big Data:The IBM Big Data Platform / Zikopoulos / 817-5
warehouse. Putting all of this data within an infrastructure that is primarily
optimized for performance might not be economically viable. For this reason,
enterprises might want to optimize their analytics footprint and store the
less frequently accessed data on infrastructure that’s optimized for price per
terabyte of storage, and leverage the higher performing infrastructure
as needed.
Since Hadoop’s fault-tolerant distributed storage system runs on commodity
hardware, it could serve as a repository for this type of data. Unlike tape-
based storage systems that have no computational capability, Hadoop provides
a mechanism to access and analyze data. Because moving computation is
cheaper than moving data, Hadoop’s architecture is better suited as a queryable
archive for Big Data. In fact, the number one use case that countless enter-
prise customers have described to us involves the architecture of “hot-cold”
data storage schemes between Netezza and Hadoop, where the most actively
used data is warehoused in Netezza, and everything else is archived in Hadoop.
Of course, in addition to the native connectors that are built into Hadoop,
IBM provides a whole information integration and governance platform
(which we cover in Chapters 10 and 11) that can help to facilitate and govern
this process.
Unstructured Data Analysis
Relational data warehouses provide limited capabilities for storing complex
data types and unstructured data. What’s more, performing computations on
unstructured data through SQLcan be quite cumbersome and limited. Hadoop’s
ability to store data in any format and analyze that data using a procedural
programming paradigm, such as MapReduce, makes it well suited for storing,
managing, and processing unstructured data. You could use Hadoop to
preprocess unstructured data, extract key features and metadata, and then
load that data into your Netezza data warehouse for further analysis.
Customers’ Success Stories:
The Netezza Experience
It’s a fact: hundreds of organizations have escaped the frustrations of their
first-generation data warehouses by replacing older database technologies
with IBM Netezza’s data warehousing and analytic appliances. The systems
04-ch04.indd 81 03/10/12 7:01 PM
113.
82 Harnessthe Power of Big Data: The IBM Big Data Platform
Flash 6X9 / Harness the Power of Big Data:The IBM Big Data Platform / Zikopoulos / 817-5
that were replaced forced users to deal with too much complexity; the ware-
houses demanded constant attention and administration from highly trained
specialists. This complexity is doubly corrosive: the costs of administration
spiral upward and out of control as data volumes grow, while the business,
distanced from its data, must seek technical expertise to manage its interac-
tions with its information.
As we noted earlier, Netezza revolutionized the data warehousing market
and caused traditional data warehouse providers to change their strategies.
Why did the market change its course, or accelerate plans, when Netezza took
the marketplace by storm? Simple: customers were able to refocus their time
away from the technical aspects of managing data and toward the business
and the greater role that data can play in its success. Individuals who previ-
ously spent as much as 90 percent of their time consumed in low-level technical
work now rarely interact with the technology, but constantly interact with the
business and its data to investigate new ways to create value from their data.
We thought it’d be worthwhile to share with you just a few customer stories that
highlight why and how Netezza blazed the trail for data warehouse appliances.
T-Mobile: Delivering Extreme Performance
with Simplicity at the Petabyte Scale
Every day, T-Mobile processes more than 17 billion events, including phone
calls, text messages, and data traffic over its networks. This translates to upward
of 2PB of data that needs to be crunched. T-Mobile needed a Big Data solu-
tion that could store and analyze multiple years worth of call detail records
(CDRs) containing switch, billing, and network event data for its millions of
subscribers. T-Mobile wanted to identify and address network bottlenecks
and to ensure that quality and capacity would be provisioned when and
where they are needed.
Netezza proved to be the right solution for T-Mobile to manage its mas-
sive growth in data. More than 1,200 users access its Netezza system. They
analyze over 17 billion events per day and perform network quality of expe-
rience (QoE) analytics, traffic engineering, churn analysis, dropped session
analytics, as well as voice and data session analytics. Since deploying Netezza,
T-Mobile has realized a significant reduction in data warehouse administra-
tive activities compared to its previous solution, and has also been able to
04-ch04.indd 82 03/10/12 7:01 PM
114.
A Big DataPlatform for High-Performance Deep Analytics 83
Flash 6X9 / Harness the Power of Big Data:The IBM Big Data Platform / Zikopoulos / 817-5
reduce tax and call-routing fees by using the greater volume of granular data
to defend against false claims. To top it off, T-Mobile has been able to increase
network availability by identifying and fixing network bottlenecks and
congestion issues whenever they arise.
State University of NewYork: Using Analytics
to Help Find a Cure for Multiple Sclerosis
The State University of New York (SUNY) at Buffalo is home to one of the
leading multiple sclerosis (MS) research centers in the world. MS is a devas-
tating, chronic neurological disease that affects nearly one million people
worldwide. The SUNY team has been looking at data obtained from scanned
genomes of MS patients to identify genes whose variations could contribute
to the risk of developing MS. Their researchers postulated that environmen-
tal factors, along with genetic factors, determine a person’s MS risk profile.
SUNY’s goal was to explore clinical and patient data to find hidden trends
among MS patients by looking at factors such as gender, geography, ethnicity,
diet, exercise, sun exposure, and living and working conditions. Their data
sources for this analysis included medical records, lab results, MRI scans,
and patient surveys; in short, a wide variety of data in enormous volumes.
The data sets used in this type of multivariable research are very large, and
the analysis is computationally very demanding because the researchers are
looking for significant interactions among thousands of genetic and environ-
mental factors. The computational challenge in gene-environmental interaction
analysis is due to a phenomenon called combinatorial explosion. Just to give
you a sense of the number of computations necessary for data mining in this
scenario, think about a 1 followed by 18 zeroes (we’re talking quintillions
here)!
SUNY researchers wanted to not only see which variable is significant to
the development of MS, but also which combinations of variables are signifi-
cant. They decided to use Netezza as their data platform. By using Revolu-
tion R Enterprise for Netezza, in conjunction with the IBM Netezza Analytics
system, they were able to quickly build models using a range of variable types
and to run them against huge data sets spanning more than 2,000 genetic and
environment factors that might contribute to MS. This solution helped the
SUNY researchers to consolidate all reporting and analysis into a single
04-ch04.indd 83 03/10/12 7:01 PM
115.
84 Harnessthe Power of Big Data: The IBM Big Data Platform
Flash 6X9 / Harness the Power of Big Data:The IBM Big Data Platform / Zikopoulos / 817-5
location to improve the efficiency, sophistication, and impact of their re-
search, and to reduce the time required to conduct this analysis from
27 hours to 11 minutes!
NYSE Euronext: Reducing Data Latency
and Enabling Rapid Ad-Hoc Searches
NYSE Euronex is a Euro-American corporation that operates multiple securi-
ties exchanges, most notably the New York Stock Exchange (NYSE) and Eu-
ronext. NYSE ingests about 8 billion transactions per day. On certain days, for
example when we had the financial market “flash crash,” they process over
15 billion transactions. This is 2TB to 4TB of data that needs to be ingested into
their data warehouse each day. Their analysts track the value of a listed com-
pany, perform trend analysis, and search for evidence of fraudulent activity.
NYSE and Euronext perform market surveillance and analyze each and every
transaction from a trading day, which translates into full table scans on mas-
sive volumes of data. As is the case with many enterprises, NYSE and Euron-
ext’s traditional data warehouse was moving data back and forth between the
storage systems and their analytic engine, and took over 26 hours to complete
certain types of processing. They also have global customers and need 24/7
access without any downtime. How did they address these challenges? They
chose Netezza. Netezza’s core tenet of running compute close to data mini-
mized network traffic and reduced the time needed to access business critical
data from 26 hours to 2 minutes. It facilitated rapid ad-hoc searches over a
petabyte of data and opened up new analytical capabilities.
04-ch04.indd 84 03/10/12 7:01 PM
116.
Flash 6X9 /Harness the Power of Big Data:The IBM Big Data Platform / Zikopoulos / 817-5
85
5
IBM’s Enterprise Hadoop:
InfoSphere BigInsights
Few technologies have gotten more buzz over the past few years than
Hadoop and NoSQL. Couple that with Big Data, and you have enough
hype to write a whole library of trendy technical books. There’s a reason for
all the excitement around these technologies. Traditional data storage and
analytics tools have not been cutting it when dealing with Big Data. From a
volume perspective, many tools start being impractical when thresholds in
the dozens of terabytes are exceeded. Sometimes “impractical” means that
the technology simply won’t scale any further, or that a tipping point is
reached in terms of how much time it takes to transfer a data set over the
network for processing. And other times, impractical means that although
the technology can scale, the licensing, administrative, and hardware costs
to deal with increased volume become unpalatable. From a variety perspec-
tive, traditional analytic tools only work well with structured data, which
represents, at most, 20 percent of the data in the world today. Finally, there
is the issue of how fast the data is arriving at your organization’s door-
step—Big Data velocity—which we detail in the next chapter.
Considering the pressing need for technologies that can overcome the
volume and variety challenges for data at rest, it’s no wonder that business
magazines and online tech forums alike are buzzing about Hadoop and
NoSQL. And it’s not all talk either. The IT departments in most Fortune 500
companies have done some level of experimentation with Hadoop and the like.
05-ch05.indd 85 04/10/12 4:36 PM
117.
86 Harnessthe Power of Big Data: The IBM Big Data Platform
Flash 6X9 / Harness the Power of Big Data:The IBM Big Data Platform / Zikopoulos / 817-5
The problem is that many of these initiatives have stagnated in the “science
project” phase. The challenges are common: it’s easy and exciting to start
dumping data into these repositories; the hard part comes with what to do
next. Meaningful analysis of data that is stored in Hadoop requires highly
specialized programming skills—and for many algorithms, it can be very
challenging to put them into a parallelizable form so that they can run in
Hadoop. And what about information governance concerns, such as security
and data lifecycle management, where new technologies like Hadoop don’t
have a complete story?
IBM sees the tremendous potential for technologies such as Hadoop to
have a transformative impact on businesses. This is why IBM has scores of
researchers, developers, and support staff continually building out a platform
for Hadoop, called IBM InfoSphere BigInsights (BigInsights). BigInsights was
released in October, 2010, with a relatively straightforward goal: make
Hadoop enterprise-ready. We describe three main aspects of enterprise readi-
ness in this chapter:
• Analytics support Enable different classes of analysts to get value
out of data that is stored in BigInsights without asking them to pass
requirements over the fence to Hadoop programmers, or buying
expensive consulting hours to procure custom Hadoop applications
that no one in your organization understands. Think consumability!
• Data integration If your business is analyzing data that is stored in
Hadoop, you’ll need to ensure that your Hadoop system integrates
with the rest of your IT infrastructure. For example, you’ll need to be
able to query Hadoop data from your warehouse environment, and,
inversely, query warehouse data from your Hadoop environment.
• Operational excellence After you start depending on analytics that is
generated by Hadoop, you will need to govern and administer the
data that is stored in Hadoop. BigInsights includes a number of key
features for security, governance, administration, and performance.
Before we describe the BigInsights extensions to Hadoop, you’ll need to
understand what Hadoop is in the first place.
05-ch05.indd 86 04/10/12 4:36 PM
118.
IBM’s Enterprise Hadoop:InfoSphere BigInsights 87
Flash 6X9 / Harness the Power of Big Data:The IBM Big Data Platform / Zikopoulos / 817-5
What the Hadoop!
At a very high level, Hadoop is a distributed file system and data processing
engine that is designed to handle extremely high volumes of data in any struc-
ture. In simpler terms, just imagine that you’ve got dozens, or even hundreds
(or thousands!) of individual computers racked and networked together.
Each computer (often referred to as a node in Hadoop-speak) has its own proces-
sors and a dozen or so 2TB or 3TB hard disk drives. All of these nodes are run-
ning software that unifies them into a single cluster, where, instead of seeing the
individual computers, you see an extremely large volume where you can
store your data. The beauty of this Hadoop system is that you can store any-
thing in this space: millions of digital image scans of mortgage contracts,
days and weeks of security camera footage, trillions of sensor-generated log
records, or all of the operator transcription notes from a call center. This in-
gestion of data, without worrying about the data model, is actually a key
tenet of the NoSQLmovement (this is referred to as “schema later”). In contrast,
the traditional SQL and relational database world depends on the opposite
approach (“schema now”), where the data model is of utmost concern upon
data ingest. This is where the flexibility of Hadoop is even more apparent.
It’s not just a place where you can dump many files. There are Hadoop-based
databases where you can store records in a variety of models: relational, co-
lumnar, and key/value. In other words, with data in Hadoop, you can go
from completely unstructured to fully relational, and any point in between.
The data storage system that we describe here is known as the Hadoop distrib-
uted file system (HDFS).
Let’s go back to this imaginary Hadoop cluster with many individual
nodes. Suppose that your business uses this cluster to store all of the click-
stream log records for its e-commerce site. Your Hadoop cluster is using the
BigInsights distribution, and you and your fellow analysts decide to run
some of the sessionization analytics against this data to isolate common pat-
terns for customers who leave abandoned shopping carts—we call this use
case last mile optimization. When you run this application, Hadoop sends cop-
ies of your application logic to each individual computer in the cluster, to be
run against data that’s local to each computer. So instead of moving data to a
05-ch05.indd 87 04/10/12 4:36 PM
119.
88 Harnessthe Power of Big Data: The IBM Big Data Platform
Flash 6X9 / Harness the Power of Big Data:The IBM Big Data Platform / Zikopoulos / 817-5
central computer for processing (bringing data to the function), it’s the
application that gets moved to all of the locations in which the data is stored
(bringing function to the data). This programming model is known as Hadoop
MapReduce.
Where Elephants Come From:
The History of Hadoop
Now that you’ve got a high-level sense of what Hadoop is, we can get into
why it’s revolutionizing IT. First, let’s look at Hadoop’s origins.
Hadoop was inspired by Google’s work on its Google (distributed) file sys-
tem (GFS) and the MapReduce programming paradigm. IBM has long been
involved with MapReduce, as it teamed up with Google in October 2007 to do
some joint university research on MapReduce and GFS for large-scale Internet
problems. Shortly after Google published papers describing GFS and
MapReduce (in 2003 and 2004 respectively), people in the open source com-
munity (led by Doug Cutting) applied these tools to the open source Nutch
search engine. It became quickly apparent that the distributed file system
and MapReduce modules together had applications beyond just the search
world. It was in early 2006 that these software components became their own
research project, called Hadoop. Hadoop is quite the odd name (and you’ll find
a lot of odd names in the Hadoop world). Read any book on Hadoop today and
it pretty much starts with the name that serves as this project’s mascot, so let’s
start there too. Hadoop is actually the name that creator Doug Cutting’s son
gave to his stuffed toy elephant. In thinking up a name for his project, Cutting
was apparently looking for something that was easy to say and stands for nothing
in particular, so the name of his son’s toy seemed to make perfect sense.
Much of the work in building Hadoop was done by Yahoo!, and it’s no
coincidence that the bulk of the inspiration for Hadoop has come out of the
search engine industry. Hadoop was a necessary innovation for both Yahoo!
and Google, as Internet-scale data processing became increasingly impracti-
cal on large centralized servers. The only alternative was to scale out and
distribute storage and processing on a cluster of thousands of nodes. Yahoo!
reportedly has over 40,000 nodes spanning its Hadoop clusters, which store
over 40PB of data.
The Hadoop open source team took these concepts from Google and made
them applicable to a much wider set of use cases. Unlike transactional systems,
Hadoop is designed to scan through large data sets and to produce its results
05-ch05.indd 88 04/10/12 4:36 PM
120.
IBM’s Enterprise Hadoop:InfoSphere BigInsights 89
Flash 6X9 / Harness the Power of Big Data:The IBM Big Data Platform / Zikopoulos / 817-5
through a highly scalable, distributed batch processing system. Hadoop is not
about speed-of-thought response times, real-time warehousing, or blazing
transactional speeds; however, it is about discovery and making the once-nearly-
impossible possible from a scalability and analytics perspective.
Components of Hadoop and Related Projects
As mentioned earlier, Hadoop is generally seen as having two parts: a file
system (HDFS) and a programming paradigm (MapReduce). One of the key
components of Hadoop is the redundancy that is built into the environment.
Not only is data redundantly stored in multiple places across the cluster, but
the programming model is such that failures are expected and are resolved
automatically by running portions of the program on various servers in the
cluster. Because of this redundancy, it’s possible to distribute the data and
programming across a very large cluster of commodity components, like the
cluster that we discussed earlier. It’s well known that commodity hardware
components will fail (especially when you have very large numbers of them),
but this redundancy provides fault tolerance and the capability for the Hadoop
cluster to heal itself. This enables Hadoop to scale out workloads across large
clusters of inexpensive machines to work on Big Data problems.
There are many Hadoop-related projects, and some of the more notable
ones include: Apache Avro (for data serialization), Cassandra and HBase
(databases), Hive (provides ad-hoc SQL-like queries for data aggregation and
summarization), Mahout (a machine learning library), Pig (a high-level Hadoop
programming language that provides a data-flow language and execution
framework for parallel computation), and ZooKeeper (provides coordination
services for distributed applications). We don’t cover these related projects
due to the size of the book, but there’s lots of information available on the
Web, and of course, BigDataUniversity.com.
Hadoop 2.0
For as long as Hadoop has been a popular conversation topic around IT water
coolers, the NameNode single point of failure (SPOF) has inevitably been
brought up. Interestingly enough, for all the talk about particular design lim-
itations, there were actually very few documented NameNode failures, which
is a testament to the resiliency of HDFS. But for mission-critical applications,
even one failure is one too many, so having a hot standby for the Name-
Node is extremely important for wider enterprise adoption of Hadoop.
05-ch05.indd 89 04/10/12 4:36 PM
121.
90 Harnessthe Power of Big Data: The IBM Big Data Platform
Flash 6X9 / Harness the Power of Big Data:The IBM Big Data Platform / Zikopoulos / 817-5
The MapReduce processing layer (the JobTracker server) also has a single
point of failure.
In Hadoop 1.0 deployments, you can address the NameNode availability
problem through active/passive failover solutions. One option is to automati-
cally replicate data between two separate Hadoop clusters. Another option is
to have a dedicated backup for the master node (which includes the NameNode,
and can also include the JobTracker service), so that all of the Hadoop
cluster’s NameNode metadata is backed up. In the event of a NameNode
failure, the Hadoop cluster can restart, using the backup NameNode.
In Hadoop 2.0 (which was in alpha state at the time of writing), there are
two significant availability improvements: the ability to designate a hot
standby for the HDFS NameNode, and YARN (also known as MapReduce2),
which distributes JobTracker functionality so that this server is no longer a
SPOF. IBM committers are working with the open source community to make
Hadoop 2.0 production-ready, and, of course, IBM intends to keep BigInsights
current with the latest enterprise-ready open source innovations.
In the open source community, there is some controversy as some vendors
have released Hadoop 2.0 code in the GenerallyAvailable (GA) editions of their
products. The point of contention is that the Hadoop 2.0 code being included
here is not classified as production-ready. Other vendors, including IBM and
Hortonworks, have shied away from this approach, reaffirming their policies
to release only production-ready open source code in their distributions.
We’d love to get into more depth and describe how HDFS and MapRe-
duce work, not to mention the additional projects in the Apache Hadoop
ecosystem, but space is limited. To learn about Hadoop in greater detail, visit
BigDataUniversity.com, where you can find a number of quality online
courses for free!
What’s in the Box:The Components of
InfoSphere BigInsights
Before describing the enterprise-readiness capabilities of BigInsights, we’d like
to establish a context, and go over the product’s main components from both a
licensing and packaging perspective, and a software component perspective.
We’ll describe the Hadoop components included in BigInsights, the main
user interface for BigInsights (the BigInsights Web Console), the developer
tooling, and the various editions that are available.
05-ch05.indd 90 04/10/12 4:36 PM
122.
IBM’s Enterprise Hadoop:InfoSphere BigInsights 91
Flash 6X9 / Harness the Power of Big Data:The IBM Big Data Platform / Zikopoulos / 817-5
Hadoop Components Included
in InfoSphere BigInsights 2.0
BigInsights features Apache Hadoop and its related open source projects as a
core component. This is informally known as the IBM Distribution for Hadoop.
IBM remains committed to the integrity of these open source projects, and will
ensure 100 percent compatibility with them. This fidelity to open source pro-
vides a number of benefits. For people who have developed code against other
100 percent open source–compatible distributions, their applications will also
run on BigInsights, and vice versa. This open source compatibility has enabled
IBM to amass over 100 partners, including dozens of software vendors, for
BigInsights. Simply put, if the software vendor uses the libraries and interfaces
for open source Hadoop, they’ll work with BigInsights as well.
IBM also releases regular product updates for BigInsights so that it remains
current with the latest releases of the open source components.
The following table lists the open source projects (and their versions) that
are included in BigInsights 2.0, which was the most current version available
at the time of writing.
Component Version
Hadoop (common utilities, HDFS, and the MapReduce framework) 1.0.3
Avro (data serialization) 1.6.3
Chukwa (monitoring large clustered systems) 0.5.0
Flume (data collection and aggregation) 0.9.4
HBase (real-time read and write database) 0.94.0
HCatalog (table and storage management) 0.4.0
Hive (data summarization and querying) 0.9.0
Lucene (text search) 3.3.0
Oozie (work flow and job orchestration) 3.2.0
Pig (programming and query language) 0.10.1
Sqoop (data transfer between Hadoop and databases) 1.4.1
ZooKeeper (process coordination) 3.4.3
With each release of BigInsights, updates to both the open source compo-
nents and IBM components go through a series of testing cycles to ensure
that they work together. That’s another special point that we want to clarify:
You can’t just drop new code into production. In our experience, backward-
compatibility issues are always present in open source projects. BigInsights
pretty much takes away all of the risk and guesswork that’s associated with
05-ch05.indd 91 04/10/12 4:36 PM
123.
92 Harnessthe Power of Big Data: The IBM Big Data Platform
Flash 6X9 / Harness the Power of Big Data:The IBM Big Data Platform / Zikopoulos / 817-5
typical open source projects for your Hadoop components. It goes through
the same rigorous regression and quality assurance testing processes used
for other IBM software. So ask yourself this: Would you rather be your own
systems integrator, repeatedly testing all of the Hadoop components to ensure
compatibility? Or would you rather let IBM find a stable stack that you can
deploy without worry?
IBM’s tradition of open source support continues with Hadoop. The Big
Insights development team includes a set of committers to the Hadoop project
and its related projects. These committers contribute to the leadership of the
open source projects, and have the task of donating IBM code to the open
source code base. By having committers on the BigInsights development
team, IBM is more involved in the continuing evolution of open source Ha-
doop. IBM is also able to find and eliminate bugs in the open source code
faster than would otherwise be possible. The hope that we share with the
open source Hadoop community is that collectively, we’ve learned lessons
from the UNIX wars, in which decades of development effort were wasted
when technology firms built their own UNIX flavors to solve the same prob-
lems. With open source Hadoop, even though the companies involved are
competitors, there is a shared interest in making Hadoop better.
The BigInsights Web Console
One of the nice features BigInsights brings to Hadoop is a rich interface called
the BigInsights Web Console (see Figure 5-1). Whether you’re running on a
public cloud instance in a cluster half-way across the world, or on a 1,000-node
cluster in your firm’s server farm, this console is the focal point of the entire
cluster, because all administration, application deployment, and application
execution activities are performed there. The BigInsights Web Console has a
number of capabilities that we cover in later sections, but for now take note of
the task assistance on the left side of Figure 5-1, designed for consumability.
What you’re able to see in the console depends on your level of access as a
BigInsights user. For example, if you have an administrator account, you can
see the administrative dashboards, such as Application Status and Cluster
Status. And if you have a user account, you’ll only be able to see the dash-
boards that are applicable to browsing files, running applications, and doing
analysis work, namely the File Explorer, the Application Dashboard, and the
BigSheets interface.
05-ch05.indd 92 04/10/12 4:36 PM
124.
IBM’s Enterprise Hadoop:InfoSphere BigInsights 93
Flash 6X9 / Harness the Power of Big Data:The IBM Big Data Platform / Zikopoulos / 817-5
The BigInsights DevelopmentTools
In addition to the Web Console, BigInsights includes a set of Eclipse plug-ins for
the development of applications that work with Big Data. This package of plug-
ins can be downloaded from the Web Console, complete with installation
instructions. This development tooling includes two Eclipse perspectives: BigIn-
sights (which is oriented toward developing data processing applications using
SQL, Jaql Hive, HBase, Pig, or MapReduce); and BigInsights Text Analytics
(which directs you through a workflow for building text analytics applications).
The Big Data platform comes with other perspectives as well, such as one for
building applications for IBM InfoSphere Streams.
The BigInsights development tools can connect to the Web Console to gain
cluster awareness. This enables developers to easily test and deploy applica-
tions, and to work directly with the cluster. In the upcoming section on analytics,
we show you how the BigInsights Web Console and the development tools
work together to provide a full lifecycle for building, testing, and deploying
applications.
Figure 5-1 The BigInsights Web Console
05-ch05.indd 93 04/10/12 4:36 PM
125.
94 Harnessthe Power of Big Data: The IBM Big Data Platform
Flash 6X9 / Harness the Power of Big Data:The IBM Big Data Platform / Zikopoulos / 817-5
BigInsights Editions: Basic and Advanced
BigInsights comes in two editions: a free offering (Basic), and a for-fee offer-
ing (Enterprise). BigInsights Basic Edition is IBM’s integrated, tested, and
preconfigured download for anyone who wants to experiment with Hadoop.
This edition includes the BigInsights installer, which gives you a quick and
simple clickable path to your own Hadoop cluster. As a package of open
source components, this represents the IBM Distribution for Hadoop. With
the exception of a few database connectors and some of the tooling functions,
none of the analytics, integration, or operational excellence features are included
in this distribution. If you ever want to move to the Enterprise Edition, it’s a
seamless process.
BigInsights Enterprise Edition includes all of the features in BigInsights
Basic Edition plus the analytics, integration, and operational excellence capa-
bilities that we describe later in this chapter. Included with this license is also
a limited use license for Streams, which entitles you to run streaming data
jobs in conjunction with your data-at-rest processing using BigInsights
(there’s lots of integration here—more on that in the next chapter). To reflect
different kinds of deployments, BigInsights Enterprise Edition also has a
non-production license, and a starter kit license.
Deploying BigInsights
Hadoop—and by extension, BigInsights—is designed to be deployed on a
cluster of many individual computers with dedicated storage and processing
resources. Failover and redundancy capabilities are built into Hadoop with
the expectation that it is to be deployed on inexpensive and eventually unre-
liable hardware. We refer to this kind of computing resource as commodity
hardware, specifically, Intel chipsets with standard spinning disk storage.
This is in contrast to the robust, high-quality, and, of course, expensive hard-
ware that we see deployed in data warehouse servers, for example.
Ease of Use: A Simple Installation Process
The BigInsights installer was designed with simplicity in mind. IBM’s devel-
opment teams asked themselves, “How can IBM cut the time-to-Hadoop
curve without the effort and technical skills normally required to get open
05-ch05.indd 94 04/10/12 4:36 PM
126.
IBM’s Enterprise Hadoop:InfoSphere BigInsights 95
Flash 6X9 / Harness the Power of Big Data:The IBM Big Data Platform / Zikopoulos / 817-5
source software up and running?” They answered this question with the
BigInsights installer.
The main objective of the BigInsights installer is to insulate you from
complexity. As such, you don’t need to worry about software prerequisites
or determining which Apache Hadoop components to download. You don’t
need to worry about the configuration between these components or the
overall setup of the Hadoop cluster. The BigInsights installer does all of this
for you, and all you need to do is click a button. Hadoop startup complex-
ity is all but eliminated with BigInsights. Quite simply, your experience is
going to be much like installing any commercial software.
What’s more, you can use IBM’s installation program to graphically build
a response file, which you can subsequently use to deploy BigInsights on all
of the nodes in your cluster in an automated fashion.
A Low-Cost Way to Get Started:
Running BigInsights on the Cloud
With the rise of virtualization technologies, the Cloud has become a popular
platform for businesses to leverage IT resources. Given the significant work
involved in procuring and building a moderately sized Hadoop cluster, it
would seem that Cloud technologies were designed with Hadoop in mind.
Let’s say that you’re interested in seeing what BigInsights can do for your
business. You have a large data set, and you have analysts and developers ready
to experiment with it. If you’re considering an on-site experimental Hadoop
installation, it could take weeks, if not months, for the procurement process to
run its course, and for the hardware to finally be installed. On the other hand,
you could have a made-to-order Cloud-based BigInsights cluster up and
running within hours. Let’s take this scenario a little further, and imagine that
your data is loaded on this Cloud-based cluster, and that your analysts are
working away. If some aspect of performance is poor, no problem! Additional
resources (memory, data nodes, CPU) can be added dynamically to your clus-
ter. This is another reason why the Cloud is such a great option for trial deploy-
ments: there’s no need to spend a lot of time ironing out reference architecture
details. With the Cloud, if it doesn’t work, make adjustments in real time.
Like other components in the IBM Big Data platform, BigInsights works
well in Cloud deployments. From a technology perspective, BigInsights
05-ch05.indd 95 04/10/12 4:36 PM
127.
96 Harnessthe Power of Big Data: The IBM Big Data Platform
Flash 6X9 / Harness the Power of Big Data:The IBM Big Data Platform / Zikopoulos / 817-5
supports virtualization, which is a must in Cloud environments. BigInsights
also has an excellent security story, whereby the entire cluster can be isolated
behind a single point of access through the Web Console. From a licensing
perspective, it couldn’t be easier, because the pricing model for BigInsights is
based on the volume of data that is stored in the cluster (before replication
and after compression). Finally, the BigInsights licenses have no restrictions
around virtualization. Again, you only pay for how much you use, which is
the same pricing model as Cloud services!
BigInsights has been successfully deployed on some of the most notable
Cloud providers; for example, Amazon EC2, RackSpace, and IBM Smart-
Cloud. �����������������������������������������������������������������
IBM has also partnered with RightScale, the leading Cloud manage-
ment platform. This partnership enables IBM to deliver trials for BigInsights
and several other IBM products on both public Clouds and private Clouds
that are built on open source Cloud stacks from Eucalyptus and Cloud.com.
Higher-Class Hardware:
IBM PowerLinux Solution for Big Data
Although commodity hardware deployments have been the norm for Hadoop
clusters up to this point, we’re seeing some alternatives. One compelling option
is the IBM PowerLinux Solution for Big Data. This is a Linux on Power
hardware solution that’s been optimized for Hadoop.
One of the most significant benefits of Power hardware is reliability,
which makes it well suited to be deployed as master nodes in your cluster. If
you need higher energy efficiency, or need to concentrate DataNodes to fewer
tiles, or simply need more processing power, Power can most definitely be a
great way to go.
In 2011, the IBM Watson system beat the two greatest champions of the
American quiz show Jeopardy! Linux on Power was the underlying platform for
Watson, which also leveraged Hadoop for some of its subsystems. During the
development of the IBM PowerLinux Solution for Big Data, customizations and
lessons learned from the Watson project were applied to this offering.
Cloudera Support
With the release of BigInsights 1.4, IBM expanded its Big Data platform to
run on other distributions of Hadoop, beginning with Cloudera. The Cloudera
05-ch05.indd 96 04/10/12 4:36 PM
128.
IBM’s Enterprise Hadoop:InfoSphere BigInsights 97
Flash 6X9 / Harness the Power of Big Data:The IBM Big Data Platform / Zikopoulos / 817-5
brand has become synonymous with Hadoop, largely through the reach of
their Cloudera Distribution for Hadoop (CDH). Although BigInsights
includes the IBM Distribution for Hadoop, extending support to CDH does
not reflect a contradictory approach. Rather, it’s another way in which IBM
supports a strong and unified Hadoop community. Because it’s all based on
open source code, the IBM Distribution for Hadoop and CDH are really not
too different.
The main purpose behind IBM’s support for Cloudera (and eventually,
other open source Hadoop distributions) is to emphasize the value of the IBM
Big Data platform. In short, even if you’re not using the IBM Distribution for
Hadoop, you can take advantage of the advanced analytics, integration, and
tooling capabilities in BigInsights. Clients obtain CDH from Cloudera, install
their CDH cluster, and then BigInsights enterprise features can be layered on
top of CDH. For CDH users, this is a great story: they no longer have to make
a difficult choice to leave the comfort of their installation to use BigInsights.
The point here is that the choice of which distribution you use is less impor-
tant than your approach to analytics higher in the stack.
Analytics: Exploration,
Development, and Deployment
The biggest challenge facing organizations that have adopted Hadoop is
how to quickly and easily derive value from the data that’s stored in their
clusters. There are many factors to consider here, some of which we’ve touched
on earlier. For example: the difficulty of parallelizing many analytics algorithms;
making data stored in Hadoop accessible for business analysts and data
scientists; and dealing with really messy data. BigInsights addresses all of
these issues by applying an integrated platform-based approach across its
various components.
As an analytics platform for Hadoop, BigInsights supports three classes of
analytic users: line-of-business analysts, data scientists, and application devel-
opers. In addition, the analytics and development components of BigInsights
feature lifecycle management tooling, which enables developers to easily deploy
analytic applications to line-of-business users and data scientists. Figure 5-2
shows all of the analytic components in BigInsights. We describe each of
these components in this section. We also cover the application lifecycle
05-ch05.indd 97 04/10/12 4:36 PM
129.
98 Harnessthe Power of Big Data: The IBM Big Data Platform
Flash 6X9 / Harness the Power of Big Data:The IBM Big Data Platform / Zikopoulos / 817-5
methodology and the corresponding features that are baked into the BigIn-
sights components.
AdvancedText AnalyticsToolkit
One of our favorite examples of the deep integration that characterizes the
IBM Big Data platform is the Advanced Text Analytics Toolkit. Although
the BigInsights analytics components all connect to this toolkit, it’s also
integrated into the Streams product. This means that the text extractors that
you write for your organization’s data can be deployed on data at rest
(through BigInsights), or data in motion (through Streams). The Text Ana-
lytics Toolkit is also integrated throughout the BigInsights components. As
we describe in the section “The BigInsights Application Lifecycle” later in
this chapter, you have the ability to deploy text extractors for easy execu-
tion in the Web Console. Because the Advanced Text Analytics Toolkit is
not just a BigInsights feature, we gave it a dedicated chapter—see Chapter 8
for a detailed description.
Text Analytics Toolkit
Text Analytics Perspective
BigInsights Perspective
BigInsights Plug-ins for Eclipse
BigSheets Application Panel
Web Console
Analytic Accelerators
App
Machine Data Accelerator
Social Data Accelerator
Machine Learning Toolkit
App
Macro
Macro
Figure 5-2 Data analysis components in BigInsights
05-ch05.indd 98 04/10/12 4:36 PM
130.
IBM’s Enterprise Hadoop:InfoSphere BigInsights 99
Flash 6X9 / Harness the Power of Big Data:The IBM Big Data Platform / Zikopoulos / 817-5
Machine Learning for the Masses:
Deep Statistical Analysis on BigInsights
BigInsights includes a Machine Learning Toolkit, which provides a platform
for statisticians and mathematicians to conduct high-performance statistical
and predictive analysis on data in a BigInsights cluster. It includes a high-level
machine learning language, which is semantically similar to R (the open source
language for statistical computing), and can be used by analysts to apply statis-
tical models to their data processing. A wealth of built-in data-mining
algorithms and statistical models are included as well. The Machine Data
Accelerator and the Social Data Accelerator (introduced in the next section)
both make use of these statistical algorithms for their reports and visualizations.
A number of machine learning algorithms and utilities are available as apps
in the Applications panel of the BigInsights Web Console. This includes data
processing utilities such as pivoting delimited numeric data into a matrix
format, and algorithms such as linear regression and multi-class support
vector machines (SVM).
The Machine Learning Toolkit includes an engine that converts the statis-
tical workloads that are expressed in machine learning language into paral-
lelized MapReduce code, which means it not only hides this complexity from
analysts—it lets the analysts be analysts. In short, analysts don’t need to be
Java programmers, and they don’t need to factor MapReduce into their ana-
lytics applications, and more.
The Machine Learning Toolkit was developed in IBM Research by a team
of performance experts, statisticians, and mathematicians. Their primary
goals were high performance and ease of use for analysts needing to perform
complex statistical analyses in a Hadoop context. As such, this toolkit fea-
tures optimization techniques for the generation of low-level MapReduce
execution plans. This enables statistical jobs to achieve up to orders-of-
magnitude performance improvements, when compared to algorithms that
are directly implemented in MapReduce or other Hadoop languages, like
Pig. Not only can analysts avoid MapReduce coding techniques in their ana-
lytics applications, but the machine learning code that they write is highly
optimized for excellent Hadoop performance. Quite simply, it’s hard to write
parallel programs—IBM has delivered a declarative language to open up the
building of parallel-driven statistical applications in the same manner that it
did for relational databases when it invented SQL.
05-ch05.indd 99 04/10/12 4:36 PM
131.
100 Harnessthe Power of Big Data: The IBM Big Data Platform
Flash 6X9 / Harness the Power of Big Data:The IBM Big Data Platform / Zikopoulos / 817-5
BigInsights also features integration with R in the form of an app available
in the Applications panel of the BigInsights Web Console. With this app,
users can run ad-hoc R scripts against their data.
Analytic Accelerators:
Finding Needles in Haystacks of Needles?
In recognizing the importance of tools that reflect specific use cases, IBM has
built a set of Big Data Analytic Accelerators—tools designed to enable ana-
lysts and data scientists to productively explore data. The initial set of accelera-
tors are: the Social Data Accelerator, Telecommunications Data Accelerator, and
the Machine DataAccelerator. These accelerators are configured to provide out-
of-the-box value and can be further customized. For example, you can tailor the
text analytics extractors for the Machine Data Accelerator to your company’s
log data. See Chapter 9 for a detailed description of these analytic accelerators.
Apps for the Masses: Easy Deployment
and Execution of Custom Applications
The BigInsights Web Console has a tab called “Applications,” where you can
see a number of apps that are ready for you to run. IBM has modeled this
panel after the “app store” concept that is common today for mobile devices.
Running these apps takes a simple common approach: click on the app, enter
the path from which the data to be analyzed will be read, enter another path
where you want the result sets to be stored (and any of the app’s additional
fields) and you’re ready to run the application. You don’t have to spend pre-
cious budgets on app deployment with installers and such—just click and run.
BigInsights ships with a number of apps, which you can use to test the clus-
ter, and to get an idea of the kinds of apps you can build. In fact, the code to
write every app that’s shipped with BigInsights can be downloaded from the
console as an Eclipse BigInsights project, so you have a ready-made starting
point for your own app project! Another nice thing about this feature is that you
can use it as a front-end scheduler for end users to run Big Data apps distributed
in your enterprise.
Your business analysts and data scientists can leverage existing apps as
building blocks to create new apps. Users can do this by using a graphical
drag-and-drop tool to chain existing apps together in a workflow. You can eas-
ily direct the outputs from one app into the inputs of the next app in the chain.
05-ch05.indd 100 04/10/12 4:36 PM
132.
IBM’s Enterprise Hadoop:InfoSphere BigInsights 101
Flash 6X9 / Harness the Power of Big Data:The IBM Big Data Platform / Zikopoulos / 817-5
The emphasis on security in BigInsights shows through here, because some-
one with an Application Administrator role can determine which users are to
be authorized to run specific apps. Given that there are data sources or services
where security credentials are required, the apps interface lets you leverage the
BigInsights credentials store, enabling you to securely pass authentication
information to the data source or service to which you’re connecting.
Data Discovery and Visualization: BigSheets
Although Hadoop makes analyzing Big Data possible, you pretty much need
to be a programmer with a good understanding of the MapReduce paradigm
to explore the data. We’ve seen what happens when you try to explain paral-
lel programming concepts to nontechnical people, so clearly there’s a big
barrier that keeps most business analysts from being able to make sense of
data that’s stored in Hadoop. BigInsights has the answer: a browser-based
visualization tool called BigSheets. This tool enables line-of-business users to
harness the power of Hadoop using a familiar spreadsheet interface. Big-
Sheets requires no programming (it automatically generates Hadoop code
underneath the covers) or special administration. If you can use a spread-
sheet (pivot, slice, dice, and so on), you can use BigSheets to perform analysis
on vast amounts of data, in any structure.
Three easy steps are involved in using BigSheets to perform Big Data
analysis:
1. Collect data. You can collect data from multiple sources, using apps
that are deployed in BigInsights to crawl the Web, local files, or files
on your network. Multiple protocols and formats are supported,
including HTTP, HDFS, Amazon S3 Native File System (s3n), and
Amazon S3 Block File System (s3), and more. There’s also a facility
to extend BigSheets with custom plug-ins for importing data. For
example, you could build a plug-in to harvest Twitter data and
include it in your BigSheets collections.
2. Extract and analyze data. After you have collected the data, you can
see a sample of it in the spreadsheet interface, such as that shown
in Figure 5-3. At this point, you can manipulate your data by using
the spreadsheet-type tools that are available in BigSheets. For
example, you can combine columns from different collections, run
formulas, or filter data. You can also deploy custom macros for
BigSheets. For example, you can deploy a text extractor that you
05-ch05.indd 101 04/10/12 4:36 PM
133.
102 Harnessthe Power of Big Data: The IBM Big Data Platform
Flash 6X9 / Harness the Power of Big Data:The IBM Big Data Platform / Zikopoulos / 817-5
built with the BigInsights development tools as a BigSheets macro.
As you build your sheets and refine your analysis, you can see the
interim results in the sample data. It’s only when you click the Run
button that your analysis is applied to the complete data collection.
Because your data could range from gigabytes to terabytes to
petabytes in size, working iteratively with a small data set is the
best approach.
3. Explore and visualize data. After running the analysis from your
sheets against the data, you can apply visualizations to help you
make sense of your data. BigSheets provides a number of traditional
and new age Big Data visualizations, including:
• Tag Cloud Shows word frequencies; the larger the letters, the
more occurrences of data referencing that term were found. See
Figure 5-4 for an example.
• Pie Chart Shows proportional relationships, where the relative
size of the slice represents its proportion of the data
• Map Shows data values overlaid onto either a map of the world
or a map of the United States
Figure 5-3 The BigSheets spreadsheet-like interface
05-ch05.indd 102 04/10/12 4:36 PM
134.
IBM’s Enterprise Hadoop:InfoSphere BigInsights 103
Flash 6X9 / Harness the Power of Big Data:The IBM Big Data Platform / Zikopoulos / 817-5
• Heat Map Similar to the Map, but with the additional dimension
of showing the relative intensity of the data values overlaid onto a
Map
• Bar Chart Shows the frequency of values for a specified column
BigSheets is fully extensible with respect to its visualization tools. As such,
you can include custom plug-ins for specialized renderings of your data.
The BigInsights Development Environment
As we briefly mentioned earlier in this chapter, one of the main compo-
nents of BigInsights is a set of Eclipse plug-ins that provide a rich devel-
opment environment for creating BigInsights applications. This includes
all of the usability features that you’d typically associate with an inte-
grated development environment (IDE), namely: content completion,
context-sensitive assistance, design-time assistance and error detection, a
Figure 5-4 Data visualization in BigSheets
05-ch05.indd 103 04/10/12 4:36 PM
135.
104 Harnessthe Power of Big Data: The IBM Big Data Platform
Flash 6X9 / Harness the Power of Big Data:The IBM Big Data Platform / Zikopoulos / 817-5
breakpoint and debugging console, code editors, workflow assistants,
testing tools, a deployment tool, and more.
You can use the BigInsights Development Environment to develop text
extractors (we detail the benefits associated with developing these artifacts
in Chapter 8), Big Data queries (including standalone SQL, HiveQL for Hive
sources, and HBase expressions), and Big Data applications (including Jaql,
Pig, and MapReduce). The BigInsights Development Environment provides
you with an enriched experience when you use any of these languages. In
the Eclipse editor, you see code highlighting and syntax error checking.
There are also templates and integrated help for the supported languages to
get you started more quickly.
In addition to the query and application development tooling in the
BigInsights Development Environment, there is also a graphical workflow
editor for easy development of Oozie workflows (see Figure 5-5). This is other-
wise a painstaking process, involving the manual editing of an XML file
based on the Oozie schema. Using the workflow editor, you can drag and
drop Oozie workflow elements (Start, End, Kill, Action, Action, Fork, Join,
and Decision). There is also a code editor (featuring code highlighting and
syntax error detection), where you can edit the generated Oozie XML.
Figure 5-5 Application chaining graphical interface
05-ch05.indd 104 04/10/12 4:36 PM
136.
IBM’s Enterprise Hadoop:InfoSphere BigInsights 105
Flash 6X9 / Harness the Power of Big Data:The IBM Big Data Platform / Zikopoulos / 817-5
To speed up application deployment, you can configure the BigInsights
Development Environment to be aware of your BigInsights cluster, so that
pushing application code to the cluster is as easy as clicking a button.
The fact is that the population of specialized programmers for Hadoop is
quite small, but the number of developers who know Eclipse, or SQL, is very
large. Think about that as you start from a proof of concept and move to
enterprise production; you will move from a handful of developers to a full
development, architecture, and QA team—potentially hundreds of develop-
ers. The BigInsights Development Environment has been designed to cater to
the skill set of an average developer. So if your business is making the jump
to BigInsights, you have integrated tooling that will help your development
team get up to speed more quickly.
The BigInsights Application Lifecycle
Now that we’ve covered the full range of analysis and application development
tools in BigInsights, let’s step back and see how the big picture of application
lifecycle management has been baked into BigInsights. The following details
lifecycle steps and their impacted components (see also Figure 5-6).
Text Analytics Toolkit
BigInsights Plug-ins for Eclipse
Application Panel
Web Console
3. Deploy
4. Execute (production)
1. Develop
2. Publish
4. Execute (test)
App
Machine Learning Toolkit
Macro
BigInsights Perspective Text Analytics Perspective
App
Macro
BigSheets
Figure 5-6 The BigInsights application lifecycle
05-ch05.indd 105 04/10/12 4:36 PM
137.
106 Harnessthe Power of Big Data: The IBM Big Data Platform
Flash 6X9 / Harness the Power of Big Data:The IBM Big Data Platform / Zikopoulos / 817-5
1. Develop Using the BigInsights development tools for Eclipse, you
can, for example, create text extractors to isolate connection failures
in your web server logs.
2. Publish From Eclipse, you can push your text extractor to be
available in the Web Console as either an app (through the
Applications panel) or a macro for BigSheets.
3. Deploy From the Web Console, someone with the Application
Administrator role can deploy and configure an application for
execution on the BigInsights cluster.
4. Execute An end user can run the text extractor in the console (either
as an app or as a macro, depending on how it was published).
Alternatively, a developer can run the app from the Web Console, and
download the results for testing in the Text Analytics debugging tool.
These are all steps that an IT organization needs to take to develop and deploy
applications in a Hadoop context. In BigInsights, IBM has provided extensive
automation and orchestration to make this process much faster, simpler, and
more reliable. Without this tooling, not only would you have to manually move
files around and set configurations, you would also have to develop wrappers
and interfaces for your applications so that your users can execute them.
Data Integration
A key value of IBM’s vision for Big Data is the importance of integrating data
from a variety sources. Hadoop is not a one-size-fits-all solution to meet all your
storage and processing needs, so you’ll also continue to have other repositories
in the enterprise. But once you make the commitment to add a Hadoop cluster
to your IT infrastructure, it’s inevitable that some of these other systems will
need access to it. It’s with this in mind that IBM has developed a SQL interface
for data in BigInsights. This eliminates the learning curve for DBAs needing
to query Hadoop data. In addition, BigInsights supports data exchange with
a number of sources, including the IBM PureData System for Analytics
(formerly known as Netezza), the IBM PureData System for Operational
Analytics (formerly known as the IBM Smart Analytics System, which is
powered by DB2); DB2 for Linux, UNIX, and Windows; other relational data
05-ch05.indd 106 04/10/12 4:36 PM
138.
IBM’s Enterprise Hadoop:InfoSphere BigInsights 107
Flash 6X9 / Harness the Power of Big Data:The IBM Big Data Platform / Zikopoulos / 817-5
stores via a Java Database Connectivity (JDBC) interface; InfoSphere Streams;
InfoSphere Information Server (specifically, DataStage); and more. In this
section, we’ll delve into the details of some of the integration points, and
merely highlight others; where we simply highlight an integration point, we
cover details in the corresponding chapters later in this book.
The Analytics-Based IBM PureData
Systems and DB2
You can exchange data between BigInsights and any of the analytics-based
IBM PureData Systems (both the Analytics and Operational Analytics ver-
sions, or earlier versions of Netezza, or DB2 for Linux, UNIX, and Windows)
in two ways: from your database server, or from your BigInsights cluster.
These IBM database technologies can both connect and interact with BigIn-
sights through a set of user-defined functions (UDFs) that can be installed on
the database server. BigInsights can connect to the IBM PureData System for
Analytics and Netezza through a special high-speed adapter. BigInsights can
connect to the IBM PureData System for Operational Analytics or DB2
through the JDBC module (described in a later section).
BigInsights UDFs
The integration with BigInsights, the analytics-based IBM PureData Systems,
Netezza, and DB2 has two main components: a set of UDFs installed on the
database server, and a Jaql server (to listen for requests from these UDFs) on
the BigInsights cluster. The Jaql server is a middleware component that can
accept Jaql query processing requests from any system that’s powered by
Netezza (running Netezza Analytics version 2.0 or later) or DB2 server
(version 9.5 or later) technology. Specifically, the Jaql server can accept the
following kinds of Jaql queries from a supported database DB2 server:
• Read data from the BigInsights cluster.
• Upload (or remove) modules of Jaql code in the BigInsights cluster.
• Submit Jaql jobs (which can refer to modules you previously uploaded
from supported database servers) to be run on the BigInsights cluster.
• (IBM PureData System for Analytics only) Write data from the data
warehouse to the BigInsights cluster.
05-ch05.indd 107 04/10/12 4:36 PM
139.
108 Harnessthe Power of Big Data: The IBM Big Data Platform
Flash 6X9 / Harness the Power of Big Data:The IBM Big Data Platform / Zikopoulos / 817-5
Running these BigInsights functions gives you an easy way to integrate
with Hadoop from your traditional application framework. With these func-
tions, database applications (which are otherwise Hadoop-unaware) can access
data in a BigInsights cluster using the same SQL interface they use to get
relational data out of them. Such applications can now leverage the parallel-
ism and scale of a BigInsights cluster without requiring extra configuration
or other overhead. Although this approach incurs additional performance
overhead as compared to a conventional Hadoop application, it is a very use-
ful way to integrate Big Data processing into your existing IT application
infrastructure.
The IBM PureData System for Analytics Adapter
BigInsights includes a connector that enables data exchange between a
BigInsights cluster and IBM PureData System for Anlaytics (or its earlier
incarnation, the Netezza appliance). This adapter supports splitting tables
(a concept similar to splitting files). This entails partitioning the table and
assigning each divided portion to a specific mapper. This way, your SQL
statements can be processed in parallel.
The adapter leverages the Netezza technology’s external table feature,
which you can think of as a materialized external UNIX pipe. External tables
use JDBC. In this scenario, each mapper acts as a database client. Basically, a
mapper (as a client) will connect to the database and start a read from a UNIX
file that’s created by the IBM PureData System’s infrastructure.
JDBC Module
The Jaql JDBC module enables you to read and write data from any rela-
tional database that has a standard JDBC driver. This means you can easily
exchange data and issue SQL statements with every major database ware-
house product in the market today.
With Jaql’s MapReduce integration, each map task can access a specific
part of a table, enabling SQL statements to be processed in parallel for parti-
tioned databases.
05-ch05.indd 108 04/10/12 4:36 PM
140.
IBM’s Enterprise Hadoop:InfoSphere BigInsights 109
Flash 6X9 / Harness the Power of Big Data:The IBM Big Data Platform / Zikopoulos / 817-5
InfoSphere Streams for Data in Motion
As you’ll discover in Chapter 7, Streams is the IBM solution for real-time
analytics on streaming data. Streams includes a sink adapter for BigInsights,
which lets you store streaming data directly into your BigInsights cluster.
Streams also includes a source adapter for BigInsights, which lets Streams
applications read data from the cluster. The integration between BigInsights
and Streams raises a number of interesting possibilities. At a high level, you
can create an infrastructure to respond to changes detected in data in real
time (as the data is being processed in-motion by Streams), while using a
wealth of existing data (stored and analyzed at rest by BigInsights) to inform
the response. You could also use Streams as a large-scale data ingest engine
to filter, decorate, or otherwise manipulate a stream of data to be stored in the
BigInsights cluster.
Using the BigInsights sink adapter, a Streams application can write a control
file to the BigInsights cluster. BigInsights can be configured to respond to the
appearance of such a file so that it would trigger a deeper analytics operation
to be run in the cluster. For more advanced scenarios, the trigger file from
Streams could also contain query parameters to customize the analysis in
BigInsights.
InfoSphere DataStage
DataStage is an extract, transform, and load (ETL) platform that is capable of
integrating high volumes of data across a broad, heterogeneous range of source
and target systems. It offers an easy-to-use interface and design tools; supports
massive scalability; transforms data from multiple, disparate information
sources; and delivers data in batch or in real time. Expanding its role as a data
integration agent, DataStage has been extended to work with BigInsights and
can push and pull data to and from BigInsights clusters. The DataStage con-
nector to BigInsights integrates with HDFS, taking advantage of the clustered
architecture so that any bulk writes to the same file are done in parallel.
The result of DataStage integration is that BigInsights can quickly exchange
data with any other software product able to connect with DataStage.
05-ch05.indd 109 04/10/12 4:36 PM
141.
110 Harnessthe Power of Big Data: The IBM Big Data Platform
Flash 6X9 / Harness the Power of Big Data:The IBM Big Data Platform / Zikopoulos / 817-5
Increasingly we’re seeing Hadoop being leveraged as a dynamic ETLengine,
especially for unstructured data. ETL is not just about the transformation,
though. Orchestration, debugging, lifecycle management, and data lineage are
but a few important considerations. DataStage, and the rest of the InfoSphere
Information Server platform provide means to deal with all these items and
more. Plans are in place for even tighter connections between Information Server
and BigInsights, such as the ability to choreograph BigInsights jobs from
DataStage, making powerful and flexible data transformation scenarios possi-
ble. We talk about Hadoop optimizations, including DataStage’s Big Data File
Stage (BDFS), in Chapter 10 and Chapter 11.
Operational Excellence
As more organizations come to depend on Hadoop for their business analyt-
ics, the demand for additional governance and administrative capabilities
increases. People have grown accustomed to the rich data management fea-
tures in enterprise relational databases and want to see them in their Hadoop
clusters as well. At the same time, Hadoop is entering an era in which the
understanding of data governance is highly evolved. Relational databases
had the advantage of “growing up” with a lot of the thinking about data. As
a result, many experienced IT people look at Hadoop with high expectations.
The trouble is that open source software focuses more on core capability than
on rounding out a lot of administrative features. In IBM, there are hundreds
of researchers and developers who are industry-leading experts on gover-
nance, workload management, and performance optimization. Since the
Apache Hadoop project took off, many of these experts have been develop-
ing Hadoop solutions that have been incorporated into BigInsights.
Securing the Cluster
Security is an important concern for enterprise software, and in the case of
open source Hadoop, there are limitations to consider before moving to pro-
duction. The good news is that BigInsights addresses these issues by reducing
the security surface area through securing access to the administrative inter-
faces, key Hadoop services, lockdown of open ports, role-based security,
integration into InfoSphere Guardium Database Security (Guardium), and more.
05-ch05.indd 110 04/10/12 4:36 PM
142.
IBM’s Enterprise Hadoop:InfoSphere BigInsights 111
Flash 6X9 / Harness the Power of Big Data:The IBM Big Data Platform / Zikopoulos / 817-5
The BigInsights Web Console has been structured to act as a gateway to the
cluster. It features enhanced security by supporting Lightweight Directory
Access Protocol (LDAP) authentication. LDAP and reverse-proxy support
help administrators restrict access to authorized users. In addition, clients out-
side of the cluster must use secured REST interfaces to gain access to the cluster
through the gateway. In contrast, Apache Hadoop has open ports on every
node in the cluster. The more ports you need to have open (and there are a lot
of them in open source Hadoop), the less secure the environment and the
more likely you won’t pass internal audit scans.
BigInsights can be configured to communicate with an LDAP credentials
server for authentication. All communication between the console and the
LDAP server occurs using LDAP (by default) or both LDAP and LDAPS
(LDAP over HTTPS). The BigInsights installer helps you to define mappings
between your LDAP users and groups and the four BigInsights roles (System
Administrator, Data Administrator, Application Administrator, and User).
After BigInsights has been installed, you can add or remove users from the
LDAP groups to grant or revoke access to various console functions.
Kerberos security is integrated into open source Hadoop, and offers ser-
vices and some operational tooling, but does not support alternative
authentication. BigInsights uses LDAP as the default authentication proto-
col. BigInsights emphasizes the use of LDAP because when compared to
Kerberos and other alternatives, it’s a much simpler protocol to install and
configure. Finally, BigInsights supports alternate authentication options
such as Linux Pluggable Authentication Modules (PAM). You can use this
to deploy Kerberos token authentication, or even biometric authentication.
Putting the cluster behind the Web Console’s software firewall and estab-
lishing user roles helps to lock down BigInsights and its data, but a complete
security story has to include regulatory compliance. For example, any business
that accepts credit cards must be in compliance with the Payment Card Industry
Data Security Standard (PCI DSS), which requires customer data to be secured
and any accesses logged. Guardium is the market leader in the compliance
market, and processes the audit logs generated by relational databases. IBM
has built extensions to BigInsights, to store audit logs for data accesses in the
cluster. Audit logs are generated for any data access activity involving the
following components: Hadoop RPC, HDFS, MapReduce, Oozie, and HBase.
05-ch05.indd 111 04/10/12 4:36 PM
143.
112 Harnessthe Power of Big Data: The IBM Big Data Platform
Flash 6X9 / Harness the Power of Big Data:The IBM Big Data Platform / Zikopoulos / 817-5
Recent changes to Apache Hadoop have improved security for HDFS;
however, there are still some limitations. As such, the experience that IBM
has with locking down the enterprise, which is baked into BigInsights, en-
ables you to build a more secure, robust, and easily maintainable multitenant
solution.
Monitoring All Aspects of
Your Cluster
To aid in the administration of your cluster, the BigInsights Web Console
provides a real-time, interactive view of your cluster’s components. The
BigInsights console includes graphical tools for examining the health of your
BigInsights environment, including the nodes in your cluster, the Hadoop
and BigInsights services, HDFS metadata, MapReduce metrics, and the sta-
tus of your jobs (applications).
Monitoring the Cluster
BigInsights features a rich monitoring dashboard that enables you to tailor
your view of administrative metrics. There are predefined dashboards for the
following areas: System (covering CPU utilization and load average), Cluster,
HDFS (covering total files and corrupted blocks), and MapReduce (covering
map and reduce tasks running, and tasks failed). Each of the dashboards con-
tains monitoring widgets that you can configure to a high degree of granu-
larity, ranging from a range of time to the refresh rate (see Figure 5-7).
Figure 5-7 Customizing monitoring widgets
05-ch05.indd 112 04/10/12 4:36 PM
144.
IBM’s Enterprise Hadoop:InfoSphere BigInsights 113
Flash 6X9 / Harness the Power of Big Data:The IBM Big Data Platform / Zikopoulos / 817-5
Monitoring Applications
The BigInsights Web Console provides context-sensitive views of the cluster,
so that people only see what they need to based on their associated role. If
someone with the security role of “user” runs an application, they only see
their own statistics in the Application History view. This particular view is
optimized to show a high level of application status information, hiding the
lower-level workflow and job information.
People with administrator roles can see the state of all applications in the
Application History view and the Application Status monitoring dashboard,
and are able to drill into individual workflows and jobs for debugging or
performance testing reasons. The Application Status pane has views for
Workflows and Jobs. Each of those views lists every active and completed
workflow and job. You can drill into each workflow or job to get further
details, and from there also see related elements.
Compression
When dealing with the large volumes of data that are expected in a Hadoop
setting, the idea of compression is appealing. On the one hand, you can save
a great deal of space (especially when you consider that every storage block
is replicated three times by default in Hadoop); on the other hand, data trans-
fer speeds are improved because of lower data volumes on the wire. You
should consider two important items before choosing a compression scheme:
splittable compression and the compression and decompression speeds of the com-
pression algorithm that you’re using.
Splittable Compression
In Hadoop, files are split (divided) if they are larger than the cluster’s block
size setting (normally one split for each block). For uncompressed files, this
means that individual file splits can be processed in parallel by different
mappers. Figure 5-8 shows an uncompressed file with the vertical lines
Big data
represents
a new era in data exploration and
utilization,
and IBM
is uniquely
positioned
to help clients
design,
develop and
execute
a big data
strategy.
Figure 5-8 An uncompressed splittable file in Hadoop
05-ch05.indd 113 04/10/12 4:36 PM
145.
114 Harnessthe Power of Big Data: The IBM Big Data Platform
Flash 6X9 / Harness the Power of Big Data:The IBM Big Data Platform / Zikopoulos / 817-5
representing the split and block boundaries (in this case, the split and block
size are the same).
When files (especially text files) are compressed, complications arise. For
most compression algorithms, individual file splits cannot be decompressed
independently of other splits from the same file. More specifically, these com-
pression algorithms are not splittable (remember this key term when discuss-
ing compression and Hadoop). In the current production release of Hadoop
(1.0.3 at the time of writing), no support is provided for splitting compressed
text files. For files in which the Sequence or Avro formats are applied, this is
not an issue, because these formats have built-in synchronization points, and
are therefore splittable. For unsplittable compressed text files, MapReduce
processing is limited to a single mapper.
For example, suppose that the file in Figure 5-8 is a 1GB text file in your
Hadoop cluster, and that your block size is set to the BigInsights default of
128MB, which means that your file spans eight blocks. When this file is com-
pressed using the conventional algorithms available in Hadoop, it’s no lon-
ger possible to parallelize the processing for each of the compressed file
splits, because the file can be decompressed only as a whole, and not as indi-
vidual parts based on the splits. Figure 5-9 depicts this file in a compressed
(and binary) state, with the splits being impossible to decompress individu-
ally. Notice the mismatch? (The split boundaries are dotted lines, and the
block boundaries are solid lines.)
Because Hadoop 1.0.3 doesn’t support splittable text compression natively, all
the splits for a compressed text file are processed by only a single mapper. For
many workloads, this would cause such a significant performance hit that com-
pression wouldn’t be a viable option. However, Jaql is configured to understand
splittable compression for text files and will process them automatically with
parallel mappers. You can do this manually for other environments (such as Pig
0001 1010 0001 1101 1100 0100 1010 1110 0101 1100 1101 0011 0001 1010 0001 1101 1100 0101 1100
Figure 5-9 A compressed unsplittable file
05-ch05.indd 114 04/10/12 4:36 PM
146.
IBM’s Enterprise Hadoop:InfoSphere BigInsights 115
Flash 6X9 / Harness the Power of Big Data:The IBM Big Data Platform / Zikopoulos / 817-5
and MapReduce programs) by using the TextInputFormat input format
instead of the Hadoop standard.
Compression and Decompression Speeds
The old saying “nothing in this world is free” is surely true when it comes to
compression. There’s no magic going on; in essence, you are simply consum-
ing CPU cycles to save disk space. So let’s start with this assumption: There
could be a performance penalty for compressing data in your Hadoop clus-
ter, because when data is written to the cluster, the compression algorithms
(which are CPU-intensive) need CPU cycles and time to compress the data.
Likewise, when reading data, any MapReduce workloads against com-
pressed data can incur a performance penalty because of the CPU cycles and
the time required to decompress the compressed data. This creates a conun-
drum: You need to balance priorities between storage savings and additional
performance overhead.
We should note that if you’ve got an application that’s I/O bound (typical
for many warehouse-style applications), you’re likely to see a performance
gain in your application, because I/O-bound systems typically have spare
CPU cycles (found as idle I/O waits in the CPU) that can be used to run
the compression and decompression algorithms. For example, if you use idle
I/O wait CPU cycles to do the compression, and you get good compression
rates, you could end up with more data flowing through the I/O pipe, and
that means faster performance for those applications that need to fetch a lot of
data from disk.
A BigInsights Bonus: IBM CMX Compression
BigInsights includes the IBM CMX compression (an IBM version of the LZO
compression codec), which supports splitting compressed files and enabling
individual compressed splits to be processed in parallel by your MapReduce
jobs.
Some Hadoop online forums describe how to use the GNU version of
LZO to enable splittable compression, so why did IBM create a version of it,
and why not use the GNU LZO alternative? First, the IBM CMX compression
codec does not create an index while compressing a file, because it uses
05-ch05.indd 115 04/10/12 4:36 PM
147.
116 Harnessthe Power of Big Data: The IBM Big Data Platform
Flash 6X9 / Harness the Power of Big Data:The IBM Big Data Platform / Zikopoulos / 817-5
fixed-length compression blocks. In contrast, the GNU LZO algorithm uses
variable-length compression blocks, which leads to the added complexity of
needing an index file that tells the mapper where it can safely split a com-
pressed file. (For GNU LZO compression, this means that mappers would
need to perform index look-ups during decompression and read operations.
There is administrative overhead with this index, because if you move the
compressed file, you will need to move the corresponding index file as well.)
Second, many companies, including IBM, have legal policies that prevent
them from purchasing or releasing software that includes GNU Public
License (GPL) components. This means that the approach that is described in
online Hadoop forums requires additional administrative overhead and con-
figuration work. In addition, there are businesses with policies restricting the
deployment of GPL code. The IBM CMX compression is fully integrated with
BigInsights and under the same enterprise-friendly license agreement as the
rest of BigInsights, which means that you can use it with less hassle and none
of the complications associated with the GPL alternative.
In a future release of Hadoop, the bzip2 algorithm will support splitting.
However, decompression speed for bzip2 is much slower than for IBM
CMX, so bzip2 is not a desirable compression algorithm for workloads
where performance is important.
Figure 5-10 shows the compressed text file from the earlier examples, but
in a splittable state, where individual splits can be decompressed by their
own mappers. Note that the split sizes are equal, indicating fixed-length
compression blocks.
In the following table, you can see the four compression algorithms that
are available on the BigInsights platform (IBM CMX, bzip2, gzip, and
DEFLATE) and some of their characteristics.
Compression
Codec File Extension Splittable
Degree of
Compression
Decompression
Speed
IBM CMX .cmx Yes Medium Fastest
bzip2 .bz2 Yes, but not yet
available
Highest Slow
Gzip .gz No High Fast
DEFLATE .deflate No High Fast
05-ch05.indd 116 04/10/12 4:36 PM
148.
IBM’s Enterprise Hadoop:InfoSphere BigInsights 117
Flash 6X9 / Harness the Power of Big Data:The IBM Big Data Platform / Zikopoulos / 817-5
Improved Workload Scheduling:
Intelligent Scheduler
Open source Hadoop ships with a rudimentary first in, first out (FIFO) sched-
uler and a pluggable architecture supporting alternate scheduling options.
There are two pluggable scheduling tools available through theApache Hadoop
project: the Fair Scheduler and the Capacity Scheduler. These schedulers are
similar in that they enable a minimum level of resources to be available for
smaller jobs to avoid starvation. These schedulers don’t provide adequate
controls to ensure optimal cluster performance or offer administrators the
flexibility that they need to implement customizable workload management.
For example, Fair is pretty good at ensuring that resources are applied to
workloads, but it doesn’t give you SLA-like granular controls.
As you might imagine, IBM has decades of experience and research exper-
tise in workload management. From the mainframe to distributed systems,
there are continually repeating proof points of this expertise. For example,
IBM is the only database vendor that we know of to integrate database-level
workload management (in DB2) with the underlying host operating system’s
workload management capabilities such that they work in unison. Workload
management for data in a database or data in a file system is still workload
management.
Performance experts in IBM Research have studied the workload schedul-
ing problems in Hadoop and have crafted a solution called the Intelligent
Scheduler (previously known as the FLEX Scheduler). This scheduler extends
the Fair Scheduler and manipulates it by constantly altering the minimum
number of slots that are assigned to jobs. The Intelligent Scheduler includes a
variety of metrics that you can use to optimize your workloads. These metrics
can be chosen by an administrator on a cluster-wide basis, or by individual
0001 1010 0001 1101 1100 0100 1010 1110 0101 1100 1101 0011 0001 1010 1101 1100
Figure 5-10 A splittable compressed text file
05-ch05.indd 117 04/10/12 4:36 PM
149.
118 Harnessthe Power of Big Data: The IBM Big Data Platform
Flash 6X9 / Harness the Power of Big Data:The IBM Big Data Platform / Zikopoulos / 817-5
users on a job-specific basis. You can optionally weight these metrics to bal-
ance competing priorities, minimize the sum of all the individual job metrics,
or maximize the sum of all of them.
The following are examples of the Intelligent Scheduler settings that you
can use to tune your workloads:
•
average response time The scheduler allocates maximum
resources to small jobs, ensuring that these jobs are completed quickly.
•
maximum stretch The scheduler allocates resources to jobs in
proportion to the amount of resources that they need. Big jobs have
higher priority.
•
user priority The scheduler allocates maximum resources to jobs
for a particular user.
Adaptive MapReduce
In their efforts to further optimize Hadoop performance, IBM Research has
developed a concept called Adaptive MapReduce, which extends Hadoop by
making individual mappers self-aware and aware of other mappers. This
approach enables individual map tasks to adapt to their environment and
make efficient decisions. (If you consider what connection pooling and con-
nection concentration did for database scalability and apply that to Adaptive
MapReduce for Hadoop, you’ll have a good analogy to work from if you are
new to this space.)
In normal MapReduce, when a job is about to begin, Hadoop divides the
data into many pieces, called splits. Each split is assigned a single mapper. To
ensure a balanced workload, these mappers are deployed in waves, and new
mappers start after old mappers finish processing their splits. In this model, a
small split size means more mappers, which helps ensure balanced workloads
and minimizes failure costs. However, smaller splits also result in increased
cluster overhead due to the higher volumes of startup costs for each map
task. For workloads with high startup costs for map tasks, larger split sizes
tend to be more efficient. An adaptive approach to running map tasks gives
BigInsights the best of both worlds.
One component ofAdaptive MapReduce is the concept of an adaptive mapper.
Adaptive mappers extend the capabilities of conventional Hadoop mappers
05-ch05.indd 118 04/10/12 4:36 PM
150.
IBM’s Enterprise Hadoop:InfoSphere BigInsights 119
Flash 6X9 / Harness the Power of Big Data:The IBM Big Data Platform / Zikopoulos / 817-5
by tracking the state of file splits in a central repository. Each time an adaptive
mapper finishes processing a split, it consults this central repository and locks
another split for processing until the job is completed. This means that for
adaptive mappers, only a single wave of mappers is deployed, because the
individual mappers remain open to consume additional splits. The perfor-
mance cost of locking a new split is far less than the startup cost for a new map-
per, which accounts for a significant increase in performance. The left side of
Figure 5-11 shows the benchmark results for a set-similarity join workload,
which had high map task startup costs that were mitigated by the use of adap-
tive mappers. The adaptive mappers result (see the AM bar) was based on a
low split size of 32MB. Only a single wave of mappers was used, so there
were significant performance savings based on avoiding the startup costs for
additional mappers.
For some workloads, any lack of balance could get magnified with larger
split sizes, which would cause additional performance problems. When using
adaptive mappers, you can (without penalty) avoid unbalanced workloads by
tuning jobs to use a smaller split size. Because there will only be a single wave
of mappers, your workload will not be crippled by the mapper startup costs of
many additional mappers. The right side of Figure 5-11 shows the benchmark
results for a join query on TERASORT records, in which an imbalance
occurred between individual map tasks that led to an unbalanced workload
for the larger split sizes. The adaptive mappers result (again, see the AM bar)
was based on a low split size of 32MB. Only a single wave of mappers was
1000
800
600
Time
(seconds)
400
200
Split Size (MB)
2048
1024
512
256
128
64
32
AM
0
1500
1200
900
Time
(seconds)
600
300
Split Size (MB)
1024
512
256
128
64
32
16
8
AM
0
Regular Mappers
Adaptive Mappers
Regular Mappers
Adaptive Mappers
Figure 5-11 Benchmarking a set-similarity join workload with high map task startup
costs reduced through the use of adaptive mappers
05-ch05.indd 119 04/10/12 4:36 PM
151.
120 Harnessthe Power of Big Data: The IBM Big Data Platform
Flash 6X9 / Harness the Power of Big Data:The IBM Big Data Platform / Zikopoulos / 817-5
used, so there were significant performance savings based on the startup costs
for additional mappers.
A Flexible File System for Hadoop: GPFS-FPO
The General Parallel File System (GPFS) was developed by IBM Research in
the 1990s for high-performance computing (HPC) applications. Since its first
release in 1998, GPFS has been used in many of the world’s fastest supercom-
puters, including Blue Gene, Watson (the Jeopardy! supercomputer), and the
reigning fastest supercomputer in the world, IBM Sequoia. In addition to
HPC, GPFS is commonly found in thousands of other mission-critical instal-
lations worldwide. Needless to say, GPFS has earned an enterprise-grade
reputation and pedigree for extreme scalability, high performance, and reli-
ability.
The design principles behind HDFS were defined by use cases that
assumed Hadoop workloads would involve sequential reads of very large
file sets (and no random writes to files already in the cluster—just append
writes). In contrast, GPFS has been designed for a wide variety of workloads
and for a multitude of uses.
Extending GPFS for Hadoop:
GPFS File Placement Optimization
In 2009, IBM extended GPFS to work with Hadoop. GPFS-Shared Nothing
Cluster was eventually renamed to GPFS-FPO (File Placement Optimization).
GPFS was originally available only as a storage area network (SAN) file sys-
tem, which typically isn’t suitable for a Hadoop cluster, because MapReduce
jobs perform better when data is stored on the node where it’s processed
(which requires locality awareness for the data). In a SAN, the location of the
data is transparent, which requires a high degree of network bandwidth and
disk I/O, especially in clusters with many nodes.
By storing your Hadoop data in GPFS-FPO, you are free from the design-
based restrictions that are inherent in HDFS. You can take advantage of
GPFS-FPO’s pedigree as a multipurpose file system in your Hadoop cluster,
which gives you tremendous flexibility. A significant architectural difference
05-ch05.indd 120 04/10/12 4:36 PM
152.
IBM’s Enterprise Hadoop:InfoSphere BigInsights 121
Flash 6X9 / Harness the Power of Big Data:The IBM Big Data Platform / Zikopoulos / 817-5
between GPFS-FPO and HDFS is that GPFS-FPO is a kernel-level file system,
whereas HDFS runs on top of the operating system. Many limitations in HDFS stem
from the fact that it’s not fully POSIX-compliant. On the other hand, GPFS-FPO
is 100 percent POSIX-compliant, which can give you significant flexibility.
Because GPFS is POSIX-compliant, files that are stored in GPFS-FPO are
visible to all applications, just like any other files stored on a computer. For
example, when copying files, any authorized user can use traditional operat-
ing system commands to list, copy, and move files in GPFS-FPO. This isn’t
the case in HDFS, where users need to log into Hadoop to see the files in the
cluster. As for replication or backups, the only mechanism available for
HDFS is to copy files manually through the Hadoop command shell.
The full POSIX compliance of GPFS-FPO enables you to manage your
Hadoop storage just as you would any other computer in your IT environ-
ment. That’s going to give you economies of scale when it comes to building
Hadoop skills, and just make life easier. For example, your traditional file
administration utilities will work, as will your backup and restore tooling
and procedures. GPFS-FPO will actually extend your backup capabilities
because it includes point-in-time (PiT) snapshot backup, off-site replication,
and other utilities.
With GPFS-FPO, you can safely manage multitenant Hadoop clusters with
a robust separation of concern infrastructure for your Hadoop cluster, allowing
other applications to share the cluster resources. This isn’t possible in HDFS.
This also helps from a capacity planning perspective, because without
GPFS-FPO, you would need to design the disk space that is dedicated to the
Hadoop cluster up front. If fact, not only do you have to estimate how much
data you need to store in HDFS, but you’re also going to have to guess how
much storage you’ll need for the output of MapReduce jobs, which can vary
widely by workload. Finally, don’t forget that you need to account for space
that will be taken up by log files created by the Hadoop system too! With
GPFS-FPO, you only need to worry about the disks themselves filling up;
there’s no need to dedicate storage for Hadoop.
All of the characteristics that make GPFS the file system of choice for large-
scale mission-critical IT installations are applicable to GPFS-FPO. After all,
this is still GPFS, but with Hadoop-friendly extensions. You get the same
05-ch05.indd 121 04/10/12 4:36 PM
153.
122 Harnessthe Power of Big Data: The IBM Big Data Platform
Flash 6X9 / Harness the Power of Big Data:The IBM Big Data Platform / Zikopoulos / 817-5
stability, flexibility, and performance in GPFS-FPO, as well as all of the utili-
ties that you’re used to. GPFS-FPO also provides hierarchical storage man-
agement (HSM) capabilities, whereby it can manage and use disk drives with
different retrieval speeds efficiently. This enables you to manage multitem-
perature data, keeping “hot” data on your best-performing hardware. HDFS
doesn’t have this ability.
GPFS-FPO is such a game changer that it won the prestigious Supercom-
puting Storage Challenge award in 2010 for being the “most innovative stor-
age solution” submitted to this competition.
NOTE GPFS-FPO is currently available only for beta testing.
Wrapping It Up
We said it earlier in this book, but it’s really important to understand that Big
Data does not solely equal Hadoop. Hadoop is but one of multiple data pro-
cessing engines you will need to address today’s challenges (and the ones
you don’t yet know about yet). For this reason, IBM has been long committed
to Hadoop, with contributions to the Apache project and continual engineer-
ing around the ecosystem. With its long history of enterprise-grade infra-
structure and optimization, IBM has taken this experience and applied it to
Hadoop through BigInsights. BigInsights includes open source Hadoop and
adds some operational excellence features such as Big Data optimized com-
pression, workload management, scheduling capabilities, and even an app
development and deployment ecosystem.
While operational excellence delivers economics of scale and infrastruc-
ture trust, the true potential of Hadoop lies in the analytic capabilities—more
accurately, the consumability of the analytic capabilities. For this reason,
BigInsights includes toolkits, accelerators, and tools such as BigSheets, which
seek to democratize the use of Big Data so it isn’t bottled up in deeply skilled
tech departments that require an army of Java programmers to monetize the
data. In addition, BigInsights provides an end-to-end text extraction frame-
work. Quite simply, Hadoop doesn’t provide anything here, so IBM builds a
high-value stack that treats Hadoop as a first-class citizen and integrates it
across the IBM Big Data platform.
05-ch05.indd 122 04/10/12 4:36 PM
154.
IBM’s Enterprise Hadoop:InfoSphere BigInsights 123
Flash 6X9 / Harness the Power of Big Data:The IBM Big Data Platform / Zikopoulos / 817-5
We don’t think anything illustrates the kind of analytic value that’s
required for today’s Hadoop clusters more than IBM supporting the analytic
capabilities found in BigInsights in Cloudera’s Hadoop distribution. We
think that sums it up—it illustrates the kind of partner you want to start your
Big Data journey with: one who can help you get value from your data. After
all, we’ve yet to see anyone think highly of a 100-node cluster that provided
no value.
05-ch05.indd 123 04/10/12 4:36 PM
155.
Flash 6X9 /Harness the Power of Big Data:The IBM Big Data Platform / Zikopoulos / 817-5
00-FM.indd 16 04/10/12 12:19 PM
This page intentionally left blank
156.
Flash 6X9 /Harness the Power of Big Data:The IBM Big Data Platform / Zikopoulos / 817-5
125
Part III
Analytics for Big Data
in Motion
06-ch06.indd 125 04/10/12 11:37 AM
157.
Flash 6X9 /Harness the Power of Big Data:The IBM Big Data Platform / Zikopoulos / 817-5
00-FM.indd 16 04/10/12 12:19 PM
This page intentionally left blank
158.
Flash 6X9 /Harness the Power of Big Data:The IBM Big Data Platform / Zikopoulos / 817-5
127
6
Real-Time Analytical
Processing with
InfoSphere Streams
Why are we willing to wait for actionable insight? How did we learn to
tolerate days, weeks, or months before we identify new opportunities, under-
stand the health of our businesses, or identify customer concerns with our
products and services? With the world speeding up, it is simply not accept-
able to wait any more. Just as IBM has delivered technology to uniquely
handle the largest analytical problems for data at rest with InfoSphere
BigInsights (BigInsights) and the IBM PureData System for Analytics (the
new IBM branding for Netezza announced in 4Q2012), IBM also delivers
the ability to derive value from data instantly with the analysis of data in motion.
Using BigInsights and any of the analytic-based IBM PureData Systems
gives you enormous capabilities when it comes to navigating the oceans of
information that are available to enterprises today, while IBM InfoSphere
Streams (Streams) gives you enormous insights from the rivers of data flowing
through your enterprise. You can choose to tap into those rivers to gain time-
sensitive competitive advantages for your business, or you can stand by
and watch the opportunities be washed away. This is where Streams
comes in. Its design lets you leverage massively parallel processing (MPP)
techniques to analyze data while it is streaming by, so you can understand
what is happening in real time, and optionally take action, make better
decisions, and improve outcomes.
06-ch06.indd 127 04/10/12 11:37 AM
159.
128 Harnessthe Power of Big Data: The IBM Big Data Platform
Flash 6X9 / Harness the Power of Big Data:The IBM Big Data Platform / Zikopoulos / 817-5
By this point in the book, we’re sure that you understand the importance
of the Big Data velocity characteristic, and how the integration of at-rest ana-
lytics, moved to the frontier of your business through an in-motion platform,
can really boost your Big Data IQ. For this reason, this chapter is a little more
detailed, from a technology perspective, than the other chapters in this book.
But let’s start by clarifying what we mean by Streams and stream; the capital-
ized form refers to the IBM InfoSphere Streams product, and the lowercase
version refers to a stream of data. With that in mind, let’s look at the basics of
Streams, some of the technical underpinnings that define how it works, and
its use cases.
The Basics: InfoSphere Streams
Streams is a powerful analytic computing software platform that continu-
ously analyzes and transforms data in memory before it is stored on disk.
Instead of gathering large quantities of data, manipulating and storing it on
disk, and then analyzing it, as is the case with other analytic approaches,
Streams enables you to apply the analytics directly on data in motion. When
you analyze data in motion with Streams, you get the fastest possible results,
huge potential hardware savings, and the highest throughput.
With all of those advantages, you might ask “What’s the catch?” To achieve
these benefits, Streams operates primarily on “windows” of data that are
maintained in memory across a cluster. Nevertheless, large memory sizes
enable windows of data to represent analytics over a few seconds to a few
days of data, depending on the data flow rates. This data can be enriched
with context that has been accumulated during processing and with data
from an at-rest engine, such as Hadoop, or a database.
We generally recommend Streams for the following use cases:
• Identifying events in real time, such as determining when customer
sentiment in social media is becoming more negative
• Correlating and combining events that are closely related in time, such
as a warning in a log file followed by a system outage
• Continuously calculating grouped aggregates, such as price trends per
symbol per industry in the stock market
06-ch06.indd 128 04/10/12 11:37 AM
160.
Real-Time Analytical Processingwith InfoSphere Streams 129
Flash 6X9 / Harness the Power of Big Data:The IBM Big Data Platform / Zikopoulos / 817-5
We don’t generally recommend Streams for analytics that require multiple
passes over a large data set, so scoring a regression model is possible, but
building one should be done using BigInsights or one of the purpose-built
IBM analytic data warehousing engines with data at rest. However, Streams
can take advantage of rich historical context by using models built by BigIn-
sights, the IBM PureData System for Operational Analytics (formerly know
as the IBM Smart Analytics System), the IBM PureData System for Analytics,
or other analytic tools, such as SPSS.
If you’re already familiar with Complex Event Processing (CEP) systems,
you might see some similarities in Streams. However, Streams is designed to
be much more scalable and dynamic, to enable more complex analytics, and
to support a much higher data flow rate than other systems. Many CEP or
stream processing systems, including new open source projects like Storm,
advertise a few hundred thousand events per second within a whole cluster. In
contrast, the IBM Streams technology has been demonstrated to handle a few
million events per second on a single server—it is fast. (Don’t forget, you can
deploy Streams in a cluster with near-linear scalability).
In addition, Streams has much better enterprise-level characteristics,
such as high availability, a rich and easy-to-use application development
tool set, numerous out-of-the box analytics, and integration with many
common enterprise systems. In fact, Streams provides nearly 30 built-in
operators in its standard toolkit, dozens of operators in extension toolkits
such as data mining and text analytics, and literally hundreds of functions
to facilitate application development. There is even a CEP toolkit that pro-
vides Streams functions normally found in CEP systems. Even though other
systems can’t match the power of Streams, the emergence of CEP systems
and open source projects, such as Storm, highlights the growing importance
of data-in-motion analysis.
You can think of a Streams application as a set of interconnected operators.
Multiple operators are combined into a single, configurable deployment unit
called a job, and an application is made up of one or more jobs. An application
is normally deployed until it is cancelled, continuously processing the data
that flows through it. The operators that bring data into Streams applications
are typically referred to as source adapters. These operators read the input stream
06-ch06.indd 129 04/10/12 11:37 AM
161.
130 Harnessthe Power of Big Data: The IBM Big Data Platform
Flash 6X9 / Harness the Power of Big Data:The IBM Big Data Platform / Zikopoulos / 817-5
and then produce a stream that can be consumed by downstream operators.
The analytical steps include various operators that perform specific actions
based on input from one or more streams. Finally, for every way into the con-
tinuous analytics platform, there are multiple ways out, and in Streams, these
outputs are called sink adapters. (Think of water flowing out of the tap and
into your kitchen sink.) Any operator can simultaneously be a source adapter,
standard operator, and sink adapter, but it is helpful to think of them as being
distinct. We cover all of these operators later in this chapter.
Streams applications generally fall into one of two types. The first keeps
up with the most current data no matter what happens, even if it means
dropping older data. For these applications, now is more important than pro-
cessing every bit of data. Examples of applications that need to keep up with
the most current data include detecting and responding to cyber attacks,
making buy-and-sell decisions on the stock market, or monitoring a person’s
vital signs. For these applications, you need to make decisions based on the
most current data. Streams supports this type of application by delivering
scalability and high throughput, load-shedding operators to intelligently
shed data when necessary, and maintaining system-level high availability to
keep applications running.
The second type of application requires every bit of data to be processed,
no matter what. These applications typically have used database technology
in the past, but for reasons of efficiency, timeliness, or the inability to keep
up, a portion of the application is moved to Streams. One example of this
type of application is processing call detail records (CDRs) for the telecom-
munications industry. For compliance and business reasons, these CDRs
need to be de-duplicated, transformed, and stitched together without losing
a single record. By moving processing to Streams while the CDRs are still in
motion, significant efficiency gains are realized and new business opportuni-
ties arise. For these kinds of applications, the inherently high throughput
coupled with system-level high availability and application patterns make
Streams an excellent choice.
As with a web application server or a database, you can customize Streams
to deliver applications that solve business problems. Streams provides many
enterprise-class features, such as the ability to deploy applications across a
cluster of dozens or hundreds of servers to improve availability, scalability,
and performance (similar to Hadoop but for real-time applications). Streams
06-ch06.indd 130 04/10/12 11:37 AM
162.
Real-Time Analytical Processingwith InfoSphere Streams 131
Flash 6X9 / Harness the Power of Big Data:The IBM Big Data Platform / Zikopoulos / 817-5
also provides an easy-to-use, drag-and-drop tooling environment to help
you design and build your streaming applications (covered in the “Program-
ming Streams Made Easy” section in this chapter). Another nice feature is
that Streams shares the same Text Analytics Toolkit with BigInsights, enabling
you to reuse skills and code snippets across your entire Big Data platform
(we talk about that in Chapter 8).
You can build your applications for a single server or a cluster, and Streams
automatically fuses sets of operators into highly optimized processing elements
(PEs) that transmit streaming data point-to-point in the cluster for optimal
throughput. When you’re ready to deploy your streaming application,
Streams autonomically decides, at run time, where to run the PEs based on
cluster-based load balancing and availability metrics, enabling it to reconfig-
ure operators to run on other servers to ensure the continuity of the stream in
the event of server or software failures. If you want more placement control,
you can also have fine-grained control over the placement of one or more
operators by programmatically specifying which operators run on which
servers and which operators should run together or separately.
This autonomic streaming and customizable platform enables you to increase
the number of servers performing analysis on the stream simply by adding
additional servers and assigning operators to run on those servers. The Streams
infrastructure ensures that the data flows successfully from one operator to
another, whether the operators are running on distinct servers or on the same
server. Not only can you add or remove servers, but you can also dynami-
cally add applications that will automatically connect to running
applications and that can be reconfigured programmatically. Of course, you
can also remove applications on the fly, which enables you to change priori-
ties and improve analysis over time. These features provide a high degree of
agility and flexibility to let you start small and grow the platform as needed.
Much like BigInsights, Streams is ideally suited for both structured data and
for the nontraditional semistructured or unstructured data coming from sensors,
voice, text, video, and financial sources, and many other high-volume sources.
Because Streams and BigInsights are part of the IBM Big Data platform, you’ll
find enormous efficiencies with being able to apply the same Big Data analytics
you build to both in-motion or at-rest data. For example, the extractors that are
built from the Text Analytics Toolkit can be deployed in both Streams and
BigInsights.
06-ch06.indd 131 04/10/12 11:37 AM
163.
132 Harnessthe Power of Big Data: The IBM Big Data Platform
Flash 6X9 / Harness the Power of Big Data:The IBM Big Data Platform / Zikopoulos / 817-5
How InfoSphere Streams Works
As previously mentioned, Streams is all about analytics on data in motion. In
Streams, data flows continuously through a sequence of operators in a pipe-
line fashion, much like ingredients flowing through an assembly line in a
chocolate factory. Some operators discard data that isn’t useful or relevant in
the same way that a sorter of cocoa beans might discard beans that are too
small. Other operators might transform data into a derived data stream in the
same way that cocoa beans are crushed and liquefied. Some operators com-
bine different types of data in the same way that nuts are combined with a
chocolate mixture in just the right proportions.
When operators are too slow to keep up, a data stream can be split up and
sent to parallel instances of those operators, in much the same way that a fac-
tory might arrange its assembly line to have parallel molding machines. Some
operators might send different kinds of data to different downstream opera-
tors, like sending a candy bar with nuts to one wrapping station, and the
candy bar without nuts to another wrapping station. Operators might even
send signals to earlier stages of analysis to change behavior, in much the same
way that quality control in the factory might increase the nuts-to-chocolate
mixture if samples are not meeting specifications.
Unlike an assembly line that can be changed only during a temporary
plant shutdown, however, Streams operators can be improved, added, or
removed dynamically without stopping the analysis. Streams is an excellent
approach for high-throughput, timely analysis; it enables businesses to lever-
age just-in-time intelligence to perform actions in real time, ultimately yield-
ing better results for the business. Streams provides operators to store data
and results in an at-rest engine, to send action signals, or to just toss out the
data if it’s deemed to be of no value during in-flight analysis.
What’s a Lowercase “stream”?
A stream is a continuous sequence of data elements. A Streams application
can be viewed as a graph of nodes connected by directed edges. Each node in the
graph is an operator or adapter that processes the data from a stream. Operators
can have zero or more inputs and zero or more outputs. The output (or out-
puts) from one operator connects to the input (or inputs) of another operator
(or operators). The edges of the graph that join the nodes together represent
06-ch06.indd 132 04/10/12 11:37 AM
164.
Real-Time Analytical Processingwith InfoSphere Streams 133
Flash 6X9 / Harness the Power of Big Data:The IBM Big Data Platform / Zikopoulos / 817-5
the stream of data moving between the operators. Each output of an operator
defines a new stream, and other operators can connect to the stream. Operators
occurring early in a pipeline can even connect to a stream that is produced by
“downstream” operators, enabling control flows to change the computation
of upstream operators as new insights are uncovered. Figure 6-1 represents a
simple stream graph that reads data from a file, sends the data to an operator
known as a functor (this operator transforms incoming data in some program-
matic manner), and then feeds that data to another operator. In this figure,
the streamed data is fed to a split operator, which then feeds data to either a
file sink or a database (depending on what goes on inside the split operator).
The data elements in a stream are known as tuples. In a relational database
sense, you can think of a tuple as similar to a row of data. However, when
Streams works on semistructured and unstructured data, a tuple is an abstrac-
tion that represents a package of data, and that’s why we think of a tuple as
a set of attributes for a given object. Each element in the tuple contains the
value for that attribute, which can be a character string, a number, a date, or
even some sort of binary object, such as a video frame. For applications with
semistructured data, it is common for Streams applications to start with tuples
that consist of a small amount of metadata coupled with an unstructured
payload in each tuple, with subsequent operators progressively extracting
more information from the unstructured payload.
The simplest operators work on one tuple at a time. These operators can
filter a tuple based on characteristics of its attributes, extract additional infor-
mation from the tuple, and transform the tuple before sending data to an output
stream. Because a stream consists of a never-ending sequence of tuples, how
can you correlate across different streams, sort tuples, or compute aggregates?
FileSource Functor Split
FileSink
ODBCAppend
Figure 6-1 A simple data stream that applies a transformation to data and splits it into
two possible outputs based on predefined logic
06-ch06.indd 133 04/10/12 11:37 AM
165.
134 Harnessthe Power of Big Data: The IBM Big Data Platform
Flash 6X9 / Harness the Power of Big Data:The IBM Big Data Platform / Zikopoulos / 817-5
The answer is windows of data. A window of data is a finite sequence of tuples
and looks a lot like a database view. Windows are continuously updated as new
data arrives, by eliminating the oldest tuples and adding the newest tuples.
Windows can be easily configured in many ways. For example, the window
size can be defined as N tuples long or M seconds long. Windows can be ad-
vanced in many ways, including one tuple at a time, or by replacing an entire
window at once. Each time the window is updated, you can think of it as a
temporarily frozen view. It’s easy to correlate a frozen view with another win-
dow of data from a different stream, or compute aggregates using similar
techniques for aggregates and joins in relational databases. The windowing
libraries in Streams provide incredible productivity for building applications.
We discuss windowing later in this chapter where we talk about the various
operators, but it’s an important concept to understand, because Streams is not
just about manipulating one tuple at a time, but rather analyzing large sets of
data in real time and gaining insight from analytics across multiple tuples,
streams, and context data.
Streams also has the concept of composite operators. A composite operator
consists of a reusable and configurable Streams subgraph. Technically, all
Streams applications contain at least one composite (the main composite for
the application), but they can include more than one composite (composites
can also be nested). A composite defines zero or more input streams and zero
or more output streams. Streams can be passed to the inputs of the composite
and are connected to inputs in the internal subgraph. Outputs from the inter-
nal subgraph are similarly connected to the composite outputs. A composite
can expose parameters that are used to customize its behavior. An extreme
example of nested composites is the Matryoshka sample application in
Streams, which is inspired by the Matryoshka (or Russian) dolls, the famous
wooden dolls of decreasing size that are stored inside one another.
Consider a simple example in which a composite operator, PetaOp, con-
tains a subgraph consisting of a single composite operator TeraOp, which in
turn contains a single composite operator GigaOp, and so on. This example is
illustrated in Figure 6-2, which shows an application deployed with just the
PetaOp operator (on the top) contrasted with a fully expanded composite
operator (on the bottom). You can see that composites are very powerful and
useful for big applications, because subtasks can be encapsulated and hid-
den, enabling developers to focus on the broader goals.
06-ch06.indd 134 04/10/12 11:37 AM
166.
Real-Time Analytical Processingwith InfoSphere Streams 135
Flash 6X9 / Harness the Power of Big Data:The IBM Big Data Platform / Zikopoulos / 817-5
Programming Streams Made Easy
For the last several years, enterprises have been delighted by the speed, reli-
ability, and cost savings provided by Streams. Additionally, developers have
found that the analytic toolkits and programming tools provide a high level
of agility when building applications. However, it has been difficult for non-
programmers to use Streams—that is, until now.
Streams 3.0 is focused completely on ease of use. Streams 3.0 (herein simply
referred to as Streams) includes an integrated development environment
(IDE) that provides a drag-and-drop work-as-you-think programming expe-
rience, new operational and data visualizations, new analytic toolkits, new
management console features, and installation enhancements that all serve
to deliver a dramatically improved user experience. Not every company can
hire waves of new programmers, and this is why the consumability of the Big
Data platform is just as important as its capabilities.
Figure 6-2 The Matryoshka sample application with the PetaOp composite operator
on the top and the PetaOp composite operator fully expanded (showing all internal
composite operators) on the bottom
06-ch06.indd 135 04/10/12 11:37 AM
167.
136 Harnessthe Power of Big Data: The IBM Big Data Platform
Flash 6X9 / Harness the Power of Big Data:The IBM Big Data Platform / Zikopoulos / 817-5
Streams has also surfaced the most popular use cases as solution accelera-
tors. For example, IBM provides a customizable solution accelerator known
as the IBM Accelerator for Telecommunications Event Data Analytics, which
uses Streams to process call detail records (CDR) for telecommunications. A
customizable solution accelerator known as the IBM Accelerator for Social
Data provides analytics for lead generation and brand management based on
social media. You can learn more about all the IBM Big Data accelerators in
Chapter 9.
Most end-user interactions with Streams occur through the Streams
Console, the Streams Studio, or the streamtool command-line interface.
We cover the highlights of these powerful tools in the rest of this section.
The Streams Console
The Streams Console is a web-based tool that provides management services
and a wealth of information about a Streams instance. You can quickly see
the health and status of your Streams instance; manage and monitor servers,
services, and applications in your cluster; and control overall settings for the
instance (such as security). Additionally, you can configure Views for opera-
tors in your applications that sample and buffer data for live export from
Streams to visualization tools. You can also configure Charts to visualize data
directly in the Streams Console.
The bottom of Figure 6-3 illustrates host (server) management through the
Streams Console. A sortable and filterable table shows each available host in
the cluster. At a glance, you can see host health in the Status field. You can
also see the status of services on each host, whether the host is available for
running applications, and metrics for the host, including load average and
number of CPU cores when metrics collection is enabled. Tags, such as
IngestServer, can be added to hosts to facilitate optimal application place-
ment in the cluster. When something goes wrong with a host, you can view
or download logs with the click of a button for problem determination. It’s
also possible to quiesce workloads on a server so that it can be taken out of
service for maintenance. Similar features for jobs, operators, and processing
elements are available as well; for example, the top of Figure 6-3 shows the
console’s jobs view.
06-ch06.indd 136 04/10/12 11:37 AM
168.
Real-Time Analytical Processingwith InfoSphere Streams 137
Flash 6X9 / Harness the Power of Big Data:The IBM Big Data Platform / Zikopoulos / 817-5
Operations Visualized
A great new feature in the Streams Console is the ability to monitor results of
Streams applications in a very natural way, using graphs. The Application
Graph feature displays all running applications and run-time metrics from a
Streams instance in an interactive and customizable window.
For example, Figure 6-4 illustrates two running financial services applica-
tions, one calculating trend metrics and one calculating the volume-weighted
average price (VWAP) for every stock symbol on a tick-by-tick basis. At the
top of Figure 6-4, you can see that the graph is configured to continuously
update the color of the operator based on the tuple rate. The thickness of the
lines is also updated to be proportional to the data flow rate to give you a
quick idea of how much data is flowing. The bottom of Figure 6-4 illustrates
a different view, in which the operators are grouped by job. By clicking on an
operator in the TrendCalculator application, additional information, such as
tuples processed by the operator, is displayed. Clicking on other objects, such
as ports or a stream, also provides significant detail. These graphs are similar
to Streams Live Graph in previous versions of Streams, but they are now also
exposed through the Streams Console, making them easier for administrators
to access.
Figure 6-3 The management of jobs and hosts in the Streams Console
06-ch06.indd 137 04/10/12 11:37 AM
169.
138 Harnessthe Power of Big Data: The IBM Big Data Platform
Flash 6X9 / Harness the Power of Big Data:The IBM Big Data Platform / Zikopoulos / 817-5
Data Visualized
One of the most important new features in the Streams Console is data
visualization. In addition to making live data available for external visu-
alization tools, live streaming data can be visualized directly in the
Streams Console. Tables and graphs can be extensively configured by
selecting and rearranging attributes from the tuples, as well as filtering.
Figure 6-5 shows a chart for the IBM ticker with VWAP, Min Price, Max
Price, and Average Price. (Our lawyers want us to mention that this is
old data from a sample application, so don’t use these charts if you’re a
day trader.)
The data visualization widgets found in Streams are very rich; see some
other examples in Figure 6-6.
Figure 6-4 The Streams Console showing an Application Graph with two running jobs
at the top, and a grouping by jobs showing details about the NewTrendValue custom
operator at the bottom
06-ch06.indd 138 04/10/12 11:37 AM
170.
Real-Time Analytical Processingwith InfoSphere Streams 139
Flash 6X9 / Harness the Power of Big Data:The IBM Big Data Platform / Zikopoulos / 817-5
An Integrated Development Environment
for Streams: Streams Studio
Streams Studio is an interactive tool set that’s used for creating and deploying
Streams applications. It’s a typical IDE, so if you have experience in application
Figure 6-5 Chart displaying VWAP calculations for symbol IBM
Figure 6-6 Examples of charts that are available in the Streams Console
06-ch06.indd 139 04/10/12 11:37 AM
171.
140 Harnessthe Power of Big Data: The IBM Big Data Platform
Flash 6X9 / Harness the Power of Big Data:The IBM Big Data Platform / Zikopoulos / 817-5
development, you will love what you’re getting here: content assist, design-time
assistance, contextual help, templates, design-time validation, drag-and-drop
palettes, and more. Besides the new drag-and-drop application construction
and editors for the Streams Processing Language (SPL), Streams Studio can
configure and manage Streams instances. The first thing you will notice when
starting Streams Studio is a step-by-step Task Launcher under First Steps. The
Task Launcher guides you through everything from conceptual design to
deployment, and all tasks in between, when building a Streams application.
The most dramatic improvement for Streams is the new drag-and-drop
application development tooling called the Streams Graphical Editor. With
this tool, it’s possible to create and deploy Streams applications without writing
a single line of code! Recognizing that applications often start by sketching a
graph on paper, Streams Studio lets users sketch an application flow in the
Streams Graphical Editor without necessarily choosing operator implementa-
tions. Generic operators can subsequently be connected together and manipu-
lated until the flow is right. The operators and graphs can also be annotated
with the functions that should be performed. Other users, or developers, can
later choose and configure the remaining operator implementations, creating
new operators if they don’t already exist in one of the extensive toolkits.
For example, Figure 6-7 shows a very simple sketched application with opera-
tors labeled Reader, Filter, and Writer. The implementation for Reader is
already known to be a FileSource (a built-in operator for reading data from
files). The Filter and Writer operators are generic operators that serve as
placeholders until an implementation is chosen. In this example, an architect
has annotated the graph, indicating that the generic Filterplaceholder should
be implemented using the Streams standard toolkit Filter operator, with fil-
tering based on ticker symbol. The figure shows that a user has searched for
operators starting with “fil” and is dragging the standard toolkit Filter
operator onto the graph to provide an implementation for the Filter place-
holder. If the implementation needs to be changed to another operator later, it can
be overwritten in the same way.After choosing an operator for the Writerplace-
holder and configuring the properties, a complete application is ready to run.
Extending existing applications is also a snap. Figure 6-8 shows the
volume-weighted average price (VWAP) sample application that comes with
Streams. In this example, a user extended the sample application so that the
QuoteFilter stream is written to a file. This is one of the greatest benefits
06-ch06.indd 140 04/10/12 11:37 AM
172.
Real-Time Analytical Processingwith InfoSphere Streams 141
Flash 6X9 / Harness the Power of Big Data:The IBM Big Data Platform / Zikopoulos / 817-5
associated with all of the samples that are shipped with Streams: You can
extend and customize them to build your application.
Figure 6-7 Application building is as simple as dragging and dropping with the
Streams Graphical Editor.
Figure 6-8 Extending the VWAP sample to write tuples from QuoteFilter to a file
06-ch06.indd 141 04/10/12 11:37 AM
173.
142 Harnessthe Power of Big Data: The IBM Big Data Platform
Flash 6X9 / Harness the Power of Big Data:The IBM Big Data Platform / Zikopoulos / 817-5
In this example, a user simply dragged a FileSink operator from the
Streams standard toolkit onto the palette and connected the QuoteFilter
stream to the new FileSink operator. The FileSink operator was renamed
to QuoteWriter and the file property is set to the QuoteFile.txt file.
After running the new application, we see that by default, the tuple attri-
butes are written one row at a time to QuoteFile.txt in a comma-separated
value (CSV) form, such as in the following example:
80.43,83.49,10,(1135711808,117000000,0),"IBM"
83.43,83.46,10,(1135711813,283000000,0),"IBM"
83.42,83.46,10,(1135711813,718000000,0),"IBM"
83.42,83.45,1,(1135711814,731000000,0),"IBM"
81.42,83.45,3,(1135711815,751000000,0),"IBM"
Even though applications can be built completely within the Streams
Graphical Editor, this tool set also provides a powerful round-trip linkage
with the Streams Processing Language editor so that applications can be fur-
ther customized by advanced developers. For example, this integration gives
you the ability to implement custom operators, which didn’t initially exist in
the Streams toolkits. Developers often find it convenient to start with the
Streams Graphical Editor and switch back and forth between it and the SPL
editor after the initial application has been sketched. Figure 6-9 shows the
SPL editor with the new QuoteWriter operator that we added using the
Streams Graphical Editor. The new code that was generated is highlighted at
the bottom of the listing. If we later delete that code, the Streams Graphical
Editor would also show that the QuoteWriter operator was removed.
You can also change applications by replacing existing operators. If we
want to send the QuoteFilter stream to HDFS in BigInsights rather than
sending it to a normal file, we can simply select the built-in HDFSFileSink
from the Big Data HDFS toolkit and drag it on top of the FileSource operator.
As soon as the new implementation is assigned, the unique properties for the
HDFSFileSink operator can be configured, and the application would be
ready to go.
Streams Studio can deploy applications and run them on the cluster or in
stand-alone mode on a single server or laptop. Like the Streams Console,
Streams Studio can display the graphs and metrics for running applications.
There are numerous other features for understanding applications, such as
the ability to color or group a graph based on jobs, hosts, and flow rates. It is
06-ch06.indd 142 04/10/12 11:37 AM
174.
Real-Time Analytical Processingwith InfoSphere Streams 143
Flash 6X9 / Harness the Power of Big Data:The IBM Big Data Platform / Zikopoulos / 817-5
also possible to quickly gather and display logs from the cluster if an application
is not behaving as expected. For example, Streams Studio applies coloriza-
tion to a job and its operators, and even colors the PE containing the operator,
so that different PEs have different colors.
Additionally, by clicking on any operator, it is possible to highlight up-
stream or downstream operators to understand provenance (the origin of the
data and any changes applied to it in the stream). The ability to quickly see
the upstream operators is extremely useful for debugging large applications
when an operator is not receiving the data that is expected. For example, if an
operator is not receiving data, by highlighting upstream operators you can
quickly trace back to the problem in the application. Figure 6-10 shows an
Instance Graph with both the VWAP and TrendCalculator job running. Opera-
tors that are upstream from the QuoteWriter operator are highlighted to
determine what generates its data.
One of the most useful new features in Streams Studio for debugging
applications is the ability to click on a stream in an Instance Graph to display
the data that is flowing on that stream. As in the Table view in the Streams
Figure 6-9 The Streams Graphical Editor and SPL editor are linked for round-trip
updates.
06-ch06.indd 143 04/10/12 11:37 AM
175.
144 Harnessthe Power of Big Data: The IBM Big Data Platform
Flash 6X9 / Harness the Power of Big Data:The IBM Big Data Platform / Zikopoulos / 817-5
Console, the live data that is flowing on the stream is displayed in a tabular
form that can be filtered and manipulated. Figure 6-11 shows a user selecting
Show Data for the NewTrendValue stream. It also shows the live data from
the stream after the user runs through a wizard to configure the attributes
and filters that should be applied. Data in the table can be paused for closer
examination without impacting the running applications; after updates are
resumed, the latest data in the view buffer is displayed. Because you can
quickly see the data elements as they pass by in the stream, it is much easier
to extend and debug applications.
The Up-and-Running Experience:
Getting the Environment Installed and Configured
Clusters can be very challenging to install and configure. Although we can’t go
into detail about the Streams installer and streamtool command-line tools,
we’ve invested a lot to ensure that the up-and-running experience is as seam-
less as possible. If you’ve ever installed and configured a Hadoop cluster from
Apache, and compared that with the Cloudera or BigInsights experience, then
you’ll appreciate what we’ve done here. After a quick and easy installation
program, the user accesses the Streams First Steps configuration tool. This
tool vastly simplifies complex tasks, such as setting up ssh keys, setting
environment variables, configuring public and private keys, and verifying
Figure 6-10 Instance Graph with VWAP andTrendCalculator applications; operators
upstream from the QuoteWriter operator are highlighted.
06-ch06.indd 144 04/10/12 11:37 AM
176.
Real-Time Analytical Processingwith InfoSphere Streams 145
Flash 6X9 / Harness the Power of Big Data:The IBM Big Data Platform / Zikopoulos / 817-5
the installation. In many cases, the user simply needs to click on the task
and it is completed automatically with minimal configuration. (You can also
launch First Steps any time using the streamtool launch –firststeps
command.)
As you can see, there are many powerful tools that help users and devel-
opers to assemble, deploy, run, and debug Streams applications. There are
also tools to effectively install and manage a cluster, which provide detailed
health and metrics information. Built-in operators make it easy to assemble
applications without writing a program. It is easier than ever to visualize live
streaming data using Streams Console and Streams Studio.
The Streams Processing Language
With the new Streams Graphical Editor, many applications can be created
without looking at any source code. However, under every Streams applica-
tion is the Streams Processing Language (SPL). SPL is a structured application
Figure 6-11 Display live data being fed from the NewTrendValue stream by clicking
directly on the Instance Graph
06-ch06.indd 145 04/10/12 11:37 AM
177.
146 Harnessthe Power of Big Data: The IBM Big Data Platform
Flash 6X9 / Harness the Power of Big Data:The IBM Big Data Platform / Zikopoulos / 817-5
development language that can be used to build Streams applications. It’s
supported by both the Streams Graphical and the Streams Processing Lan-
guage editors, which are integrated with “round-trip ability” so that it’s pos-
sible to go back and forth between both editors.
SPL is a very powerful declarative language that provides a higher level
of abstraction for building Streams applications than using lower-level
languages or APIs, in the same way that Jaql or Pig makes development
easier for Hadoop compared to writing MapReduce applications directly.
Streams 3.0 introduces a new XML data type and operators to process
XML natively. Source and sink adapters support XML data, XML can be
queried and manipulated with new operators and functions, and Streams
tuples can be converted to and from XML. Additionally, SPL has been
extensively enhanced with new built-in functions and operators; in fact,
one of our partners, Dr. Alex Philp, Founder and CTO of TerraEchos, Inc.,
noted that their developers can “deliver applications 45 percent faster due
to the agility of [the] Streams Processing Language.” We think that Bó
Thide, a professor at Sweden’s top-ranked Uppsala University, said it best
when referring to SPL: “Streams allows me to again be a Space Physicist
instead of a Computer Scientist.” After all, technology is great, but if you
can’t quickly apply it to the business need at hand, what’s the point?
Streams-based applications built with the Streams Graphical Editor or
written in SPL are compiled using the Streams compiler, which turns them
into binary (bin) executable code—this executable code runs in the Streams
environment to accomplish tasks on the various servers in the cluster. An
SPL program is a text-based representation of the graph that we discussed in
the preceding section: It defines the sources, sinks, and operators, as well as
the way in which they are interconnected with a stream. For example, the
following SPL code reads data from a file line by line into tuples, converts
each line to uppercase, and then writes each line to standard output.
composite toUpper {
graph
stream<rstring line> LineStream = FileSource() {
param file : "input_file";
format : line;
}
stream<LineStream> upperedTxt = Functor(LineStream) {
06-ch06.indd 146 04/10/12 11:37 AM
178.
Real-Time Analytical Processingwith InfoSphere Streams 147
Flash 6X9 / Harness the Power of Big Data:The IBM Big Data Platform / Zikopoulos / 817-5
output upperedTxt : line = upper(line);
}
() as Sink = FileSink(upperedTxt) {
param file : "/dev/stdout";
format : line;
}
}
In this SPL snippet, the built-in FileSource operator reads data from the
specified file one line at a time and puts it into a stream called LineStream
that has a single tuple attribute called line. The built-in Functor operator
consumes the LineStream stream, converts the line attribute from each
streamed tuple to uppercase text, and creates a new output stream called
upperedTxt using the same tuple format as LineStream. The Sink opera-
tor then reads the upperedTxt stream of data and sends the tuples to stan-
dard output (STDOUT). Notice that the application is wrapped in a composite
operator that encapsulates the function, as described in the previous
sections; again, all applications consist of one or more composite operators.
This snippet represents the simplest stream with a single source, a single
operation, and a single sink. Of course, the power of Streams is that it can run
massively parallel jobs across large clusters of servers, where each operator, or
a group of operators, can be running on a separate server. But before we get into
the enterprise class capabilities of Streams, let’s look at some of the most popu-
lar adapters and operators that are available in this product. As described ear-
lier in this chapter, Streams provides nearly 30 built-in operators in the standard
toolkit, dozens of operators from special toolkits, such as data mining and text
analytics, and literally hundreds of functions out-of-the-box for developers.
Source and Sink Adapters
It goes without saying that in order to perform analysis on a stream of data,
the data has to enter a stream. Of course, a stream of data has to go somewhere
when the analysis is done (even if that “somewhere” is defined as a void where
bits get dumped into “nowhere”). Let’s look at the most basic source adapters
available to ingest data along with the most basic sink adapters to which data
can be sent. Perhaps the most powerful adapters we describe are import and
export—these operators provide dynamic connections for jobs that can be
configured at deployment time and at run time.
06-ch06.indd 147 04/10/12 11:37 AM
179.
148 Harnessthe Power of Big Data: The IBM Big Data Platform
Flash 6X9 / Harness the Power of Big Data:The IBM Big Data Platform / Zikopoulos / 817-5
FileSource and FileSink
As the names imply, FileSource and FileSink are standard built-in
adapters that are used to read from or write to a file. You use parameters to
specify the name and location of the file that is to be used for the read or
write operation. Another parameter identifies the format of the file’s con-
tents, which could be any of the following formats:
•
txt Simple text files, where each tuple is a row in the file
•
csv Files that contain comma-separated values
•
bin Files that contain binary data tuples
•
line Files that contain lines of text data
•
block An input stream made up of binary data blocks (much like a
BLOB)
There are a number of other optional parameters that can be used to specify
column separators, end-of-line markers, delimiters, compression, and more.
TCPSource/UDPSource andTCPSink/UDPSink
The TCPSource and TCPSink adapters are the basic TCP adapters used in
Streams to read from and write to a socket. When you use these adapters,
you specify the IP address (using either IPv4 or IPv6) along with the port,
and the adapter will read from the socket and generate tuples into the stream.
Parameters for these adapters are the same as those for the FileSource and
FileSink adapters, in terms of the format of the data flow (txt, csv, and
so on). The UDPSource and UDPSink adapters read from and write to a
UDP socket in the same manner as the TCP-based adapters.
Export and Import
The export and import adapters work together to connect jobs within a
Streams instance. An export adapter can be used to make data from a job
available to other jobs that are already deployed or that might be deployed in
the future. You can export data using the export adapter and assign a
streamID to the exported stream, as well as optional name/value pairs to
further characterize the stream.
After the stream is assigned these export properties, any other Streams
applications that are deployed to the same Streams instance can import this
06-ch06.indd 148 04/10/12 11:37 AM
180.
Real-Time Analytical Processingwith InfoSphere Streams 149
Flash 6X9 / Harness the Power of Big Data:The IBM Big Data Platform / Zikopoulos / 817-5
data using an import operator and a subscription expression that matches
the export properties—assuming the application is authorized to access the
exported data stream. Using built-in APIs, both export properties and import
subscriptions can be changed dynamically at run time. This means that
applications can be built to evolve in powerful ways over time, depending on
the jobs that are submitted and the processing that is being done. For example,
a sentiment analysis job might subscribe to all streams with the parameter
textForSentimentAnalysis=true. There might be jobs processing
email and blog text that export that parameter. At some time in the future,
if you decide to process instant messaging text for sentiment, you just need
to deploy the job to process the instant messages and export the textForSe
ntimentAnalysis=true parameter—it will automatically be connected
in an efficient point-to-point way to the sentiment analysis job. Using
export and import is a very powerful way to dynamically stream data
between applications running under the same Streams instance.
MetricsSink
The MetricsSink adapter is a very interesting and useful sink adapter because
it enables you to set up a named meter, which is incremented whenever a
tuple arrives at the sink. You can think of these meters as a gauge that you
can monitor using Streams Studio or other tools. If you’ve ever driven over
one of those traffic counters (those black rubber hoses that lie across an inter-
section or road), you’ve got the right idea. Although a traffic counter mea-
sures the flow of traffic through a point of interest, a MetricsSink can be
used to monitor the volume and velocity of data flowing out of your data
stream.
Operators
Operators are at the heart of the Streams analytical engine. They take data
from upstream adapters or other operators, manipulate that data, and create
a new stream and new tuples (possibly pass-through) to send to downstream
operators. In addition to tuples from an input stream, operators have access
to metrics that can be used to change the behavior of the operator, for example,
during periods of high load. In this section, we discuss some of the more
common Streams operators that can be strung together to build a Streams
application.
06-ch06.indd 149 04/10/12 11:37 AM
181.
150 Harnessthe Power of Big Data: The IBM Big Data Platform
Flash 6X9 / Harness the Power of Big Data:The IBM Big Data Platform / Zikopoulos / 817-5
Filter
The filter operator is similar to a filter in an actual water stream, or in
your furnace or car: its purpose is to allow only some of the streaming con-
tents to pass. A Streams filter operator removes tuples from a data stream
based on a user-defined condition specified as a parameter to the operator.
After you’ve programmatically specified a condition, the first output port
defined in the operator will receive any tuples that satisfy that condition. You
can optionally specify a second output port to receive any tuples that did not
satisfy the specified condition. (If you’re familiar with extract, transform, and
load [ETL] flows, this is similar to a match and discard operation.)
Functor
The functor operator reads from an input stream, transforms tuples in flex-
ible ways, and sends new tuples to an output stream. The transformations
can manipulate any of the elements in the stream. For example, you could
extract a data element out of a stream and output the running total of that
element for every tuple that comes through a specific functor operator.
Punctor
The punctor operator adds punctuation into the stream, which can then be
used downstream to separate the stream into multiple windows. For exam-
ple, suppose a stream reads a contact directory listing and processes the data
flowing through that stream. You can keep a running count of last names in
the contact directory by using the punctor operator to add a punctuation
mark into the stream any time your application observes a changed last name
in the stream. You could then use this punctuation mark downstream in an
aggregation functor operator to send out the running total for that name,
later resetting the count back to 0 to start counting the next set of last names.
Sort
The sort operator outputs the tuples that it receives, but in a specified sorted
order. This operator uses a stream window specification. Think about it for a
moment: If a stream represents a constant flow of data, how can you sort that
data? You don’t know whether the next tuple to arrive will need to be sorted
with the first tuple to be sent as output. To overcome this issue, Streams
enables you to specify a window on which to operate. You can specify a win-
dow of tuples in the following ways:
06-ch06.indd 150 04/10/12 11:37 AM
182.
Real-Time Analytical Processingwith InfoSphere Streams 151
Flash 6X9 / Harness the Power of Big Data:The IBM Big Data Platform / Zikopoulos / 817-5
•
count The number of tuples to include in the window
•
delta Wait until a given attribute of an element in the stream has
changed by a specified delta amount
•
time The amount of time, in seconds, to allow the window to fill up
•
punctuation The punctuation that is used to delimit the window,
as defined by the punctor operator
In addition to specifying the window, you must also specify an expression
that defines how you want the data to be sorted (for example, sort by a given
attribute in the stream). After the window fills up, the sort operator will sort
the tuples based on the element that you specified, and then send those tuples
to the output port in sorted order. Then the window fills up again. By default,
Streams sorts in ascending order, but you can specify a sort in descending
order.
Join
As you’ve likely guessed, the join operator takes two streams, matches the
tuples on a specified condition, and then sends the matches to an output
stream. When a row arrives on one input stream, the matching attribute is
compared to the tuples that already exist in the operating window of the
second input stream to try to find a match. Just as in a relational database,
several types of joins can be used, including inner joins (in which only
matches are passed on) and outer joins (which can pass on one of the
stream tuples even without a match, in addition to matching tuples from
both streams). As with the sort operator, you must specify a window of
tuples to store in each stream.
Aggregate
The aggregate operator can be used to sum up the values of a given attri-
bute or set of attributes for the tuples in the window; this operator also relies
on a windowing option to group together a set of tuples. An aggregate
operator enables groupBy and partitionBy parameters to divide up the
tuples in a window and perform aggregation on those subsets of tuples. You
can use the aggregate operator to perform count, sum, average, max,
min, first, last, count distinct, and other forms of aggregation.
06-ch06.indd 151 04/10/12 11:37 AM
183.
152 Harnessthe Power of Big Data: The IBM Big Data Platform
Flash 6X9 / Harness the Power of Big Data:The IBM Big Data Platform / Zikopoulos / 817-5
Beacon
The beacon is a useful operator because it’s used to create tuples on the fly.
For example, you can set up a beacon to send tuples into a stream at various
intervals that are defined either by a time period (send a tuple every n tenths
of a second) or iteration (send out n tuples and then stop). The beacon
operator can be useful for testing and debugging your Streams applications.
Throttle and Delay
Two other useful operators can help you to manipulate the timing and flow
of a given stream: throttle and delay. The throttle operator helps you
to set the “pace” of the data flowing through a stream. For example, tuples
that are arriving sporadically can be sent to the output of the throttle
operator at a specified rate (defined by tuples per second). Similarly, the
delay operator can be used to change the timing of the stream. A delay
operator can be set up to output tuples after a specific time interval; however,
with delay, the tuples exit the operator with the same time interval that
existed between the tuples when they arrived. That is, if tuple A arrives 10
seconds before tuple B, which arrives three seconds before tuple C, the
delay operator maintains this timing between tuples on exit, after the tuples
have been delayed by the specified amount of time.
Split and Union
The split operator takes one input stream and, as the name suggests, splits
that stream into multiple output streams. This operator takes a parameter-
ized list of values for a given attribute in the tuple and matches the tuple’s
attribute with this list to determine on which output stream the tuple will be
sent. The union operator acts in reverse: it takes multiple input streams and
combines all of the tuples that are found in those input streams into one out-
put stream.
StreamsToolkits
In addition to the adapters and operators that are described in the previous
sections, Streams ships with a number of toolkits that enable even faster
application development. These toolkits enable you to connect to specific
data sources and manipulate the data that is commonly found in databases or
Hadoop; perform signal processing on time series data; extract information
06-ch06.indd 152 04/10/12 11:37 AM
184.
Real-Time Analytical Processingwith InfoSphere Streams 153
Flash 6X9 / Harness the Power of Big Data:The IBM Big Data Platform / Zikopoulos / 817-5
from text using advanced text analytics; score data mining models in real
time; process financial markets data; and much more. Because the Streams
toolkits can dramatically accelerate your time to analysis with Streams, we
cover the Database, Big Data, Advanced Text Analytics, and Data Mining
Toolkits in more detail here. There are many more toolkits available as part of
the product, such as the Timeseries, GeoSpatial, Financial Markets, Messag-
ing, CEP, Internet, IBM PureData System high speed adapters, DB2 parallel
adapter, and DataStage toolkits. There are also toolkits freely downloadable
from the Streams Exchange on developerWorks (http://tinyurl.com/7sc6p8m)
such as the OpenCV toolkit for image processing and the HTTP connectivity
toolkit.
The DatabaseToolkit: Operators for Relational Databases
The Database Toolkit enables a stream to read from or write to an ODBC
database or read from a SolidDB database. Moreover, it provides high-
performance parallel operators to write to DB2 or IBM PureData System
databases. This toolkit enables a stream to query an external database to add
data or to verify data in the stream for further analysis. This Streams toolkit
includes the following operators, among others:
•
ODBCAppend Inserts data from a stream into a table using SQL
INSERT statements
•
ODBCSource Reads data from a table and puts each row into the
stream as a tuple
•
DB2PartitionedAppend Inserts data into a specific DB2 partition,
and can be used in parallel for high-performance loading
•
NetezzaLoad Inserts data into an IBM PureData System for
Analytics (Netezza) using its high-speed loader
•
SolidDBEnrich Reads data from a SolidDB table and adds that
information to tuples in the stream
The Big DataToolkit:
Operators for Integration with BigInsights
The Big Data toolkit has operators for connecting to the Hadoop Distributed
File System (HDFS). This toolkit is essential for applications where Streams
and BigInsights work together. It enables high-speed parallel writing to the
HDFS for the fastest possible data exchange. This Streams toolkit includes
the operators shown in the following list, among others.
06-ch06.indd 153 04/10/12 11:37 AM
185.
154 Harnessthe Power of Big Data: The IBM Big Data Platform
Flash 6X9 / Harness the Power of Big Data:The IBM Big Data Platform / Zikopoulos / 817-5
•
HDFSFileSink Writes data from a stream to HDFS
•
HDFSFileSource Reads data from HDFS and writes it to a stream
•
HDFSSplit Splits a stream into multiple streams so that
HDFSParallelWriter can write data in parallel to the HDFS
•
HDFSDirectoryScan Scans an HDFS directory for new files and
writes the file names to a stream for use with HDFSFileSource
The AdvancedText AnalyticsToolkit:
Operators forText Analytics
The Advanced Text Analytics toolkit lets your applications take advantage of
the same powerful text analytics functions that you use with BigInsights. The
TextExtract operator uses an Annotated Query Language specification or
an analytics operator graph (AOG) file and processes incoming text docu-
ments that arrive as tuples. It then sends the results as tuples to downstream
operators. Many parameters, such as dictionaries, language, and tokenizers,
can be set. This toolkit is essential for analysis of social media in real time and
is a key part of the IBM Accelerator for Social Data Analytics discussed in
Chapter 9. Besides social media, Advanced Text Analytics is important for
use cases ranging from log analytics where log lines need to be parsed to
extract meaning to cyber security where message contents are analyzed as
part of deep packet inspection.
The Data MiningToolkit:
Operators for Scoring Data Mining Models
The Data Mining Toolkit has operators to score several different types of data
mining models in real time. Although data mining software such as SPSS
requires multiple passes over data to build models, scoring can often be done
on a record-by-record basis. The Data Mining Toolkit can score data mining
models that are defined by the Predictive Model Markup Language (PMML)
standard. This toolkit includes the following operators:
•
Classification Supports Decision Trees, Naïve Bayes, and
Logistic Regression algorithms that are used to classify tuples
•
Clustering Supports Demographic Clustering and Kohonen
Clustering algorithms that are used to assign tuples to a related group
06-ch06.indd 154 04/10/12 11:37 AM
186.
Real-Time Analytical Processingwith InfoSphere Streams 155
Flash 6X9 / Harness the Power of Big Data:The IBM Big Data Platform / Zikopoulos / 817-5
•
Regression Supports Linear Regression, Polynomial Regression,
and Transform Regression algorithms that are used for predictive
analytics
•
Associations Supports association rules for predicting cause-and-
effect relationships
In addition to scoring PMML models, Streams can score a wide range of
algorithms that are exported by the SPSS Modeler Solution Publisher.
Enterprise Class
Many real-time application and parallel processing environments built in the
past have come and gone. What makes Streams so different is its enterprise
class architecture and run-time environment, which are powerful and robust
enough to handle the most demanding streaming workloads; the rich tools
for building, managing, and deploying Streams applications; the hundreds
of built-in analytic operators and functions; and its integration with enter-
prise systems. This is the value that IBM and its research and development
arms bring to the Big Data problem. Although some companies have massive
IT budgets and try to do this themselves, wouldn’t it make sense to invest
that money in core competencies and the business?
Large, massively parallel jobs have unique availability requirements because
in a large cluster, there are bound to be failures. The good news is that Streams
has built-in availability characteristics that take this into account. Coupled
with the application monitoring that we describe elsewhere in this book,
Streams enables you to keep management costs low and the reputation of
your business high. Integration with the rest of your enterprise architecture
is essential to building a holistic solution. It’s a recurring theme of this book:
IBM offers a Big Data platform, not a Big Data product. In this section, we cover
some of the hardened enterprise aspects of Streams, including availability
and integration.
High Availability
When you configure your Streams platform, you specify which hosts (servers)
will be part of the Streams instance. You can specify three types of hosts, as
listed next, for each server in your platform.
06-ch06.indd 155 04/10/12 11:37 AM
187.
156 Harnessthe Power of Big Data: The IBM Big Data Platform
Flash 6X9 / Harness the Power of Big Data:The IBM Big Data Platform / Zikopoulos / 817-5
• Application host Runs SPL jobs.
• Management host Runs the management services that control the flow
of SPL jobs (but doesn’t explicitly run any SPL jobs directly), manages
security within the instance, monitors any running jobs, and so on.
• Mixed host Can run both SPL jobs and management tasks.
In a typical small environment, you would have one management host and
the remainder of your servers would be used as application hosts, but for
large deployments, management services can be distributed to more hosts.
When you build a streaming application, operators are compiled into one
or more processing elements (PEs). PEs can contain one or more operators,
which are often “fused” together inside a single PE for performance reasons.
A PE can be considered to be a unit of physical deployment in the Streams
product. PEs from the same application can run on multiple hosts in a
network, as well as communicate tuples across the network. In the event of a
PE failure, Streams automatically detects the failure and chooses from among
a large number of possible remedial actions. For example, if the PE is restart-
able and relocatable, the Streams run-time engine automatically picks an
available host on which to run the PE; starts the PE on that host; and auto-
matically “rewires” inputs and outputs to other PEs, as appropriate. How-
ever, if the PE continues to fail over and over again and exceeds a retry threshold
(perhaps due to a recurring underlying hardware issue), the PE is placed into a
stopped state and requires manual intervention to resolve the issue. If the
PE is restartable, but has been defined as not relocatable (for example, the PE
is a sink that requires it to be run on a specific host), the Streams run-time
engine automatically attempts to restart the PE on the same host, if it is avail-
able. Similarly, if a management host fails, you can have the management
function restarted elsewhere, assuming that you have configured the system
with RecoveryMode=ON. In this case, the recovery metadata has the neces-
sary information to restart the management tasks on another server in the
cluster.
Data processing is guaranteed in Streams when there are no host,
network, or PE failures. You might be wondering what happens to the data
in the event of one of these failures? When a PE (or its network or host) does
fail, the data in the PE’s buffers (and data that appears while a PE is being
restarted) can be lost without special precautions. With the most sensitive
06-ch06.indd 156 04/10/12 11:37 AM
188.
Real-Time Analytical Processingwith InfoSphere Streams 157
Flash 6X9 / Harness the Power of Big Data:The IBM Big Data Platform / Zikopoulos / 817-5
applications requiring very high performance, it is appropriate to deploy
two or more parallel instances of the streaming application on different
hardware—that way, if a PE in one instance of a graph fails, the other
parallel instance is already actively processing all of the data and can
continue while the failed graph is being restored. There are other strategies
that can be used, depending on the needs of the application. Streams is often
deployed in production environments in which the processing of every
single bit of data with high performance is essential, and these high-
availability strategies and mechanisms have been critical to successful
Streams deployments. The fact that Streams is hardened for enterprise
deployments helped one customer recover from a serious business emergency
that was caused by an electrical outage. (If only everything were as
reliable as Streams!)
Integration Is the Apex
of Enterprise Class Analysis
Another aspect of an enterprise class solution is how well it integrates into
your existing enterprise architecture. As we’ve discussed previously, Big
Data is not a replacement for your traditional systems; it’s there to augment
them. Coordinating your traditional and new age Big Data processes takes a
vendor who understands both sides of the equation. Streams already has
extensive high-speed connection capabilities into enterprise assets, such as
relational databases, in-memory databases, application server queues (such
as IBM WebSphere), and more. Although we delve into the details and nu-
ances of integration in a Big Data world in Chapter 11, let’s briefly touch on
some Streams-specific integration points in this section.
Streams has sink adapters that enable the high-speed delivery of streaming
data into BigInsights (through the BigInsights Toolkit for Streams) or directly
into your data warehouse for data-at-rest analysis. A new enhancement is the
ability to include Streams applications in ETL flows with IBM InfoSphere
DataStage (DataStage), and for Streams applications to move data to and
from DataStage. This integration enables DataStage to embed analytics in
flows, and Streams to access the specialized data sources and sinks that are
available through DataStage. Finally, Streams has the ability to incorporate
virtually any analytic flow from SPSS Modeler Solution Publisher into a
06-ch06.indd 157 04/10/12 11:37 AM
189.
158 Harnessthe Power of Big Data: The IBM Big Data Platform
Flash 6X9 / Harness the Power of Big Data:The IBM Big Data Platform / Zikopoulos / 817-5
Streams application, enabling rich analytics to be incorporated into real-time
applications.
As we mention throughout this book, Big Data problems require the anal-
ysis of data at rest and data in motion. The integration of Streams and BigIn-
sights offers a platform (not just products) for the analysis of data in real
time, as well as the analysis of vast amounts of data at rest for complex ana-
lytical workloads. IBM gives you the best of both worlds, and it is brought
together under one umbrella with considerations for security, enterprise
service-level agreement expectations, nationalization of the product and
support channels, enterprise performance expectations, and more.
Industry Use Cases for InfoSphere Streams
To give you some insight into how Streams technology can fit into your envi-
ronment, in this section we provide some industry use case examples that
expand on the examples in Chapter 2. Most of these examples are Big Data
platform examples, because they incorporate other components of the Big
Data platform along with Streams. Obviously, we can’t cover every industry
in such a short book, but we think this section will get you thinking and ex-
cited about the breadth of possibilities that Streams technology can offer
your environment.
Telecommunications
The quantity of call detail records (CDRs) that telecommunications compa-
nies have to manage is staggering. This information is not only useful for
providing accurate customer billing, but a wealth of information can be
gleaned from CDR analysis performed in near-real time. For example, CDR
analysis can help to prevent customer loss by analyzing the access patterns
of “group leaders” in their social networks. These group leaders are people
who might be in a position to affect the tendencies of their contacts to move
from one service provider to another. Through a combination of traditional
and social media analysis, Streams can help you to identify these individu-
als, the networks to which they belong, and on whom they have influence.
Streams can also be used to power up a real-time analytics processing
(RTAP) campaign management solution to help boost campaign effective-
ness, deliver a shorter time to market for new promotions and soft bundles,
06-ch06.indd 158 04/10/12 11:37 AM
190.
Real-Time Analytical Processingwith InfoSphere Streams 159
Flash 6X9 / Harness the Power of Big Data:The IBM Big Data Platform / Zikopoulos / 817-5
help to find new revenue streams, and enrich churn analysis. For example,
Globe Telecom leverages information gathered from its handsets to identify
the optimal service promotion for each customer and the best time to deliver
it, which has had profound effects on its business. Globe Telecom reduced
from 10 months to 40 days the time to market for new services, increased
sales significantly through real-time promotional engines, and more.
What’s good for CDRs can also be applied to Internet protocol detail records
(IPDRs). IPDRs provide information about Internet Protocol (IP)-based service
usage and other activities that can be used by operational support to deter-
mine the quality of the network and detect issues that might require mainte-
nance before they lead to a breakdown in network equipment. (Of course, this
same use case can be applied to CDRs.) Just how real-time and low-latency is
Streams when it comes to CDR and IPDR processing? In one example requiring
fewer than 10 servers, we have supported peak throughput rates of some detail
records equal to 500,000 per second, with more than 8 billion detail records
analyzed per day (yes, you read that rate right), or more than 5PB (5000TB) of
data per year. And all this while de-duplicating incoming records against seven
days of data (56 billion records) and reducing latency from 12 hours to a few
seconds (yes, that’s more than 10,000 times faster). Streams has sustained rates
of 10GB per second for network monitoring, and 100MB per second for X-ray
diffraction (XRD). One thing worth noting here, if these examples are too
modest for your environment, is that Streams is grid-scalable, so you can add
more capacity on the fly in an elastic manner. Truly, Streams is game-changing
technology.
Enforcement, Defense,
Surveillance, and Cyber Security
Streams provides a huge opportunity for improved law enforcement and
increased security, and offers unlimited potential when it comes to the kinds
of applications that can be built in this space, such as real-time situational
awareness applications, multimodal surveillance, cyber security detection,
legal wire taps, video surveillance, and face recognition. Corporations can
also leverage streaming analytics to detect and prevent cyber attacks by
streaming network logs and other system logs to stop intrusions or detect
malicious activity anywhere in their networks.
06-ch06.indd 159 04/10/12 11:37 AM
191.
160 Harnessthe Power of Big Data: The IBM Big Data Platform
Flash 6X9 / Harness the Power of Big Data:The IBM Big Data Platform / Zikopoulos / 817-5
TerraEchos uses Streams to provide covert sensor surveillance systems
that enable companies with sensitive facilities to detect intruders before they
even get near the buildings or other sensitive installations. They’ve been the
recipients of a number of awards for their technology (the Frost and Sullivan
Award for Innovative Product of the Year for their Fiber Optic Sensor System
Boarder Application, among others).
Financial Services Sector
The financial services sector (FSS) and its suboperations are a prime example
for which the analysis of streaming data can provide a competitive advantage
(as well as regulatory oversight, depending on your business). The ability to
analyze high volumes of trading and market data, at ultra-low latencies,
across multiple markets and countries simultaneously, offers companies the
microsecond reaction times that can make the difference between profit and
loss through arbitrage trading and book of business risk analysis. For example,
how does such a transaction occurring at this very moment add to the firm’s
risk position?
Streams is also used by FSS companies for real-time trade monitoring and
fraud detection. For example, Algo Trading supports average throughput
rates of about 12.7 million option market messages per second on a few serv-
ers and generates trade recommendations for its customers with a latency of
50 microseconds.
Streams provides direct connectivity through the ubiquitous Financial
Information eXchange (FIX) gateways with a function-rich library to help calcu-
late theoretical Put and Call option values. Streams can even leverage multiple
types of inputs. For example, FSS firms can leverage social media to under-
stand customers better when offering new services. Similarly, real-time fraud
detection can also be used by credit card companies and retailers to deliver
fraud detection and multiparty fraud detection (as well as to identify real-
time up-sell or cross-sell opportunities).
Health and Life Sciences
Healthcare equipment is designed to produce diagnostic data at a rapid rate.
From electrocardiograms, to devices that measure temperature and blood
pressure, to blood oxygen sensors, and much more, medical diagnostic
06-ch06.indd 160 04/10/12 11:37 AM
192.
Real-Time Analytical Processingwith InfoSphere Streams 161
Flash 6X9 / Harness the Power of Big Data:The IBM Big Data Platform / Zikopoulos / 817-5
equipment produces a vast array of data. Harnessing this data and analyzing
it in real time delivers benefits unlike any other industry. In addition to pro-
viding companies with a competitive advantage, Streams deployment in
healthcare is helping to save lives.
For example, the University of Ontario Institute of Technology (UOIT) is
building a smarter hospital in Toronto and leveraging Streams to deliver a
neonatal critical care unit that monitors the health of what we affectionately
call “data babies.” These babies continuously generate data: every heartbeat,
every breath, every anomaly helping to produce more than 1,000 pieces of
unique diagnostic information per second. Streams is used as an early warn-
ing system that helps doctors find new ways to avoid life-threatening infec-
tions up to 24 hours sooner than previously possible. There is synergism at
play here, too. It could be the case that a separately monitored stream falls
within normal parameters (blood pressure, heart rate, and so on); however,
the combination of several streams with some specific value ranges can turn
out to be a predictor of impending illness. Because Streams is performing
analytics on moving data instead of just looking for out-of-bound values, it
not only has the potential to save lives, but it also helps to drive down the
cost of healthcare.
And the Rest We Can’t Fit inThis Book …
We can’t possibly cover all of the use cases and industries that could benefit
from a potent product such as Streams, so we’ll cram in a couple more, with
fewer details, here in this section.
Government agencies can leverage the broad real-time analytics capabili-
ties of Streams to manage such things as wildfire risks through surveillance
and weather prediction, as well as water quality and water consumption
through real-time flow analysis. Several governments are also improving traf-
fic flow in some of their most congested cities by leveraging GPS data from
taxis, traffic flow cameras, and traffic sensors embedded in roadways. This
real-time analysis can help them to predict traffic patterns and adjust the tim-
ing of traffic lights to improve traffic flow.
The amount of data being generated in the utilities industry is growing at
an explosive rate. Smart meters and sensors throughout modern energy
grids are sending real-time information back to the utility companies at a
06-ch06.indd 161 04/10/12 11:37 AM
193.
162 Harnessthe Power of Big Data: The IBM Big Data Platform
Flash 6X9 / Harness the Power of Big Data:The IBM Big Data Platform / Zikopoulos / 817-5
staggering rate. The massive parallelism built into Streams enables this data
to be analyzed in real time, so that energy generators and distributors are
able to modify the capacity of their electrical grids based on the changing
demands of consumers. In addition, companies can include data on natural
systems (such as weather or water management data) in the analytics stream
to enable energy traders to predict consumption requirements and meet cli-
ent demand. This approach can deliver competitive advantages and maxi-
mize company profits.
Manufacturers want more responsive, accurate, and data-rich quality
records and quality process controls to better predict and avoid defined out-
of-tolerance events. E-science domains, such as weather prediction, detection
of transient events, and Synchrotron atomic research are other opportunities
for Streams.
From smarter grids, to text analysis, to “Who’s Talking to Whom?” analy-
sis, and more, Streams use cases are nearly limitless.
Wrapping It Up
In this chapter, we introduced you to the technical underpinnings behind
Streams. We talked about all the new enhancements in Streams 3.0 that make
it more consumable than ever before. With an easier up-and-running experi-
ence, guided task completion assistants, and round-trip editing through a
rich and agile IDE, building Streams applications is easier than ever. This is
a key point, because the consumability of Big Data technologies represents a
steep learning curve for most enterprise shops. The usability enhancements
in Streams 3.0 should come as no surprise, considering the impact of the
Streams Processing Language on Streams application development in the
Version 2.0 release.
The key value proposition of Streams is the ability to get analytics to the
frontier of the business—transforming the typical forecast into a nowcast.
This is a value proposition that few are even talking about in today’s Big
Data conversations, and even fewer can deliver. Streams is proven tech-
nology with multiple applications (as detailed in this chapter) that can help
transform your business to be a leader in the Big Data era, because you can
get the right answers and make better decisions faster than others in your
industry.
06-ch06.indd 162 04/10/12 11:37 AM
194.
Flash 6X9 /Harness the Power of Big Data:The IBM Big Data Platform / Zikopoulos / 817-5
163
Part IV
Unlocking Big Data
07-ch07.indd 163 04/10/12 11:39 AM
195.
Flash 6X9 /Harness the Power of Big Data:The IBM Big Data Platform / Zikopoulos / 817-5
00-FM.indd 16 04/10/12 12:19 PM
This page intentionally left blank
196.
Flash 6X9 /Harness the Power of Big Data:The IBM Big Data Platform / Zikopoulos / 817-5
165
7
If Data Is the New Oil—You
Need Data Exploration and
Discovery
Vivisimo! Say it with us—use an Italian inflection while waving your
hands for emphasis—as though you just ate the best-tasting piece of authentic
pizza in your life! In April, 2012, we were saying this with gusto when IBM
announced the acquisition of Vivisimo, a software company specializing in
the indexing, searching, and navigation of data from multiple data sources.
One of the biggest challenges in business analytics today is that organiza-
tions store their data in distinct silos. We do this because it makes sense: for
example, we keep our transactional data in online transaction processing
(OLTP) databases, our email in Lotus Domino or Microsoft Exchange
servers, and our call center engagement logs in customer relationship manage-
ment (CRM) repositories such as SugarCRM. Each repository has specific
availability requirements, security settings, service-level agreements (SLAs),
and associated applications. But when it comes to building a complete view
of all the relevant data for a particular customer from every data source in
your organization, you’re out of luck. The infrastructure that makes your
silos effective tools for their designed purposes also makes them difficult to
integrate. After all, you don’t look at a picture by zooming in to 250 percent
and examining one spot—unless, of course, you are editing it. There’s huge
07-ch07.indd 165 04/10/12 11:39 AM
197.
166 Harnessthe Power of Big Data: The IBM Big Data Platform
Flash 6X9 / Harness the Power of Big Data:The IBM Big Data Platform / Zikopoulos / 817-5
value in zooming out and seeing the full picture, which you can only do by
pulling in data from many sources.
IBM InfoSphere Data Explorer (formerly known as Vivisimo Velocity Plat-
form—for the remainder of this chapter, we’ll call this Data Explorer for
short) represents a critical component in the IBM Big Data platform. Data
Explorer technology enables users to access all of the data that they need in a
single integrated view, regardless of its format, how it’s managed, or where
it’s stored. Being able to retrieve data from all available repositories in an
organization is a key part of doing analysis involving Big Data, especially for
exploratory analysis. (We talked about this in Chapter 3—search and discov-
ery is listed as one of IBM’s five strategic ways to get started with Big Data.)
Data Explorer includes a framework to easily develop business applications,
called Application Builder. The customizable web-based dashboards you can
build with Application Builder provide user and context-specific interfaces
into the many different data sources that Data Explorer can crawl and index.
Data Explorer makes searching across your Big Data assets more accurate.
The underlying indexes are smaller (compressed), don’t need to be main-
tained as often as other solutions, and you can request more granular index
updates instead of having to update everything. The efficient index size,
coupled with the ability to dynamically expand the number of index servers
makes this a highly scalable index and search solution. Data Explorer also
includes a powerful security framework that enables users to only view docu-
ments that they are authorized to view based on their security profiles in the
data’s originating content management systems.
Data Explorer is a productivity boost for your organization at a time when it
needs it the most: the dawn of the Big Data era. This technology has helped a
large number of our clients unlock the value of Big Data by providing a number
of techniques to locate, secure, and personalize the retrieval of business data.
Consider today’s jumbo jet airplanes—typically each plane has support staff
that are dedicated to it for years—like it’s one of their children. In the same
manner you get calls from the principal’s office when your kid is sick (or in
trouble), if something goes wrong with a specific airplane, a call goes out to its
“parents.” Now think about the last time you sat in a plane sitting at the gate
for an extended period of time because there was a mechanical problem (some-
thing the authors of this book can relate to all too often). The airline calls that
specific plane’s support team. The worst thing an airline can do is keep that
07-ch07.indd 166 04/10/12 11:39 AM
198.
If Data Isthe New Oil—You Need Data Exploration and Discovery 167
Flash 6X9 / Harness the Power of Big Data:The IBM Big Data Platform / Zikopoulos / 817-5
plane at the gate—it amounts to thousands of dollars lost per minute. In this
scenario, a call comes in from the bridge to the customer support team who has
to scramble to resolve whatever the problem could be. Of course, that plane is
like a customer—it has a profile, a past, and so on. Time is money—in this case,
airport fees, waiting fees, customer satisfaction, and other costs mount while
the clock is ticking, and it’s all adding up. One large airplane manufacturer
IBM worked with had information locked away in separate systems, making it
nearly impossible for support teams to access all of their knowledge reposito-
ries, each with a different security schema (data was in SAP, FileNet, Content
Manager, Siebel, file shares, and more). Using Data Explorer, this large airplane
manufacturer was able to build a single point of access to all of their reposito-
ries with seamless and more granular security controls on the data. A common
back-end infrastructure was used to service multiple front-end applications for
data retrieval. The support teams got such an injection of productivity from
being able to “zoom in” and “zoom out” on the scope of the problem at hand,
that the number of personnel that were needed to support an aircraft decreased.
This allowed the client to realize better revenue yields as new planes could be
staffed with existing teams, as opposed to hiring new staff for new plane deliv-
eries. In the end, they were able to reduce help-desk resolution latencies by
70 percent, which ultimately resulted in multimillion dollars in savings and
downstream customer satisfaction, all with Data Explorer.
Indexing Data from Multiple Sources
with InfoSphere Data Explorer
Data Explorer is a search platform that can index data from multiple data
sources, and that provides a single search interface, giving users the ability to
see all of the relevant data in their organization and beyond. Although Data
Explorer handles the indexing and searching, the data itself remains in the
original data sources. (This ship function to data paradigm is one of the prin-
ciples behind Hadoop as well.) Figure 7-1 shows the architectural layout of
the main components of Data Explorer.
Connector Framework
When developing your search strategy, you first determine which data sources
you need to access. Data Explorer makes this easy by including a Connector
Framework that supports over 30 commonly used data sources, including
07-ch07.indd 167 04/10/12 11:39 AM
199.
168 Harnessthe Power of Big Data: The IBM Big Data Platform
Flash 6X9 / Harness the Power of Big Data:The IBM Big Data Platform / Zikopoulos / 817-5
content management repositories, CRM systems, wikis, email archives, supply
chain management stores, and more. There are also connectors to InfoSphere
Streams and InfoSphere BigInsights, showing the deep integration of its com-
ponents in the IBM Big Data platform. If you have a data source for which a
connector doesn’t exist, don’t worry; Data Explorer also includes a mature
framework for building additional connectors to proprietary data sources.
The Connector Framework taps into supported data sources to process
data for indexing. We want to clearly state that Data Explorer doesn’t manage
information in the data sources; it just maintains an index of the available
content for searching, navigation, and visualization.
Figure 7-1 Data Explorer architecture
Application
User Profiles
Text Analytics Search Engine
Processing Layer
Connector Framework
InfoSphere
BigInsights
or Hadoop
RDBMS Feeds Web 2.0 Email Streams CRM
ERP
File Systems
Faceting
Tagging
Taxonomy
Collaboration
Thesaurus
Clustering
Ontology Support
Semantic Processing
Entity Extraction
Relavancy
Authentication/
Authorization
Query Transformation
Personalization
Display
Indexing
Converting
Crawling
Metadata
External Sources
Subscriptions
Feeds
Web Results
Other Apps
Application
Application
Framework
User Management Layer
Application
07-ch07.indd 168 04/10/12 11:39 AM
200.
If Data Isthe New Oil—You Need Data Exploration and Discovery 169
Flash 6X9 / Harness the Power of Big Data:The IBM Big Data Platform / Zikopoulos / 817-5
There are many instances where people depend on data stores, such as
web repositories, outside of their organization. You can use Data Explorer to
add these remote sources to the unified search environment you’ve built for
your internal sources as well. Data Explorer doesn’t index these remote sites,
but interfaces with the remote site’s search engine to pass queries to them. It
then receives result sets, interprets them, and presents them to end users
alongside data from local sources.
A sophisticated security model enables Data Explorer to map the access
permissions of each indexed data element according to the permissions
maintained in the repository where it’s managed, and to enforce these per-
missions when users access the data. This security model extends to the field
level of individual documents, so that passages or fields within a document
can be protected with their own permissions and updated without having to
re-index the full document. As such, users only see data that would be visible
to them if they were directly signed in to the target repository. For example,
if a content management system’s field-level security governs access to an
Estimated Earnings report, it might grant a specific user access to the Execu-
tive Summary section, but not to the financial details such as pre-tax income
(PTI), and so on. Quite simply, if you can’t see the data without Data Explorer,
you won’t be able to see the data with Data Explorer.
Data Explorer connectors detect when data in the target data source is added
or changed. Through these connectors, the Connector Framework ensures that
the indexes reflect an up-to-date view of information in target systems.
The Data Explorer Processing Layer
The Data Explorer Processing Layer serves two purposes, each reflecting a
distinct stage: indexing content as it becomes available and processing search
queries from users and applications. At the beginning of this workflow, the
Connector Framework makes data from each repository available to be
crawled. As the data is parsed, it is transformed and processed using a
number of different analytic tools, including entity extraction, tagging, and
extraction of metadata for faceted navigation. Throughout this data-crunching
stage, the processing layer maintains an index for the content from
connected data sources. If your enterprise has existing information that
describes your data sets, such as taxonomies, ontologies, and other knowl-
edge representation standards, this information can also be factored into the
index that Data Explorer builds.
07-ch07.indd 169 04/10/12 11:39 AM
201.
170 Harnessthe Power of Big Data: The IBM Big Data Platform
Flash 6X9 / Harness the Power of Big Data:The IBM Big Data Platform / Zikopoulos / 817-5
Security information that is received from target data sources is ingested
by the Processing Layer and also included in the indexes that Data Explorer
builds for each target data source. This enables the granular role-based secu-
rity capabilities that we described earlier, ensuring that users receive only the
information that they are authorized to view, based on their security permis-
sions with each target data source.
Like the other main components of the IBM Big Data platform, Data Explorer
is designed to handle extremely high volumes of data by scaling out its foot-
print to large numbers of servers. It’s been used in production settings to
index trillions of records and petabytes of data.
From a high-availability perspective, the Data Explorer servers feature
master-master replication, and failover capability. Whenever a server is taken
offline, all search and ingestion traffic is redirected to the remaining live server.
When the original server is put back online, each of its collections auto-
matically synchronizes with a peer. If a collection has been corrupted, it is
automatically restored. For planned outages, Data Explorer servers can be
upgraded, replaced, or taken out of the configuration without any interrup-
tion of service (indexing or searching).
The Secret Sauce: Positional Indexes
An index is at the core of any search system and is a leading factor in query
performance. In Big Data implementations, differences in index structure,
size, management, and other characteristics are magnified because of the
higher scale and increased data complexity. Data Explorer has a distinct
advantage because it features a unique positional index structure that is more
compact and versatile than other search solutions on the market today.
To truly appreciate why a positional index makes Data Explorer a superior
enterprise search platform, you need to understand the limitations of con-
ventional indexes, known as vector space indexes (see Figure 7-2).
When text is indexed using the vector space approach, all of the extracted
terms are weighted according to their frequency within the document
(weight is positively correlated with frequency). At query time, this weight-
ing is also influenced by the uniqueness of the search term in relation to the
full set of documents (weight is negatively correlated with the number of
occurrences across the full set of documents—quite simply, if a word doesn’t
occur often, it’s “special.”) This balance between frequency and uniqueness
07-ch07.indd 170 04/10/12 11:39 AM
202.
If Data Isthe New Oil—You Need Data Exploration and Discovery 171
Flash 6X9 / Harness the Power of Big Data:The IBM Big Data Platform / Zikopoulos / 817-5
is important, so that frequently used terms like “the,” which can occur often
in individual documents—but also occur often in a whole set of documents—
don’t skew search results. Results from a complete set of documents are used
to build an inverted index, which maps each term and its weight to locations
of the term in the documents. When queries are issued against a search
engine using a vector space index, a similar vector is calculated using just the
terms in the search query. The documents whose vectors most closely match
the search term’s vectors are included in the top-ranked search results.
There are a number of limitations with the vector space approach, most of
which stem from the fact that after a document has been reduced to a vector,
it’s impossible to reconstruct the full document flow. For example, it’s impos-
sible to consider portions of a document as separate units, and the only clues
provided about such documents are the frequency and uniqueness of their
indexed terms.
Big Data and modern search applications require more than just informa-
tion about term frequency and uniqueness. Positioning information is
required to efficiently perform phrase or proximity searches, to use proximity
as a ranking factor, or to generate dynamic summaries. So, when keeping
track of document positions (for example, the proximity of multiple search
terms within a document), it’s necessary for conventional index solutions to
create a structure in addition to their vector space index—usually a docu-
ment-specific positional space index. Of course, as with most things in life,
nothing is free: this additional index comes at a cost as it takes more time to
index documents, and the resulting index requires a significantly larger vol-
ume footprint.
As we mentioned earlier, Data Explorer also uses a positional space
index—but the difference here is that there is no underlying vector space index.
The positional space index is more compact than the traditional vector space
1. Documents 2. Tokens 3. Vectors 4. Inverted Index
4
1 ›4, 4 ›7, 5 ›10, ...
1 ›4, 2 ›7, 3 ›10, ...
1 ›2, 2 ›1, 5 ›3, ...
10 ›4, 11 ›7, 12 ›1 ...
3 ›1, 7 ›2
2 ›4, 3 ›2, 6 ›10, ...
3
9
1
7
4
Figure 7-2 A vector space index
07-ch07.indd 171 04/10/12 11:39 AM
203.
172 Harnessthe Power of Big Data: The IBM Big Data Platform
Flash 6X9 / Harness the Power of Big Data:The IBM Big Data Platform / Zikopoulos / 817-5
indexes, because Data Explorer uses just one efficient structure rather than
two less efficient document-based structures. In a positional space index (see
Figure 7-3), a document is represented as a set of tokens, each of which has a
start and end position. A token can be a single word or a content range (for
example, a title, or an author’s name). When a user submits a query, the
search terms match a passage of tokens, instead of a whole document. Data
Explorer doesn’t compute a vector representation, but instead keeps all posi-
tioning information directly in its index. This representation enables a complete
rebuilding of the source documents, as well as the manipulation of any
subparts.
In Big Data deployments, index size can be a major concern because of the
volume of the data being indexed. Many search platforms, especially those
with vector space indexing schemes, produce indexes that can be 1.5 times
the original data size. Data Explorer’s efficient positional index structure
produces a compact index, which is compressed, resulting in index sizes that
are among the smallest in the industry. In addition, unlike vector space
indexes, the positional space indexes don’t grow when data changes; they
only increase in size when new data is added.
Another benefit of positional space indexes is field-level updating, in
which modifications to a single field or record in a document cause only the
modified text to be re-indexed. With vector space indexes, the entire document
needs to be re-indexed. This removes excessive indexing loads in systems with
frequent updates, and makes small, but often important, changes available to
users and applications in near-real time.
The concept of field-level security, which is related to field-level updates,
is particularly useful for intelligence applications, because it enables a single
classified document to contain different levels of classification. Data Explorer
1. Content 2. Tokens
3. Positional
Inverted Index
1.1 ›4, 1.4 ›2, 3.2 ›3, ...
1.5 4, 2.6 ›7, 3.3 ›10, ...
1.3 ›2, 2.3 ›1, 5.6 ›3, ...
10.1 ›4, 11.5 ›7, ...
3.7 ›1, 7.5 ›2
2.1 4, 3.7 ›2, 3.9 ›10, ...
Figure 7-3 A positional space index
07-ch07.indd 172 04/10/12 11:39 AM
204.
If Data Isthe New Oil—You Need Data Exploration and Discovery 173
Flash 6X9 / Harness the Power of Big Data:The IBM Big Data Platform / Zikopoulos / 817-5
can apply security to segments of text within a document, including fields. A
given document, although indexed only once, can appear differently to dif-
ferent groups of users based on their security settings (think back to the busi-
ness plan example earlier in this chapter). Such security settings are not pos-
sible with vector space indexing, because users either have access to the
whole document or to none at all, limiting an organization’s flexibility in
sharing information across the enterprise.
Index Auditing
For Big Data applications that require detailed auditing and accounting, the
ingestion of data into indexes can be fully audited through Data Explorer’s
audit-log function. Data Explorer generates an audit-log entry for each piece
of content being sent for indexing. The log entry is guaranteed to contain all
of the errors and warnings that were encountered during crawling and
indexing. Using the audit log, Data Explorer deployments can ensure that
100 percent of the content is always accounted for: each item is either
indexed or has triggered an error that was reported to the administrator.
Such content-completeness audits are a key requirement for many legal and
compliance discovery applications.
User Management Layer
The User Management Layer includes all of the resources that users and
applications need in order to interact with data that’s indexed by Data Ex-
plorer. Most importantly, this includes an interface to the Data Explorer
search engine, which handles all of the data requests from connected sources.
Before querying any data, users must authenticate. The user’s identity and
group affiliations for each repository that has been indexed are stored in
user profiles or accessed at login time from a directory service. (We’ll note
that if you are using LDAP or Active Directory services, this information is
automatically retrieved.) After they are logged in, users can have a person-
alized interface that reflects their profile.
This layer also contains Data Explorer’s ability to federate queries to exter-
nal sources that are not natively indexed by Data Explorer, such as premium
subscription-based information services on the Internet. The results can be
merged with native Data Explorer results to create an enriched and expanded
view of relevant information.
07-ch07.indd 173 04/10/12 11:39 AM
205.
174 Harnessthe Power of Big Data: The IBM Big Data Platform
Flash 6X9 / Harness the Power of Big Data:The IBM Big Data Platform / Zikopoulos / 817-5
Data Explorer gives end users the ability to comment, tag, and rate con-
tent, as well as to create shared folders for content that they want to share
with other users. All of this user feedback and social content is then fed back
into Data Explorer’s relevance analytics to ensure that the most valuable con-
tent is presented to users. Users can also comment on their search results. The
comments are field-security protected, and can be created or viewed only if
the user has the proper permissions. In addition, users with the appropriate
permissions can save results into folders, and those folders can be personal,
shared at the group level, or shared across the enterprise. This makes for a
powerful collaboration environment, where users’ profiles can be returned
in search results, based on their activities. Suppose a user named Anna adds
comments and tags including the word “Hadoop” to various documents. Any
search queries including the term “Hadoop” will then return Anna’s user profile,
even if there is no mention of Hadoop in her profile data and job description.
Beefing Up InfoSphere BigInsights
Because Data Explorer is now an integrated component of the IBM Big Data
platform, its enterprise-scale indexing and search capabilities also apply to
InfoSphere BigInsights (BigInsights). While the Hadoop technologies upon
which BigInsights is built have tremendous power to run complex workloads
against large volumes of structured and unstructured data, there are use cases
for which Hadoop is not a practical solution. The Hadoop Distributed File
System (HDFS) is designed for large-scale batch operations that run against
most or all of the information in a data set. However, queries involving small
subsets of data in HDFS perform poorly. By indexing content stored in HDFS,
Data Explorer offers a way to address the need for rapid response times without
compromising the strengths of BigInsights.
Moreover, the ability to extract, recognize, and leverage metadata can greatly
enhance search precision, usability, and relevance. In fact, search can add struc-
ture to unstructured content by recognizing entities and other important terms
in natural language text. Data Explorer adds semantic capabilities, such as cat-
egorization, clustering, and faceted navigation, enabling you to browse search
results by topic, or to navigate to a single result without ever typing a query.
07-ch07.indd 174 04/10/12 11:39 AM
206.
If Data Isthe New Oil—You Need Data Exploration and Discovery 175
Flash 6X9 / Harness the Power of Big Data:The IBM Big Data Platform / Zikopoulos / 817-5
An App with a View: Creating Information
Dashboards with InfoSphere Data Explorer
Application Builder
In any medium-to-large-sized organization, there are multiple repositories
for business data, and employees invariably spend vast amounts of time
searching for information. This is especially the case for many customer-
facing roles, such as sales or product support, in which people depend heav-
ily on many systems that contain critical business information, such as CRM
data, product knowledge, and market data.
Data Explorer includes a compelling tool: theApplication Builder application
framework.Application Builder enables you to build a multifunction dashboard
for the many relevant data sources that your employees need to access. While
Data Explorer provides the raw power to index many disparate data sources and
efficiently handle queries, you can use Application Builder to create front-end
dashboards that can be an interface for presenting all this information. Figure 7-4
shows the architecture of Application Builder and Data Explorer working
together.All of the powerful features of Data Explorer, such as its high-performing
search and the preservation of user-specific access to data, are harnessed in
Application Builder.
The options available for Application Builder applications are boundless.
For example, you can federate Internet-based data sources to pull in news
feeds, or stream financial data from securities markets or social media data
sources like Twitter. The social capabilities from Data Explorer also work
here: Users can collaborate through collective data tagging efforts, and share
knowledge through comments and recommendations that are applied to
data stored in sources aggregated by Application Builder.
Application Builder integrates with BigInsights and InfoSphere Streams
(Streams). BigInsights and Streams can both feed data to Data Explorer,
which can then syndicate it to Application Builder users. Alternatively,
Application Builder can consume data directly from BigInsights or Streams.
For example, a Streams feed can be surfaced as a live data source inApplication
Builder. In addition to hosting content that is customized for its users,
Application Builder provides Data Explorer search interfaces. For example,
the faceted search, clustered search, and recommendation engines can all be
surfaced in Application Builder.
07-ch07.indd 175 04/10/12 11:39 AM
207.
176 Harnessthe Power of Big Data: The IBM Big Data Platform
Flash 6X9 / Harness the Power of Big Data:The IBM Big Data Platform / Zikopoulos / 817-5
The dashboards you create with Application Builder aren’t just about
pulling in data from different sources. The real power comes from the defini-
tion of entity-relationship linkages between your users and the available
data sets in Data Explorer. With this, your dashboards can provide informa-
tion from all these data sources that are relevant to your users, without need-
ing them to search for it. For example, your support personnel can have
dashboards tailored to show data relevant to their own customers’ accounts,
such as their purchase history, open support tickets, and order status. This
can also include data from external sources, such as news feeds relevant to
the customer, or their stock price.
In short, Application Builder enables you to create custom mashups
of content your employees need, where the search tools provide a mashup of
content from multiple sources. The beauty of this architecture is that not only
do users now have unified access to information across their business—in
Native
Repositories
Crawler
Indexer
Application Framework (CXO)
UI
User
...
...
Collection
Query Time
Indexing Time
Collection
Connector
Crawling
State
Native API Updates
Content/Records/
Document Mgmt RDBMS Feeds Web 2.0 Email Web CRM
ERP
File Systems
Connector
Crawling
State
Connector
Crawling
State
Figure 7-4 The Application Builder architecture
07-ch07.indd 176 04/10/12 11:39 AM
208.
If Data Isthe New Oil—You Need Data Exploration and Discovery 177
Flash 6X9 / Harness the Power of Big Data:The IBM Big Data Platform / Zikopoulos / 817-5
many cases they don’t even need to search for it, as this technology “connects
the dots” and brings relevant information to your users automatically.
Wrapping It Up:
Data Explorer Unlocks Big Data
Data Explorer helps organizations unlock and optimize the true business
value of all their information, regardless of application or source. It provides
industry-leading Big Data indexing and search techniques and includes a rich
interface that enables you to easily build and expose personalized dashboards
to end-user communities. Data Explorer was designed from the inside out
for the Big Data era, with its positional indexing technology, granular secu-
rity lockdown, and more. And with Data Explorer’s connectivity framework,
data can stay in the silos where it’s managed, while data scientists, researchers,
and business users can focus on asking the key questions.
In the Big Data world, it’s even more important than ever to have power-
ful, accurate, agile, and flexible search across all of your data assets, because
that data is in new shapes and sizes, in larger amounts than ever before, and
arriving on your doorstep faster than ever. In our experiences, many large
organizations are guilty of not knowing what they could already know—
they have mountains of data assets, but they aren’t holistically linked to
users—leaving them to scramble and “get lucky” when searching. Data
Explorer is an inflection point—it’s great news for any organization needing to
unlock information trapped in silos. You’ll want to be saying it too! Vivisimo!
07-ch07.indd 177 04/10/12 11:39 AM
209.
Flash 6X9 /Harness the Power of Big Data:The IBM Big Data Platform / Zikopoulos / 817-5
00-FM.indd 16 04/10/12 12:19 PM
This page intentionally left blank
210.
Flash 6X9 /Harness the Power of Big Data:The IBM Big Data Platform / Zikopoulos / 817-5
179
Part V
Big Data Analytic
Accelerators
08-ch08.indd 179 03/10/12 7:02 PM
211.
Flash 6X9 /Harness the Power of Big Data:The IBM Big Data Platform / Zikopoulos / 817-5
00-FM.indd 16 04/10/12 12:19 PM
This page intentionally left blank
212.
Flash 6X9 /Harness the Power of Big Data:The IBM Big Data Platform / Zikopoulos / 817-5
181
8
Differentiate Yourself with
Text Analytics
Although Big Data classifications often fall into the structured, semis-
tructured, and unstructured buckets, we want to put forward the notion
that all data has some kind of structure (taking a picture with your smart-
phone is likely to tag it with location awareness, a timestamp, metadata as
to its format and size, and so on. References to these varying degrees of
structure speak to the relative ease with which the data can be analyzed
and interpreted; the less structured it is, typically the more effort required
to extract insights. For example, a Facebook posting is structured data—it’s
wrapped in the Java Script Object Notation (JSON) format. However, it’s
the free-form text within the structure’s notation that’s the unstructured
part—and the hardest part of the data set to analyze. We’ve gotten very
good at analyzing information in our databases, but that data has been
cleansed and distilled into a highly structured form. Where businesses are
finding enormous challenges today is in analyzing data that’s not so nicely for-
matted, such as emails, legal documents, social media messages, and log files.
As organizations increasingly rely on information that’s locked in various
forms of textual data, it’s critical that they’re provided with a framework
that not only helps them make sense of what’s in this text, but also helps
them do it in a cost-effective (think non highly specialized skill sets) and
relatively quick manner.
There are many problem domains characterized by unstructured and
semistructured data. One area in which we think that text analysis can be a
08-ch08.indd 181 03/10/12 7:02 PM
213.
182 Harnessthe Power of Big Data: The IBM Big Data Platform
Flash 6X9 / Harness the Power of Big Data:The IBM Big Data Platform / Zikopoulos / 817-5
game changer is in fraud detection. To understand the complete story around
transactions like securities trading, insurance claims, or mortgage applica-
tions, all of the data surrounding these transactions needs to be analyzed. In
addition to relational data, this invariably includes raw text (from emails or
text fields in forms) and semistructured data (from log files).
Data redaction is another area in which a text analytics platform greatly
enhances the capability of the discipline. A great deal of data being stored
today includes personally identifiable information (PII), which in many
countries must be adequately governed to protect citizens’ privacy. To ensure
regulatory compliance, this data (for example, from forms, records, or legal
documents) must be redacted to hide key elements, which would otherwise
reveal people’s identities. In fact, the IBM InfoSphere Guardium Data Redac-
tion product uses the text analytics technology that’s core to the IBM Big
Data platform for this exact purpose.
For business-to-consumer–oriented companies, especially within the ser-
vice industries, having a complete picture of an individual customer’s account
is essential—this is the domain of customer relationship management (CRM)
analytics. Many valuable activities, such as targeted marketing and customer
churn prediction, depend on understanding a customer’s behavior, and because
this involves not only their transactional history, but also transcriptions of their
call center interactions, and even clickstream logs of their visits to the corporate
web presence, text analytics are required to find “that next gear.”
Text analytics can boost a Big Data project in a very obvious way in the
area of social media analytics. With the advent of online communities such as
Facebook, and micro-blogging services such as Twitter, people are publicly
expressing their personal feelings on a scale we’ve never seen before. Businesses
could gain a greater understanding of individual customers by understanding
not just what they’re saying in social media, but why they are saying it, too. In
addition, knowing what groups of people are saying on social media can
revolutionize how marketers assess the reach of and response to their
campaigns.
While it’s obvious that people quickly envision sentiment use cases when
they hear the phrase “text analytics,” we want to make very certain that you
understand it’s so much more; from piracy detection, sentiment analysis,
investment research, and more, a Big Data platform requires a sound text
analytics ecosystem.
08-ch08.indd 182 03/10/12 7:02 PM
214.
DifferentiateYourself withText Analytics 183
Flash 6X9 / Harness the Power of Big Data:The IBM Big Data Platform / Zikopoulos / 817-5
What IsText Analysis?
For each of the example scenarios we just mentioned, the challenge is to parse
the text, find the elements that are being searched for, understand their meaning,
and extract them in a structured form for use in other applications. IBM has a lot
of experience in this area, and we’ve personally seen a lot of organizations try
to get started on their own. Because of this, we can tell you that it’s no easy
task—you need a toolkit with accelerators, an integrated development environ-
ment (IDE), and preferably a declarative language to make this consumable
and reachable for most organizations. After all, you can’t democratize Big Data
across your organization if the analysis solely depends on near impossible to
find or learn skill sets. Beyond the fact that text data is unstructured, languages
are complex—even when you don’t factor in spelling mistakes, abbreviations, or
advanced usage, such as sarcasm. As such, you need a system that is deep and
flexible enough to handle complexity.
What follows is an example of this process, in which a text analysis ap-
plication reads a paragraph of text and derives structured information based
on various rules. These rules are defined in extractors, which can, for instance,
identify an entity’s name within a text field. Consider the following text:
In the 2012 UEFA European Football Championship, Spain
continued their international success, beating Italy 4-0
in the Final. Spanish winger David Silva opened the scor-
ing early in the game, beating Italian goalie Gianluigi
Buffon. After a full 90 minutes of dominance, goalkeeper
Iker Casillas accepted the championship trophy for Spain.
The product of these extractors is a set of annotated text, as shown in the
underlined text in this passage. The following structured data is derived
from this example text:
Name Position Country
David Silva Winger Spain
Gianluigi Buffon Goalkeeper Italy
Iker Casillas Goalkeeper Spain
The challenge is to ensure the accuracy of results. Accuracy has two compo-
nents, precision and recall:
• Precision A measure of exactness, the percentage of items in the result
set that are relevant: “Are the results you’re getting valid?” For example,
if you wanted to extract all the play-by-play descriptions associated with
08-ch08.indd 183 03/10/12 7:02 PM
215.
184 Harnessthe Power of Big Data: The IBM Big Data Platform
Flash 6X9 / Harness the Power of Big Data:The IBM Big Data Platform / Zikopoulos / 817-5
goals scored from the UEFA Championships transcripts, and 30 of the 76
passages identified as goal commentaries weren’t for goals at all, your
precision would be just under 60 percent. In summary, precision describes
how many passages identified are correctly identified.
• Recall A measure of completeness, the percentage of relevant results
that are retrieved from the text; in other words, are all the valid strings
from the original text showing up? For example, if you wanted to extract
all of the goals scored in the UEFA Championships from video, and got
60 out of 76 that would be found by a human expert, your recall would
be about 79 percent, because your application missed 21 percent of goals
scored. In summary, recall is how many matching passages are found
out of the total number of matching passages.
As analysts develop their extractors and applications, they iteratively
make refinements to tune their precision and recall rates. A great analogy is
an avalanche. If the avalanche didn’t pick up speed and more snow as it tum-
bles down a mountain slope, it wouldn’t have much impact. The develop-
ment of extractors is really about adding more rules and knowledge to the
extractor itself; in short, it’s about getting more powerful with each iteration.
We’ve found that most marketplace approaches to text analytics present
challenges for analysts, because they tend to perform poorly (in terms of both
accuracy and speed) and they are difficult to build or modify. These approaches
flow the text forward through a system of extractors and filters, with no
optimization. This technique is inflexible and inefficient, often resulting in
redundant processing, because extractors applied later in the workflow
might do work that had already been completed earlier. From what we can
tell, today’s text toolkits are not only inflexible and inefficient, they’re also
limited in their expressiveness (specifically, the degree of granularity that’s
possible with their queries), which results in analysts having to develop cus-
tom code. This, in turn, leads to more delays, complexity, and difficulty in
refining the accuracy of your result set (precision and recall).
The Annotated Query Language
to the Rescue!
To meet these challenges, the IBM Big Data platform provides the Advanced
Text Analytics Toolkit, especially designed to deal with the challenges inher-
ent in Big Data. This toolkit (originally code-named SystemT) has been under
08-ch08.indd 184 03/10/12 7:02 PM
216.
DifferentiateYourself withText Analytics 185
Flash 6X9 / Harness the Power of Big Data:The IBM Big Data Platform / Zikopoulos / 817-5
continual development since 2004, and its engine has shipped with many
IBM products, including Lotus Notes, Cognos Consumer Insight, and more.
IBM InfoSphereBigInsights(BigInsights)andIBMInfoSphereStreams(Streams)
break new ground by including the SystemT technology in the Advanced Text
Analytics Toolkit (and associated accelerators), which opens up this once “black
box” technology for customization and more general purpose use than when it
was delivered as function within a product. This toolkit includes a declarative
language—Annotated Query Language (AQL)—with an associated cost-
based optimizer, an IDE to write rules, a text analytics processing engine
(ready for MapReduce and streaming data settings), and a number of built-in
text extractors that include hundreds of rules pre-developed through IBM’s
customer engagements across a myriad of industries. The Advanced Text
Analytics Toolkit also contains multilingual support, including support for
double-byte character languages (through Unicode). By providing an opti-
mizer, an AQL assistance framework, and debugging tools, you can see how
the Advanced Text Analytics Toolkit is poised to democratize the ability to
perform analysis on unstructured data in the same way that SQL has for
database queries.
What’s special about the Advanced Text Analytics Toolkit is its approach
to text extraction: to ensure high accuracy (precision) and full coverage
(recall), the solution builds many specific rules. This concept is built into
AQL and its run-time engine, which form the heart of the Advanced Text
Analytics Toolkit. AQL enables you to aggregate these many rules to repre-
sent an individual extractor. For example, an extractor for telephone num-
bers can contain literally hundreds of rules to match the many ways that
people around the world express this concept. In addition, AQL is a fully
declarative language, which means that all these overlapping rules get
distilled and optimized into a highly efficient access path (similar to an SQL
compiler for relational databases, where IBM researchers first developed this
declarative concept), while the complexity of the underlying system is
abstracted from the end user. Quite simply, when you write extraction logic
in AQL, you tell the IBM Big Data platform what to extract, and the platform
figures out how to extract it. This is an important differentiator of the IBM Big
Data platform. The use of declarative languages (for example, AQL, the
Streams Processing Language, and the machine learning statistical language)
not only has significant performance benefits when this analytics code gets
08-ch08.indd 185 03/10/12 7:02 PM
217.
186 Harnessthe Power of Big Data: The IBM Big Data Platform
Flash 6X9 / Harness the Power of Big Data:The IBM Big Data Platform / Zikopoulos / 817-5
optimized, but it also hides the complexity of Hadoop from analysts. Notice
that we referenced a number of Big Data declarative languages that are part
of the IBM platform? While this chapter focuses on text analytics, it’s important
to realize that different Big Data projects require different kinds of optimiza-
tions. For example, text analytics is heavily dependent on CPU for processing.
At the same time, crunching through trillions of key value pairs in Hadoop
would tax a system’s I/O capabilities (as you see in the Hadoop-respective
terasort and grep benchmarks). By providing highly optimized optimiza-
tion runtimes for specific tasks at hand, Big Data practitioners can focus on
analysis and discovery as opposed to performance tuning.
To the best of our knowledge, there’re no other fully declarative text ana-
lytics languages available in the market today. You’ll find high-level and
medium-level declarative languages, but they all make use of locked-up
“black-box” modules that can’t be customized, restricting flexibility and
making it difficult to optimize for performance.
Being able to evolve text extractors is vitally important, because very few
things ever remain the same when it comes to analysis. We see this often with
social media analytics when popular slang terms or acronyms quickly become
“tired” (for example, a few years ago, many people would say “that’s sick!”
if they liked something, but that’s not used as often now—and we’re happy
about that for obvious reasons).
AQL is designed to be easily modifiable, and when you do make changes,
your new code is optimized in tandem with existing code. In addition, AQL
is designed for reuse, enabling you to share analytics across organizations.
You can build discrete sets of extractors and use them as building blocks so
that you don’t have to “start from scratch” all the time.
The Advanced Text Analytics Toolkit includes sets of built-in extractors for
elements that are commonly found in text collections. For example, Person
(names), PhoneNumber, Address, and URL are just some of the many
extractors that are shipped with BigInsights and Streams. In addition to a
generic set of extractors, there are also extensive collections of extractors
for social media text and for common types of log data. These built-in
extractors really flatten the time to effective text analytics development
curve. You can also build on these libraries with your own customizations,
08-ch08.indd 186 03/10/12 7:02 PM
218.
DifferentiateYourself withText Analytics 187
Flash 6X9 / Harness the Power of Big Data:The IBM Big Data Platform / Zikopoulos / 817-5
or use them in other extractors that you’re building. We cover all of the IBM
Big Data platform accelerators in Chapter 9.
If you need extractors beyond those provided out of the box, AQL is a
SQL-like language for building new extractors. It’s highly expressive and
flexible, while providing familiar syntax. For example, the following AQL
code extends the pre-existing extractors for telephone numbers and people’s
names to define a new extractor specifically for telephone numbers that are
associated with a particular person.
create view PersonPhone as select P.name as person, N.number as phone
from Person P, Phone PN, Sentence S where Follows(P.name. PN.number, 0, 30)
and Contains(S.sentence, P.name) and Contains(S.sentence, PN.number)
and ContainsRegex(/b(phone|at)b/, SpanBetween(P.name, PN.number));
Figure 8-1 shows a visual representation of the extractor that is defined in the
previous code block.
When coupled with the speed and enterprise stability of BigInsights and
Streams, the Advanced Text Analytics Toolkit represents an unparalleled value
proposition.ThedetailsoftheintegrationwithBigInsightsandStreams(described
in Figure 8-2) are transparent to the text analytics developer. After the finished
AQL is compiled and automatically optimized for performance, the result is an
analytics operator graph (AOG) file. For BigInsights, this AOG can be sub-
mitted as an analytics job through the BigInsights Web Console. After being
submitted, thisAOG is distributed with every mapper that is to be executed on
the BigInsights cluster. When the job starts, each mapper executes code to
instantiate its own Advanced Text Analytics Toolkit run-time and applies the
AOG file. The text from each mapper’s file split is run through the toolkit’s
run-time, and an annotated document stream is passed back as a result set.
Figure 8-1 A visual representation of the extractor rules from the code example
<Person> <Phone>
0–30 chars
Contains “phone” or “at”
Within a single sentence
08-ch08.indd 187 03/10/12 7:02 PM
219.
188 Harnessthe Power of Big Data: The IBM Big Data Platform
Flash 6X9 / Harness the Power of Big Data:The IBM Big Data Platform / Zikopoulos / 817-5
For Streams, the AOG is included in a Streams operator. During execution
on a Streams node, the operator passes streaming text through the toolkit’s
run-time, which returns result sets back to the operator.
ProductivityToolsThat Make
All the Difference
The Advanced Text Analytics Toolkit includes a set of Eclipse plug-ins to
enhance your productivity. When writing AQL code, the editor features com-
pletion assistance, syntax highlighting, design-time validation (automatic
detection of syntax errors), and more, as shown in Figure 8-3.
One of the most difficult aspects of text analysis is getting started. To make
this easier, the Advanced Text Analytics Toolkit includes a workflow assis-
tant that enables you to select elements of text that you know you’re inter-
ested in, and it builds rules for you (see Figure 8-4). You can select additional
variations of text for the extractors you’re working on to continually refine
these rules.
Also included is a facility to test extractors against a sample of the target
data. Building text extractors is a highly iterative process, and the AQL tool-
ing is not only designed to support analysts as they tweak rules and their
result sets, but it’s also designed to promote collaboration between the devel-
oper and the business user.
A major challenge for analysts is determining the lineage of changes that
have been applied to text. It can be difficult to discern which extractors and
Figure 8-2 The run-time process for analytics that are built with the AdvancedText
AnalyticsToolkit
AQL
Compiled
Operator
Graph
Optimizer Runtime
Annotated
Document
Stream
Input
Document
Stream
08-ch08.indd 188 03/10/12 7:02 PM
220.
DifferentiateYourself withText Analytics 189
Flash 6X9 / Harness the Power of Big Data:The IBM Big Data Platform / Zikopoulos / 817-5
Figure 8-4 An AQL work flow assistant: Guided help to get started with text analytics
Figure 8-3 A plug-in provides a rapid application development platform for the
creation, debugging, and execution of AQL.
Content Assist
Procedural Help Syntax Checking
08-ch08.indd 189 03/10/12 7:02 PM
221.
190 Harnessthe Power of Big Data: The IBM Big Data Platform
Flash 6X9 / Harness the Power of Big Data:The IBM Big Data Platform / Zikopoulos / 817-5
which individual rules need to be adjusted to tweak the results. To aid in this,
the provenance viewer, shown in Figure 8-5, features an interactive visual-
ization capability that displays exactly which rules influence the resulting
annotations.
Imagine manually building an extractor that contains 900 rules (like some
of the extractors that are available out of the box in the IBM Big Data plat-
form); if you have made a mistake, how do you figure out where that mistake
is coming from? The provenance viewer is a necessity in this scenario. There
are many other development accelerator features, such as the IBM Many
Eyes visualization engine for upfront pattern detection, and more.
Wrapping It Up
The BigInsights Advanced Text Analytics Toolkit gives you everything that
you need to quickly develop text analytics applications that will help you to
get value out of extreme volumes of text data. Not only is there extensive
tooling to support large-scale text analytics development, but the resulting
code is highly optimized and easily deployable for either data in motion or
data at rest. This toolkit also includes an extensive library of extractors that
you can customize and extend.
Figure 8-5 The provenance viewer is one of the many development tools that are
included in the AdvancedText AnalyticsToolkit.
08-ch08.indd 190 03/10/12 7:02 PM
222.
Flash 6X9 /Harness the Power of Big Data:The IBM Big Data Platform / Zikopoulos / 817-5
191
9
The IBM Big Data
Analytic Accelerators
The IBM Big Data platform contains multiple general-purpose tools to
analyze Big Data. Although these tools are rich in their capabilities, to mon-
etize your Big Data assets, you inevitably need to write application logic
that is suited to your business needs. This is no different than data you store
in a relational database, where applications are needed to make databases
applicable to specific use cases (for example, CRM software). Of course, we
will note that the relational database industry is highly mature. Thousands
of database applications can be bought, and development skills are ubiqui-
tous. Today, out-of-the-box Big Data applications aren’t easily found, leav-
ing organizations to adopt a roll your own (RYO) approach. Now consider
that Big Data development skills are priced at a premium due to scarcity,
and we bet you’re starting to see the challenge … and the need.
To reduce the time it takes to extract business value from Big Data, IBM
has developed a set of Big Data analytic accelerators—software modules
that provide specific analytics functionality to the IBM Big Data platform.
IBM’s Big Data analytic accelerators are a culmination of expert patterns
learned from countless customer engagements. You can use most of these
accelerators across industries to extract true value from your Big Data. A
number of these accelerators are available today, and more are in develop-
ment for future releases. In this chapter, we describe three of the currently
available accelerators: the Machine Data Accelerator, the Social Data Accel-
erator, and the Telco Data Accelerator.
09-ch09.indd 191 03/10/12 7:03 PM
223.
Flash 6X9 /Harness the Power of Big Data:The IBM Big Data Platform / Zikopoulos / 817-5
192 Harness the Power of Big Data: The IBM Big Data Platform
The IBM Accelerator for
Machine Data Analytics
Today’s enterprises depend heavily on the uptime of their IT infrastructure.
One of our clients makes money through a stock ticker-like application that
conveys noteworthy news items—if it isn’t running, they aren’t making
money. Another online retailer estimates that 17 kinds of logs are generated
in the process of an online order. Web logs, application server logs, Hibernate
logs, database logs, driver logs, and more, all contain discrete views into the
transaction as a whole. These clients tell us they can’t afford downtime, so
they put a lot of investment and smarts into areas of concern. We think for as
much thought and planning that goes into keeping systems highly available
and recoverable from disaster, we still take too much for granted when it
comes to the highly interconnected nature of our IT environments, where
everyone’s devices are networked, and a multitude of systems pump infor-
mation through this maze of wires. Of course, when something goes wrong,
our dependencies on these systems become painfully obvious. The activities
of entire departments can be brought to a standstill without this lifeblood of
connectivity. As such, when IT outages happen, there’s an extreme sense of
urgency around restoring connectivity. Here’s the thing: if uptime is so criti-
cal, why are so few of us making a corpus of log information and finding
trendline correlations between log events that seem harmless in isolation, but
taken in context with other IT activities prove to be the root cause for a down-
stream outage? Big Data technologies give businesses an unprecedented
opportunity to create insight into this myriad of log files that yields hints
and clues on not just what went wrong in the past, but how to prevent
things going sideways in the future.
As we alluded to in the previous paragraph, two main factors make IT out-
ages challenging today: the high degree of interconnectedness and growing
interdependencies between IT systems, and the high volume of usage against
these systems. The key to diagnosing the root causes of failures involves sys-
tem administrators combing through IT logs (also known as machine data)
from their various servers and pinpointing the origin of the chain of events
that led to an outage. And it’s the nature of these logs that pose the biggest
challenge. All these different systems store their logs in different locations, use
different file formats, and use different presentation styles for elements such
09-ch09.indd 192 03/10/12 7:03 PM
224.
The IBM BigData Analytic Accelerators 193
Flash 6X9 / Harness the Power of Big Data:The IBM Big Data Platform / Zikopoulos / 817-5
as date-time information. Extreme volumes make the variety of this informa-
tion even more difficult to handle. It’s not uncommon for organizations to
rack up many terabytes—trillions of rows—of this machine data. Today, many
organizations simply purge this data, almost as if it’s a waste byproduct
(which is why we often refer to it as data exhaust). Clearly, being able to find
the hidden value in system logs is a Big Data challenge.
To meet this challenge, InfoSphere BigInsights (BigInsights) ships with the
IBMAccelerator for Machine DataAnalytics (known informally as the Machine
Data Accelerator, or MDA for short)—a special module that’s designed to han-
dle the full lifecycle of log data analysis (shown in Figure 9-1).
Ingesting Machine Data
The first stage in the machine data analysis lifecycle is to ingest logs from IT
systems into HDFS (for an explanation of HDFS, see Chapter 5). The MDA
includes an ingest application, which handles this data movement operation,
but also helps prepare the machine data for the subsequent data processing
that will happen in BigInsights.
The MDA’s data ingest function accepts logs in the form of batches, where
each batch represents one type of log. In addition to the log data itself, each
batch includes a metadata file, which describes key characteristics and inher-
ent assumptions. This information is necessary for the MDA to properly parse
and normalize the data. A common trait in machine data is for key metadata
elements, such as the year or the server name, to be encoded in the name of the
file where logs are stored. Clearly, when pulling together logs from different
time periods and different systems, this information needs to be factored in.
Ingest Logs Extract Transform
Indexing
Faceted
Searching
Reporting
Dashboards
Ad-hoc
Exploration
Visualization
Statistical
Modeling
Figure 9-1 The lifecycle of machine data analysis
09-ch09.indd 193 03/10/12 7:03 PM
225.
Flash 6X9 /Harness the Power of Big Data:The IBM Big Data Platform / Zikopoulos / 817-5
194 Harness the Power of Big Data: The IBM Big Data Platform
Extract
After your machine data is stored in HDFS, you can leverage the IBM Big
Data platform’s text analytics capabilities to parse it and extract items of
interest. The objective of the MDA’s extract function is to turn the log records
from various sources into a consistent format. Without this, it’s nearly impos-
sible to do meaningful analysis, because so many log formats have significant
differences.
The MDA includes out-of-the-box support for the following log types:
Cisco syslog, WebSphere Application Server, Datapower, Webaccess, and
CSVs with headers. The MDA also includes a base set of extractors that are
common to all logs (for example, IP address and date-time) that can be used
for other log types. For situations requiring more customization, you can
use the Advanced Text Analytics Toolkit (covered in Chapter 8) and custom-
ize existing extractors, or build your own. For example, you can open up the
MDA’s Cisco weblog extractor and modify it to suit your log types. Really,
you can think of the MDA components as a template, and you’re free to
customize it any way you want—and that lets you get to the value that’s in
your data faster.
The MDA’s extract function parses all of a batch’s log records (using the
extractor that’s suited to the applicable log type), and writes them in a form
that can be analyzed alongside logs from other systems and time periods.
This process involves the following steps:
1. Record splitting This involves parsing the logs and identifying log
record boundaries. Machine data from some sources (for example,
Cisco syslogs) represents records as individual lines. Data from
other sources (for example, WebSphere Application Server)
represents records as multiple lines.
2. Field extraction After the log records are split, the individual
fields are extracted on the basis of rules for the log type that’s
associated with the current batch of log data.
3. Event standardization When analyzing machine data from
different devices, software, and applications, time stamps within the
records need to be stored in a consistent manner, taking into
consideration different time-stamp formats, time zones, or other
time stamp–related information that’s missing from the data itself.
09-ch09.indd 194 03/10/12 7:03 PM
226.
The IBM BigData Analytic Accelerators 195
Flash 6X9 / Harness the Power of Big Data:The IBM Big Data Platform / Zikopoulos / 817-5
This is required because information is often omitted from each
record in the interest of reducing log sizes. For example, timestamps
in each record might be missing the year or time zone, which is
provided in the file name or known externally. The MDA uses
values that are provided in the batch’s metadata to fill in the missing
fields. Without this standardization of time stamp data, apples-to-
apples comparisons of log files are impossible.
4. Event enrichment User-specified metadata—such as server name,
data center name, or application name—can be associated with
machine data batches during the ingestion process. For example, the
server name is normally not included in batches of log records relating
directly to the server itself, but it would be very useful when analyzing
this information alongside batches of logs from other servers.
5. Event generalization Machine data records usually contain
varying values, such as time stamps, IP addresses, measurements,
percentages, and messages. By replacing the varying values with
constant values (masking), the events can be generalized. Generalized
events are collected and given unique IDs, which are then used for
downstream analysis. These generalized events can be used in
frequent sequence analysis to identify which sequences of generalized
events occur most frequently. They can also be used in significance
testing to identify which generalized events are the most significant
with respect to a specific error. The fields to be masked can vary with
the log type. Event generalization is optional, so when users don’t
provide any fields, generalization is not performed.
6. Extraction validation in BigSheets Before running the extraction
operation, you can preview the results in BigSheets to ensure that
the correct fields are being extracted, and that the standardization,
enrichment, and generalization operations were applied correctly.
7. Extracted log storage The resulting data is stored as compressed
binary files in a hierarchy of directories where each directory
contains the parsed log records from a batch of logs. The logs are
formatted as JSON records; each record contains the original log
record and the extracted fields for the log record.
09-ch09.indd 195 03/10/12 7:03 PM
227.
Flash 6X9 /Harness the Power of Big Data:The IBM Big Data Platform / Zikopoulos / 817-5
196 Harness the Power of Big Data: The IBM Big Data Platform
Index
To facilitate the searching of machine data, the extracted logs must be indexed.
The search interface also supports faceted browsing (where you can drill into
a set of log records by selecting categories of interest). To enable this, you can
customize which facets to use and what their labels should be.
Transform
The extracted machine data represents many individual log records in a
format that can be analyzed with log records from other time periods and
sources. One such analysis is based on the concept of sessionization, which
is the grouping of log records that correspond to a single time period or
underlying activity (this is commonly used in web-based shopping cart
analysis, but it’s also just as useful for network analytics). The ability to
analyze machine data through the lens of sessions is useful for root cause
analysis, pattern identification, and predictive modeling. The transform
function in the MDA performs two kinds of sessionization: temporal and
event-context relationships (where you can join two distinct sets of logs).
To leverage temporal sessionization, use the MDA to group log records
into sessions based on slices of time. The MDA will divide the records based
on a provided partition key (for example, a machine or process ID). Once the
records are divided, you simply assign a time-gap threshold and the MDA
will break the log records into sessions for each partition by combining log
entries until the time-gap threshold is reached.
Event-context relationship sessionization enables you to define sessions
around specific event types from one log collection and correlated infor-
mation from another log collection. You start this processing by identify-
ing the kind of event you need to analyze—this is known as a seed event
around which the MDA will build sessions. Next, identify the kind of log
information that you need to provide context for the originating event,
and assign a partitioning key for the “event” log type and the “context”
log type. (The partitioning key is a set of fields that are present in both
event and context log records.) With this information, the MDA will break
the log records into sessions defined by events you specify, such as a
broken connection.
09-ch09.indd 196 03/10/12 7:03 PM
228.
The IBM BigData Analytic Accelerators 197
Flash 6X9 / Harness the Power of Big Data:The IBM Big Data Platform / Zikopoulos / 817-5
Statistical Modeling
Now that your large volumes and different formats of machine data have
been normalized and transformed, you can start performing some meaning-
ful analysis. Even without considering the different log types, volume can
make statistical analysis prohibitive. In a Hadoop context, even though it’s
possible to deal with high data volumes and varieties efficiently, it’s difficult
to program statistical algorithms. BigInsights makes life easier here because
it has a toolkit for machine learning and deep statistical analysis. The MDA
leverages some of these statistical algorithms to help reveal valuable infor-
mation that’s locked in your machine data. There are currently two statistical
models available for the MDA: Frequent Subsequence Identification and Sig-
nificance Analysis. (Our lawyers don’t like us hinting into the future, but
imagine an MDA that has more statistical models at your disposal—sooner
than later.) Both of these statistical models provide output that can easily be
visualized and graphed using BigSheets.
The Frequent Subsequence Identification model shows which sequences of
events happen most frequently across different sessions. A number of interest-
ing patterns can be revealed with this analysis, which enables proactive admin-
istration to prevent future problems. For example, you can identify the series of
events that frequently occur before failure conditions. Significance Analysis
helps to identify which events, and patterns of events, are the most significant
with respect to an error condition.
Visualization
The MDAincludes tools that enable you to graphically drill into your machine
data and visualize previously hidden trends. In fact, all extracted data and the
sessionized records are available for processing by ad-hoc queries and visual-
ization in BigSheets. In addition to refining reports and queries, you can
explore your machine data using a powerful faceted search tool.
Faceted Search
After your machine data is in extracted form and has been indexed, you can
browse it using the Data Explorer graphical faceted search interface included
with BigInsights. This is a quick way to search machine data and expedite
09-ch09.indd 197 03/10/12 7:03 PM
229.
Flash 6X9 /Harness the Power of Big Data:The IBM Big Data Platform / Zikopoulos / 817-5
198 Harness the Power of Big Data: The IBM Big Data Platform
troubleshooting—you can focus on a small set of records within a very large
set by defining a small window of time and performing a facet-based drill-
down into your logs. Figure 9-2 shows the faceted search interface, in which
search results are filtered by time range and a search term. On the left side of
the interface, you can select other categories to further refine the search results.
The IBM Accelerator for
Social Data Analytics
Of all the types of Big Data, none is as hyped and hotly debated as social
media. Marketeers salivate at the prospect of understanding what’s being
said on Twitter about their brands. Because of this great demand, a cottage
industry has sprung up around the interpretation of social media messages.
We see this in the form of Twitter sentiment graphs during almost every
significant cultural event. For example, during the 2012 Summer Olympics,
the London Eye (the gigantic Ferris wheel on London’s waterfront) was
illuminated with lights whose color reflected people’s overall sentiment
around the games.
Figure 9-2 Faceted search interface
09-ch09.indd 198 03/10/12 7:03 PM
230.
The IBM BigData Analytic Accelerators 199
Flash 6X9 / Harness the Power of Big Data:The IBM Big Data Platform / Zikopoulos / 817-5
Almost invariably, these representations of sentiment from huge volumes
of social media messages are very shallow. We found that most consist of a
simple set of rules that assign positive weights for positive words, and nega-
tive weights for negative words. This might work for some tweets, but it
can’t be considered reliable. For example, consider this sentence:
“The amazing number of lip synched performances during the 2012
closing ceremonies inspired me to take a walk and have my own lip
performance at the local pub with a pint.”
Even though the two underlined words are considered positive, this tweet
is overwhelmingly negative. What this sentence illustrates is that context is
extremely important, and that any serious analysis of free-form text has to
derive meaning through more sophisticated approaches, as opposed to a
simple lexicon of classification. We’ve made this point in a couple of chapters
throughout this book, and this is one of the differentiating pieces of the IBM
Big Data platform.
Moreover, sentiment itself isn’t enough. If you work in a car company’s
marketing department, you want to know if someone’s interested in buying
your company’s product. Even better, you’d probably like to see market seg-
mentation details so you can get a breakdown of how people are responding
to your campaigns.
Building on the capabilities of BigInsights, Streams, and the Advanced
Text Analytics Toolkit, IBM has developed a Social Data Accelerator (SDA for
short, but officially known as the IBM Accelerator for Social Data Analytics),
which provides a rich set of text analysis rules so that you can get an accurate
and precise sense of what people are saying online.
The SDA includes extractors that are focused on lead generation and
brand management for a number of industries. For lead generation, the focus
is on discovering potential customers, while for brand management, how
people feel about the brand and any competitors is the focus. In addition,
each set of extractors for a particular use case is divided between rules that
determine the meaning of a social media message, and rules that help to
build profile information for a particular user. To pull the output of these
extractors together, the SDA includes a workflow that helps you manage the
flow of data through these extractors all the way from ingest to visualization.
09-ch09.indd 199 03/10/12 7:03 PM
231.
Flash 6X9 /Harness the Power of Big Data:The IBM Big Data Platform / Zikopoulos / 817-5
200 Harness the Power of Big Data: The IBM Big Data Platform
Feedback Extractors: What Are People Saying?
As we’ve just seen, to get a sense of the meaning behind people’s social media
messages, it’s not enough to score positive and negative words. Semantic
understanding of raw text, such as tweets, is complicated and requires careful
analysis. It’s for this reason that IBM has built industry-specific extractors for
the sentiment analysis tools in the SDA. These feedback extractors represent
sets of industry-specific rules (for retail, finance, and entertainment) that
apply to the brands, products, or services that you provide. Following are the
kinds of feedback that the SDA rules are looking for.
• Buzz The amount of discussion
• Sentiment The degree of satisfaction or dissatisfaction. This can get
quite granular. For example, if you were to tweet that you like the
movie Moneyball, but dislike the lead actor (it’s just an example; we
think Brad Pitt is pretty cool), the SDA can isolate the sentiment for
this movie.
• Intent to buy The level of commitment to spend money
• CustomerOf Whether someone is an existing customer (for example,
someone said they bought a particular product)
Profile Extractors: Who AreThese People?
For the context of what people are saying, it’s extremely valuable to get a
sense of who has been expressing sentiment. Profile extractors are typically
applied over large sets of social media messages each time new batches are
added. The first few times that you run these extractors, the profile data that
you acquire will be sparse, but as your collection of social media messages
grows, additional profile elements will be populated for more of the users
that you are tracking. Profile extractors determine the following information
from social media messages, in addition to the poster’s online profile infor-
mation (for example their user name, or Twitter profile):
• Gender The poster’s sex, usually determined from the poster’s
online profile information
• Location Where the poster lives
• Parental status Whether the poster has children
09-ch09.indd 200 03/10/12 7:03 PM
232.
The IBM BigData Analytic Accelerators 201
Flash 6X9 / Harness the Power of Big Data:The IBM Big Data Platform / Zikopoulos / 817-5
• Marital status Whether the poster is married
• Employment status Whether the poster is employed
Workflow: Pulling It AllTogether
To successfully assess what people are saying about your brand or product,
the SDA includes a workflow (see Figure 9-3) to coordinate all of the steps
that are taken to analyze your social data.
Ingest
The first stage of social media analysis is ingesting social media messages. In
the SDA, this stage is handled by Streams, which has source operators for the
Gnip service (which provides messages from Twitter), and the BoardReader
service (which provides messages from microblogs—blogs, newsgroups,
forums, and so on). While Streams ingests the data into BigInsights, it
also does some initial filtering of spam messages to address issues of veracity.
Of course, it could be the case that you want to investigate this spam; per-
haps some of it isn’t spam and you can evolve the filtration process through
customization—it’s a learning environment, after all. Much like agile develop-
ment, the more times you iterate, the better the solution becomes. Streams also
provides real-time insights on the data as it’s streaming into your organization.
Data Ingest
and Prep
Stream Computing and Analytics
Online flow: Data-in-motion analysis
Social Media
Data Sources
(Gnip, BoardReader)
Local Analysis Global Analysis
Profile and
feedback
extraction
Extended profile
entity analytics
Visualization
Offline flow: Data-at-rest analysis
Define Sentiment
Targets
Comprehensive
Social Media
Customer
Profiles
Extended profile
entity analytics
Profile and
feedback
extraction
Visualization
Hadoop System and Analytics
Global Analysis
Local Analysis
Figure 9-3 The lifecycle of social data analysis
09-ch09.indd 201 03/10/12 7:03 PM
233.
Flash 6X9 /Harness the Power of Big Data:The IBM Big Data Platform / Zikopoulos / 817-5
202 Harness the Power of Big Data: The IBM Big Data Platform
The SDA is a result of thousands of iterations by IBM in this area, but as you
know, the journey never ends.
Define SentimentTargets
It seems pretty obvious when we write it, but you need to tell the SDA what
you are looking for before your analysis can begin. When it comes to text
extraction, you have to define the element to extract and discover from there.
For example, you can provide the SDA a set of brands, products, and services
that you’re interested in tracking. You can make things more sophisticated by
also defining product category information and aliases for the product. The
SDA ingests the defined terms of interest and turns it into an AQL dictionary
(see Chapter 8 for more information), which is factored into the feedback
extractors that are executed in the SDA’s downstream processing.
Local Analysis
This stage is the first of two text analytics passes against this batch of data. In
this phase, each document is analyzed individually using both the feedback
and profile extractors. Before analyzing the text itself, additional spam filter-
ing is done, and mentions of the brand, products, or services are isolated. At
this point, the feedback and profile extractors are run against the preprocessed
social media messages. The output of the profile extractors is added to the
global user profiles stored in BigInsights. The output of the feedback extrac-
tors is written to BigInsights—in a comma-separated value (CSV) format—for
easy visualization with BigSheets.
Global Analysis
With updated user profiles in place, a second round of analysis is done
against this batch of data, using entity analytics to determine which users are
the same across the data sources. Again, output of this stage is written as
updates to the global user profiles stored in BigInsights.
Streaming Mode
While the SDA can process social media messages in batch mode using Big
Insights, it can also run in streaming mode using Streams. In this case, you
pass the definition of sentiment targets to BigInsights, which generates the
AQL, and the resulting executable code is passed to Streams. The local and
global analysis happens on Streams in the same manner in which it is
09-ch09.indd 202 03/10/12 7:03 PM
234.
The IBM BigData Analytic Accelerators 203
Flash 6X9 / Harness the Power of Big Data:The IBM Big Data Platform / Zikopoulos / 817-5
executed in batch mode, except that individual records are processed as they
stream in from the social media source adapters.
Visualization
The SDAprovides visualizations and reports on the results of its analysis. You
can also publish these reports in the Data Extractor Application Builder dash-
board. Figure 9-4 shows an example dashboard, where you can show overall
sentiment, and at the same time highlight the sentiment for individual clients.
Figure 9-4 Social data dashboard
09-ch09.indd 203 03/10/12 7:03 PM
235.
Flash 6X9 /Harness the Power of Big Data:The IBM Big Data Platform / Zikopoulos / 817-5
204 Harness the Power of Big Data: The IBM Big Data Platform
The IBM Accelerator for
Telecommunications Event Data Analytics
The telecommunications (telco) industry has been an early and active adopter
of the IBM Big Data platform, especially in dealing with data in motion. This is
no surprise, given the data management challenges that telco companies face,
especially in the area of high-velocity data. Based on experiences in providing
solutions for telco businesses, IBM has built the Telco Data Accelerator (TEDA
for short, but officially known as the IBM Accelerator for Telecommunications
Event Data Analytics), which focuses on in-motion processing of call detail
records (CDR). The TEDA shipped with Streams, which we talked about in
Chapter 6.
CDR processing is an acute pain point for telco providers today, mainly
because of high volumes and high velocities. Every time someone places a
call, telco switches create a CDR, which includes information such as the call-
ing number, called number, time stamp for the start of the call, call type
(voice or SMS), duration of the call, quality information, and more. With the
advent of cell phones, the number of CDR logs has greatly increased
because additional CDRs are created for the same mobile call every time the
call is transferred to a different cell tower. For telco providers with many
customers, it’s very difficult to process these CDR logs proactively, especially
during peak usage periods. To give an example of the scale of these volumes,
one of our large Asian telco clients has to deal with about six billion CDRs
per day, where the daily peak rate is over 200,000 CDRs per second!
Most telco providers load batches of CDR data into a relational database,
and then perform CDR processing, including transformation and analytics,
used for applications like revenue assurance or fraud detection in real-time.
There are also post-processing activities, such as removing duplicate entries.
This means there are delays of many hours before the telco business can track
billable activity or other issues.
The TEDA is designed to push much of the CDR analytics and post-
processing activity out of the at-rest persistence layer and get the work done
in-motion, using Streams, just after the CDR is generated. This approach not
only provides the telco provider more immediate access to billing information,
but a wealth of additional information can be harvested by performing
in-motion analysis of the CDR data.
09-ch09.indd 204 03/10/12 7:03 PM
236.
The IBM BigData Analytic Accelerators 205
Flash 6X9 / Harness the Power of Big Data:The IBM Big Data Platform / Zikopoulos / 817-5
The technologies in the TEDA have been implemented successfully at the
Asian telco client we just mentioned earlier, and others as well. The inflection
point that the TEDA can deliver is astounding. Our Asian telco client previ-
ously took 12 hours to process its CDR data. Now, Streams-based ingest and
transformation of CDRs is complete in less than one minute from the point
the CDR is generated, enabling them to achieve real-time insights and offer
new services such as usage-based offers. Another benefit is processing effi-
ciency: Streams typically only needs one tenth of the amount of processing or
storage required by typical batch applications used by telecommunications
providers today.
The following sections explain the three main analytics functions that are
included in the TEDA: CDR enrichment and de-duplication, network quality
monitoring, and key customer experience indicators tracking.
Call Detail Record Enrichment
Using the TEDA, Streams can ingest CDRs and perform enrichment and
de-duplication activities in near-real time. Figure 9-5 shows a high-level view
of the TEDA architecture, including the flow graphs of TEDA logic and their
CDR
Repository
Bloom State
Checkpointing
File parsing and
error handling
Rules: Lookups and
Transforms
Checkpoint
Controller
De-duplication
Bloom Filter
Dashboards
Lookup Data
CDR Statistics
Parallel
or
Serial
Write
Parallelizing
Source
Input Files
Output
Files
Metadata Database
Figure 9-5 TheTEDA architecture
09-ch09.indd 205 03/10/12 7:03 PM
237.
Flash 6X9 /Harness the Power of Big Data:The IBM Big Data Platform / Zikopoulos / 817-5
206 Harness the Power of Big Data: The IBM Big Data Platform
interaction with the various data stores in a telco company’s transaction
processing system.
In many jurisdictions, there are a number of regulatory requirements sur-
rounding CDR data. As such, transaction processing systems require detailed
tracking of when a CDR has been successfully processed and written to the
CDR data store. The Streams TEDA application continuously monitors its
directories to detect new CDRs, and writes records to maintain the state of
each file. A parallelizing operator splits the CDRs into multiple parallel
branches (or paths) to expedite processing and apply full parallelization
techniques to the stream.
TEDA supports the Abstract Syntax Notation One (ASN.1) CDR format,
and other proprietary formats. For other CDR formats, the TEDA ingest rules
that can easily be customized to accommodate variations in those formats.
The TEDA includes over 700 rules that represent expert patterns that were
created by folks at IBM who live and breathe telco in order to facilitate the
CDR analysis process. The TEDA also includes a series of in-memory and
table look-ups to enrich the CDRs with information such as the customer’s
importance, the customer ID, and estimated revenue for the call.
Streams also performs de-duplication of CDRs during enrichment. The
telco switches always create two copies of each CDR to prevent data loss, and
the duplicates must be deleted to ensure that customers are not billed twice.
The TEDA uses a Bloom Filter algorithm to eliminate duplicates, which opti-
mizes performance and memory consumption. Because of possible switch
failures, duplicate CDRs can appear up to 15 days later. This means that each
CDR must be compared against 15 days of data—potentially billions
of CDRs. Normally, this processing is done in the CDR data warehouse. With
the TEDA, however, it’s now done simultaneously with CDR analysis, which
reduces the workload in the warehouse, and enables the warehouse to focus
on analytic and reporting applications, instead of de-duplicating records.
The final group of operators writes CDRs to the CDR repository (the
CDRs still need to be stored here for a myriad of reasons, such as regulatory
compliance, data governance, insight discovery, and more). After the TEDA
application receives confirmation that the CDRs have been written to the
repository, control information is sent back to the source operators to update
the CDR state information and to delete the relevant input files.
09-ch09.indd 206 03/10/12 7:03 PM
238.
The IBM BigData Analytic Accelerators 207
Flash 6X9 / Harness the Power of Big Data:The IBM Big Data Platform / Zikopoulos / 817-5
Network Quality Monitoring
The core capability of the TEDA lies in CDR enrichment and de-duplication,
which are traditionally done with at-rest technologies through batch process-
ing. But processing CDRs immediately upon ingest yields some interesting
possibilities to gain additional value from the CDR data. Specifically, there is
data in CDRs that can facilitate network quality monitoring. As CDRs flow
through the graphs, the TEDA counts completed and dropped calls, along
with contextual data, such as provider, country, region, cell ID, termination
codes, and cell site. Using this data, the TEDA provides dashboards such as
the one depicted in Figure 9-6, which shows the current throughput of CDRs
ordered by region. Historical aggregations are stored in database tables for
future visualization in Cognos.
Customer Experience Indicators
Another benefit of the TEDA is the ability to track key indicators of customer
experience, most significantly, dropped calls. Using some of the enriched
CDR data that is added by the TEDA, you can view summaries about your
most important customers. Figure 9-7 shows a dashboard reporting on
dropped calls that were experienced by high-priority customers.
Figure 9-6 The CDR metrics dashboard
09-ch09.indd 207 03/10/12 7:03 PM
239.
Flash 6X9 /Harness the Power of Big Data:The IBM Big Data Platform / Zikopoulos / 817-5
208 Harness the Power of Big Data: The IBM Big Data Platform
Similar to the network quality reports, historical aggregations for this cus-
tomer experience data are stored in database tables for future visualization in
Cognos.
Wrapping It Up:
AcceleratingYour Productivity
The common thread in all three accelerators is this: IBM provides tooling and
a workflow that’s optimized to reduce the time that it takes you to get action-
able information out of your Big Data. With Streams and BigInsights, you have
two powerful engines to deal with a broad scope of in-motion and at-rest data.
When coupled with these analytic accelerators, you have processing power
combined with out-of-the-box analytic capabilities that can greatly speed up
your deployments. With the IBM Big Data platform, not only do you get
smarter, you get faster too! With a set of accelerators, IBM has packaged
together expertise and proven usage patterns in a form factor that makes it
faster than ever to monetize and analyze your Big Data.
Figure 9-7 Dashboard reporting dropped calls experienced by high-priority customers
09-ch09.indd 208 03/10/12 7:03 PM
240.
Flash 6X9 /Harness the Power of Big Data:The IBM Big Data Platform / Zikopoulos / 817-5
209
Part VI
Integration and Governance
in a Big Data World
10-ch10.indd 209 04/10/12 11:52 AM
241.
Flash 6X9 /Harness the Power of Big Data:The IBM Big Data Platform / Zikopoulos / 817-5
00-FM.indd 16 04/10/12 12:19 PM
This page intentionally left blank
242.
Flash 6X9 /Harness the Power of Big Data:The IBM Big Data Platform / Zikopoulos / 817-5
211
10
To Govern or Not to
Govern: Governance in a
Big Data World
The question of whether Big Data needs to be governed is poised to be-
come a Big Data hot topic (we’d argue that it should have been so from the
beginning). Big Data is a phenomenon and it’s changing the data characteris-
tics of every system; in order to make Big Data usable, it needs to be governed
such that it’s more certain, more trusted. Some believe that Big Data needs to
be analyzed in a pristine form (maintaining fidelity), and that any form of
governance or attempt to “clean it up” might actually throw away some
valuable insight. Others believe that governance capabilities can simply be
“built into” the Big Data ecosystem, if and when you need them. Both of
those views are wrong. The answer to the question posed in this chapter’s
title is an unequivocal “yes”: Big Data needs to be governed.
It’s pretty obvious when you think about it. If data that’s stored in tradi-
tional repositories is subjected to governance, the fact that you’re bringing in
more of it, or different types of complementary data, or alternative persis-
tence engines, doesn’t change anything. Suppose that your client signs up on
your Facebook page as a friend and agrees to share their information with
you; if they later unfriend your business, according to Facebook’s terms and
conditions, you are no longer allowed to use that information. Is this built
into your social sentiment governance process? If you’re using a test environ-
ment, whose data contains personally identifiable information (PII), it’s still
10-ch10.indd 211 04/10/12 11:52 AM
243.
Flash 6X9 /Harness the Power of Big Data:The IBM Big Data Platform / Zikopoulos / 817-5
212 Harness the Power of Big Data: The IBM Big Data Platform
PII data whether it’s packed into a nice and neat relational schema enforced
with referential integrity rules, or sitting on a file system with a consistency
mechanism that’s akin to the wild wild west. The point is that data is data,
and if you’re subject to governance today, why would that change if you
enhance your insights with different kinds of data or more fidelity?
We always remind our clients just how important governance is to an
information management platform. There’s no question that the choice of
a Big Data platform should include some discussion of governance and
that’s the focus of this chapter.
Why Should Big Data Be Governed?
Let’s level-set and start this section with a broad definition of governance.
Governance is a set of policies that define how you will manage your data.
The policy may or may not involve actively governing the data (cleansing it,
securing it, and so on); but all data should have a policy that manifests the
decision of whether or not to govern it. No one would advocate making un-
informed decisions about how to treat their data, but the sad reality is that
many do adopt that approach. This places them in the unfortunate predica-
ment of “reactive governance,” fixing problems (or worse yet, violations) as
they arise, which is more costly and complex. Therefore, organizations must
track all of their data and define policies for how it’s managed. Let’s look at
some examples.
Consider your data’s lifecycle and the management practices that sur-
round it. The moment a piece of data is born into the enterprise, it has an
expiry date. Although the data might never expire in some cases, it will cer-
tainly cool off with time and be accessed less frequently, if at all. But here’s
the question: Do you actually know the expiry date and aging policy that’s
attached to your data, and do you explicitly manage it? Do you know when
data can be archived or legally deleted? For example, pharmaceutical clinical
trials require retention periods that span more than a decade after the death
of a subject, and most financial records must be retained for seven years;
Facebook has agreed to keep 20 years of your Facebook musings for federal
privacy audits.
Now consider how the retention problem can magnify in a Big Data
world. Big Data often has a short shelf life and it can accumulate quickly.
10-ch10.indd 212 04/10/12 11:52 AM
244.
To Govern orNot to Govern: Governance in a Big Data World 213
Flash 6X9 / Harness the Power of Big Data:The IBM Big Data Platform / Zikopoulos / 817-5
If you don’t define lifecycle policies and enforce them with automated tech-
nology, you’ll either become overwhelmed with Big Data accumulation, or
your administrators will expend a lot of manual effort determining how and
when to delete or retire this data. Consider social media data—how long do
you need to keep it? What about the insights derived from it—how long are
they relevant? At the same time, some of the Big Data promise is to keep a
corpus (complete history) of information, so while you may never delete this
data, it still has a temperature associated with it.
Many use cases for Big Data involve analyzing sensitive information. Orga-
nizations must define security policies to safeguard such information, and
those policies must be monitored and enforced.
The integrity aspect of Big Data is such a hot topic that it ended up with a
sexy term, veracity, which we introduced in Chapter 1. You need to determine
whether your Big Data should be cleansed with the same approach that you
would apply to your traditional data, or whether you risk losing potentially
valuable insights by cleansing it. The answer depends entirely on what
you’re planning to do with this data. Some use cases, such as customer anal-
ysis, require or would at least benefit from higher-quality data. Other use
cases, such as fraudulent identity analysis, which might require analyzing
data exactly as entered to discover false identity patterns, would not depend
on higher-quality data.
Many Big Data use cases center on key master data management (MDM)
concepts, such as customers, products, locations, and suppliers. But many
organizations haven’t established a single version of the truth for those
domains before the onset of the Big Data craze. Consider a social media–
based customer profiling application. One of its key starting points is know-
ing your customers. The linkage is that many MDM projects have the goal of
providing a single view of your customers. The linkage between MDM and
Big Data centers on the most valuable business entities that an organization
concerns itself with, including: customers, products, and households. That’s
the linkage between MDM and Big Data. MDM is a good starting point for
many Big Data use cases, and it also provides a logical hub to store insights
gleaned from Big Data analytics. For example, if you consider a master data
project that centers around a person, then extracting life events over Twitter
or Facebook, such as a change in relationship status, a birth announcement,
and so on, enriches that master information and acts as a kind of feeder to
10-ch10.indd 213 04/10/12 11:52 AM
245.
Flash 6X9 /Harness the Power of Big Data:The IBM Big Data Platform / Zikopoulos / 817-5
214 Harness the Power of Big Data: The IBM Big Data Platform
such a system. MDM can play a pivotal role in the governance of Big Data
initiatives, providing a governed, single version of the truth that’s annotated
by valuable insights from Big Data initiatives.
We noted earlier that many organizations don’t acknowledge the need to
govern a lot of the new data that their Big Data initiatives bring into the enter-
prise, and therefore don’t properly account for it in the planning phase of
their Big Data projects. We thought that it would be interesting to share with
you the two reasons for this that we hear over and over again.
The first one is: “Big Data started as a research initiative. The concept of
governance wasn’t required—we used a small data set and operated within
a trusted environment. When the business approved the project and we started
to work on it, that’s when we realized this was no different than any other
enterprise IT project—it needed to be governed.” That’s an example of not
thinking about your new data in the same way as your old data, and then
trying to retrofit a governance plan that’s going to end up being more costly
and complex than it needed to be.
The second most common answer we get is: “We were building a lot of
new capabilities into our Big Data project—analytics, models, and so on—so
we just figured we could build governance if we needed it. Write some code
to enforce security here, write some other code to match data there, and in
the end, it crept up on us that governance isn’t a tactical issue, and that
addressing it in a one-off manner was very costly.”
Are you starting to see a theme here? Those organizations that don’t plan
for the governance of their Big Data systems from the start end up falling
behind and must face significant additional costs to retrofit governance into
their ecosystems.
But those that leverage their existing information integration processes
and governance technologies are the ones who will derive the most benefit
from new Big Data analytics technologies in a secure, trusted, and compliant
fashion.
Competing on Information and Analytics
Many organizations pursue Big Data analytics to find breakthrough insights
that give them a competitive advantage. They are competing on analytics.
But can you really compete on analytics alone? After all, what does analytics
10-ch10.indd 214 04/10/12 11:52 AM
246.
To Govern orNot to Govern: Governance in a Big Data World 215
Flash 6X9 / Harness the Power of Big Data:The IBM Big Data Platform / Zikopoulos / 817-5
analyze? The reality is organizations are competing on information and
analytics—and in order for the information to be acted upon, it must be
trusted. While we all want data to be trusted, there are classes of data where
this may not be entirely possible. For example, do you trust a random tweet?
It depends—think about the Mexican presidential election we talked about
in Chapter 1. In essence, enterprises acquire and create data they trust, but
they will undoubtedly have some data they can’t entirely trust. For this
data, a risk estimate and assessment is required. This is a key point that’s all
too often overlooked. That risk estimate has to be attached to the data and
decision-making processes that come in contact with this data need to know
about it. In fact, processes should be forced to look at the assessment before
acting on the class of data. The end goal of the work that you perform on the
integration and governance of your data is trusted information. That said,
studies have shown that in most organizations, business users don’t trust
the information that they use in their day-to-day jobs. In a Big Data world,
as shown in Figure 10-1, there are more sources that dilute our ability to
Figure 10-1 Trust in data decreases as the increasing variety of sources and volume of
data makes data more uncertain.
10-ch10.indd 215 04/10/12 11:52 AM
247.
Flash 6X9 /Harness the Power of Big Data:The IBM Big Data Platform / Zikopoulos / 817-5
216 Harness the Power of Big Data: The IBM Big Data Platform
trust the data, and the more data sources around which you cast your
analytics “net,” the more trust issues you are going to have.
A decline in trusted data represents a serious impediment to the adoption
of new applications and technologies that are intended to enrich an analytics
ecosystem. Information integration and governance technologies address the
quality issues that compound in a Big Data world by proactively managing
information governance, thereby establishing trust in information and fos-
tering the adoption of Big Data analytics applications. Trust, combined with
risk assessment, is essential before action can be taken.
The Definition of Information
Integration and Governance
The marketplace has amassed many definitions for information integration
and governance. Although resolving the nuances among these definitions is
outside this chapter’s scope, we offer the following working definition for
the discussion that takes place in the remainder of this chapter.
Information integration and governance (IIG) is a business strategy for how
an organization treats information. At its heart, it defines the policies for
how information is used, shared, and proactively monitored within an
organization. It involves technology for policy definition, metadata
management, data quality, information integration, information lifecycle
management, privacy and security, and master data management. It also
involves people and processes, which ultimately determine and enforce
governance policies. The purpose of information integration and gover-
nance is to establish and deliver trusted information.
Let’s examine the essence of the last statement: “The purpose of governance
is to establish and deliver trusted information.” What makes an organization
and its users trust information? We believe that there are six key factors involved.
• Information is understood The origin, value, and quality profile of
the information are well understood.
• Information is correct It’s standardized, validated, verified, and
matched.
• Information is holistic It shouldn’t be fragmented; there shouldn’t
be competing versions of the same information.
10-ch10.indd 216 04/10/12 11:52 AM
248.
To Govern orNot to Govern: Governance in a Big Data World 217
Flash 6X9 / Harness the Power of Big Data:The IBM Big Data Platform / Zikopoulos / 817-5
• Information is current Only the most recent and relevant data is
stored, and old data is either archived or deleted. Big Data often
presents new challenges for lifecycle management, as Big Data is often
very time sensitive and loses its value quickly; it may be the case that
the lifecycle of the entire group of Big Data (such as social media data)
isn’t actively governed, the entire dataset is analyzed, and then deleted
once the analysis is complete. That said, there are also considerations
in a Big Data world where you want to store a corpus of data to build
better predictive models.
• Information is secure The level of protection from data breaches
(encryption, redaction, security, and monitoring) matches the
governance requirements of the data.
• Information is documented The information’s source system, and all
of the governance rules and transformations that were applied to it,
must be tracked, explainable, and made visible to end users.
Sometimes folks refer to this factor as end-user transparency, because
every governance rule and process should be documented and
surfaced to the end user to assist in establishing trust.
Do all six factors of governance need to be applied to Big Data? It de-
pends on the use case: we’ll talk about two of them that illustrate entirely
two different governance approaches. For example, analyzing Big Data to
detect fraud patterns may certainly require documentation of the origin of
the data: perhaps it may involve standardization and matching to cleanse
duplicate records, understanding holistic master customer data to match to
fraud records, security to mask sensitive data, and even lifecycle manage-
ment to archive or retire individual records at different intervals. At the
same time, using Big Data to investigate customer sentiment through social
media requires an entirely different treatment of governance. It’s likely to
involve integrating master customer data with Big Data to identify custom-
ers, but the social media data may not require cleansing, documentation, or
individual record lifecycle management—the entire dataset might even be
deleted at the conclusion of the analysis.
10-ch10.indd 217 04/10/12 11:52 AM
249.
Flash 6X9 /Harness the Power of Big Data:The IBM Big Data Platform / Zikopoulos / 817-5
218 Harness the Power of Big Data: The IBM Big Data Platform
An Information Governance Process
Information governance is a business strategy, not an IT project—you can’t
just buy it, you have to live and breathe it, making it part of your business
processes and a core expectation that’s put on the organization as a whole. As
such, it requires changes to both organizational processes and how people
treat information. In order to achieve the objective of trusted information, an
organization must embrace both technology and changes to process and the
way people work and are incented. It’s impossible to achieve this objective
with change to just one. What’s more, each ensures the success of the other.
Afully functional governance platform makes it possible to change processes
to proactively govern information, and a people-oriented focus will encour-
age them to embrace and adopt the new technology.
For the most part, the information governance process that was estab-
lished for traditional relational data works equally well for new sources of
Big Data, so we thought we’d briefly outline the key process steps for infor-
mation governance that you can use as a kind of roadmap for Big Data gov-
ernance.
1. Identify the business problem to be solved. It’s imperative that a tactical
business problem be identified to drive adoption. The approach of
building technology first and driving business adoption second
never works. While this point isn’t directly related to Big Data
governance, it’s an “any” project imperative and it naturally pulls in
governance as a project-scoped topic.
2. Obtain vocal executive sponsorship early on for the governance of any Big
Data project, thereby reaffirming the importance of governance for Big
Data projects across the organization. This sponsor will typically be
closely related to the business problem. Because governance is truly
an enterprise-wide initiative, you’ll want to evaluate whether the
sponsor has the political clout to push the importance of governance
into other projects across the enterprise. You’ll also want to establish
an executive steering committee, to which you’ll report your
progress on governing Big Data on a periodic basis.
3. Determine what parts of the Big Data stream needs to be governed and to
what extent. A critical first step of governance planning is
determining whether the data needs to be governed. Questions to
10-ch10.indd 218 04/10/12 11:52 AM
250.
To Govern orNot to Govern: Governance in a Big Data World 219
Flash 6X9 / Harness the Power of Big Data:The IBM Big Data Platform / Zikopoulos / 817-5
ask include: Is this data sensitive, and does it need to be protected?
Is this data governed by regulation? Does this data need to be
standardized? Depending on the use case, some Big Data might
require only certain aspects of governance, and some data might
require none at all. But we want to emphasize that it’s crucial that an
organization make a conscious choice of whether that data should be
governed, and at what level. For example, governance treatments
may be applied to an entire body of data (delete all Facebook data
from last month) or to individual files or records (delete John Doe’s
record from last month). In fact, explicitly evaluating a Big Data
source and choosing not to govern it is a form of governance itself.
4. Build a roadmap. A roadmap involves several Big Data projects, which
require governance. It’s important to map out at least the first three
phases of your implementation project for a governance initiative. In
order to sustain momentum from Phase 1 to Phase 2, an organization
must plan out Phase 2 at the onset. We can’t stress enough how
important momentum is—it’s crucial—especially between that first
and second phase, because this is the point at which an enterprise
initiative can truly take hold, or fizzle out and become a one-phase
wonder. A good second phase leverages some aspect of Phase 1—so
that you can go faster in Phase 2. If you utilize security capabilities in
Phase 1, perhaps you leverage them in Phase 2 for a different Big
Data source; or perhaps Phase 2 focuses on the same source of Big
Data, but adds new data quality elements. The point is to keep one
thing the same—either the governance capability or the Big Data
source—this creates leverage.
5. Establish an organizational blueprint. A blueprint is a matrix-style
structure of both business and IT participants, at different levels of
the organization. The working team includes business participants
to determine governance policies, and IT participants for
implementation. It also includes an executive steering committee to
which the action team reports. The executive sponsor chairs the
steering committee.
6. Define metrics and targets. It’s essential to define metrics and set
targets to track success. It isn’t necessary to track every possible
metric for a governance business case; start by focusing on no more
10-ch10.indd 219 04/10/12 11:52 AM
251.
Flash 6X9 /Harness the Power of Big Data:The IBM Big Data Platform / Zikopoulos / 817-5
220 Harness the Power of Big Data: The IBM Big Data Platform
than a dozen key metrics that are accurate predictors of success and
achievement for the overall business case. The metrics tracked and
reported on should be closely tied to the business value or
trustworthiness of the information.
7. Establish governance policies. The action team determines governance
policies for the project and drives business adoption of the new
processes for governing data.
8. Implement governance technology. While the IT team implements and
integrates governance technologies for redaction, activity
monitoring, rights usage, and so on, the business representatives of
the action team help to drive adoption of the data as a trusted
source.
9. Measure metrics and evangelize. As with an ignored New Year’s
resolution, we all acknowledge that this step is very important, but
most of us never follow through. Why? Often it’s because of an
exhaustive list of metrics or difficulty gathering the information
after the fact. Pick only a handful of metrics that are easy to collect.
Evangelization is crucial, because that’s when success, and therefore
momentum, is created.
Information governance is a business strategy that drives change to pro-
cesses and the people implementing those processes. Big Data certainly has
implications for governance technology, but the governance strategy and
structure that you are accustomed to laying down for relational data are
almost completely transferable to the Big Data era.
The IBM Information Integration and
GovernanceTechnology Platform
Information integration and governance (IIG) in the IBM Information Manage-
ment portfolio is represented by a number of industry-leading technologies
that IBM has unified into a trusted information delivery platform under the
brand name InfoSphere. IBM has also invested in a well-defined Information
Governance process to help organizations plan their governance initiatives and
how it will impact people and processes. Although these technologies work in
concert as a single platform, organizations that require different components,
10-ch10.indd 220 04/10/12 11:52 AM
252.
To Govern orNot to Govern: Governance in a Big Data World 221
Flash 6X9 / Harness the Power of Big Data:The IBM Big Data Platform / Zikopoulos / 817-5
depending on their use cases, can leverage specific access points into the plat-
form. The key capabilities of the IBM IIG technology are shown in Figure 10-2.
In the remainder of this section, we briefly talk about these core platform
capabilities, the associated IBM products that deliver these capabilities, and
their applicability to the Big Data world.
IBM InfoSphere Business Information Exchange
InfoSphere Business Information Exchange (BIE) is a core component for all
aspects of IIG—whether you’re improving data quality, mastering data,
securing a database, or managing the lifecycle of data, you must first begin
by understanding the data and defining governance policies. BIE contains
several components that help organizations to understand and profile data
sources—it contains unique services to blueprint information governance
Figure 10-2 The IBM unified information integration and governance platform helps
you deliver trusted information to the business.
10-ch10.indd 221 04/10/12 11:52 AM
253.
Flash 6X9 /Harness the Power of Big Data:The IBM Big Data Platform / Zikopoulos / 817-5
222 Harness the Power of Big Data: The IBM Big Data Platform
projects, discover data in its source systems, manage enterprise metadata,
and to represent that metadata in business-friendly terms via a glossary, and
to define governance policies, among other capabilities.
IBM InfoSphere Discovery
InfoSphere Discovery (Discovery) is a BIE component that automatically cre-
ates a profile for structured data sources. Discovery can determine the logical
model of a source system (for example, inferring a customer object by look-
ing at the physical data and tables). It can also infer some of the transforma-
tion or validation rules for that data source by examining the relationships of
data across fields; it can determine cross-field validation rules, allowable val-
ues, and so on. This greatly aids in the integration process by short-circuiting
the labor-intensive process of profiling and documenting existing sources of
data. IBM also has capabilities for discovering, profiling, indexing, search-
ing, and navigating unstructured Big Data, using InfoSphere Data Explorer
(formerly known as the Vivisimo Velocity Platform).
IBM InfoSphere Metadata Workbench
Shared metadata is the basis for effective data integration. By sharing a com-
mon definition of terms and data transformations at the enterprise level, an
organization can quickly translate data from one system to another. Meta-
data also documents data lineage (where the data comes from), where it’s
heading, and what happened to it along the way. Data lineage metadata is
one of the most powerful forces of trust because when it’s exposed to a busi-
ness user, it quickly establishes trust. InfoSphere Metadata Workbench has
capabilities for managing and sharing enterprise metadata in a structured
format. IBM InfoSphere Information Server also contains capabilities for
parsing unstructured Big Data sources and storing metadata on all sources of
Big Data with more features coming to address some of the new challenges
associated with Big Data.
IBM Business Glossary
Effective sharing of metadata relies upon a common vocabulary, one that
business and IT can agree upon. That’s how Business Glossary can help. It
manages the business definition of the metadata—putting IT terms into com-
mon ones that business users can understand. This function becomes even
10-ch10.indd 222 04/10/12 11:52 AM
254.
To Govern orNot to Govern: Governance in a Big Data World 223
Flash 6X9 / Harness the Power of Big Data:The IBM Big Data Platform / Zikopoulos / 817-5
more important in the era of Big Data. As data comes from many new sources,
it also comes in many new terms and formats. The need for a common
vocabulary has never been greater.
One of the greatest challenges in information governance is developing
policies—you literally have to develop them in every system that manages
and governs data. But what if you could develop governance policies at the
same time that you define metadata? Business Glossary allows you to do
that, to define governance policies in plain language at the same time as you
define metadata. Business Glossary provides business-driven governance by
allowing business analysts and users to define governance policies.
IBM InfoSphere Information Analyzer
This component profiles the quality of data from source systems, and thereby
profiles the systems themselves. For example, is the billing system a reliable
source for residential addresses and email addresses? This is a crucial step for
establishing trust. The number one question that business users ask when try-
ing to establish trust is “What system did this data come from?” Being able to
answer that question, and being able to gather statistics on whether a system
is truly trustworthy, are key steps to establishing trust. IBM InfoSphere Infor-
mation Analyzer profiles source systems, and analyzes the quality of data
within those systems. For example, completeness of records, whether data
stored in a field actually conforms to a standard (for example, an SSN is nine
digits), and reports and visualizes aggregate data quality profiles (percentage
of accurate and complete records, and so on.). This capability may be utilized
on enterprise structured Big Data sources; in larger data sets, representative
data sets may be profiled. The concept of information analysis applies more to
structured data, where a set structure may be expected and subsequently ana-
lyzed. In the future, semistructured data sources may also be analyzed and
key words/values may be examined utilizing text analytics. The concept of
information analysis applies more to structured data.
IBM InfoSphere Blueprint Director
InfoSphere Blueprint Director (Blueprint Director) maps and manages active
integration architecture diagrams. It’s a visual tool for designing integration
architectures, which also allows you to dive into specific integration steps and
launch various other integration tools—for example, a user interface for
10-ch10.indd 223 04/10/12 11:52 AM
255.
Flash 6X9 /Harness the Power of Big Data:The IBM Big Data Platform / Zikopoulos / 817-5
224 Harness the Power of Big Data: The IBM Big Data Platform
developing quality rules. Blueprint Director may also be used for mapping
out Big Data integration architectures, and can help you actively manage your
Big Data integration architecture.
IBM InfoSphere Information Server
There are three styles of data integration: bulk (or batch movement), real-
time, and federation. Specific projects, such as Big Data analytics, often
require a combination of all of these styles to satisfy varying requirements.
Information integration is a key requirement of a Big Data platform,
because it enables you to leverage economies of scale from existing invest-
ments, yet discovers new economies of scale as you expand the analytics
paradigm. For example, consider the case where you have a heavy SQL
investment in a next best offer (NBO) application. If this application were
SQL warehouse-based, it could be enhanced with the ability to call a Hadoop
job that would look at the trending sentiment associated with a feature item
stock-out condition. This could help to determine the acceptability of such an
offer before it’s made. Having the ability to leverage familiar SQL to call a
function that spawns a MapReduce job in a Hadoop cluster to perform this
sentiment analysis is not only a powerful concept; it’s crucial from an invest-
ment enhance perspective.
Perhaps it’s the case that you have a machine data analysis job running on
a Hadoop cluster and want to draw customer information from a system that
manages rebates, hoping to find a strong correlation between certain log
events and eventual credits. This goes back to the baseball analogy we talked
about in Chapter 1. The Big Data era is characterized by various fit-for-
purpose engines, and it’s the coordination of these engines (like the baseball
player who is better at throwing with one hand and catching with the other)
that’s key: information integration makes this all happen.
Information is often structured or semistructured, and to achieve high-
volume throughput requires a powerful processing engine. Your Big Data
integration platform should provide balanced optimization for different inte-
gration and transformation needs, ranging from ETL (extract, transform, and
load), to ELT (leveraging the target system to process the transformations
while providing the transformation logic), to TELT (transform, extract, load,
and transform).
10-ch10.indd 224 04/10/12 11:52 AM
256.
To Govern orNot to Govern: Governance in a Big Data World 225
Flash 6X9 / Harness the Power of Big Data:The IBM Big Data Platform / Zikopoulos / 817-5
Some developers believe that new technologies, such as Hadoop, can be
used for a multitude of tasks. From a batch and integration perspective,
the Big Data world is characterized by various approaches and disciplines
with Big Data technologies. This leads to a “build mentality,” which assumes
that everything can be built around the new technology. If you think back
to when the data warehouse industry was in its infancy, many IT professionals
attempted to build in-house integration capabilities. Few would do that
today, because mature information integration technologies exist. The same
pattern is playing out in Hadoop, with some believing that it should be the
sole component for integration or transformation workloads.
For example, some folks propose that they should only use Hadoop to
prepare data for a data warehouse; this is generally referred to as ETL. But
there’s a huge gap between a general-purpose tool and a purpose-built one,
and integration involves many aspects other than the transformation of
data, such as extraction, discovery, profiling, metadata, data quality, and
delivery. Organizations shouldn’t utilize Hadoop solely for integration;
rather they should leverage mature data integration technologies to help
speed their deployments of Big Data. New technologies such as Hadoop
will be adopted into data integration; for example, during an ELT-style inte-
gration (where the T may be performed by stored procedures in a data
warehouse), organizations may look to utilize Hadoop for transformation
processing. We think you’ll find the need to use Hadoop engines as part of
an ETL/ELT strategy, but you will also greatly benefit from the flexibility of
a fit-for-purpose transformation engine, massively parallel integration
engine to support multiple transformation and load requirements, integra-
tion into common run-time environments, and a common design palette
that’s provided by a product such as InfoSphere Information Server (IIS). In
fact, this product’s parallel processing engine and end-to-end integration
and quality capabilities yield a significant total cost of ownership advantage
over alternative approaches.
For example, if the transformation is full of SQL operations, IIS can push
down those operations into an IBM PureData System for Analytics appliance
(formerly known as Netezza). Your integration platform should be able to
not just automatically generate jobs to run on an Hadoop infrastructure or
ETL parallel engine as required, but manage them with a common job
sequencer. IIS includes connectors into Hadoop and a Big Data file stage
10-ch10.indd 225 04/10/12 11:52 AM
257.
Flash 6X9 /Harness the Power of Big Data:The IBM Big Data Platform / Zikopoulos / 817-5
226 Harness the Power of Big Data: The IBM Big Data Platform
(BDFS) container for data persistence and retrieval. A single data integration
platform, such as the one provided by IIS, gives you both capability and
flexibility. IIS includes a multitude of prebuilt transformation objects and
hundreds of functions, all atop a parallel execution environment that gives
you the flexibility to use a myriad of technologies (including Hadoop) that
are best suited for the task at hand. IIS integrates with HDFS as both a source
and a target system for data delivery. IIS can also model certain integration
tasks within an integration stage and specify the process to be performed on
Hadoop, which would take advantage of Hadoop’s MapReduce processing
and low-cost infrastructure. This may be often used in ELT-style integration,
where instead of the T being performed by data warehouse stored proce-
dures, transformations are performed by a Hadoop system. IIS also inte-
grates with InfoSphere Streams (Streams), and it may accumulate insights or
data filtered by Streams into a staged data file, which is then loaded to a
target system (say a data warehouse for further analysis).
High-speed integration into data warehouses is going to be key, and IIS
delivers this capability as well. An example of an IIS Big Data transformation
flow is shown in Figure 10-3. You can see that this job analyzes high-fidelity
emails (stored in Hadoop) for customer sentiment, and the results of that
analysis are used to update the warehouse (for example, the Customer
dimension); this is an example of risk classification based on email analytics.
Other integration technologies that are commonplace in today’s IT environ-
ments (and remain key in a Big Data world) include real-time replication and
federation. Real-time replication, utilizing a product such as IBM InfoSphere
Data Replication (Data Replication), involves monitoring a source system and
triggering a replication or change to the target system. This is often used for
Figure 10-3 A data-flow job that utilizes a combination of Big Data assets, including
source data in Hadoop joined with DB2 relational data, and various transformations to
classify risk
10-ch10.indd 226 04/10/12 11:52 AM
258.
To Govern orNot to Govern: Governance in a Big Data World 227
Flash 6X9 / Harness the Power of Big Data:The IBM Big Data Platform / Zikopoulos / 817-5
low-latency integration requirements. Data Replication has sophisticated
functionality for high-speed data movement, conflict detection, system moni-
toring, and a graphical development environment for designing integration
tasks. Furthermore, it’s integrated with the set of IBM PureData Systems for
high-speed data loading/synchronization, and also with Information Server
to accumulate changes and move data in bulk to a target system.
Federation involves accessing data that’s stored in federated repositories
through a federated query. This is often used to retrieve data from multiple
systems or to augment data that’s stored in one system with information
from another system. IBM InfoSphere Federation Server (Federation Server)
accesses and integrates data from a diverse set of structured data sources,
regardless of where they reside. It enables hybrid data warehousing by join-
ing data from multiple repositories, and also exposing information as a ser-
vice (IaaS) via InfoSphere Information Services Director. From a federation
perspective, it’s important to be able to federate search (as the Data Explorer
technology we outlined in Chapter 7) across your enterprise assets, as well
as with a query API such as SQL. In the future, Federation Server may inte-
grate with Data Explorer to provide structured data source search and query
within an overall Big Data (structured and unstructured) federated search
and discovery.
We believe that organizations shouldn’t try to solely deliver enterprise
integration with Hadoop; rather they should leverage mature data integra-
tion technologies to help speed their deployments of Big Data, whenever that
makes sense. There’s a huge gap between a general-purpose tool and a pur-
pose-built one, not to mention that integration involves many aspects other
than the delivery of data, such as discovery, profiling, metadata, and data
quality. We recommend that you consider using IBM Information Server
with your Big Data projects to optimize the loading (via bulk load or replica-
tion) of high-volume structured data into a data warehouse, and extending it
with federation when required; the loading of structured or semistructured
data into Hadoop; and the collecting of information that’s filtered and ana-
lyzed by stream analytics. You can then load the data into a relational system
(such as a data warehouse), federate queries across relational databases as
part of Big Data federation and navigation, and replicate data sources to a
Hadoop cluster or other data warehouse.
10-ch10.indd 227 04/10/12 11:52 AM
259.
Flash 6X9 /Harness the Power of Big Data:The IBM Big Data Platform / Zikopoulos / 817-5
228 Harness the Power of Big Data: The IBM Big Data Platform
Data Quality
Data quality components can be used to ensure the cleanliness and accuracy
of information. IBM InfoSphere Information Server for Data Quality (IIS for
DQ) is a market-leading data quality product. It contains innovative features
such as information profiling and quality analysis, address standardization
and validation, and it’s fully integrated into the InfoSphere Information
Server platform for quality rule development, execution of quality jobs on
Information Server’s parallel processing platform, and sharing metadata
with enterprise metadata component. Data quality discussions typically in-
volve the following services:
• Parsing Separating data and parsing it into a structured format.
• Standardization Determining what data to place in which field and
ensuring that it’s stored in a standard format (for example, a nine-digit
zip code).
• Validation Ensuring that data is consistent; for example, a phone
number contains an area code and the correct number of digits for its
locale. It might also include cross-field validation, such as checking the
telephone area code against a city to ensure that it’s valid (for example,
area code 416 is valid for Toronto, 415 is not).
• Verification Checking data against a source of verified information
to ensure that the data is valid; for example, checking that an address
value is indeed a real and valid address.
• Matching Identifying duplicate records and merging those records
correctly.
Organizations should determine whether their Big Data sources require
quality checking before analysis, and then apply the appropriate data quality
components. A Big Data project is likely going to require you to focus on data
quality when loading a data warehouse to ensure accuracy and complete-
ness; when loading and analyzing new sources of Big Data that will be inte-
grated with a data warehouse; and when Big Data analysis depends on a
more accurate view (for example, reflecting customer insight), even if the
data is managed within Hadoop.
10-ch10.indd 228 04/10/12 11:52 AM
260.
To Govern orNot to Govern: Governance in a Big Data World 229
Flash 6X9 / Harness the Power of Big Data:The IBM Big Data Platform / Zikopoulos / 817-5
Master Data Management
Master data management (MDM) creates and maintains a single version of
the truth for key business entities such as customers, patients, products,
parts, suppliers, accounts, and assets, among others. MDM is an operational
system of record, and it plays an important role in a Big Data ecosystem.
IBM’s InfoSphere Master Data Management is the most comprehensive
MDM solution in the market.
We think that MDM can provide a compelling starting point for Big Data
analysis, as MDM by definition focuses on the highest value entities within
an organization. Many organizations imagine that they would like to analyze
social media to determine customer sentiment, but do they know who their
customers are? Do they know their best customers? When embarking on Big
Data analysis of a precise subject, it often makes sense to leverage the knowl-
edge of an MDM system within a Big Data analytic application; for example,
understanding the sentiment and next best action for a particular group of
profitable customers instead of analyzing broad sentiment toward your
company.
Integration points between MDM and Big Data include ingesting and ana-
lyzing unstructured data, creating master data entities, loading new profile
information into the MDM system, sharing master data records or entities
with the Big Data platform as the basis for Big Data analysis, and reusing the
MDM matching capabilities in the Big Data platform (such as customer
matching). You’ll find that IBM is a leader in this space, and although we
can’t comment on some of the integration points coming to this problem
domain, IBM plans to continue and build integration points between MDM
and Big Data based on real-world customer use cases.
You should consider using MDM solutions with Big Data when the target
of your analysis is precise versus broad (aggregate)—an individual customer
or group of customers, a particular product or group of products, and so on.
In addition, consider integrating your Big Data into MDM systems when the
output of Big Data analytics should be “operationalized”; specifically, when
acquired insights are to be acted upon in operational systems. For
example, consider the case in which the next best action for customer reten-
tion should be consistently acted upon across multiple channels; the action
flag (or insight) should be stored in a MDM system.
10-ch10.indd 229 04/10/12 11:52 AM
261.
Flash 6X9 /Harness the Power of Big Data:The IBM Big Data Platform / Zikopoulos / 817-5
230 Harness the Power of Big Data: The IBM Big Data Platform
Data Lifecycle Management
Don’t think of Big Data as “a new technology” (for example, Hadoop). Think
of it as a phenomenon. And the primary characteristic of the Big Data phe-
nomenon is the fact that data is growing, in every one of your systems.
Unchecked data growth has a huge impact on your existing systems—data
warehouses, transactional systems, and applications. Data growth can lead
to high costs and poor performance of those applications. The growth of data
to “Big Data levels” also impacts test data management. Think about it.
Every time you deploy a system you need to generate test data systems from
production, for development to test, and so on. Often that data is copied
from production environments, and as the total data volume grows, so too
does the exponential growth of your test data environments. A second major
issue with test data is ensuring security and privacy—masking sensitive data
before it’s used in non-production environments. In short, the growth of data
in existing systems is crippling them, and the problem will only get worse in
the era of “Big Data,” unless it is proactively addressed.
Data lifecycle management controls the growth and therefore the cost of
data. It manages data lifecycle in two primary ways. First, it helps with data
growth management, providing a framework to profile and manage the
lifecycle of data and to proactively archive data in a highly compressed and
efficient manner. Second, data lifecycle management is critical for proper
test data management; specifically, for creating right-sized, governed, test
data environments to optimize data storage and costs. The IBM InfoSphere
Optim (Optim) family of products is the market leader in data lifecycle
management. Optim contains market-leading capabilities for data growth
management and archiving of complete business objects across heteroge-
neous environments, while also enabling easy retrieval of archived infor-
mation via queries. InfoSphere Optim Test Data Management (Optim TDM)
contains sophisticated test data management capabilities to generate right-
size test data sets, masking to ensure that sensitive data is protected, and
automation to enable self-service for generating test data sets.
You’re already thinking about data lifecycle management when you archive
relational data warehouses to ensure that only current information is stored,
thereby improving performance and reducing cost as data volumes grow.
10-ch10.indd 230 04/10/12 11:52 AM
262.
To Govern orNot to Govern: Governance in a Big Data World 231
Flash 6X9 / Harness the Power of Big Data:The IBM Big Data Platform / Zikopoulos / 817-5
Lifecycle management is also essential to ensure legal compliance with data
retention and protection regulations, and to be able to audit compliance
with data retention policies. In the Big Data world, low-cost engines like
Hadoop offer the opportunity of a low-cost alternative for storing online
archives to host colder data. While transferability between platforms is
improving, the business process of lifecycle management and archiving
is a separate challenge (in other words, Hadoop may be a low-cost platform,
but there are many more capabilities required to truly manage data growth).
That’s where Optim comes in. It manages the lifecycle and the archiving
process—discovering and profiling Big Data and tracking lifecycle mile-
stones (when to archive), automatically archiving Big Data from data ware-
houses and transactional databases, providing visibility and the ability to
retrieve and restore data if required, ensuring the immutability of archived
data to prevent data errors, and complying with legal requirements for
data retention and auditability. Optim can store archived data in a highly
compressed relational database, an archive file on a file system, and that
file may be loaded onto a Hadoop file system. And that latter integration
point between Optim and Hadoop is a key one, by placing an archive file
onto a Hadoop system it provides low-cost storage, while also allowing
data to be analyzed for different purposes, thus deriving insight from
the archived files. It’s not wonder why some of us refer to Hadoop as the
new tape!
Test data management should be a definite consideration when implement-
ing a Big Data project, in order to control test data costs and improve overall
implementation time. Optim TDM automatically generates and refreshes test
data for Big Data systems such as data warehouses, and it has an optimized
integration with the IBM PureData System for Analytics. Optim generates
right-sized test data sets, for example, a 100 TB production system may require
only 1 TB for user acceptance testing. InfoSphere Optim also ensures that sensi-
tive data is masked for testing environments. It will generate realistic data for
testing purposes (for example, changing Jerome Smith at 123 Oak Street to
Kevin Brown at 231 Pine Avenue), but will protect the real data from potential
loss or misuse. The possibility of data loss becomes even more real in the new
era of Big Data. More systems and more data lead to more test environments
and more potential for data loss. Optim TDM also has a tremendous cost
10-ch10.indd 231 04/10/12 11:52 AM
263.
Flash 6X9 /Harness the Power of Big Data:The IBM Big Data Platform / Zikopoulos / 817-5
232 Harness the Power of Big Data: The IBM Big Data Platform
advantage with self-service data generation through to right-sized environ-
ments, Optim TDM streamlines the test data process.
Big Data is associated with data growth and there’s not question that data is
growing in every one of your enterprise systems. Data Lifecycle Management
should be a top priority to help curb unchecked Big Data growth, reducing the
cost of data while making your applications more efficient.
Privacy and Security
There are multiple privacy and security notations within an information in-
tegration and governance discussion, most of which can be applied to Big
Data. You need to protect and block unauthorized access to sensitive data no
matter where it resides. If you have to apply governance to a certain class of
data that you collect, there are privacy and security concerns whether you
store this data in a file system (such as the HDFS) or in a relational database
management system (RDBMS). For example, your security mantra (separa-
tion of duties, separation of concern, principle of least privilege, and defense
in depth) applies to data stored anywhere. You’ll want to consider role-based
security, multitenancy, and reduced surface area configurations through
reverse proxies (among other security services), all of which BigInsights can
provide to Hadoop.
Of course, it’s worth noting that if IBM InfoSphere Guardium (Guardium)
is an industry leader in auditing and alerts via its heterogeneous data activ-
ity monitoring (DAM) services, based on activities at the data management
level, why couldn’t it do so for the HDFS? In 3Q 2012, IBM announced Guar-
dium’s initial support for providing DAM services to a Hadoop environment
(NameNode, JobTracker, and DataNodes) and its subsystem projects (for
example, Oozie), giving administrators the ability to clearly understand who
did what, who touched what, and so on. As of this writing, most BigInsights
components that currently have audit logs can be monitored; for example,
HDFS name space operations, MapReduce (job queue and job operations,
refresh configuration), HBase Region Server (database activity), Hive, and
Avro. Because Guardium works with open source components, it can inte-
grate with BigInsights and/or other open source distributions of Hadoop.
Guardium also recognizes the Thrift and MySQL protocols (used by Hive).
These components all send existing BigInsights audit logs to Guardium and
10-ch10.indd 232 04/10/12 11:52 AM
264.
To Govern orNot to Govern: Governance in a Big Data World 233
Flash 6X9 / Harness the Power of Big Data:The IBM Big Data Platform / Zikopoulos / 817-5
can leverage it to meet compliance requirements such as persisting, process-
ing, alerting, and reporting on audit logs. Future areas of interest could
include capturing audit logs for HBase, the BigInsights Web Console, among
others.
Database activity monitoring is a key capability that’s needed for an effec-
tive governed Big Data environment. In fact, we’d argue that such capabilities
are needed even more than in a traditional database environment, because
currently, Hadoop governance controls are typically weaker.
Big Data, as is the case with traditional data, might require data masking
for both test and production environments. Masking data is one of the biggest
concerns with new Big Data technology, as many customers realize they
might accidentally expose very sensitive information in test and production
Big Data environments. You need to create realistic versions of real data, but
at the same time protect sensitive data values from being compromised.
Masking sensitive data that’s delivered to HDFS or to a data warehouse will
become (and should already be) a pressing concern for Big Data environ-
ments. IBM InfoSphere Optim Masking Solution addresses this concern by
masking data in a Hadoop system. In fact, Optim’s API-based approach to
masking means that any system can take advantage of its advanced masking
capabilities, and incorporate masking within its processing. The benefit is
clear—the ability to define masking rules centrally and apply them in multi-
ple Big Data systems.
The obfuscation and blacking out of specific sensitive content within docu-
ments will also be key; after all, if you are storing email with sensitive data in
HDFS, that email could be subject to redaction requirements. It’s worth noting
here that the Text Analytics Toolkit that’s part of BigInsights and Streams is
used in InfoSphere Guardium Data Redaction.
Wrapping It Up:Trust Is AboutTurning
Big Data intoTrusted Information
Information integration and governance is a critical component that should
be considered during the design phase of any Big Data platform because of
the eventual mass injection of unwieldy data from a volume, velocity, vari-
ety, and veracity perspective. It’s fair to note that IBM is a leader in informa-
tion integration and governance; and as you’ve likely noticed, a number of
10-ch10.indd 233 04/10/12 11:52 AM
265.
Flash 6X9 /Harness the Power of Big Data:The IBM Big Data Platform / Zikopoulos / 817-5
234 Harness the Power of Big Data: The IBM Big Data Platform
products that make up the IBM InfoSphere Information Integration and Gov-
ernance platform are being extended to support the IBM Big Data platform;
some are there today, and some are well on their way (although our lawyers
want us to keep it a surprise, we’re sure that we’ve given you a crystal ball
look into the future with the topics that we detail in this chapter).
Although information integration and governance creates trusted infor-
mation, we really want you to remember that information integration and
governance is more than technology; it’s also a business strategy and associ-
ated trickle-down change processes to meet corporate-wide governance ob-
jectives. As you design your first Big Data project, it’s critical to ascertain
what parts of your project need to be governed, and to what extent.
The first and most critical step of the governance process is the decision
of whether Big Data needs to be governed, and to what extent it needs to be
governed. This should be mandatory for any Big Data project. Not making
a conscious decision can be a recipe for disaster…as in poor adoption, or
worse still, being a one-phase wonder. That is the true value of information
integration and governance technology—it can ensure the success and drive
adoption of your Big Data initiatives. Success with Big Data analytics depends
on a supply of trusted information.
10-ch10.indd 234 04/10/12 11:52 AM
266.
Flash 6X9 /Harness the Power of Big Data:The IBM Big Data Platform / Zikopoulos / 817-5
235
11
Integrating Big Data
in the Enterprise
One thing is certain—Big Data technology should not be a silo. It must be
integrated within the enterprise to fully realize its value. Let’s think about
that for a moment. Organizations need a technology platform for develop-
ing Big Data analytic applications. And those applications must be able to
interact with that Big Data platform to exploit certain Big Data capabilities.
Therein lies the first integration point: analytic applications built on the Big
Data platform.
A Big Data platform has within it many capabilities. To fully address
requirements, multiple Big Data components are often required. That’s the
second point of integration: Big Data platform components and products
must be integrated with one another.
After all, is there any point to a Big Data initiative if you don’t plan to act
upon the insights that you’ve gleaned from it?
Well, in our experience, in order to act upon insight, you typically have to
share the insight with some other application that makes use of it. So there’s
the third point of integration: enterprise applications and repositories.
Platforms should be open so that partner technologies across the broader
ecosystem can extend the solution. That’s your final integration point: plug-in
components for the Big Data platform. So the four types of integration that we
explore in this chapter are analytic applications, intraplatform integration,
enterprise integration with other repositories, and platform plug-ins.
11-ch11.indd 235 04/10/12 11:54 AM
267.
236 Harnessthe Power of Big Data: The IBM Big Data Platform
Flash 6X9 / Harness the Power of Big Data:The IBM Big Data Platform / Zikopoulos / 817-5
A lot of clients are on the right track when they ask us about integration
points from their existing technology investments and their new Big Data
projects; indeed, that’s always encouraging to hear, because it means that
the client is thinking beyond the “science experiment” phase that rarely
produces value. Note that there are many more integration points than we
can possibly cover in this chapter, so we encourage you to use this chapter
as a jumping-off point, rather than a definitive discussion of integration
options and patterns.
Analytic Application Integration
The IBM Big Data platform is designed from the ground up to simplify the
process of developing applications that run on top of it and to deliver ana-
lytical benefits through an underlying set of optimized Big Data technolo-
gies. This section describes some of the IBM Business Analytics software and
other applications that are integrated with the IBM Big Data platform. With
a Big Data ecosystem that spans well over 200 business partners, there are
many more applications than we could cover, of course, and the list grows
longer every day.
IBM Cognos Software
IBM Cognos BI, a component of IBM Cognos Enterprise, is widely deployed
business intelligence software that’s been extended for use with Big Data
through its integration with the IBM Big Data platform. As of this writing,
Cognos can access data that is stored in Hive and use it for reporting (there
is more coming, so stay tuned). Cognos BI is integrated and certified with
InfoSphere BigInsights (BigInsights), InfoSphere Streams (Streams), DB2,
the IBM PureData System for Analytics (formerly known as Netezza), and
the IBM PureData System for Operational Analytics (formerly known as the
IBM Smart Analytics System).
IBM Cognos Real Time Monitoring (Cognos RTM), a component of IBM
Cognos Enterprise, is software that provides visualization and analysis on
real-time streaming analytics from Streams. Visualization is one of the major
challenges that Big Data brings to business analysts; in fact, some universities
today actually offer degrees in Big Data visualization. Throughout this book
we’ve emphasized how data in motion is a differentiator for the IBM Big Data
platform, because velocity (one of the four Big Data characteristics) isn’t being
11-ch11.indd 236 04/10/12 11:54 AM
268.
Integrating Big Datain the Enterprise 237
Flash 6X9 / Harness the Power of Big Data:The IBM Big Data Platform / Zikopoulos / 817-5
addressed by vendors in this space with the same degree of focus that IBM
brings to the problem domain. If velocity is such an important aspect of Big
Data, it stands to reason that data in motion needs to be integrated with busi-
ness intelligence for users to gain insight into the past, present, and future.
IBM Cognos Consumer Insights (CCI) is a rich social media analytic
application. It allows users to analyze, visualize, and report on consumer
sentiment and evolving market topics from social media sources. IBM CCI
is integrated with IBM’s Big Data platform and in particular BigInsights.
BigInsights provides CCI the power and flexibility to process large vol-
umes of raw social media data.
IBM Content Analytics with Enterprise Search
IBM Content Analytics (ICA) provides leading capabilities for analyzing
unstructured content. But what happens when data sets grow too quickly to
process, as we know that they often do? BigInsights is integrated with ICA
and the two work together to ensure ballooning data volumes are not a
problem. IBM Content Analytics is also integrated with the analytics-based
IBM PureData Systems so that they can share insights and information.
Along with IBM InfoSphere Data Explorer (the technology that was obtained
through the Vivisimo acquisition, and which we cover in Chapter 7), ICA
provides broad and extremely capable unstructured information process-
ing, discovery, and consumption options.
SPSS
IBM SPSS software is a broadly deployed and sophisticated predictive ana-
lytics portfolio. It’s no surprise that customers want to leverage SPSS to
interact with the IBM Big Data platform. At-rest modeling is reasonably
well understood, but what if you want to take predictive analytics to the
extreme—to make predictions as the data comes into being, be it at a point
of sale, a hedge fund trader’s Bloomberg terminal, or even emergency room
monitoring equipment? After all, the whole point of predictive modeling is
to improve outcomes. The combination of SPSS and Streams is the answer,
as it gives you the ability to build predictive models at rest which are then
scored using the data in motion. To support this powerful usage pattern,
SPSS predictive models can be directly exported to the Streams run-time
environment. Additionally, Streams supports models defined by the
11-ch11.indd 237 04/10/12 11:54 AM
269.
238 Harnessthe Power of Big Data: The IBM Big Data Platform
Flash 6X9 / Harness the Power of Big Data:The IBM Big Data Platform / Zikopoulos / 817-5
Predictive Model Markup Language (PMML)—which is also supported by
SPSS. Streams provides the power to run both predictive models on a mas-
sive scale and scope in real time. Almost the entire IBM Big Data platform
is integrated with PMML. For example, you can build models in SPSS and
then run them within IBM PureData System for Analytics appliance to per-
form deep analytics with very fast performance.
SAS
SAS business analytics applications are integrated with the IBM Big Data
platform. In particular, SAS is integrated with the IBM PureData System for
Analytics. This integration allows SAS scoring and modelling to be run inside
this PureData System, which is more efficient in terms of bringing analytics to
the data, and of course it also benefits from the tremendous advantages an
analytics-based PureData System provides for deep analytic queries on large
data sets.
Unica
Unica is an advanced solution for cross-channel campaign management and
marketing performance optimization. It’s fully integrated with both the IBM
PureData System for Operational Analytics and the IBM PureData System
for Analytics, and can be used to perform campaign analytics and reporting
on these platforms. The benefits that IBM PureData Systems bring are clear—
the ability to perform deep analytics on large data volumes and to get the
answers that you need lightening fast, or to support operational analytic
workloads. Utilizing the power of the Big Data platform, the Unica solution
can analyze more data more quickly to produce more targeted campaigns.
Q1 Labs: Security Solutions
The topic of security and Big Data is white hot. The most pressing question is,
“How can existing securities solutions be extended with Big Data technolo-
gies?” In 2011, IBM acquired Q1 Labs and their QRadar Security Intelligence
Platform (QRadar), which provides a unified architecture for collecting, stor-
ing, analyzing, and querying log, threat, vulnerability, and risk-related data.
In response to customer demand, IBM security and Big Data teams have
worked on integration points to pass insights and analysis between the two
11-ch11.indd 238 04/10/12 11:54 AM
270.
Integrating Big Datain the Enterprise 239
Flash 6X9 / Harness the Power of Big Data:The IBM Big Data Platform / Zikopoulos / 817-5
platforms, leading to scale-out options and expanded situational awareness.
QRadar was very compelling as a stand-alone technology, but when com-
bined with Big Data, we’re doing never-before-possible things to help lock
down our enterprise customers’ domains.
IBM i2 Intelligence Analysis Platform
IBM i2 provides an extensible, service-oriented environment that is designed
to integrate with your existing enterprise infrastructure. This platform facili-
tates and supports operational analysis, improves situational awareness, and
delivers faster, more informed decision making across and within organiza-
tions. Since the acquisition, IBM has been busy integrating the i2 platform
with the IBM Big Data platform, and extending the data that i2 end users can
discover and explore. i2’s highly visual and intuitive end-user analytics help
you to identify and explore patterns, and then take action in rapidly evolving
environments.
Platform Symphony MapReduce
In 2011, IBM acquired Platform Computing, including their Platform Sympho-
ny MapReduce technology: a Hadoop-inspired run time specifically designed
for applications that require low-latency or sophisticated scheduling logic
across many simultaneous short-running jobs. BigInsights is the lead IBM
product offering for Hadoop, and Platform Symphony is considered to be a
complementary component of that offering.
What’s interesting is the integration work that’s been done for these prod-
ucts. For example, BigInsights can leverage Platform Symphony MapReduce as
the low-latency distributed run-time component running on its own cluster.
This enables customers who have specific low-latency or heavy computational
workloads to leverage this technology as part of a BigInsights deployment.
BigInsights may be deployed on one or more instances within a Platform Com-
puting grid, thereby leveraging its technical computing capabilities that support
heterogeneous applications. Existing Platform Symphony customers (of which
there are many) can add BigInsights to their existing grid and manage multiple
types of workloads across a common pool of resources. This eliminates the need
to set up a separate grid environment for BigInsights, and supports the sharing
of resources across both compute- and data-intensive applications.
11-ch11.indd 239 04/10/12 11:54 AM
271.
240 Harnessthe Power of Big Data: The IBM Big Data Platform
Flash 6X9 / Harness the Power of Big Data:The IBM Big Data Platform / Zikopoulos / 817-5
Component Integration Within
the IBM Big Data Platform
All of the components of the IBM Big Data platform are well integrated. In
this section, we briefly highlight some of this integration, and provide point-
ers to the chapters where you can find more detailed information.
InfoSphere BigInsights
BigInsights is deeply integrated throughout the IBM Big Data platform.
BigInsights can accept real-time input from Streams, such as insights or deci-
sions made by analytic algorithms deployed to the Streams run time, and
then perform additional analysis on a deeper data set (for example, to test
and remodel the algorithm for promotion back to Streams).
BigInsights is also integrated with the analytics-based IBM PureData Sys-
tems and other IBM data warehouse solutions, such as InfoSphere Warehouse.
This enables BigInsights to write data to a warehouse and to accept input
from it too. It’s also possible to access data in BigInsights by using SQL.
In-database functions that present SQL-wrapped user-defined functions
enable you to call a BigInsights job from within the database. (Note, however,
that the laws of physics apply here: You’re not going to leverage these func-
tions to pull trillions of rows across the network into your warehouse, you
more likely want to invoke a job and retrieve a scored result.) This integration
point is helpful when BigInsights is used to analyze raw data or to perform
experimental analysis, and then share insight with the data warehouse.
There’s integration between BigInsights and InfoSphere Information Server
(Information Server). Information Server can provide information to Hadoop
or take data from Hadoop and integrate it to any number of other systems.
BigInsights is also integrated with Guardium to provide real-time system
monitoring and security. InfoSphere Optim Masking Solution can mask
BigInsights data to ensure that it’s protected and secure. And InfoSphere
Optim can store archived data in BigInsights, making it available for analysis.
IBM Research has also developed integration points between MDM and
BigInsights, including the ability to analyze raw data and to determine which
master entities are to be loaded into MDM. You can find more details about
this integration in Chapters 5 through 8.
11-ch11.indd 240 04/10/12 11:54 AM
272.
Integrating Big Datain the Enterprise 241
Flash 6X9 / Harness the Power of Big Data:The IBM Big Data Platform / Zikopoulos / 817-5
InfoSphere Streams
Streams can provide real-time updates to BigInsights, which could be the
result of a Streams operation or a scored SPSS model. BigInsights is often
used in conjunction with Streams to provide deeper analysis of models,
which can be subsequently promoted and scored in Streams (a similar usage
pattern is discussed in Chapter 2).
Streams is integrated with various data warehouse solutions through a set
of database adapters that enable it to write insights to or filter data in a target
warehouse system. We often see Streams integrated with a warehouse for
deeper analysis, modeling, and discovery on structured data. In fact, Streams
has set load-optimized high-speed connectors that are deeply integrated
with the analytics-based IBM PureData Systems. These details are discussed
in Chapter 6.
Finally, Streams can share data with or supply input to Information Server,
from which it can be integrated with any number of systems, as required.
Data Warehouse Solutions
Data warehousing solutions are well integrated with the Information Integra-
tion and Governance (IIG) aspects of the IBM Big Data platform: information
integration for high-speed data loading and unloading; data quality to stan-
dardize and improve data; data lifecycle management for archiving and con-
trolling data growth, and for generating right-sized test data environments;
MDM systems to provide a single view of business entities; and privacy and
security monitoring to mask data and monitor database activity. Both the IBM
PureData System for Analytics and the IBM PureData System for Operational
Analytics have optimized integration points to many of the IIG solutions (we
cover these later in this chapter). Of course, as previously mentioned, the IBM
Big Data platform warehousing solutions also have integration points to both
BigInsights and Streams.
The AdvancedText AnalyticsToolkit
IBM ships the Advanced Text Analytics Toolkit as part of its Big Data plat-
form. This toolkit includes samples, built-in extractors that can be used in pro-
duction right away, an integrated development environment, a text-extraction
11-ch11.indd 241 04/10/12 11:54 AM
273.
242 Harnessthe Power of Big Data: The IBM Big Data Platform
Flash 6X9 / Harness the Power of Big Data:The IBM Big Data Platform / Zikopoulos / 817-5
declarative language calledAnnotated Query Language (AQL), a text analytics
engine and associated cost-based optimizer, and more. The Advanced Text
Analytics Toolkit is shipped with BigInsights and Streams, and enables you to
develop text analytics models on data at rest, and then transparently deploy
them on data in motion. You’ll find more details about this toolkit in Chapter 8.
InfoSphere Data Explorer
IBM InfoSphere Data Explorer (Data Explorer) is the new name for the prod-
uct set that was acquired when IBM bought Vivisimo in early 2012. Data
Explorer provides secure and highly accurate federated search and naviga-
tion of Big Data assets throughout the enterprise. It can be integrated with
BigInsights and Streams under two scenarios: data from BigInsights or
Streams can be accessed and shared with Data Explorer and its visualization
interface, or Data Explorer can consume data directly from BigInsights. Data
Explorer can also be integrated with InfoSphere Federation Server and be-
come part of its federated index of structured data repositories. You’ll find
more details about this Big Data technology in Chapter 7.
InfoSphere Information Server
IBM InfoSphere Information Server (Information Server) is one of the com-
ponents of the IBM Big Data platform. Information Server provides a gate-
way to the enterprise through its ability to integrate with multiple enterprise
systems. BigInsights is integrated with Information Server, which can load
data into BigInsights, or move data from BigInsights to other enterprise sys-
tems. Streams is also integrated with Information Server, enabling organiza-
tions to acquire real-time insights and load that data into a target system at
specified intervals.
Information Server is deeply integrated with the IBM PureData System for
Analytics; it has the “smarts” to push SQL-based transformations into its
field programmable gate array (FPGA)-assisted processing architecture (see
Chapter 4 for more information). Information Server is also integrated with
the IBM PureData System for Operational Analytics. Many clients are attracted
to the IBM PureData Systems because of the sheer simplicity of its approach.
The Information Server integration work that’s gone into the IBM Big Data
platform ensures that clients realize the benefits of a trusted information
11-ch11.indd 242 04/10/12 11:54 AM
274.
Integrating Big Datain the Enterprise 243
Flash 6X9 / Harness the Power of Big Data:The IBM Big Data Platform / Zikopoulos / 817-5
infrastructure as quickly as possible. In Chapter 10, we provide an example
that illustrates the Information Server design canvas, using drag-and-drop
gestures to create a flow that involves a Hadoop data source.
InfoSphere Data Replication integrates with the analytics-based IBM Pure-
Data Systems through its low-impact, low-latency database monitoring that
provides real-time replicated data to either repository. IBM’s Information Inte-
gration satisfies the batch and real-time integration requirements of Big Data
projects, because it captures rich design and operational metadata to support
data lineage and data governance analysis. This enables business and IT users
to understand how enterprise data is being used within the Big Data platform.
And because the Big Data platform can leverage Information Integration in
this way, Big Data projects can leverage just about any data source that matters.
InfoSphere Master Data Management
IBM has demonstrated BigInsights working with the IBM InfoSphere Master
Data Management (MDM) suite of products. This work was done by the IBM
Research team in conjunction with a number of clients who wanted to draw
on events and entity resolution from Big Data sources to populate master
profiles in the enterprise. BigInsights is used to analyze raw data and to
extract entities, such as customers and suppliers, for entity analysis algo-
rithms. The data is then further refined (identifying relationships between
entities, for example) before being loaded into the MDM system.
The MDM probabilistic matching engine has also been integrated with
BigInsights, enabling matching on Big Data sets. Raw data is refined and
structured, and then matched against other records. Many customers ask
about the use of Big Data with MDM. The link is a natural one. Think of
MDM as “bookending” the process; it can provide clean master data entities
to a Big Data system for further analysis, and the insight gleaned from the
Big Data system can be fed back to MDM for action.
InfoSphere Guardium
InfoSphere Guardium Database Security (Guardium) is IBM’s leading data
activity monitoring (DAM) solution, whose benefits were recently extended to
Hadoop. Guardium integrates with BigInsights as well as open source Hadoop,
to monitor Hadoop systems and to ensure the security of your enterprise’s
11-ch11.indd 243 04/10/12 11:54 AM
275.
244 Harnessthe Power of Big Data: The IBM Big Data Platform
Flash 6X9 / Harness the Power of Big Data:The IBM Big Data Platform / Zikopoulos / 817-5
Big Data. Of course, Guardium has been integrated with relational systems
for a long time, enabling it to monitor and protect structured Big Data. As
we’ve said before: if governance is needed for an important warehouse envi-
ronment, it’s needed in Big Data land as well. We cover some of the details of
how Guardium can be used to secure Hadoop and more in Chapter 10.
InfoSphere Optim
The InfoSphere Optim (Optim) suite of products offers industry-leading
data growth management, test data management, and security capabilities.
It has long helped data warehouse systems control Big Data growth through
archiving. It’s also ensured efficient test data management by generating
right-sized test data sets. Moreover, it has ensured the security of sensitive
test data through masking, the practice of using realistic (but not real) data
in test environments.
All of these capabilities can be extended to new Big Data technologies.
For example, Optim works with Hadoop; it can mask data within a Hadoop
system. Big Data systems have sensitive data too, sometimes more so than
other systems. Masking ensures that sensitive Big Data isn’t compromised.
Optim can also take archived data from other target systems (operational
applications, data warehouses, and so on) and store that data in Hadoop,
where it can be analyzed.
Optim is also deeply integrated with the various flavors of the pattern-
built IBM PureData Systems, offering an optimized connector to archive
data and to generate right-sized test data deployments for these systems.
We discuss many of these integration points in Chapter 10.
WebSphere Front Office
IBM WebSphere Front Office (Front Office) is made up of integrated compo-
nents for receiving, consolidating, and distributing market data to front,
middle, and back-office applications within financial organizations. This
robust product offers flexibility and reliability in virtually any customer
environment. Streams is integrated with Front Office, which provides
Streams with real-time insights and data feeds.
11-ch11.indd 244 04/10/12 11:54 AM
276.
Integrating Big Datain the Enterprise 245
Flash 6X9 / Harness the Power of Big Data:The IBM Big Data Platform / Zikopoulos / 817-5
WebSphere Decision Server: iLog Rules
Big Data processing often requires complex rules for data analysis, and rules
deployment has rightfully received significant enterprise focus in the last
few years. Your Big Data environments can leverage WebSphere Decision
Server (iLog Rules) to build smarter application flows. Our research teams
have shown how to use iLog Rules with Streams to analyze a data stream
based on conditions and vectors that are passed by iLog Rules (we expect to
say a lot more in this space after the book is published—our lawyers won’t
let us detail it just yet).
Rational
Job and application development lifecycle management is often overlooked
in Big Data environments, which is a costly mistake. Eclipse is a pluggable
integrated development environment (IDE) that was invented and donated
to the open source community by IBM. Eclipse is used extensively in the
open source Big Data technologies, as well as the IBM Big Data platform.
The IBM Big Data platform provides plug-ins for the development of
Streams Processing Language (SPL) flows, SQL, Java MapReduce, Hive, Pig,
Jaql, AQL-based text analytics, and more. These plug-ins are installable either
from an open source Eclipse installation or from Eclipse-based value-add
offerings such as Rational Application Developer (RAD). The IBM Big Data
platform extends the Eclipse IDE with out-of-the-box plugs-ins for Streams
and BigInsights that can leverage underlying Eclipse project artifacts. These
artifacts, in turn, can be managed by extended Rational tool sets for version
control (such as Rational ClearCase or Rational ClearQuest), collaboration
(such as Rational JAZZ), or for enterprise-class lifecycle management.
Data Repository-Level Integration
If the Big Data platform is to work effectively, data must be shared among the
various repositories within the platform. The many integration points are
described in this chapter and throughout this book (see Chapter 5 and Chap-
ter 6). Remember, the business process doesn’t start and stop within the Big
Data platform—data must be shared with other repositories and platforms.
11-ch11.indd 245 04/10/12 11:54 AM
277.
246 Harnessthe Power of Big Data: The IBM Big Data Platform
Flash 6X9 / Harness the Power of Big Data:The IBM Big Data Platform / Zikopoulos / 817-5
Enterprise Platform Plug-ins
A platform must be an open system into which third-party products can be
plugged. IBM’s Big Data platform is exactly that. At the time of writing, IBM
has well over 100 Big Data partners! Rather than attempt to detail specifics,
in the remainder of this section, we describe some of the partnership catego-
ries of integration.
DevelopmentTooling
IBM has several partners who have development tools for specific processes
and components. There are a few partners with specialized development
tools for BigInsights. IBM has partners, such as Datameer, which provides
Big Data visualization capabilities, and Karmasphere, which provides data
analysts with a development and visualization tool for data analysis on top
of Hadoop.
Analytics
As described earlier in this chapter, there are several analytic applications
and engines within IBM that are integrated with the Big Data platform. There
are also analytic engines that can be integrated with the Big Data platform as
components. Several open source analytic components have been integrated
with the Big Data platform for client engagements: video analytics, audio
analytics, and statistical analytics, among many others.
Visualization
Several IBM partners specialize in visualization of Big Data. Some focus on
visualization of Hadoop-system data, others on visualization of structured
data in warehouse appliances, and some others on visualization of data in
motion. We’ve covered some examples in the previous section on analytic
applications, such as Cognos Consumer Insights (CCI), which visualizes social
media data for consumer sentiment and trend analysis. In fact, a famous food
and beverage company ended up detecting negative sentiment about their
recent environmentally friendly packaging change, which was met with a
backlash of sentiment, manifesting itself in thousands of YouTube videos and
11-ch11.indd 246 04/10/12 11:54 AM
278.
Integrating Big Datain the Enterprise 247
Flash 6X9 / Harness the Power of Big Data:The IBM Big Data Platform / Zikopoulos / 817-5
Facebook pages complaining about how noisy the new packaging was with
over 50,000 followers! They used CCI to discover what was being said. CCI
runs on top of BigInsights, which is used to discover and analyze why they
are saying it.
Wrapping It Up
A Big Data platform and the applications that are built upon it aren’t meant
to be a silo. To be actionable, the insights that are derived from Big Data must
be shared, and the platform that’s most capable of integration is the one that
delivers the most value. IBM’s Big Data platform has numerous integration
points with analytical applications, enterprise applications, enterprise repos-
itories, and platform plug-ins, making it the most comprehensive Big Data
platform in terms of functionality and integration capabilities.
Figure 11-1 illustrates the effectiveness of integration, and showcases what
IBM has accomplished with its Big Data platform.
In this example, multiple sources of customer interaction data are being
analyzed. Web site logs and social media feeds are being analyzed in
InfoSphere Master
Data Management
Business Processes
IBM Big Data Platform
Call Detail
Records
(CDRs)
Call Behavior and
Experience Insight
Data
Warehousing
Website Logs
Social Media
InfoSphere Streams
InfoSphere BigInsights
Web Traffic and
Social Media Insight
Events and
Alerts
InfoSphere
Information Server
Cognos Consumer
Insight
Campaign
Management
Websi
Figure 11-1 The value of integration in a 360-degree multichannel customer sentiment
analysis project
11-ch11.indd 247 04/10/12 11:54 AM
279.
248 Harnessthe Power of Big Data: The IBM Big Data Platform
Flash 6X9 / Harness the Power of Big Data:The IBM Big Data Platform / Zikopoulos / 817-5
BigInsights. Business users can visualize that analysis by using Cognos
Consumer Insights. Information Server feeds any resulting insights to the
data warehouse for further modeling and analysis. In parallel, real-time call
detail reports (CDRs) are being analyzed by Streams, and Information Serv-
er feeds any resulting insights to the data warehouse. MDM technologies
provide a single view of the customer as the starting point for analysis in
BigInsights, Streams, and the data warehouse, and it can also be the place to
operationalize any insights. Finally, campaign management systems, such
as Unica, are integrated with data warehouse solutions to perform deep
analysis (for example, a customer retention campaign offer) and to execute
the campaigns.
11-ch11.indd 248 04/10/12 11:54 AM
280.
Additional Resources forBig Data Skills
BigInsights Wiki
Rely on the wide range of IBM experts, programs, and services that are avail-
able to help you take your Big Data skills to the next level. Participate in our
online community through the BigInsights wiki. Find white papers, videos,
demos, downloads of BigInsights, links to social media sites, all the latest
news, and more.
Visit ibm.com/developerworks/wiki/biginsights
Information Management Bookstore
Find the electronic version of this book and links to the most informative
Information Management books on the market, along with valuable links
and offers to save you money and enhance your skills.
Visit ibm.com/software/data/education/bookstore
BigData University
Learn about Hadoop and other technologies at your pace and at your place.
BigData University offers helpful online courses with instructional videos
and exercises to help you master new concepts. Course completion is marked
with a final exam and a certificate.
Visit bigdatauniversity.com
IBM Data Management Magazine
IBM Data Management magazine delivers new kinds of interactive, highly
dynamic content, such as webinars and videos. It also provides a platform on
which to create a strong community of the world’s top information manage-
ment professionals and a broader range of voices from across the industry.
Visit ibmdatamag.com
IBM Certification and Mastery Exams
Find industry-leading professional certification and mastery exams. Mastery
exams are available for BigInsights (M97) and InfoSphere Streams (N08).
Visit ibm.com/certify/mastery_tests
12-backmatter.indd 249 04/10/12 12:03 PM
281.
IBMTraining Services
Find cost-effectiveand green online learning options, such as private onsite
training, as well as traditional classroom, all taught by our experienced,
world-class instructors.
• InfoSphere BigInsights Analytics for Business Analysts (DW640,
2 days)
• InfoSphere BigInsights Analytics for Programmers (DW651, 2 days)
• InfoSphere BigInsights Foundation (DW611, 2 days)
• Administration of InfoSphere Streams v2 (DW730, 2 days)
• Programming for InfoSphere Streams (DW722, 4 days)
For a summary of Big Data training services, visit
ibm.com/software/data/education/bigdata.html
For information on the broad range of software services that we have to
support Big Data, visit
ibm.com/software/data/services/offerings.html
Information Management Subscription and Support
Access the award-winning IBM Support Portal to find technical support
information for Information Management products, including downloads,
notifications, technical documents, flashes, alerts, and more.
Visit ibm.com/support
12-backmatter.indd 250 04/10/12 12:03 PM


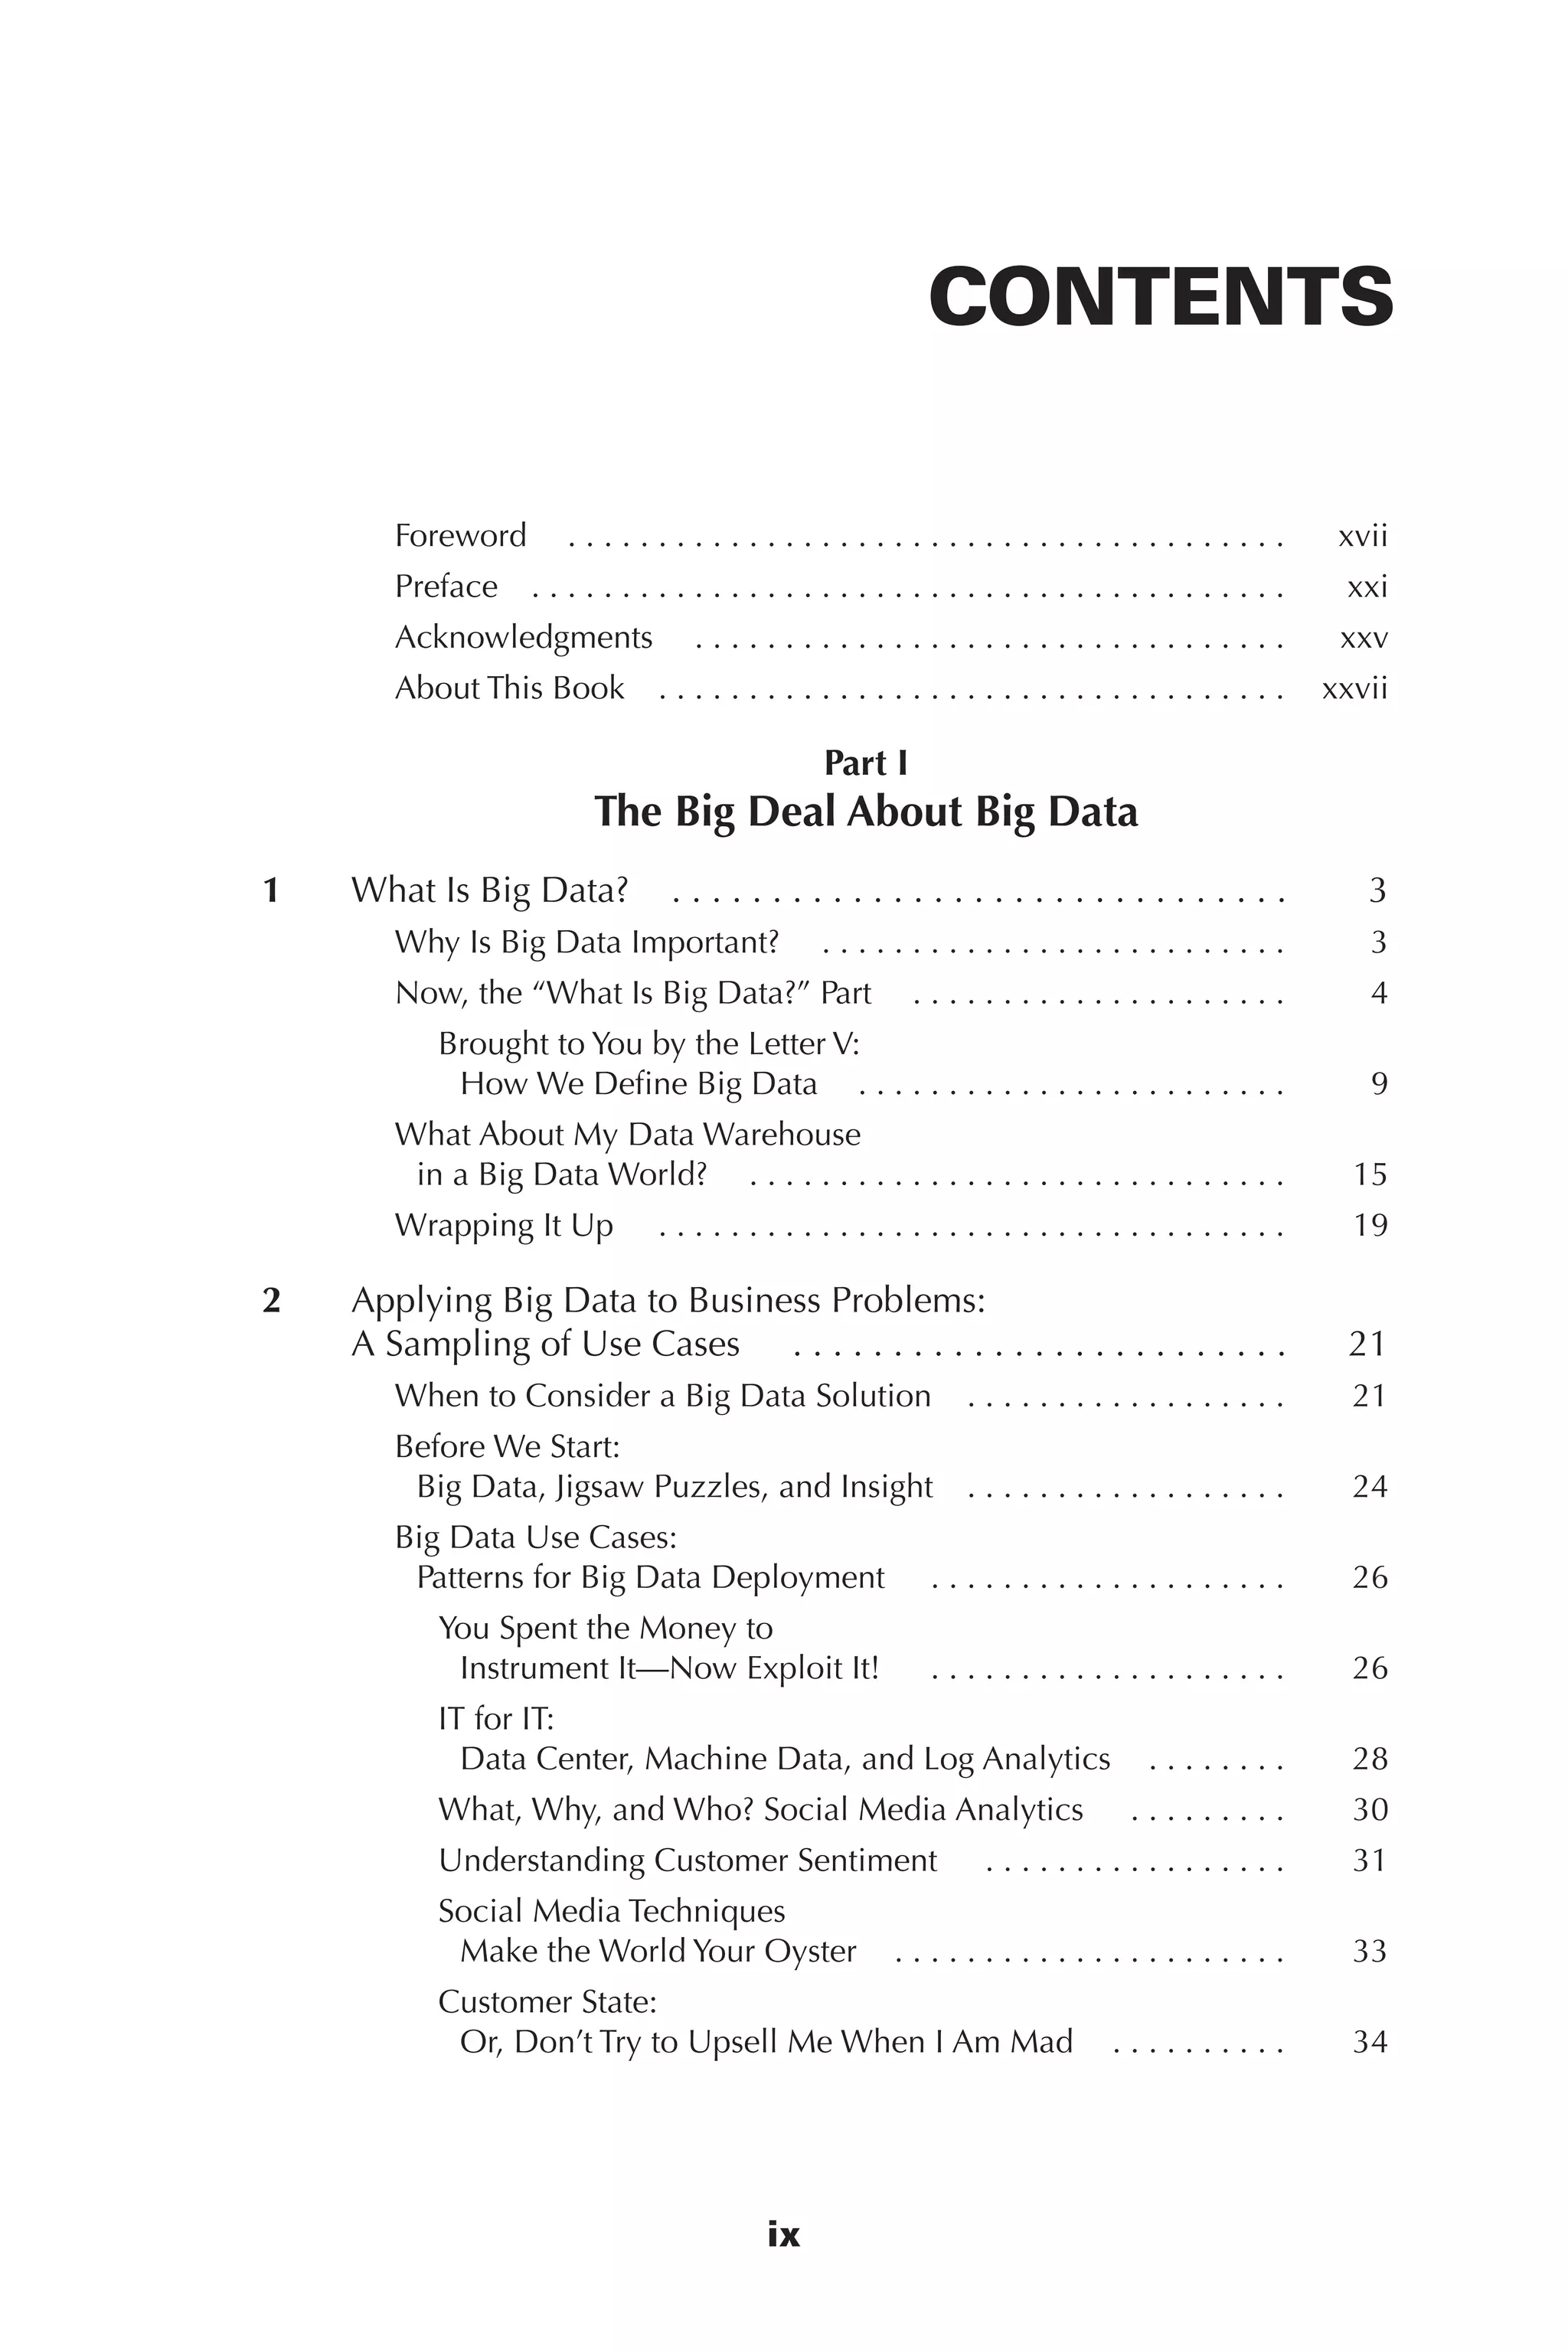


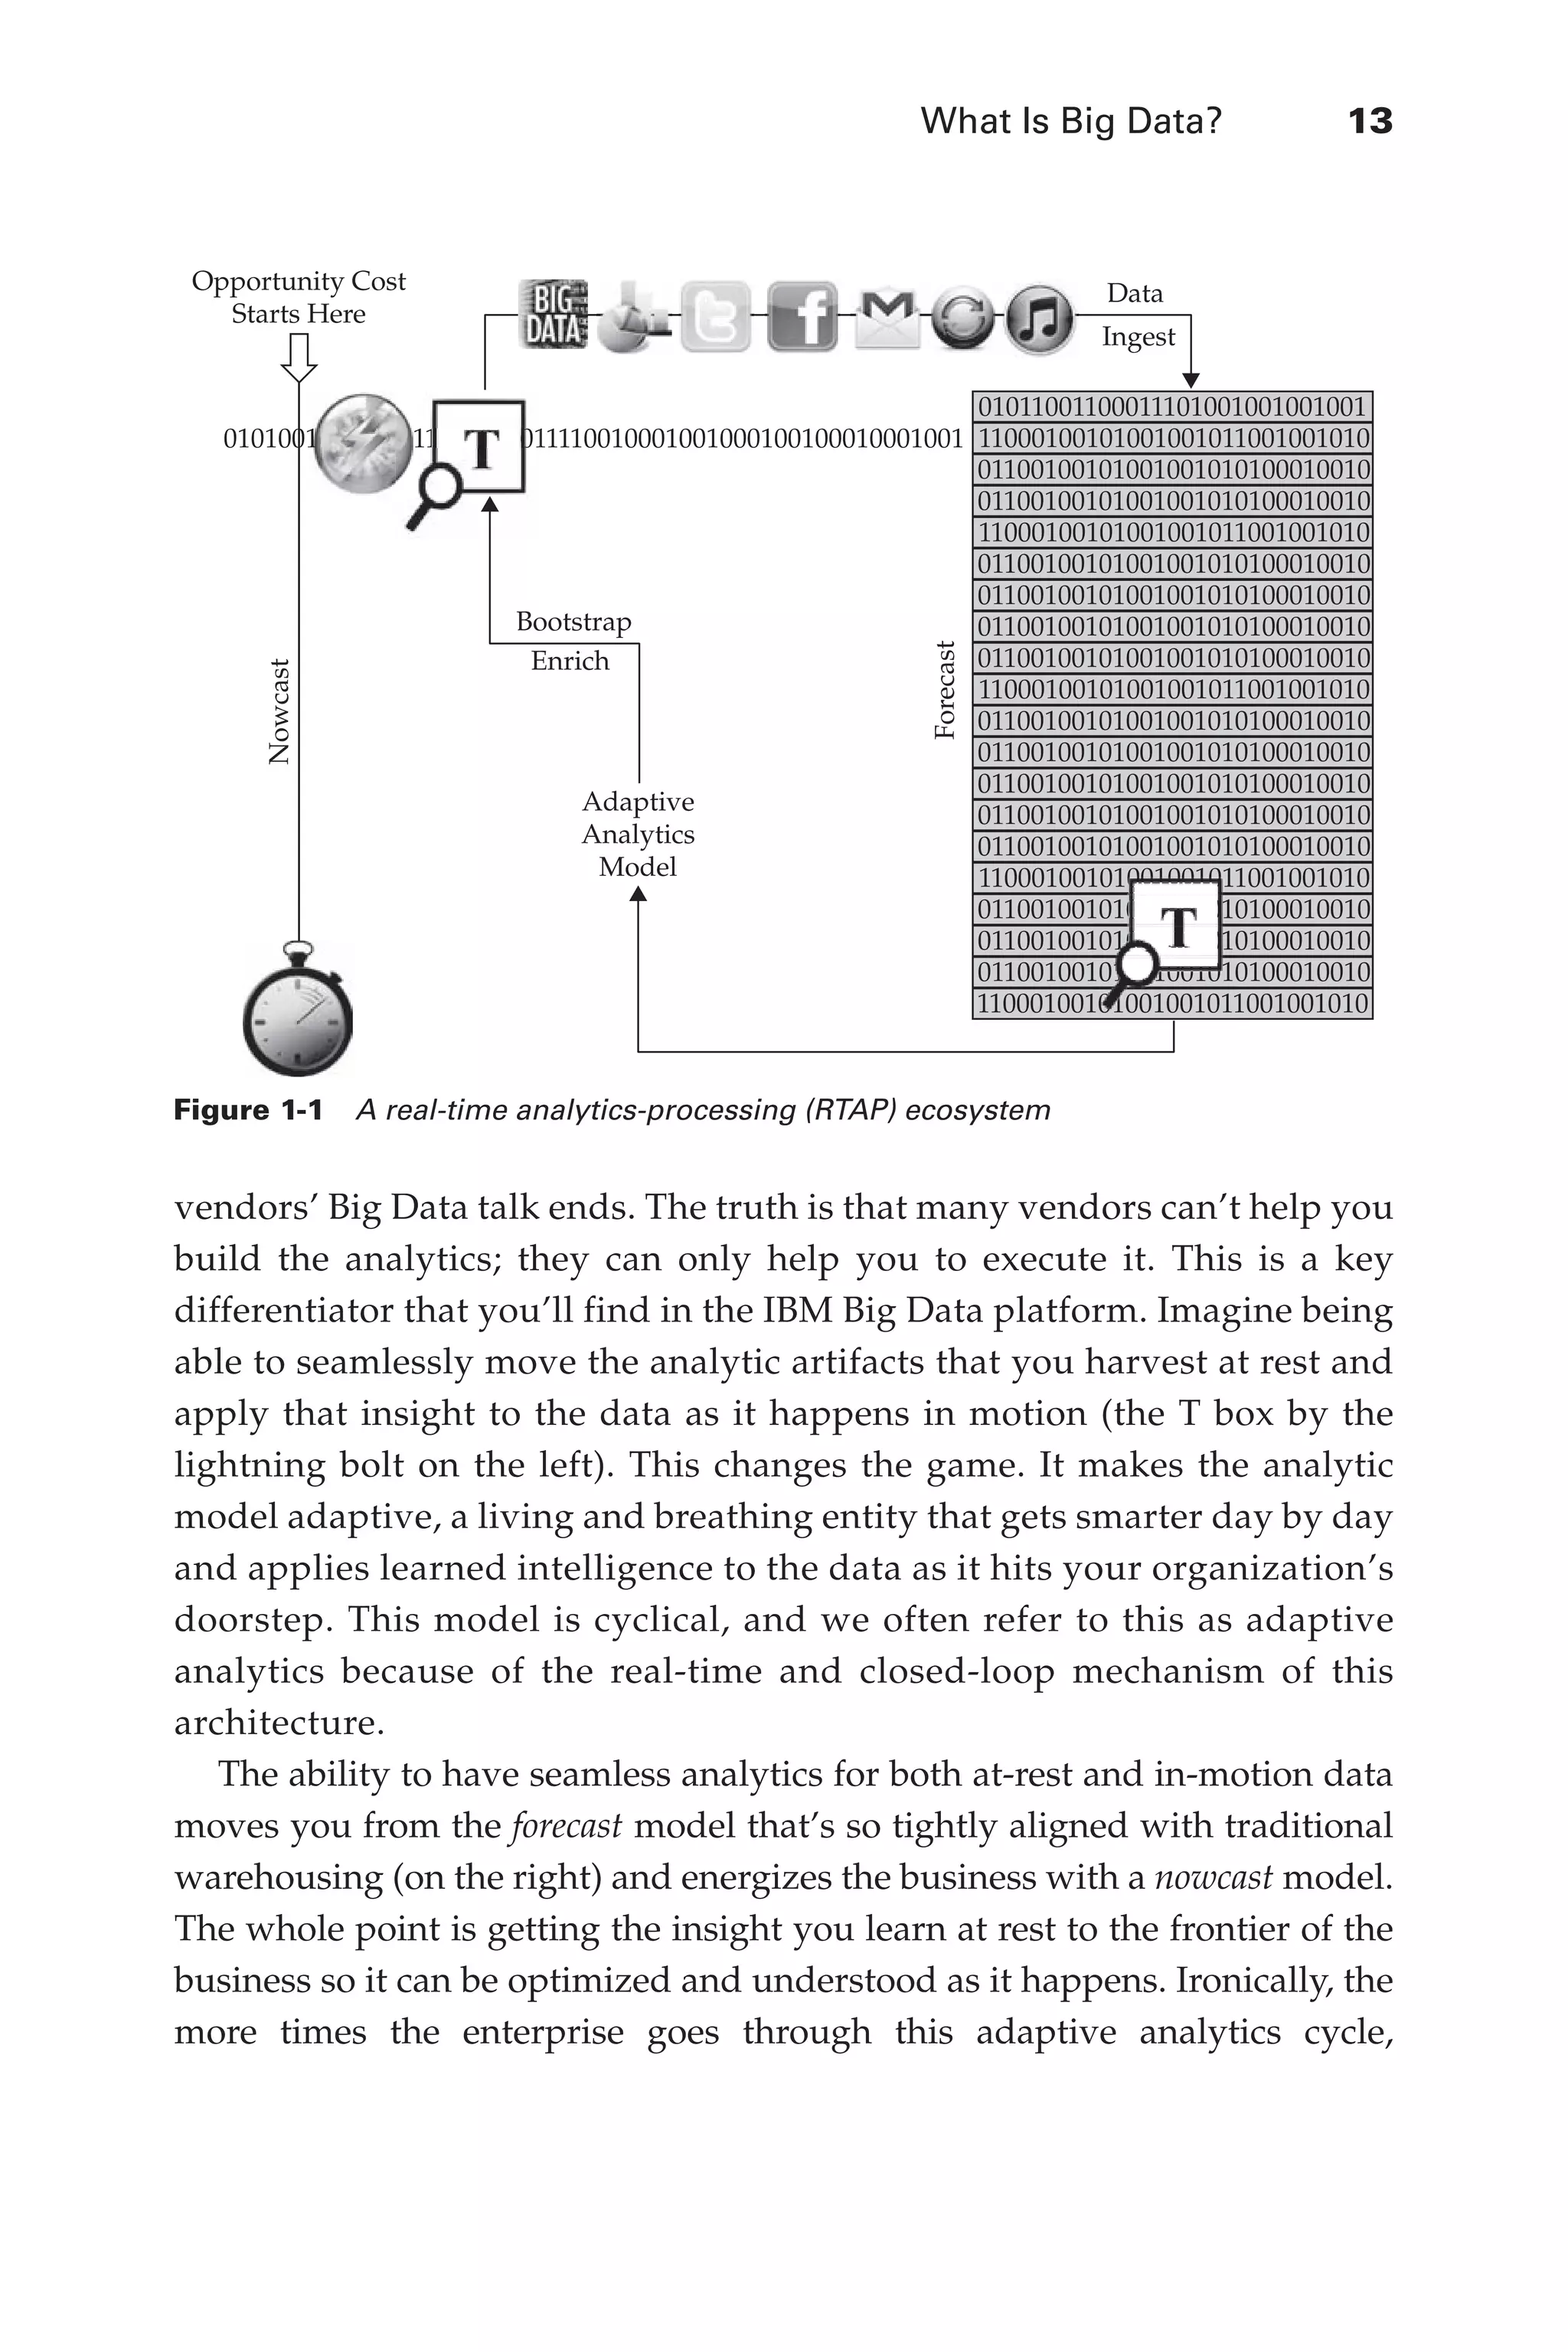
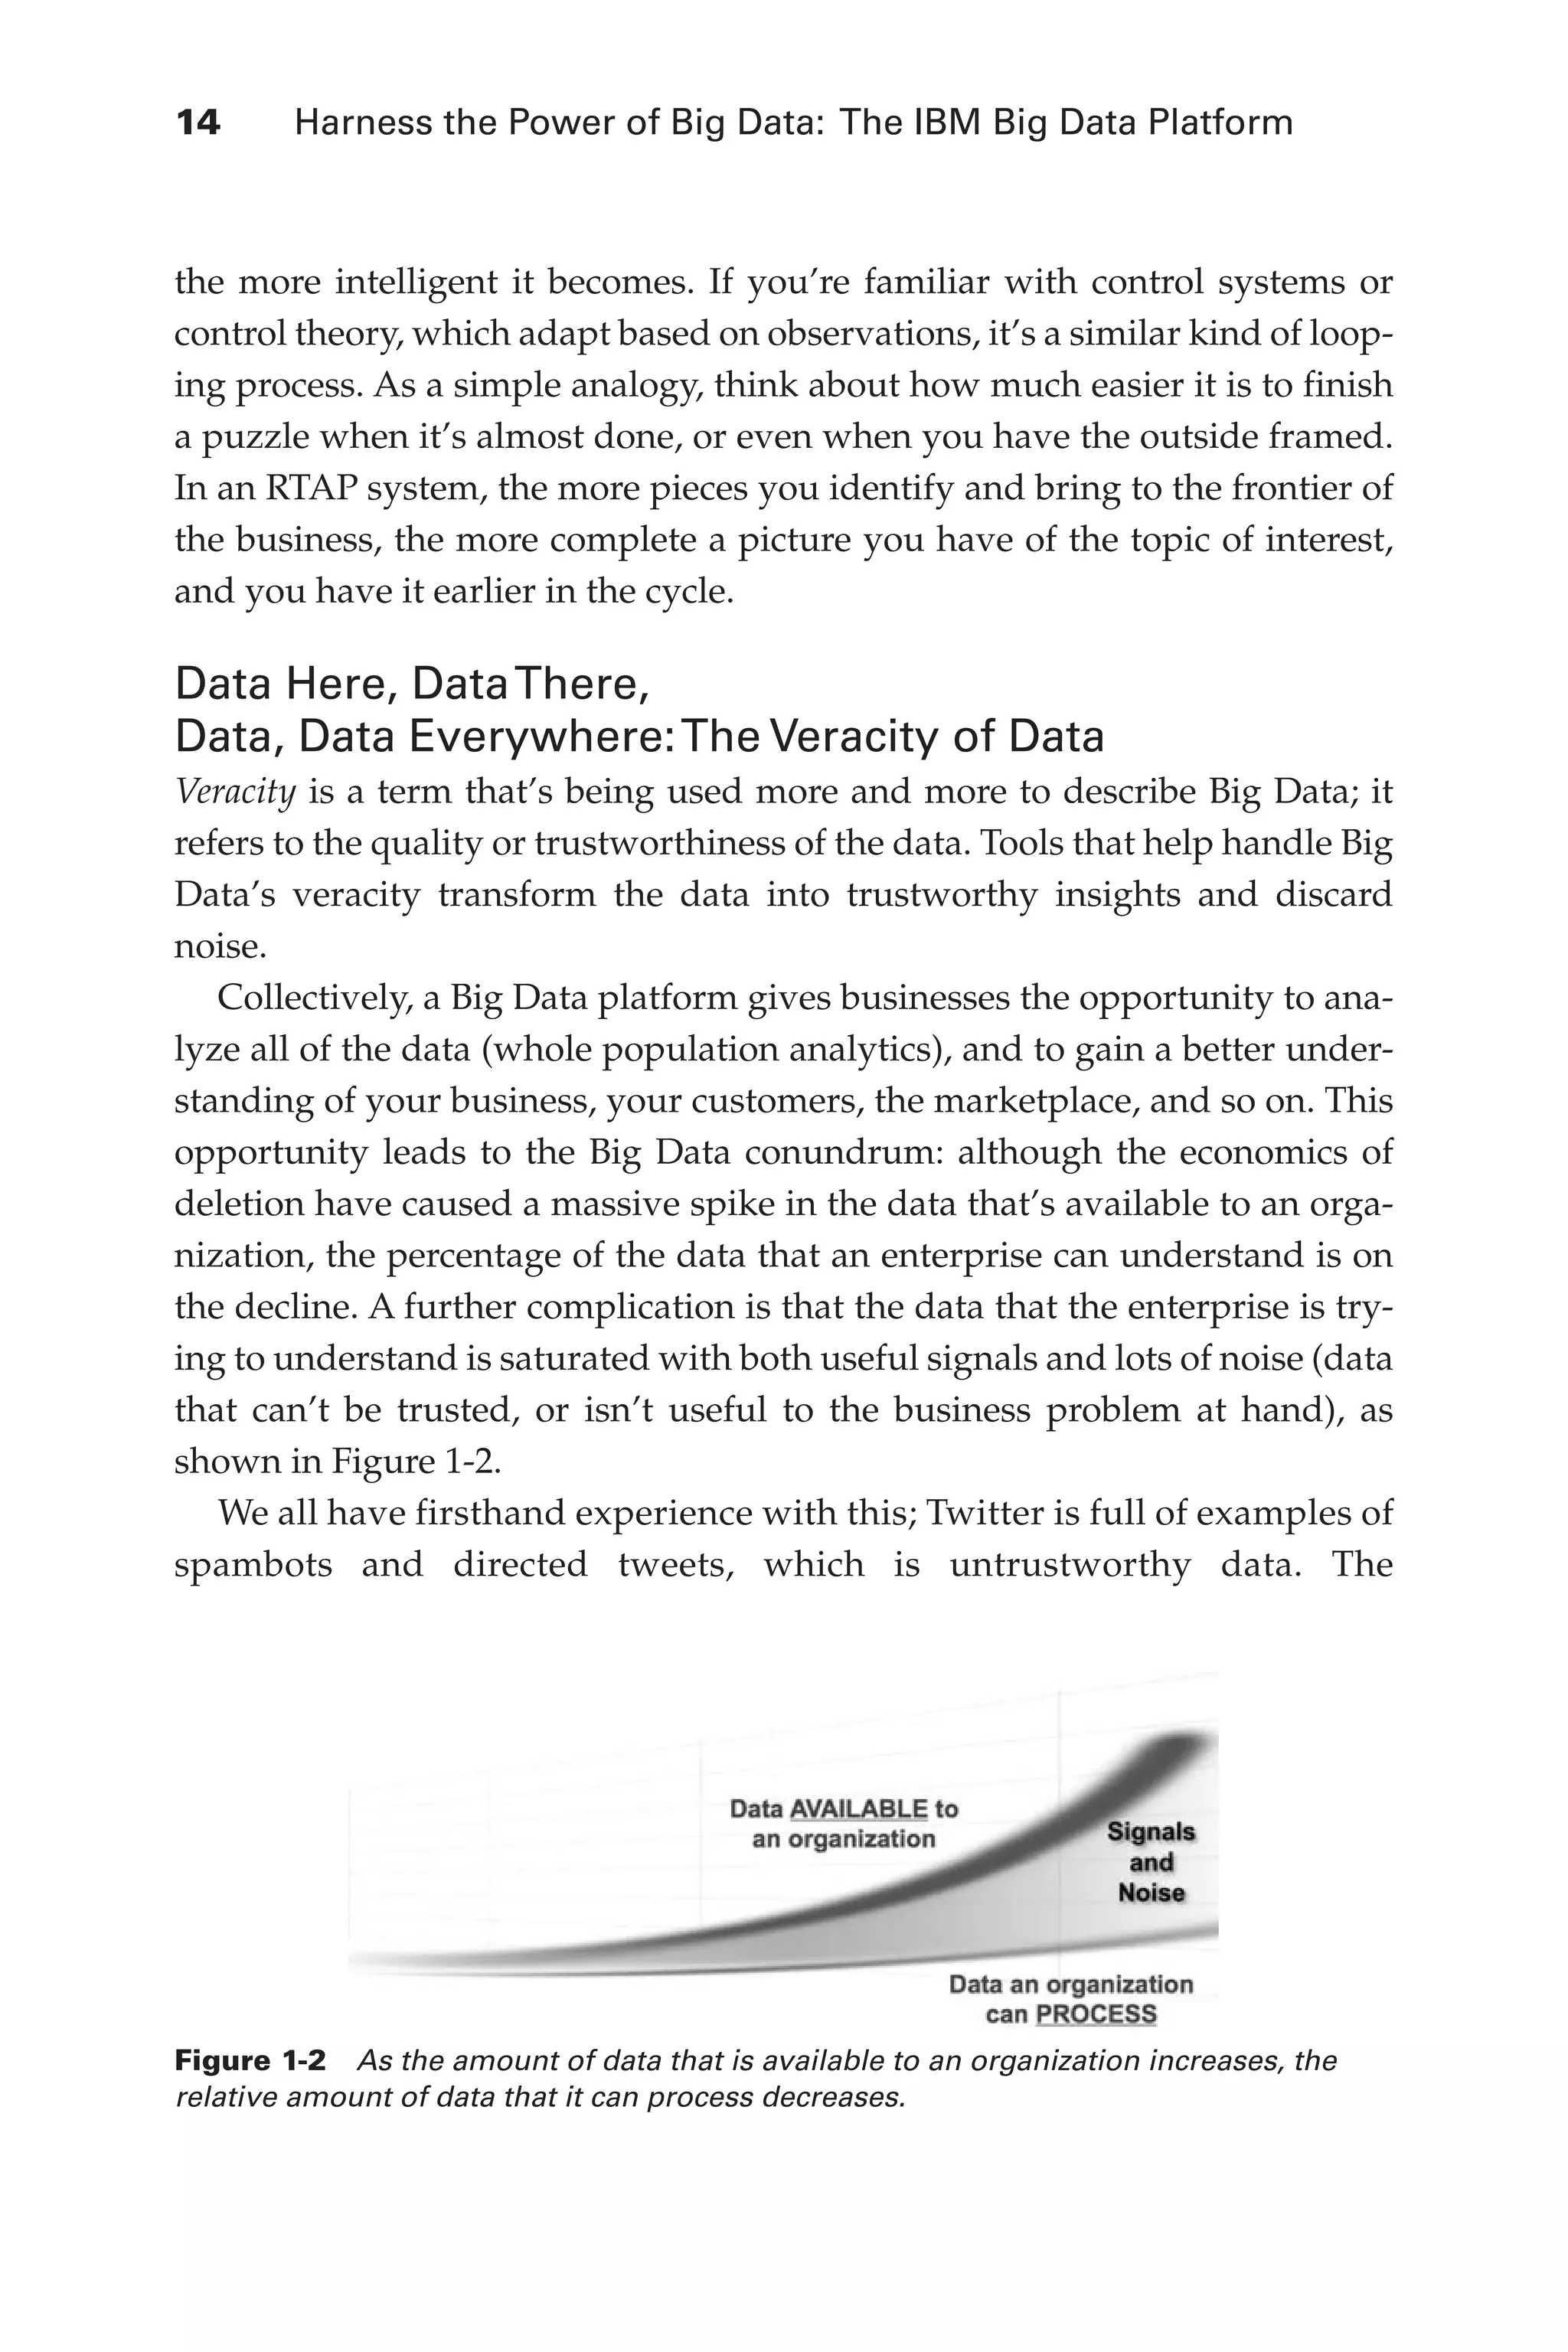


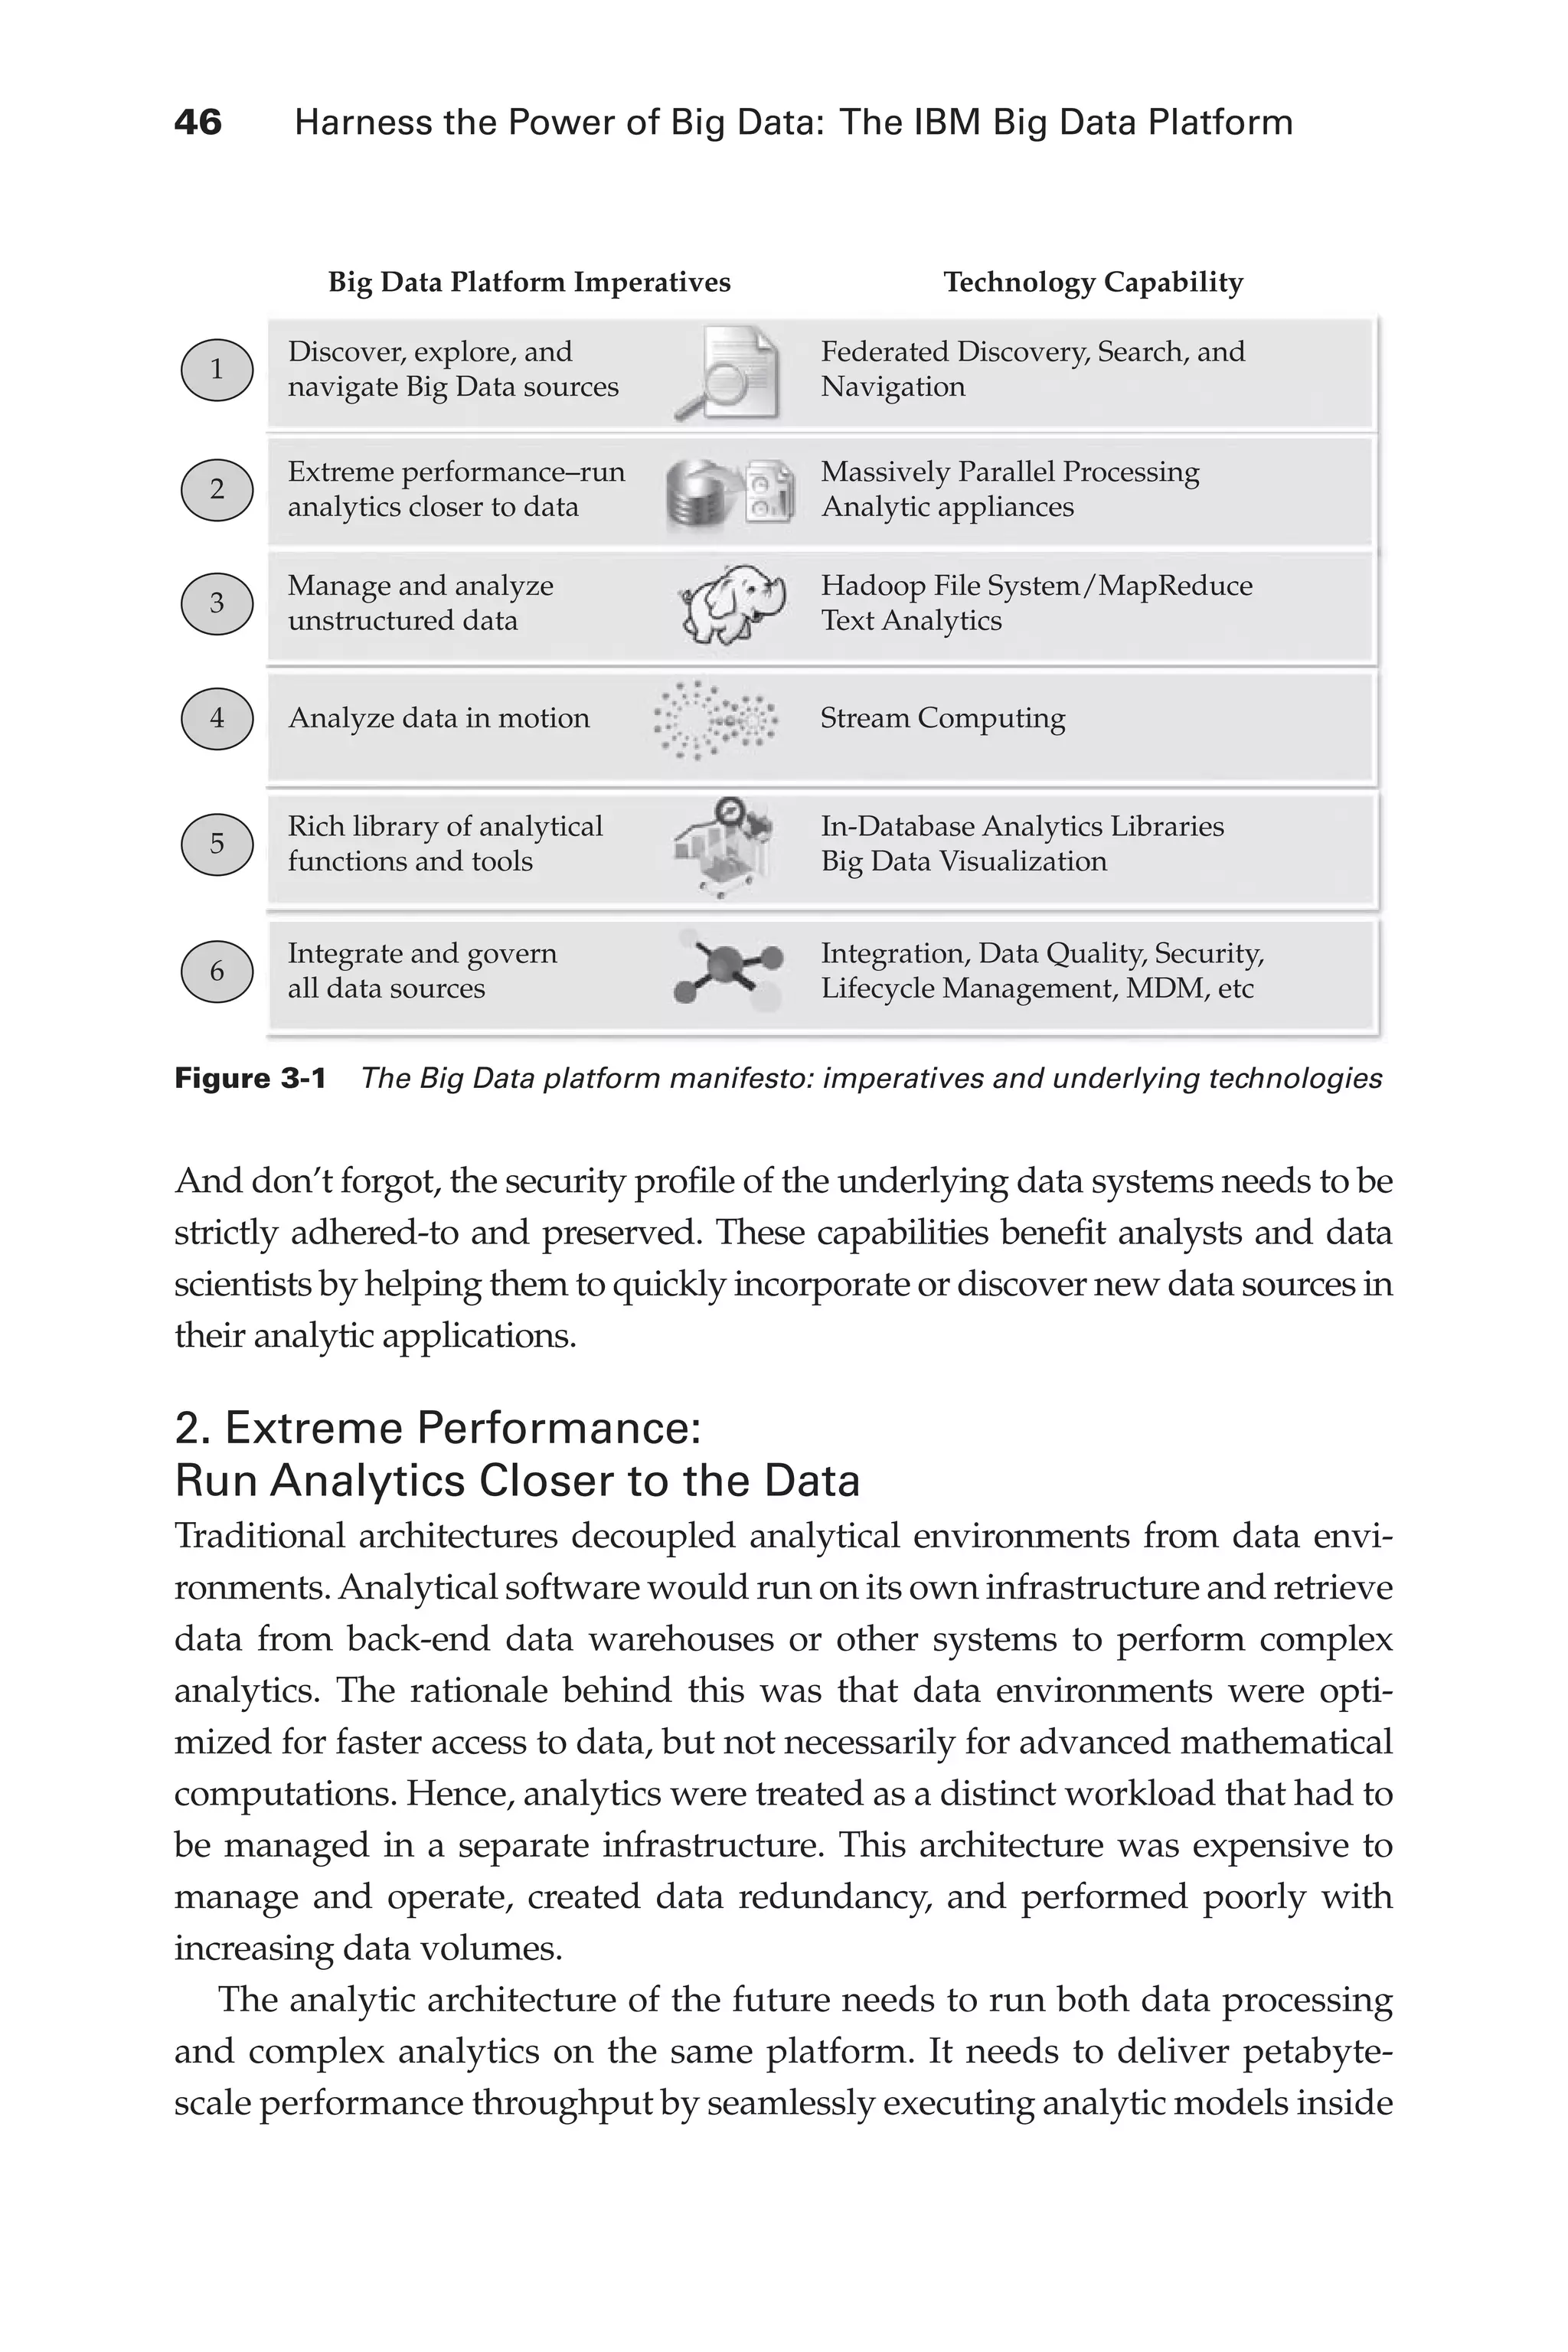
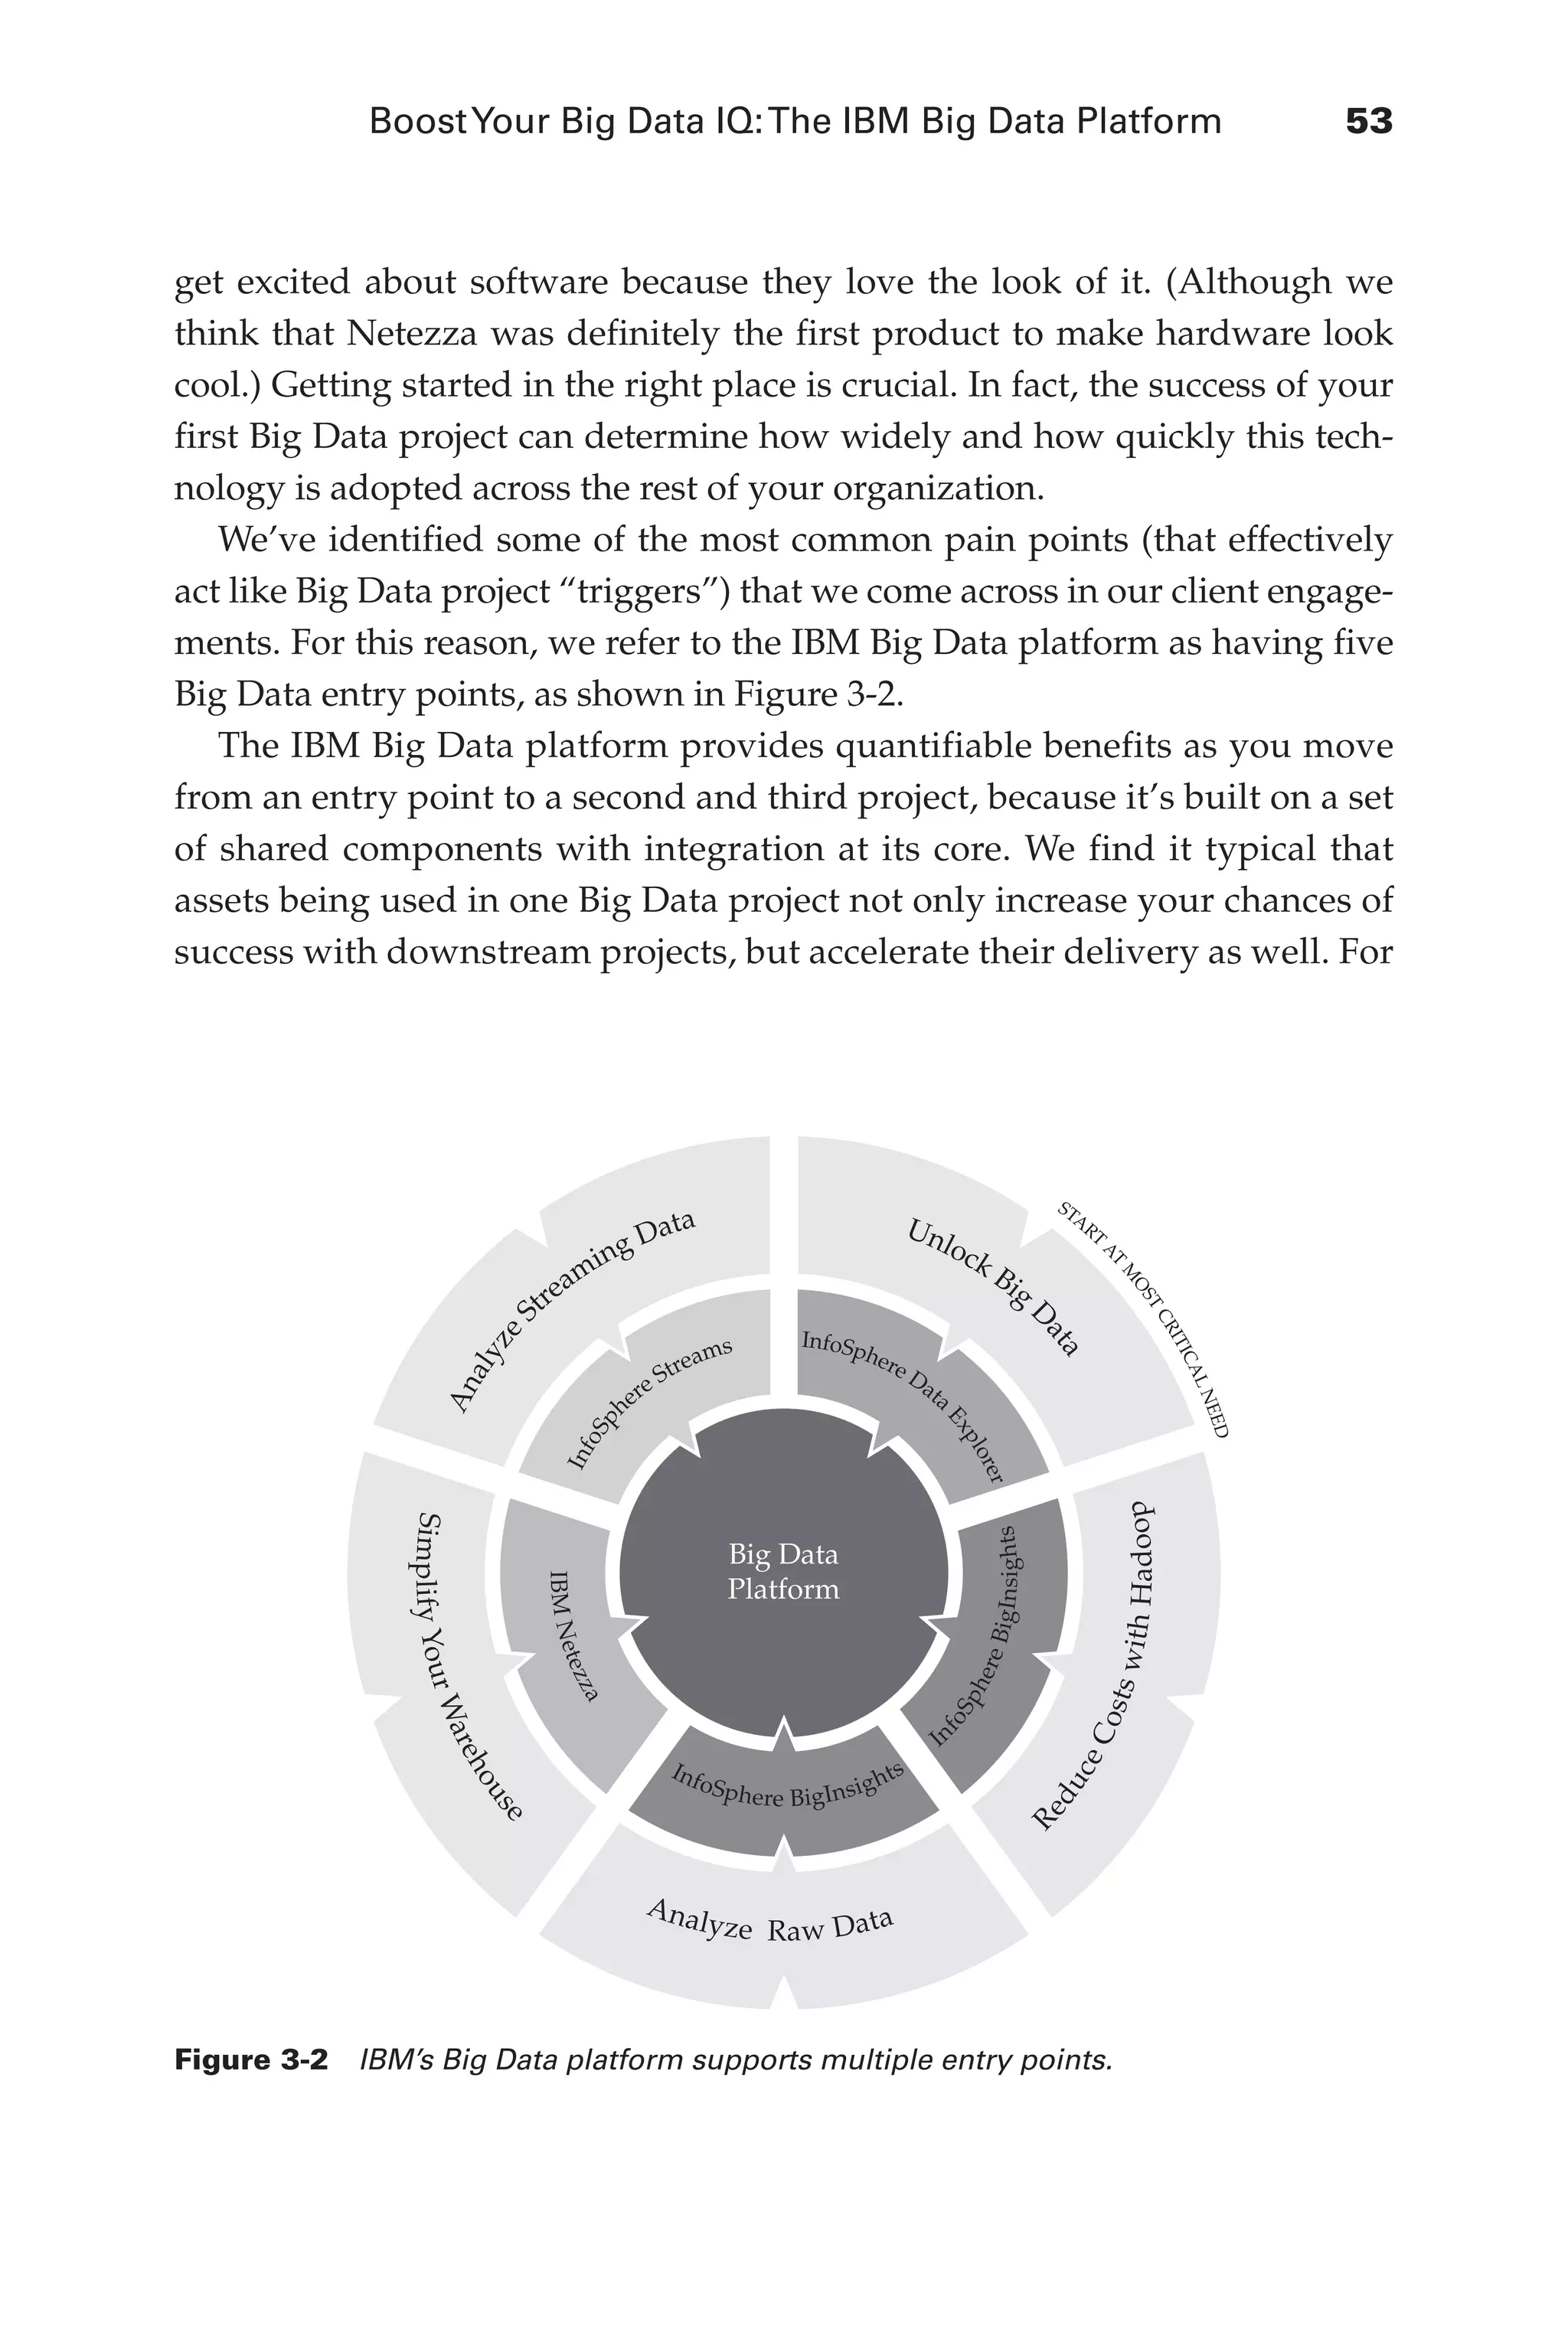
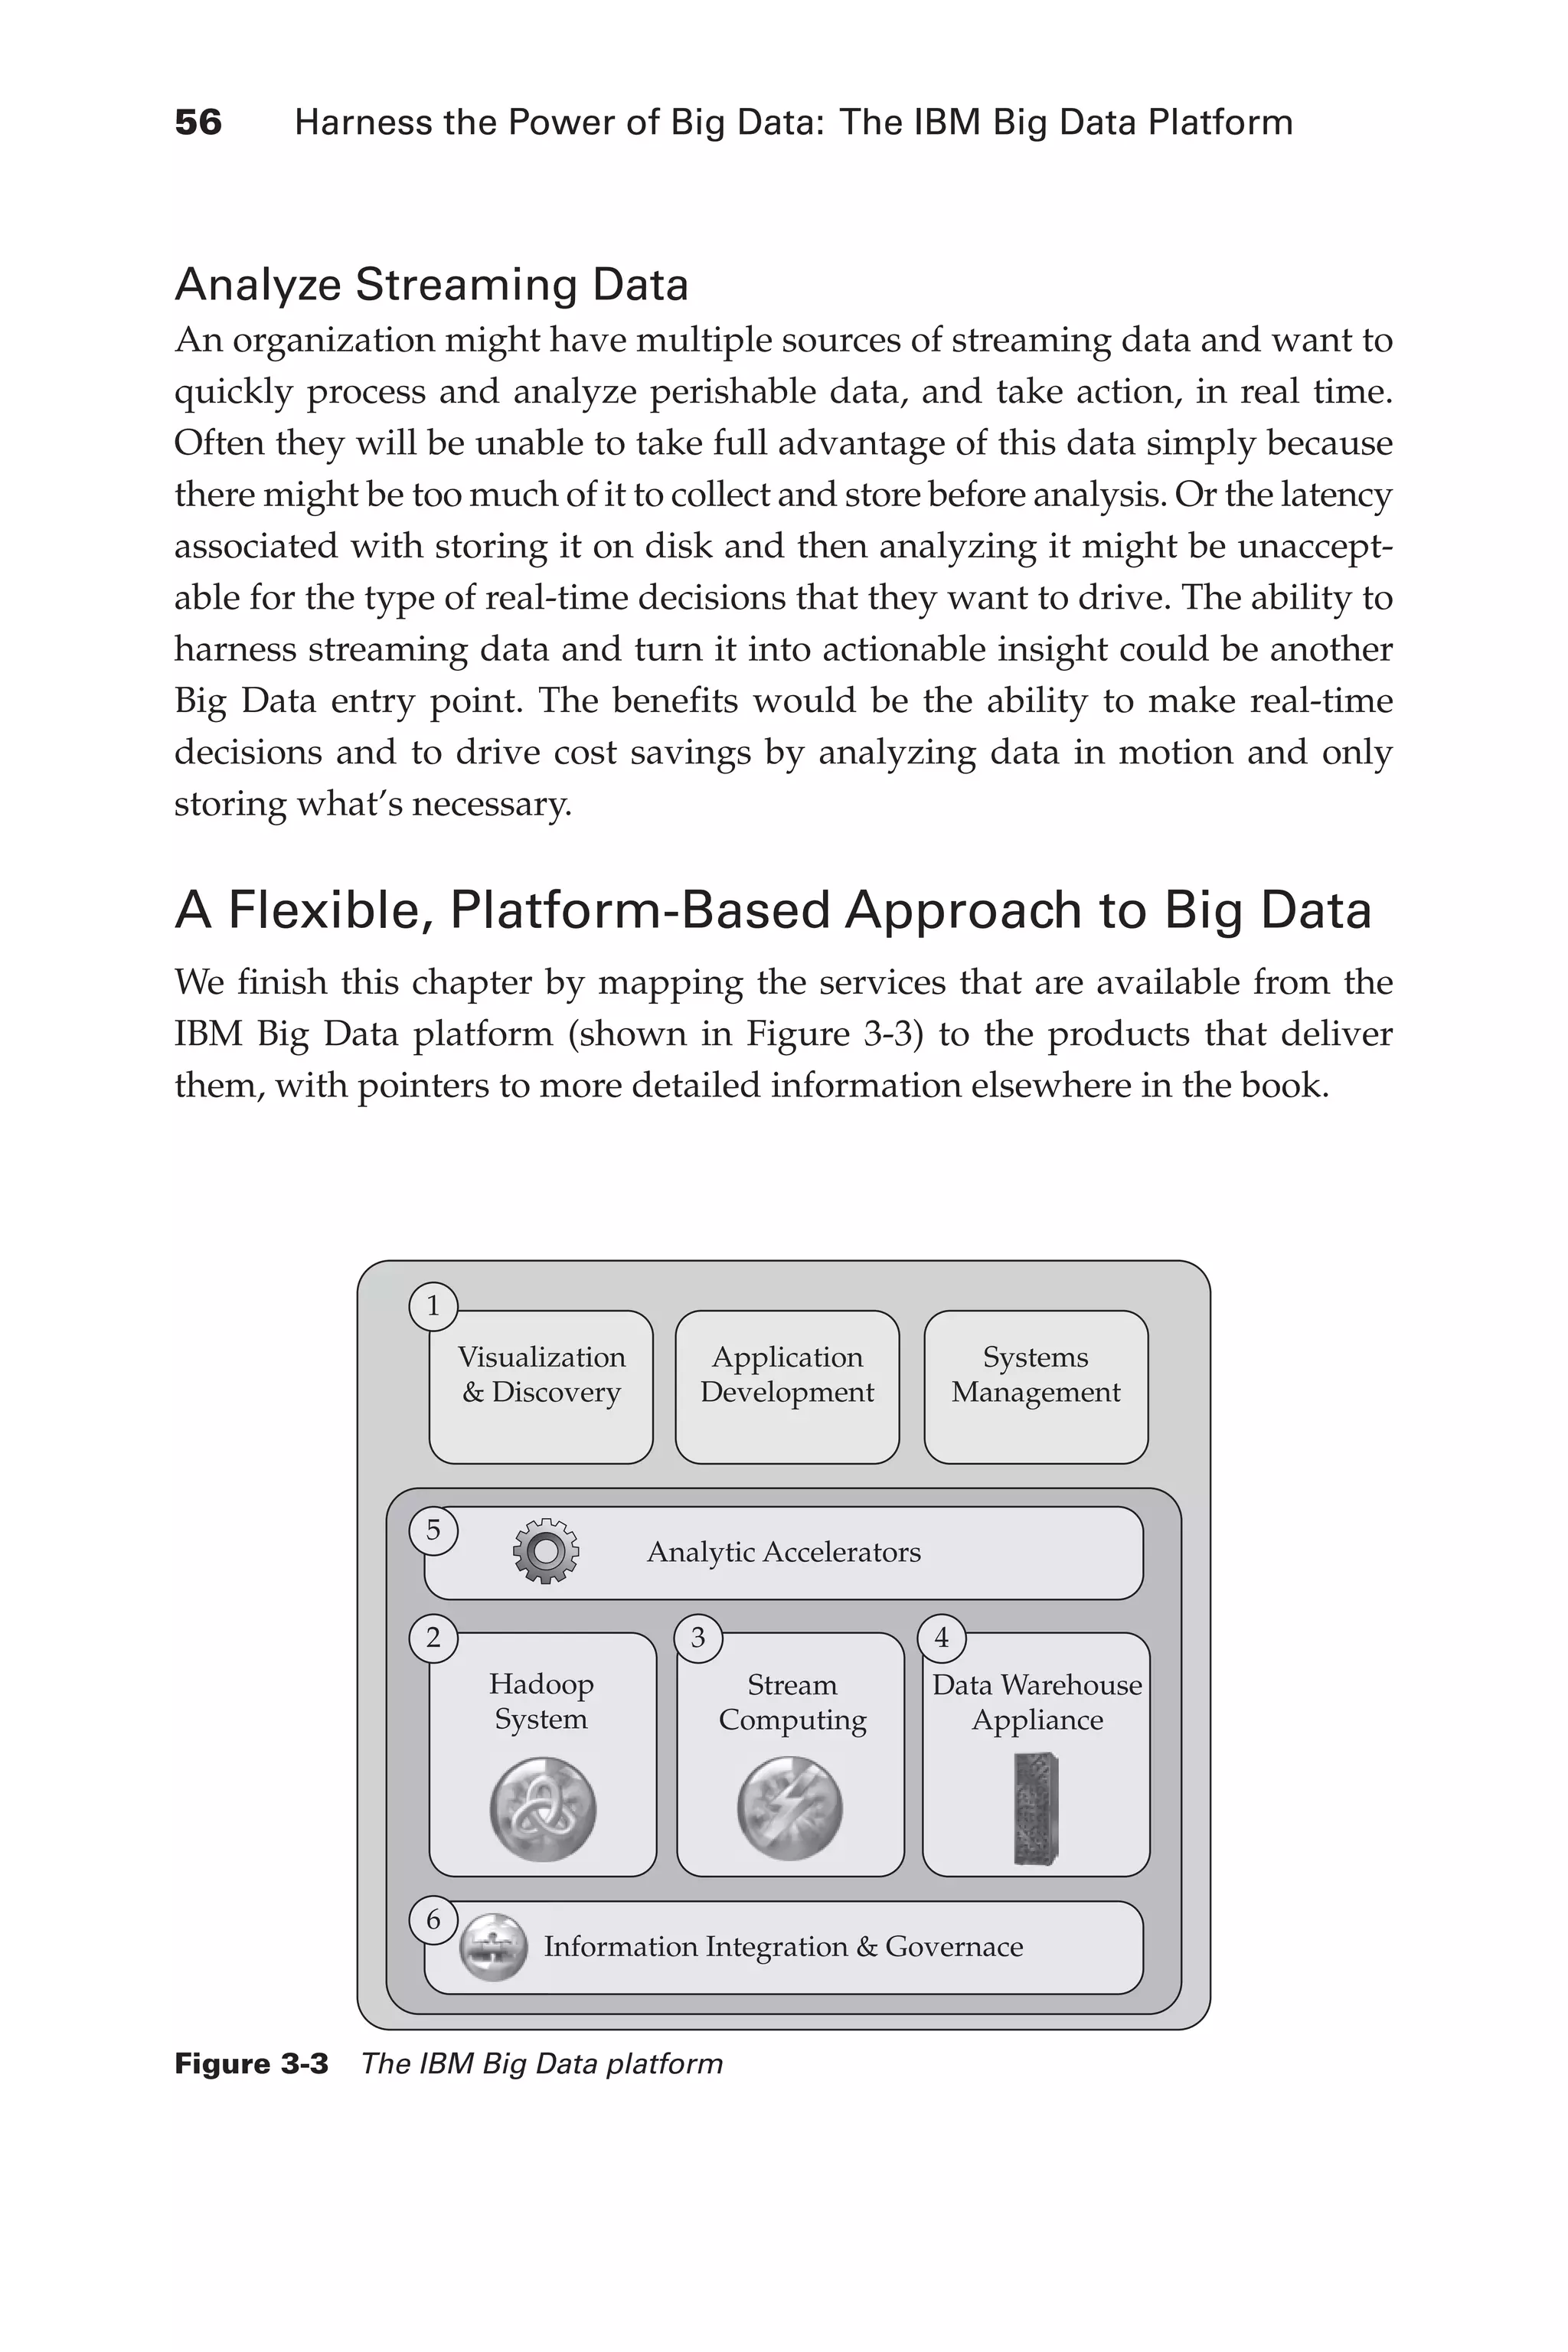


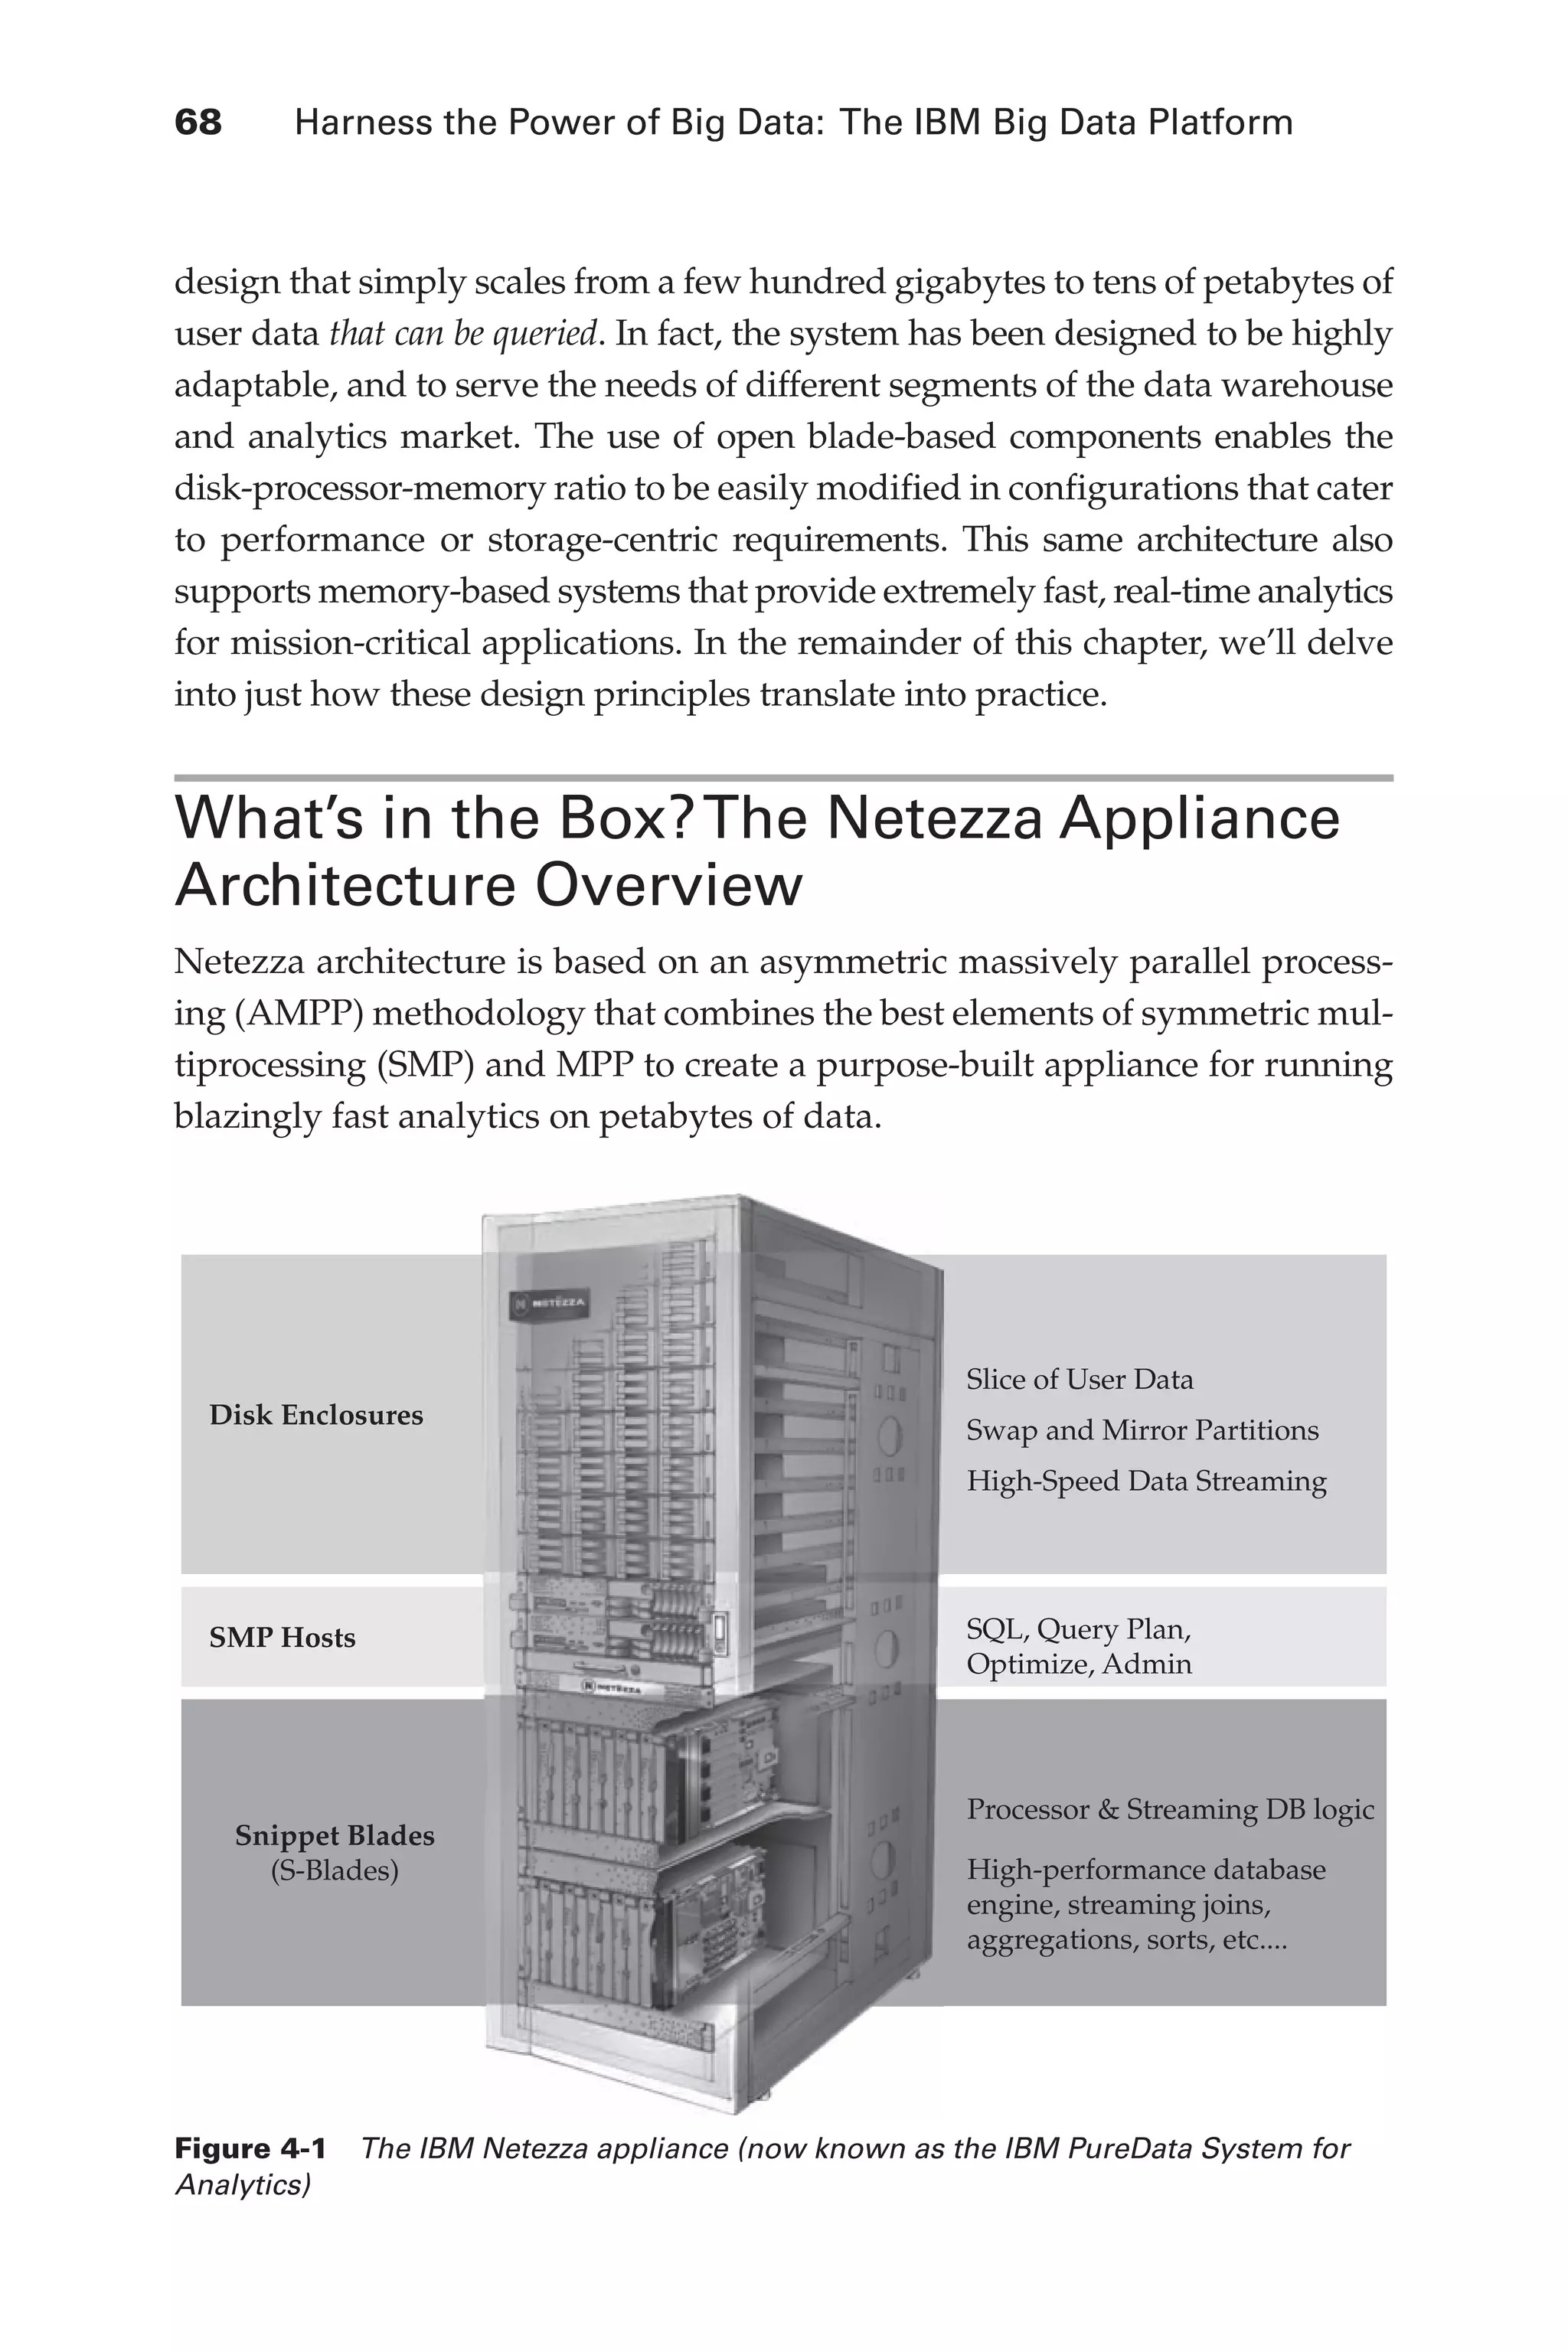
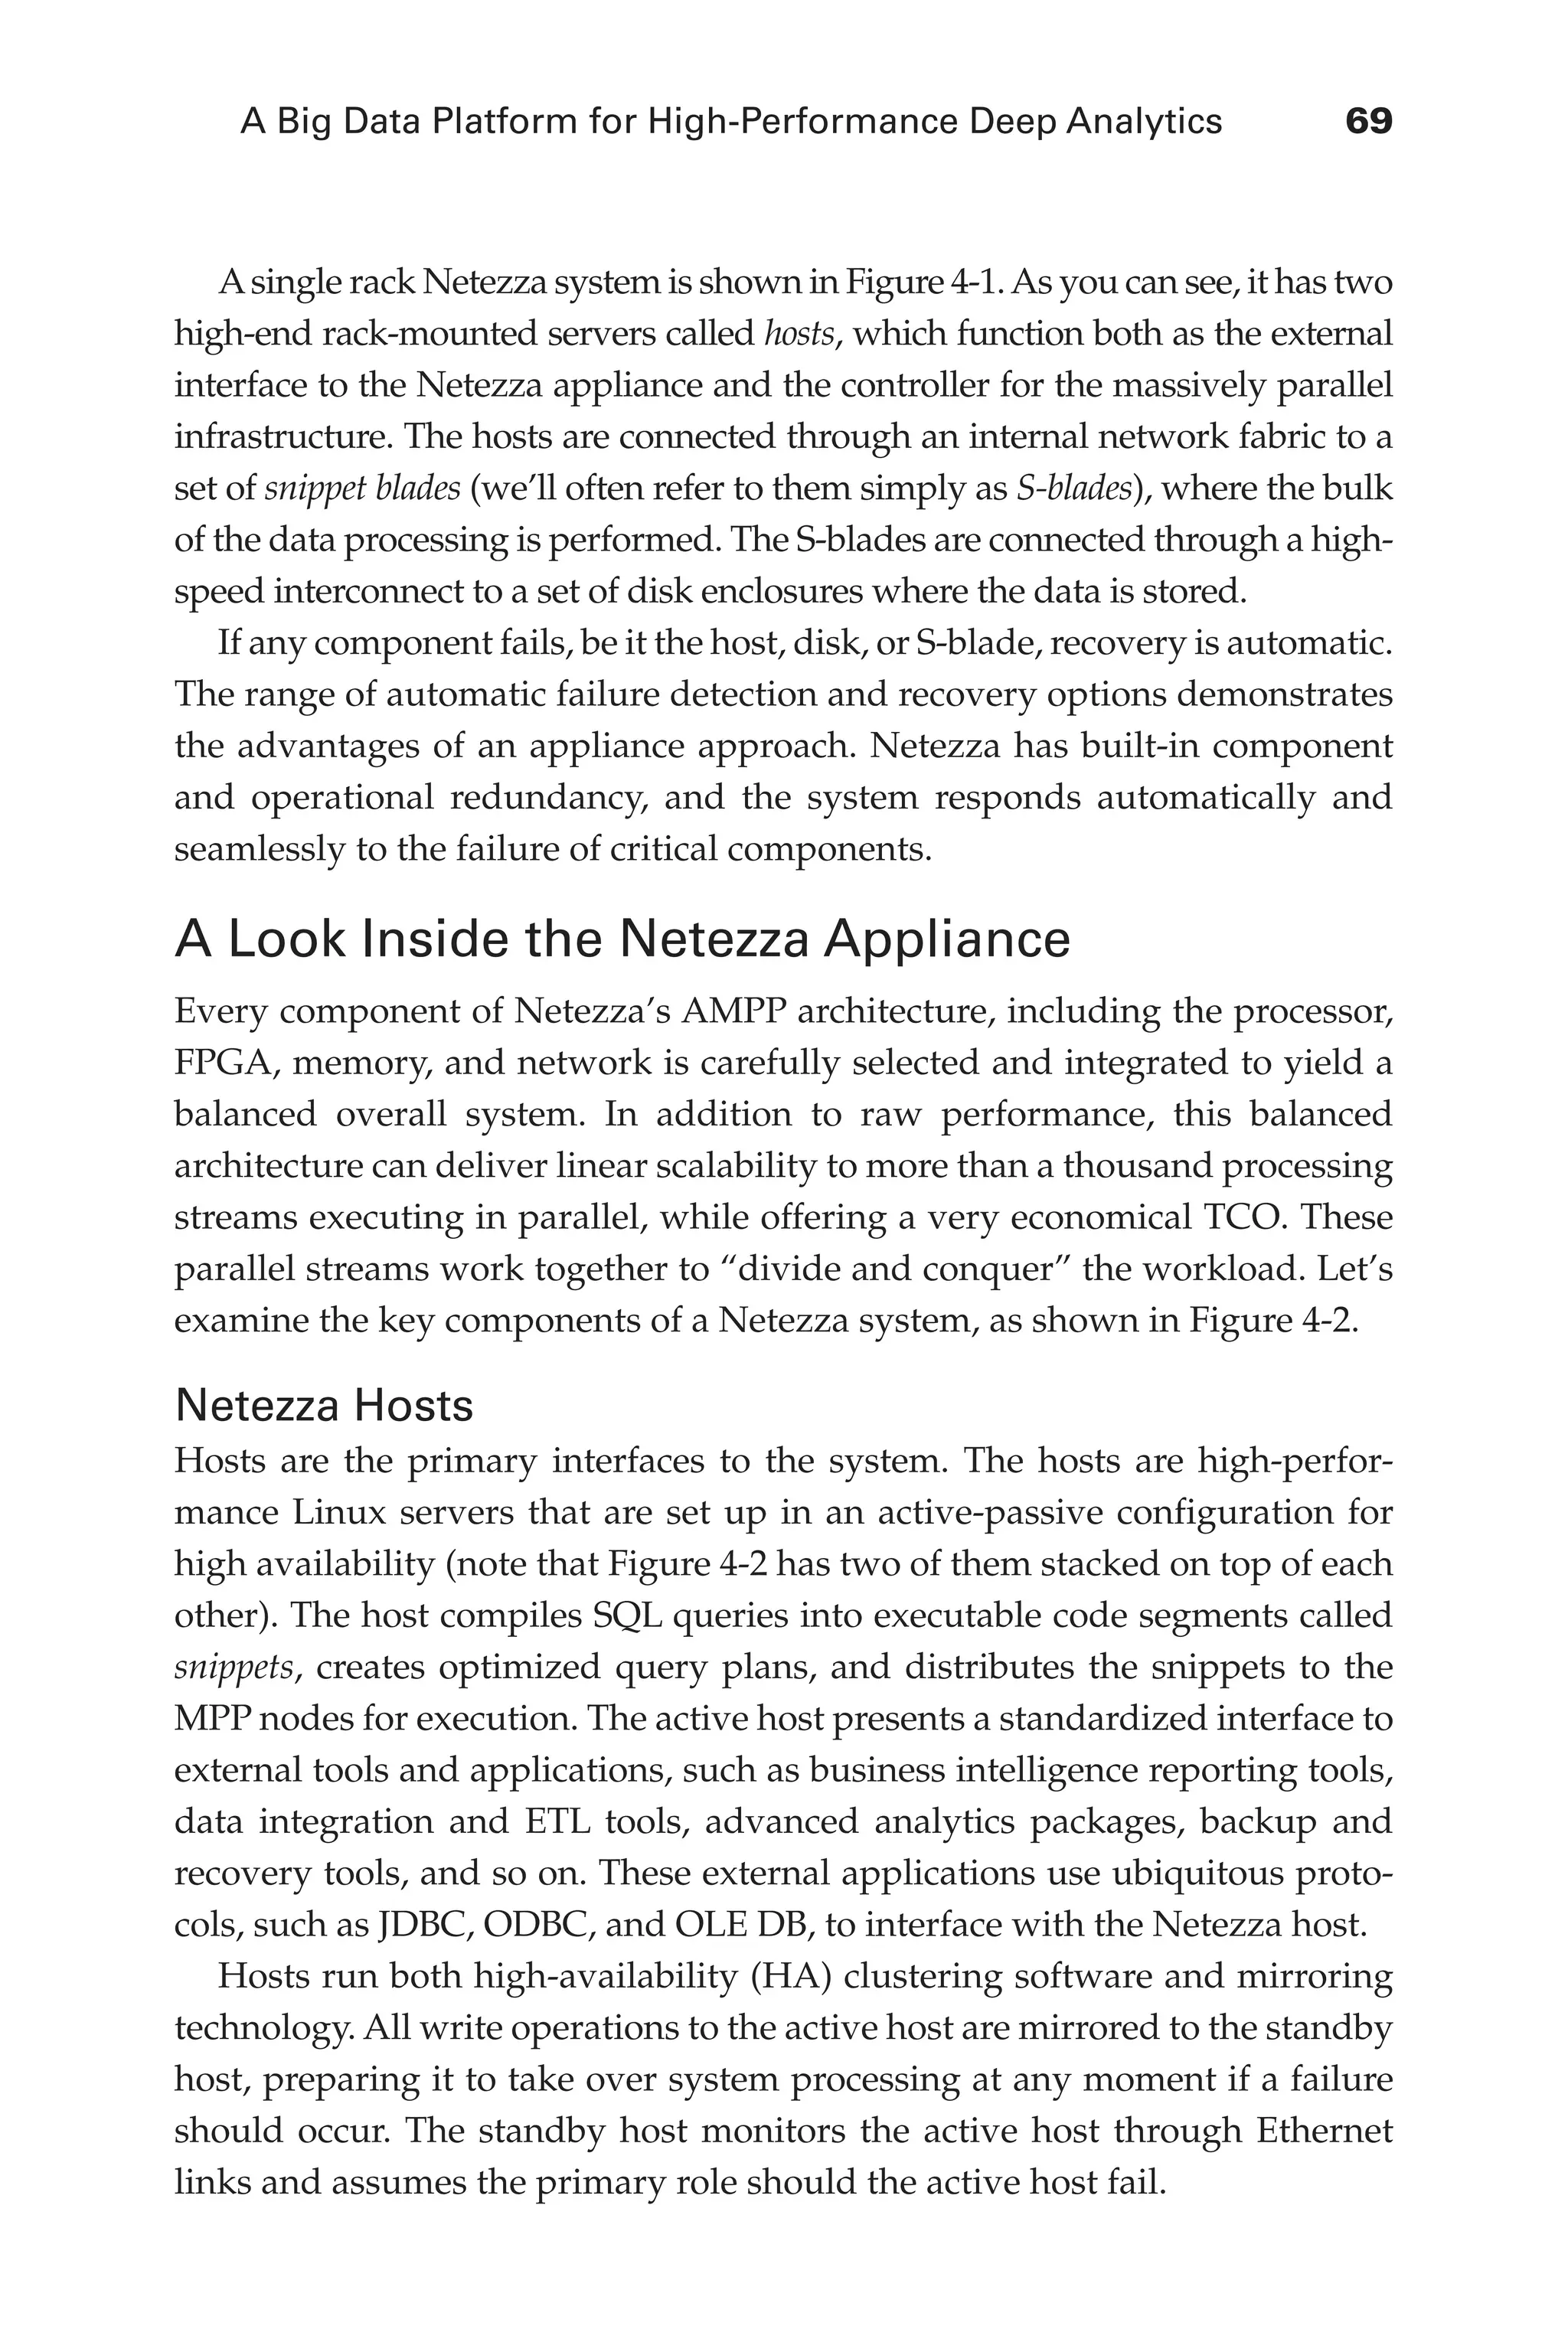
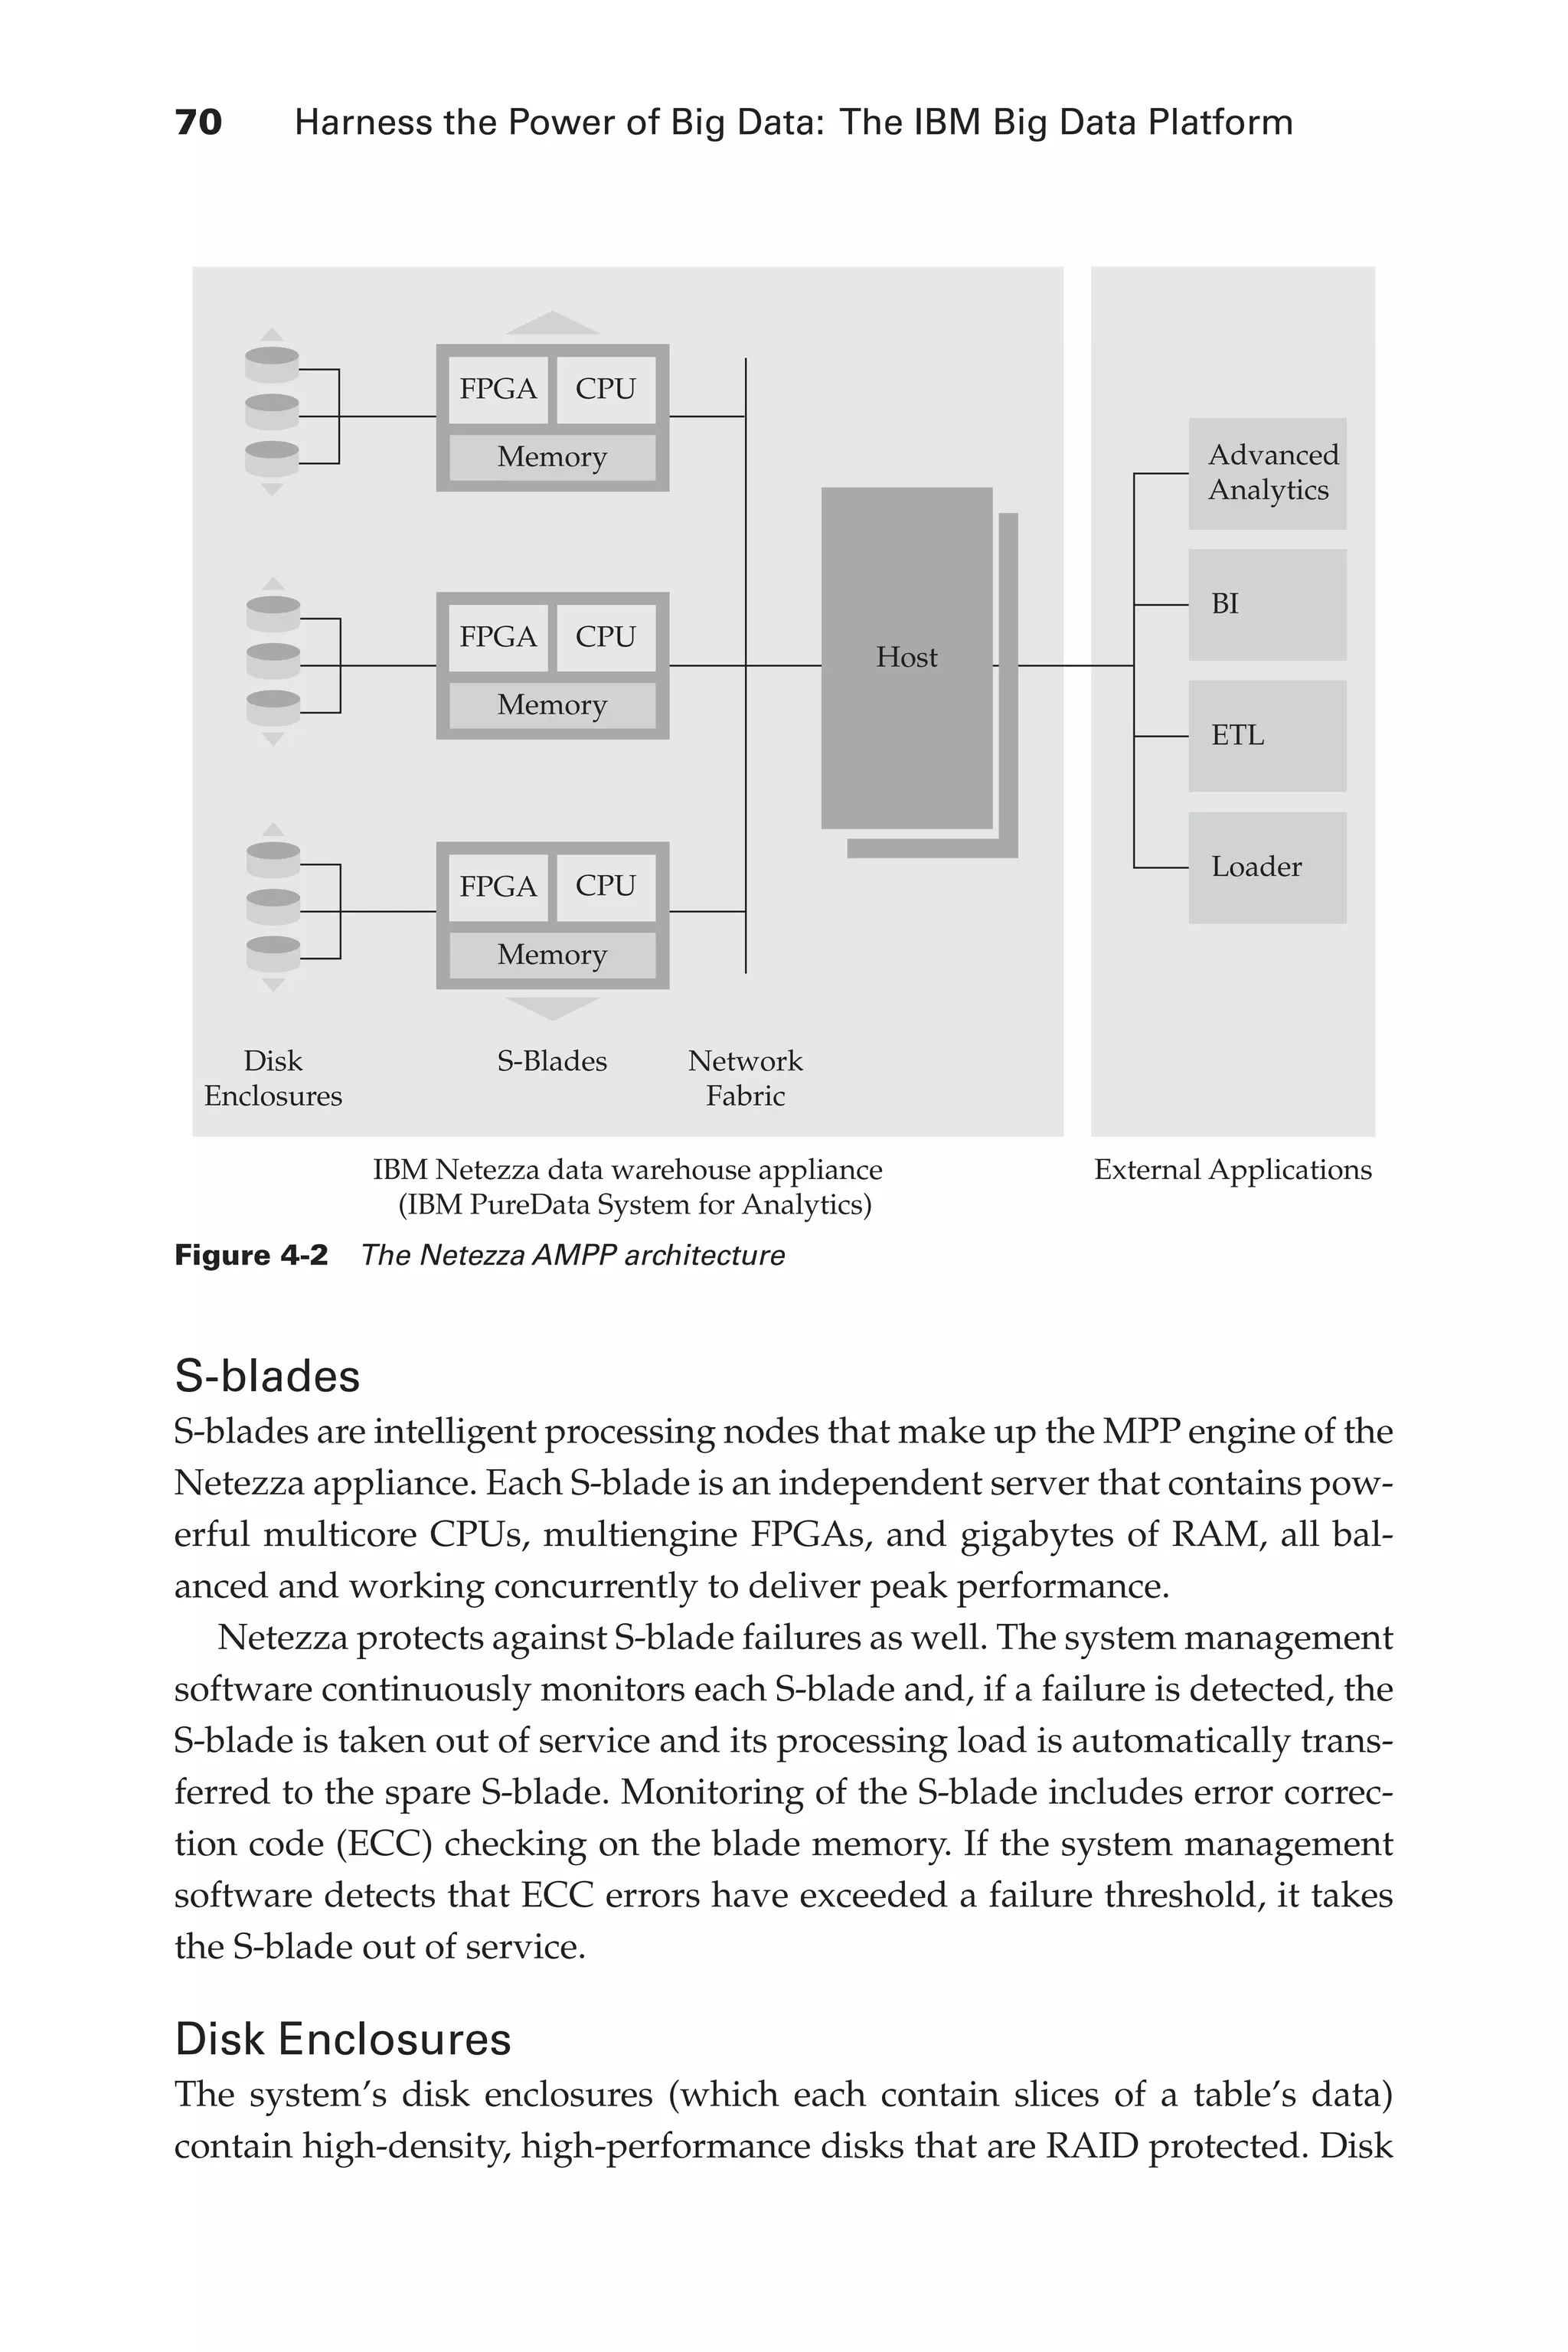
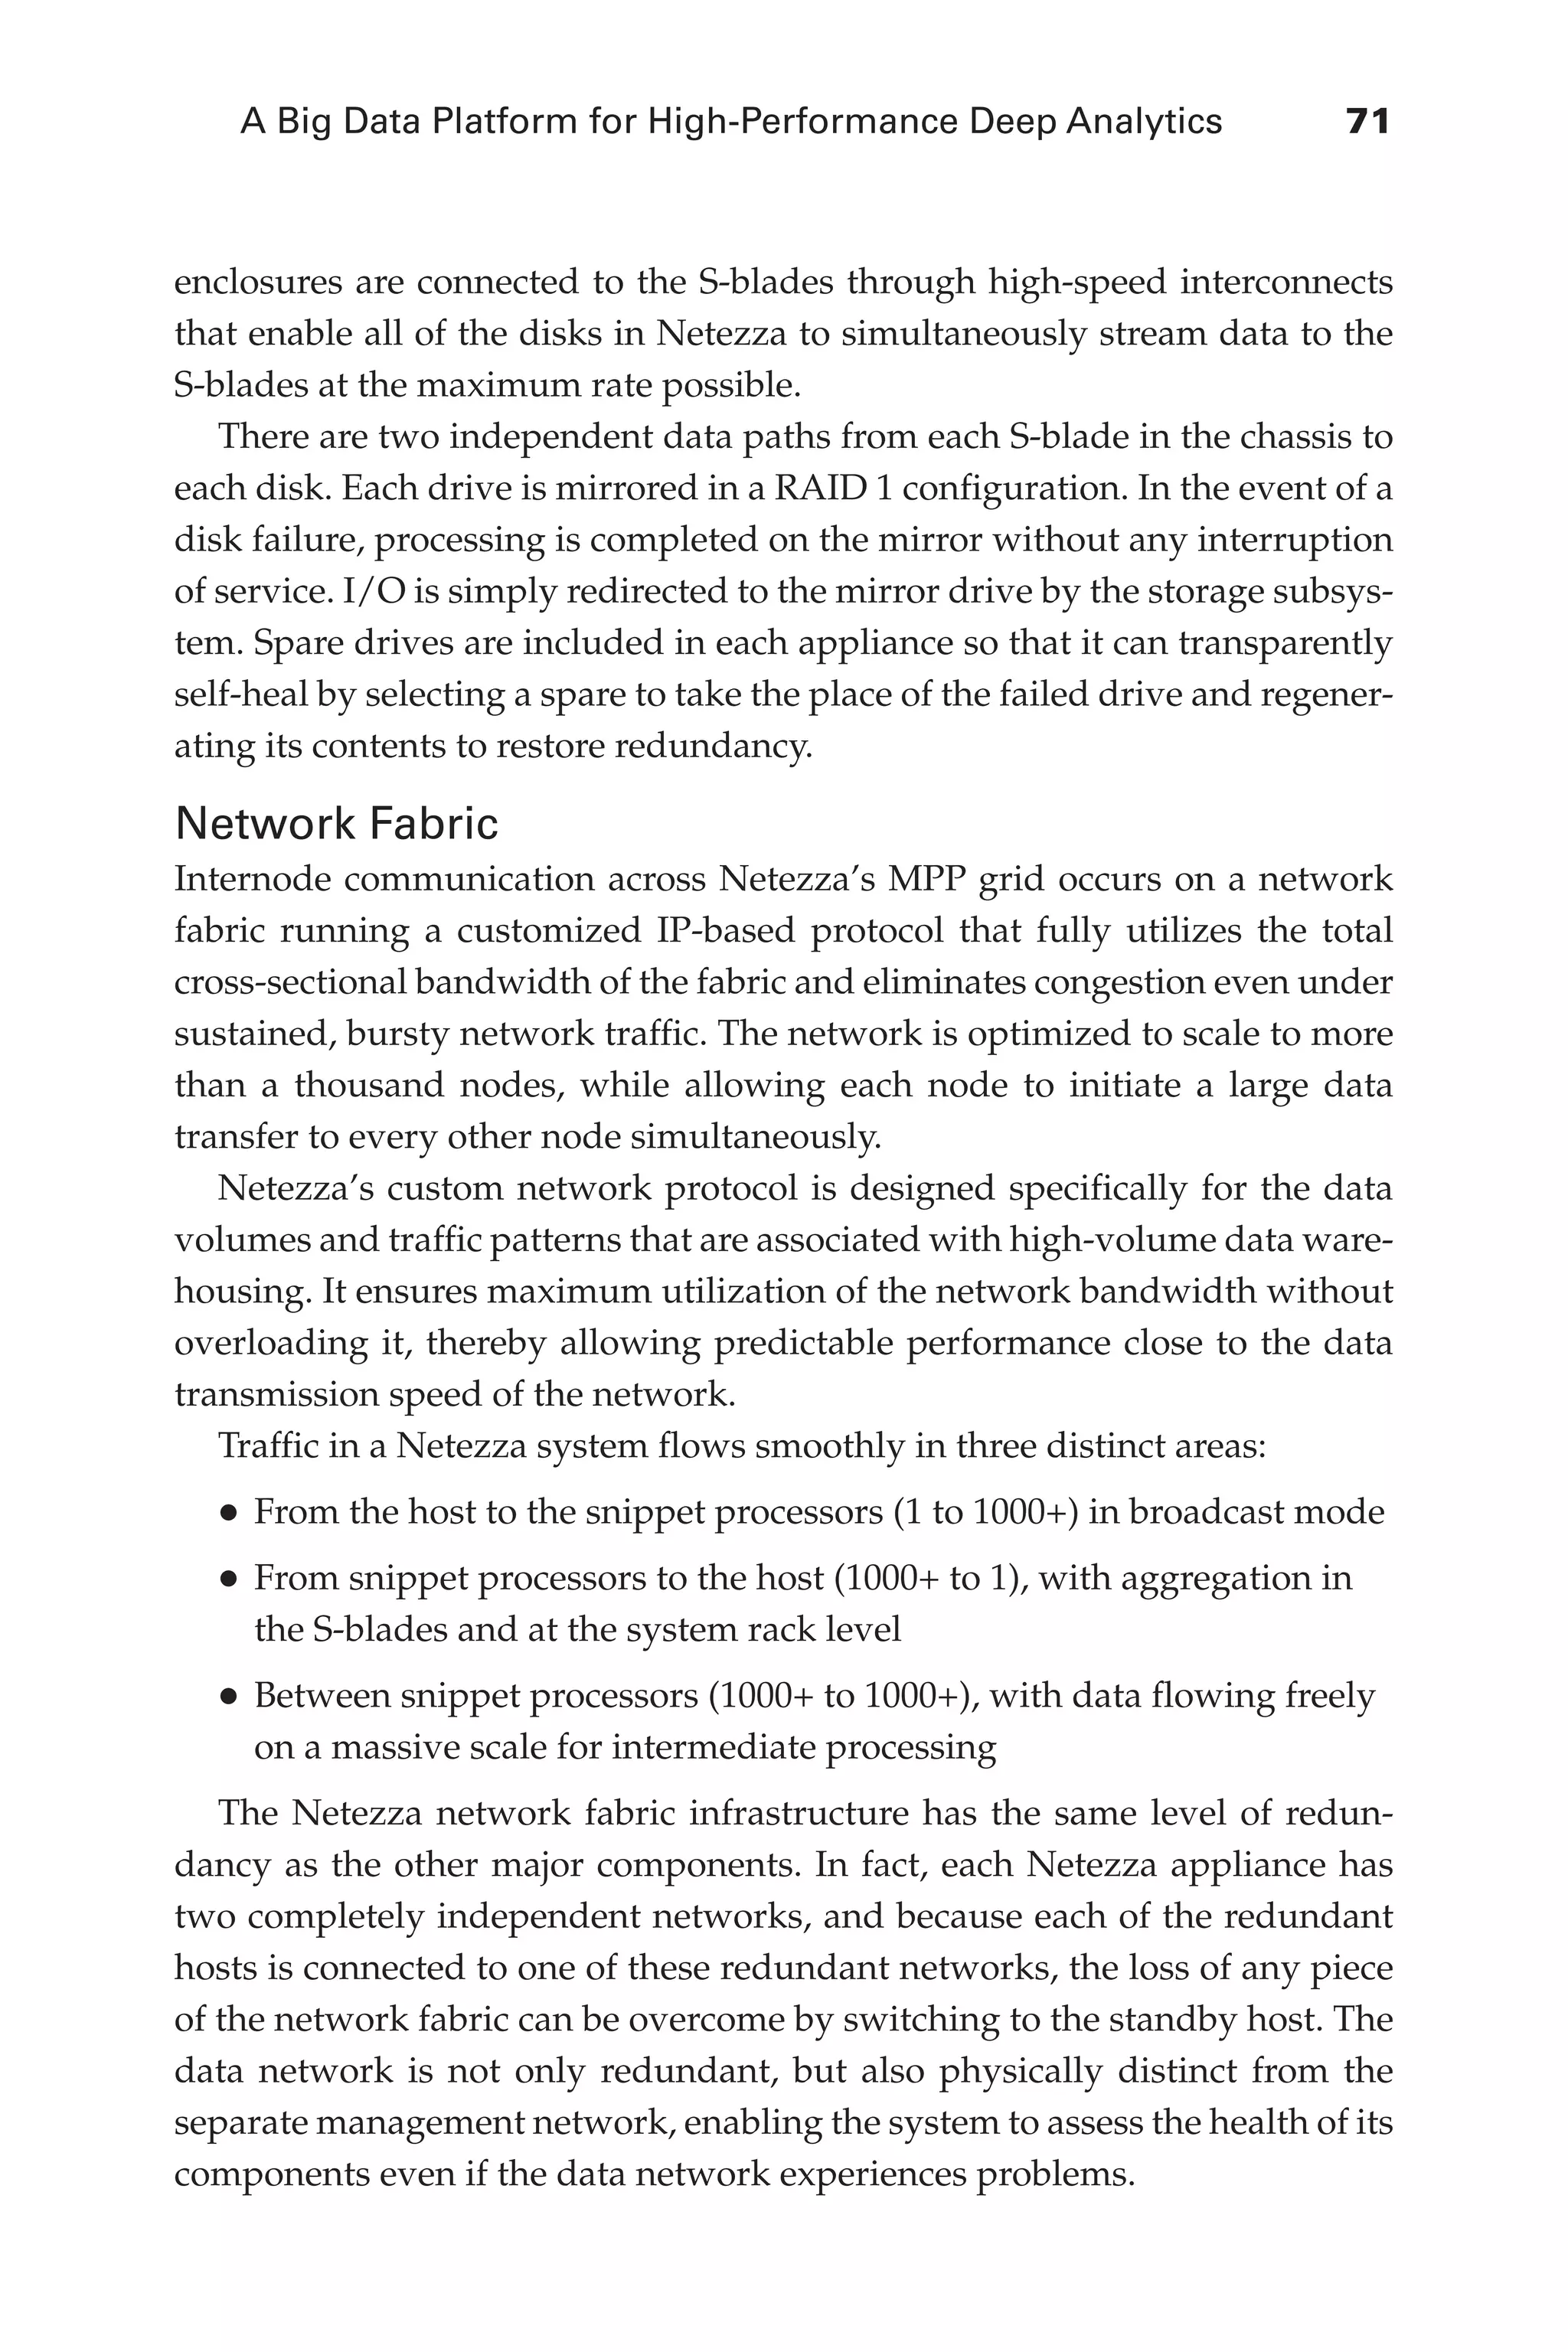
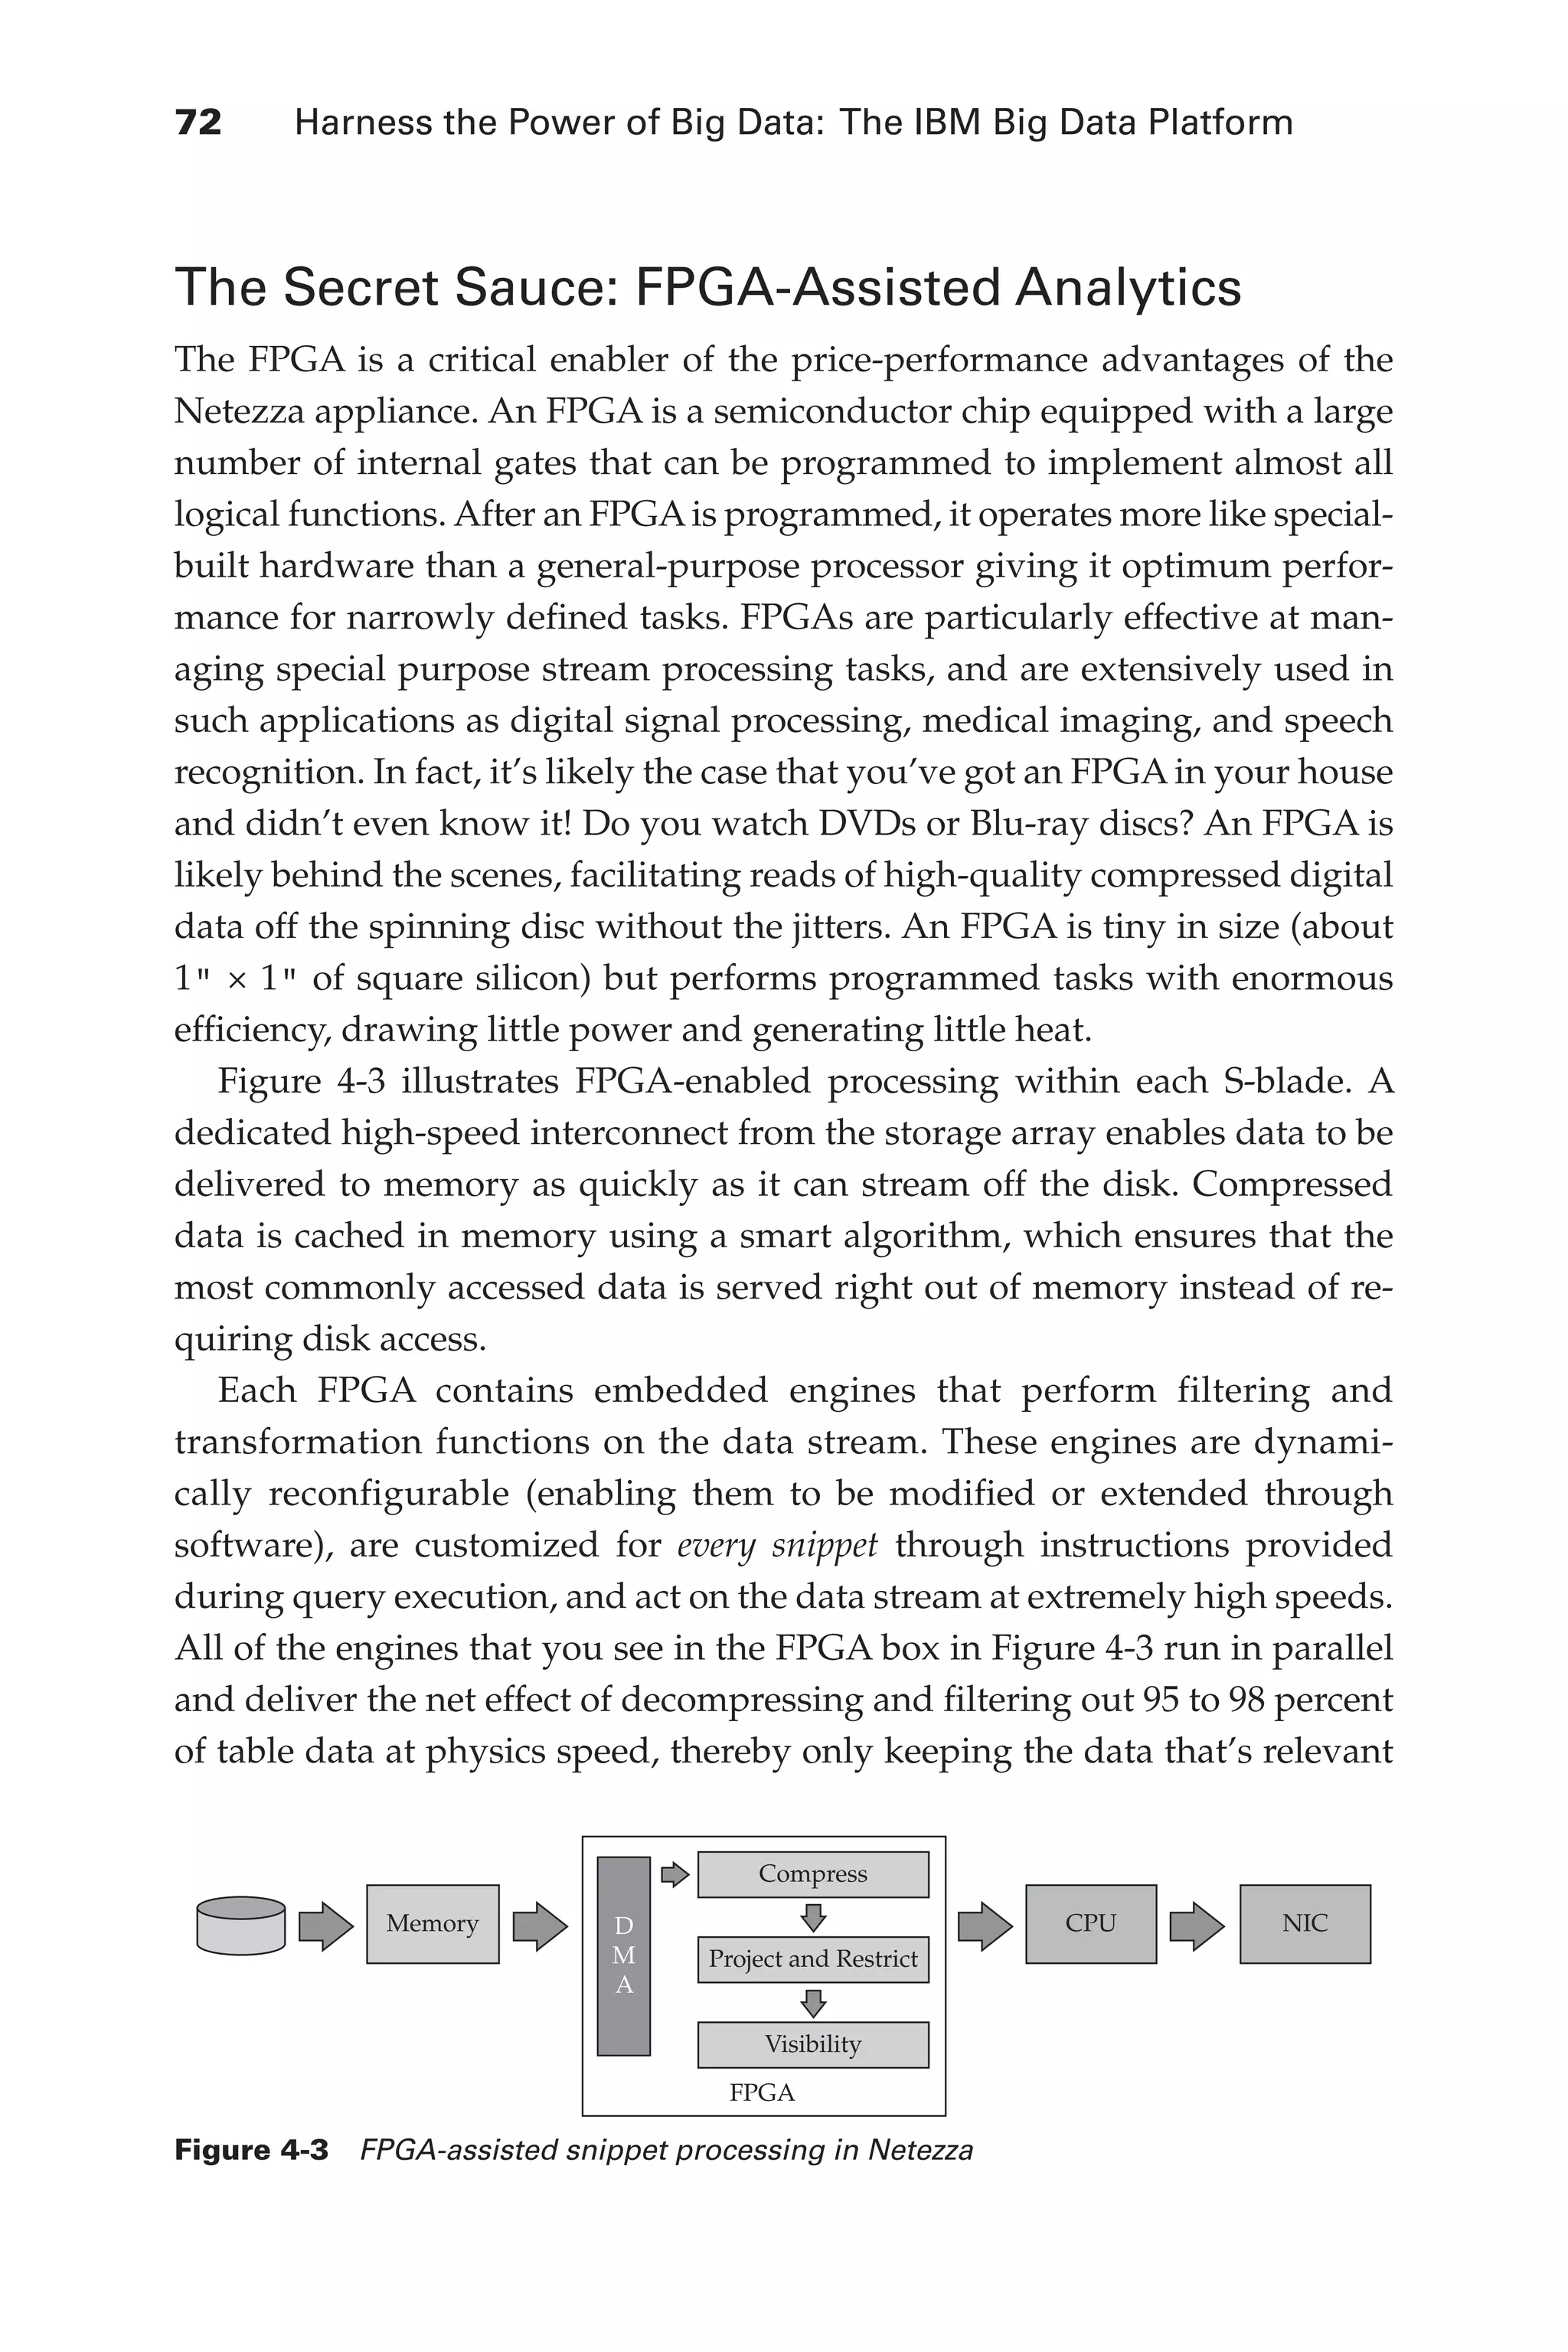
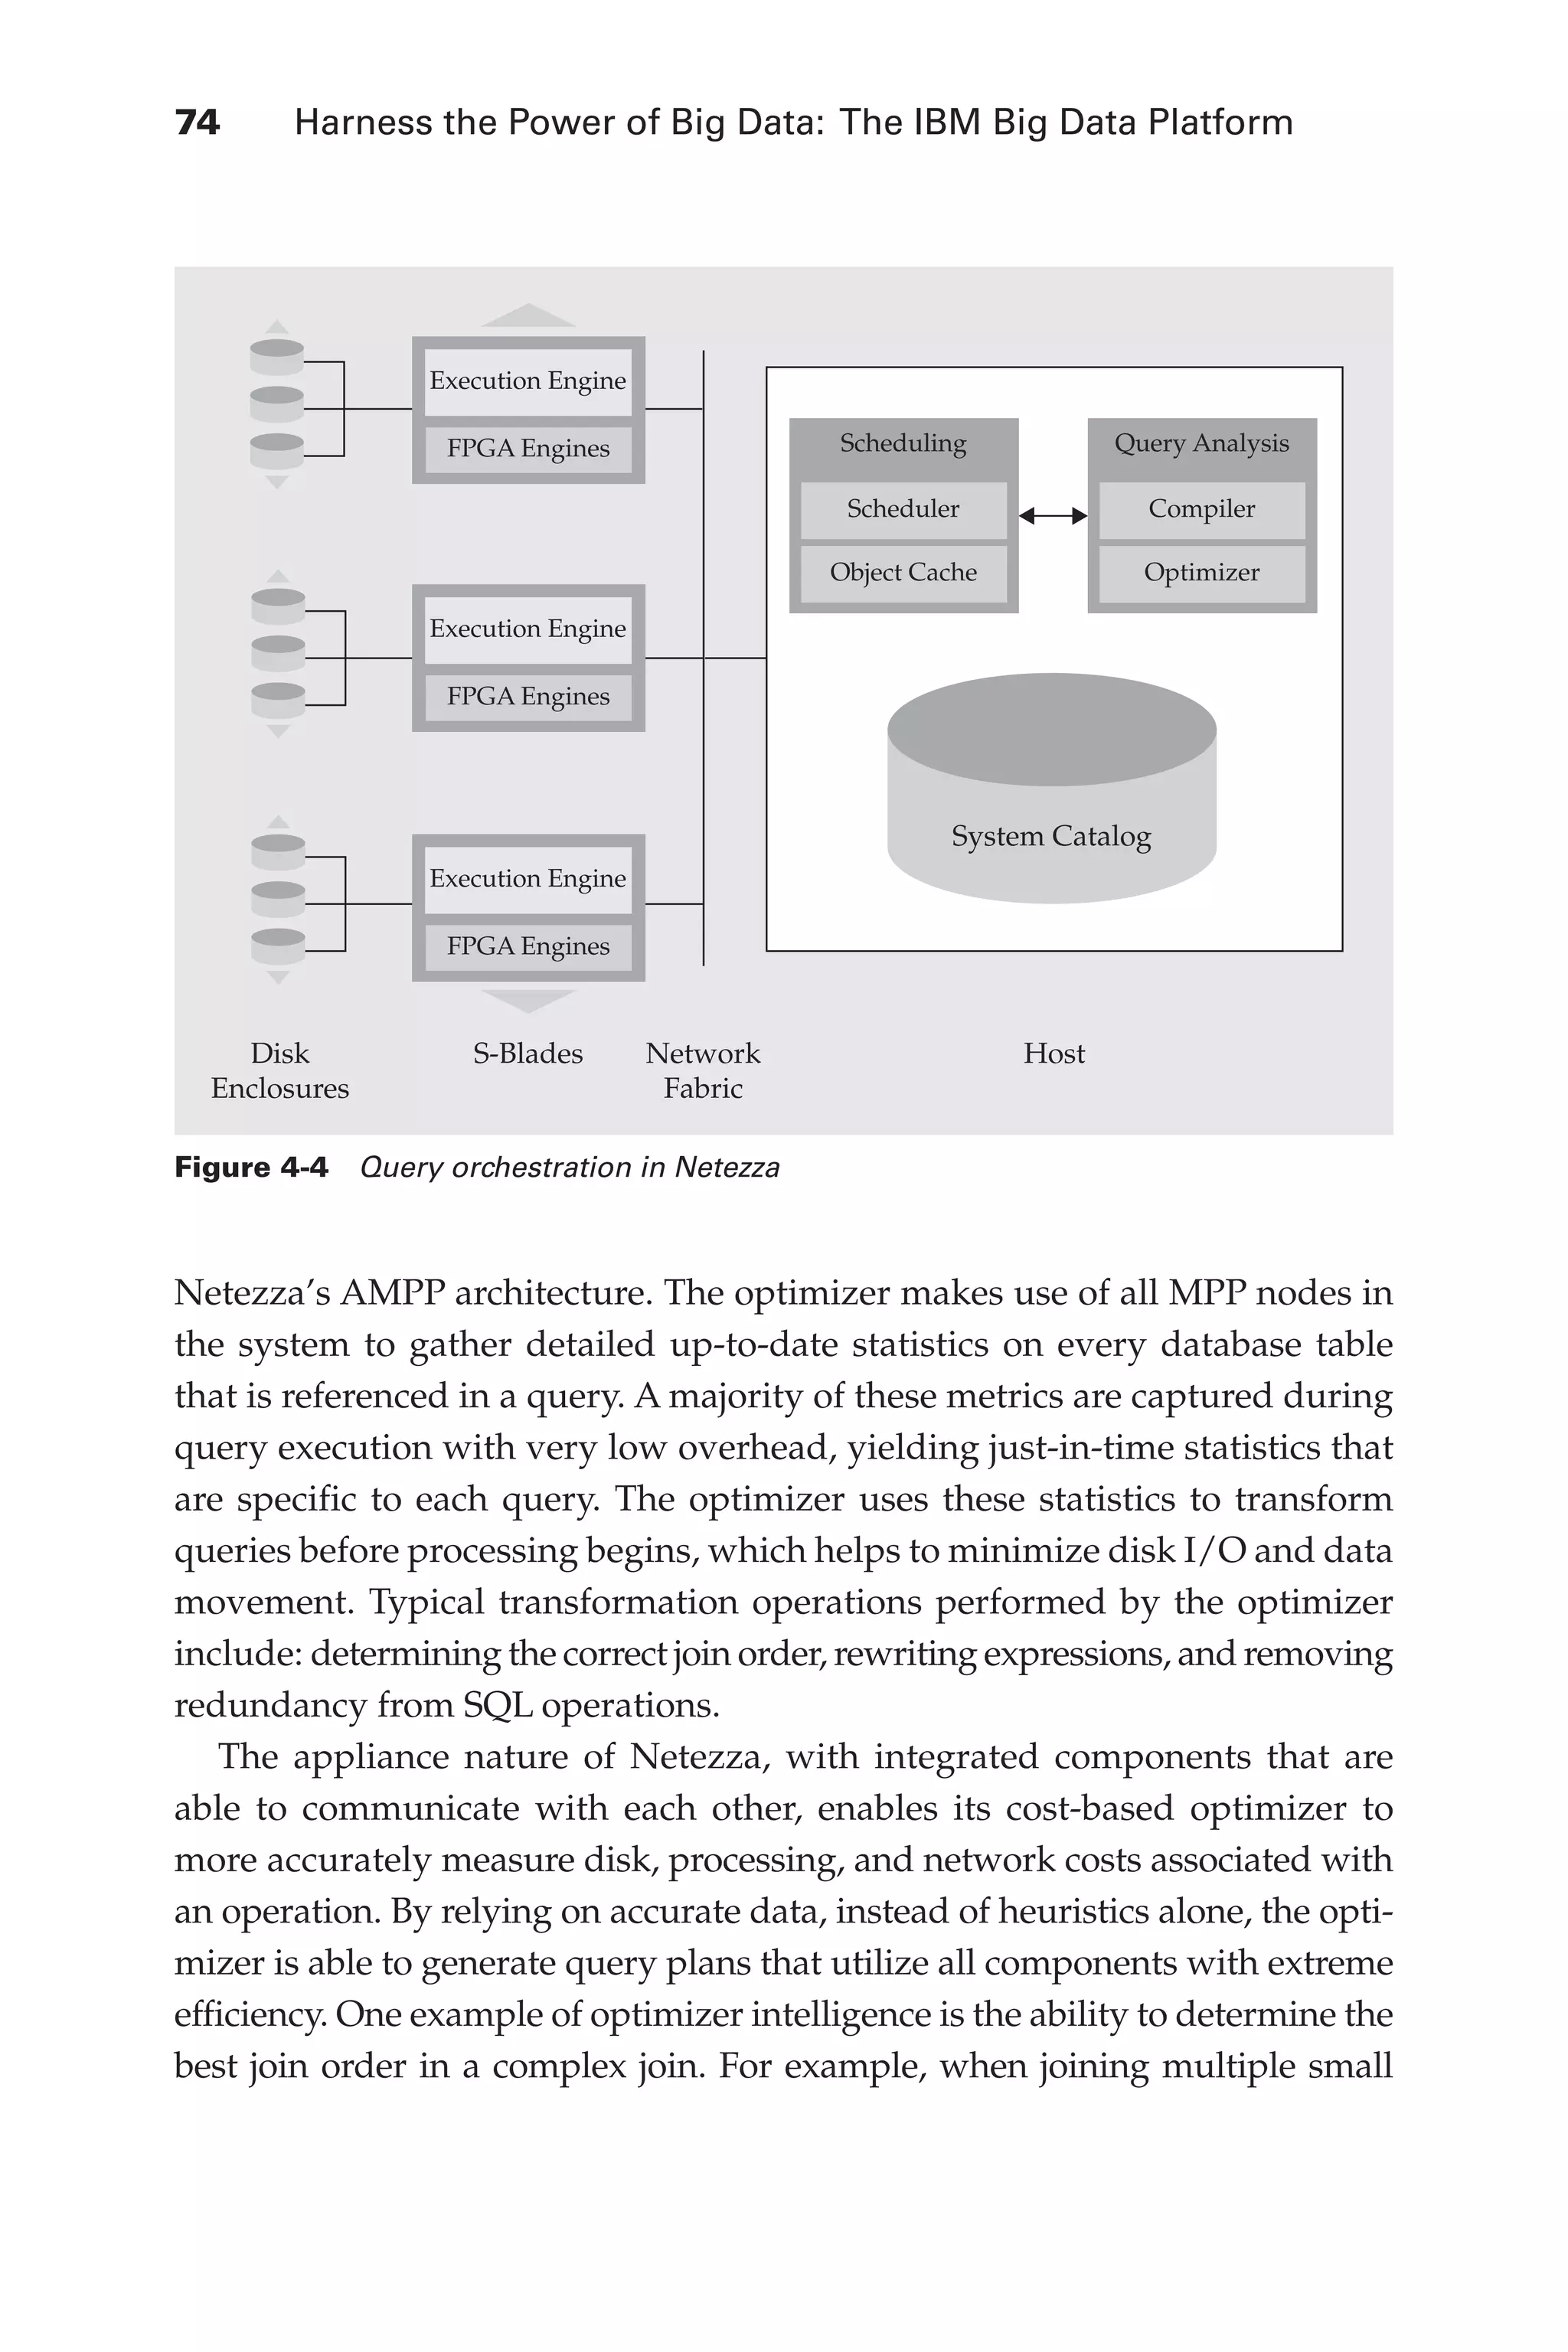
![A Big Data Platform for High-Performance Deep Analytics 79
Flash 6X9 / Harness the Power of Big Data:The IBM Big Data Platform / Zikopoulos / 817-5
Extending the Netezza Analytics
Platform with Hadoop
As previously mentioned, the principle of massive parallelism and close-to-
source data processing (embodied by all parts of the IBM Big Data platform,
including Netezza, InfoSphere BigInsights [Hadoop], InfoSphere Streams,
and InfoSphere Data Explorer) provides enormous benefits for advanced
analytics running on large data sets. Because Hadoop and Netezza both
work on stored data, we want to explain when to use each, and how the two
technologies work together. Hadoop’s ability to run on commodity servers,
Transformations Execute in-database data transformations to realize significant
performance gains.
Mathematical Perform deep in-database mathematical calculations to leverage MPP
processing.
Statistics Calculate rich statistics without moving the data.
Time series Create forecasts and identify trends using rich histories to improve
model accuracy.
Data mining Use more data, or all of the data, to discover new and emerging insights.
Predictive Move from batch processing to near-real-time speed-of-thought analytics
to predict with great accuracy and speed.
Geospatial Implement location-based analytics on Big Data with immediate
feedback.
Table 4-1 In-Database Analytics Built into IBM Netezza Analytics
IBM
InfoSphere
Streams
Software
Development
Kit
User-Defined
Extensions
(UDF, UDA,
UDTF, UDAP)
IBM SPSS
DBLytix by
Fuzzy Logix
Universal
PMML Plug-
In by Zementis
SAS 9.3+
Language
Support
(MapReduce,
Java, Python,
R, Lua, Perl,
C, C++,
Fortran,
PMML)
Third-Party
In-Database
Analytics
Netezza
In-Database
Analytics
Transformations
Mathematical
IBM SPSS
SAS
Revolution
Analytics
Eclipse
BI Tools
Visualization
Tools
IBM Netezza AMPP Platform
IBM
InfoSphere
BigInsights
Cloudera
Apache Hadoop
Tanay GPU
Appliance
by Fuzzy
Logix
Geospatial
Predictive
Statistics
Time Series
Data Mining
Figure 4-5 The IBM Netezza analytics platform
04-ch04.indd 79 03/10/12 7:01 PM](https://image.slidesharecdn.com/imm14100usen-130426053301-phpapp01/75/Harness-the-power-of-Big-Data-110-2048.jpg)
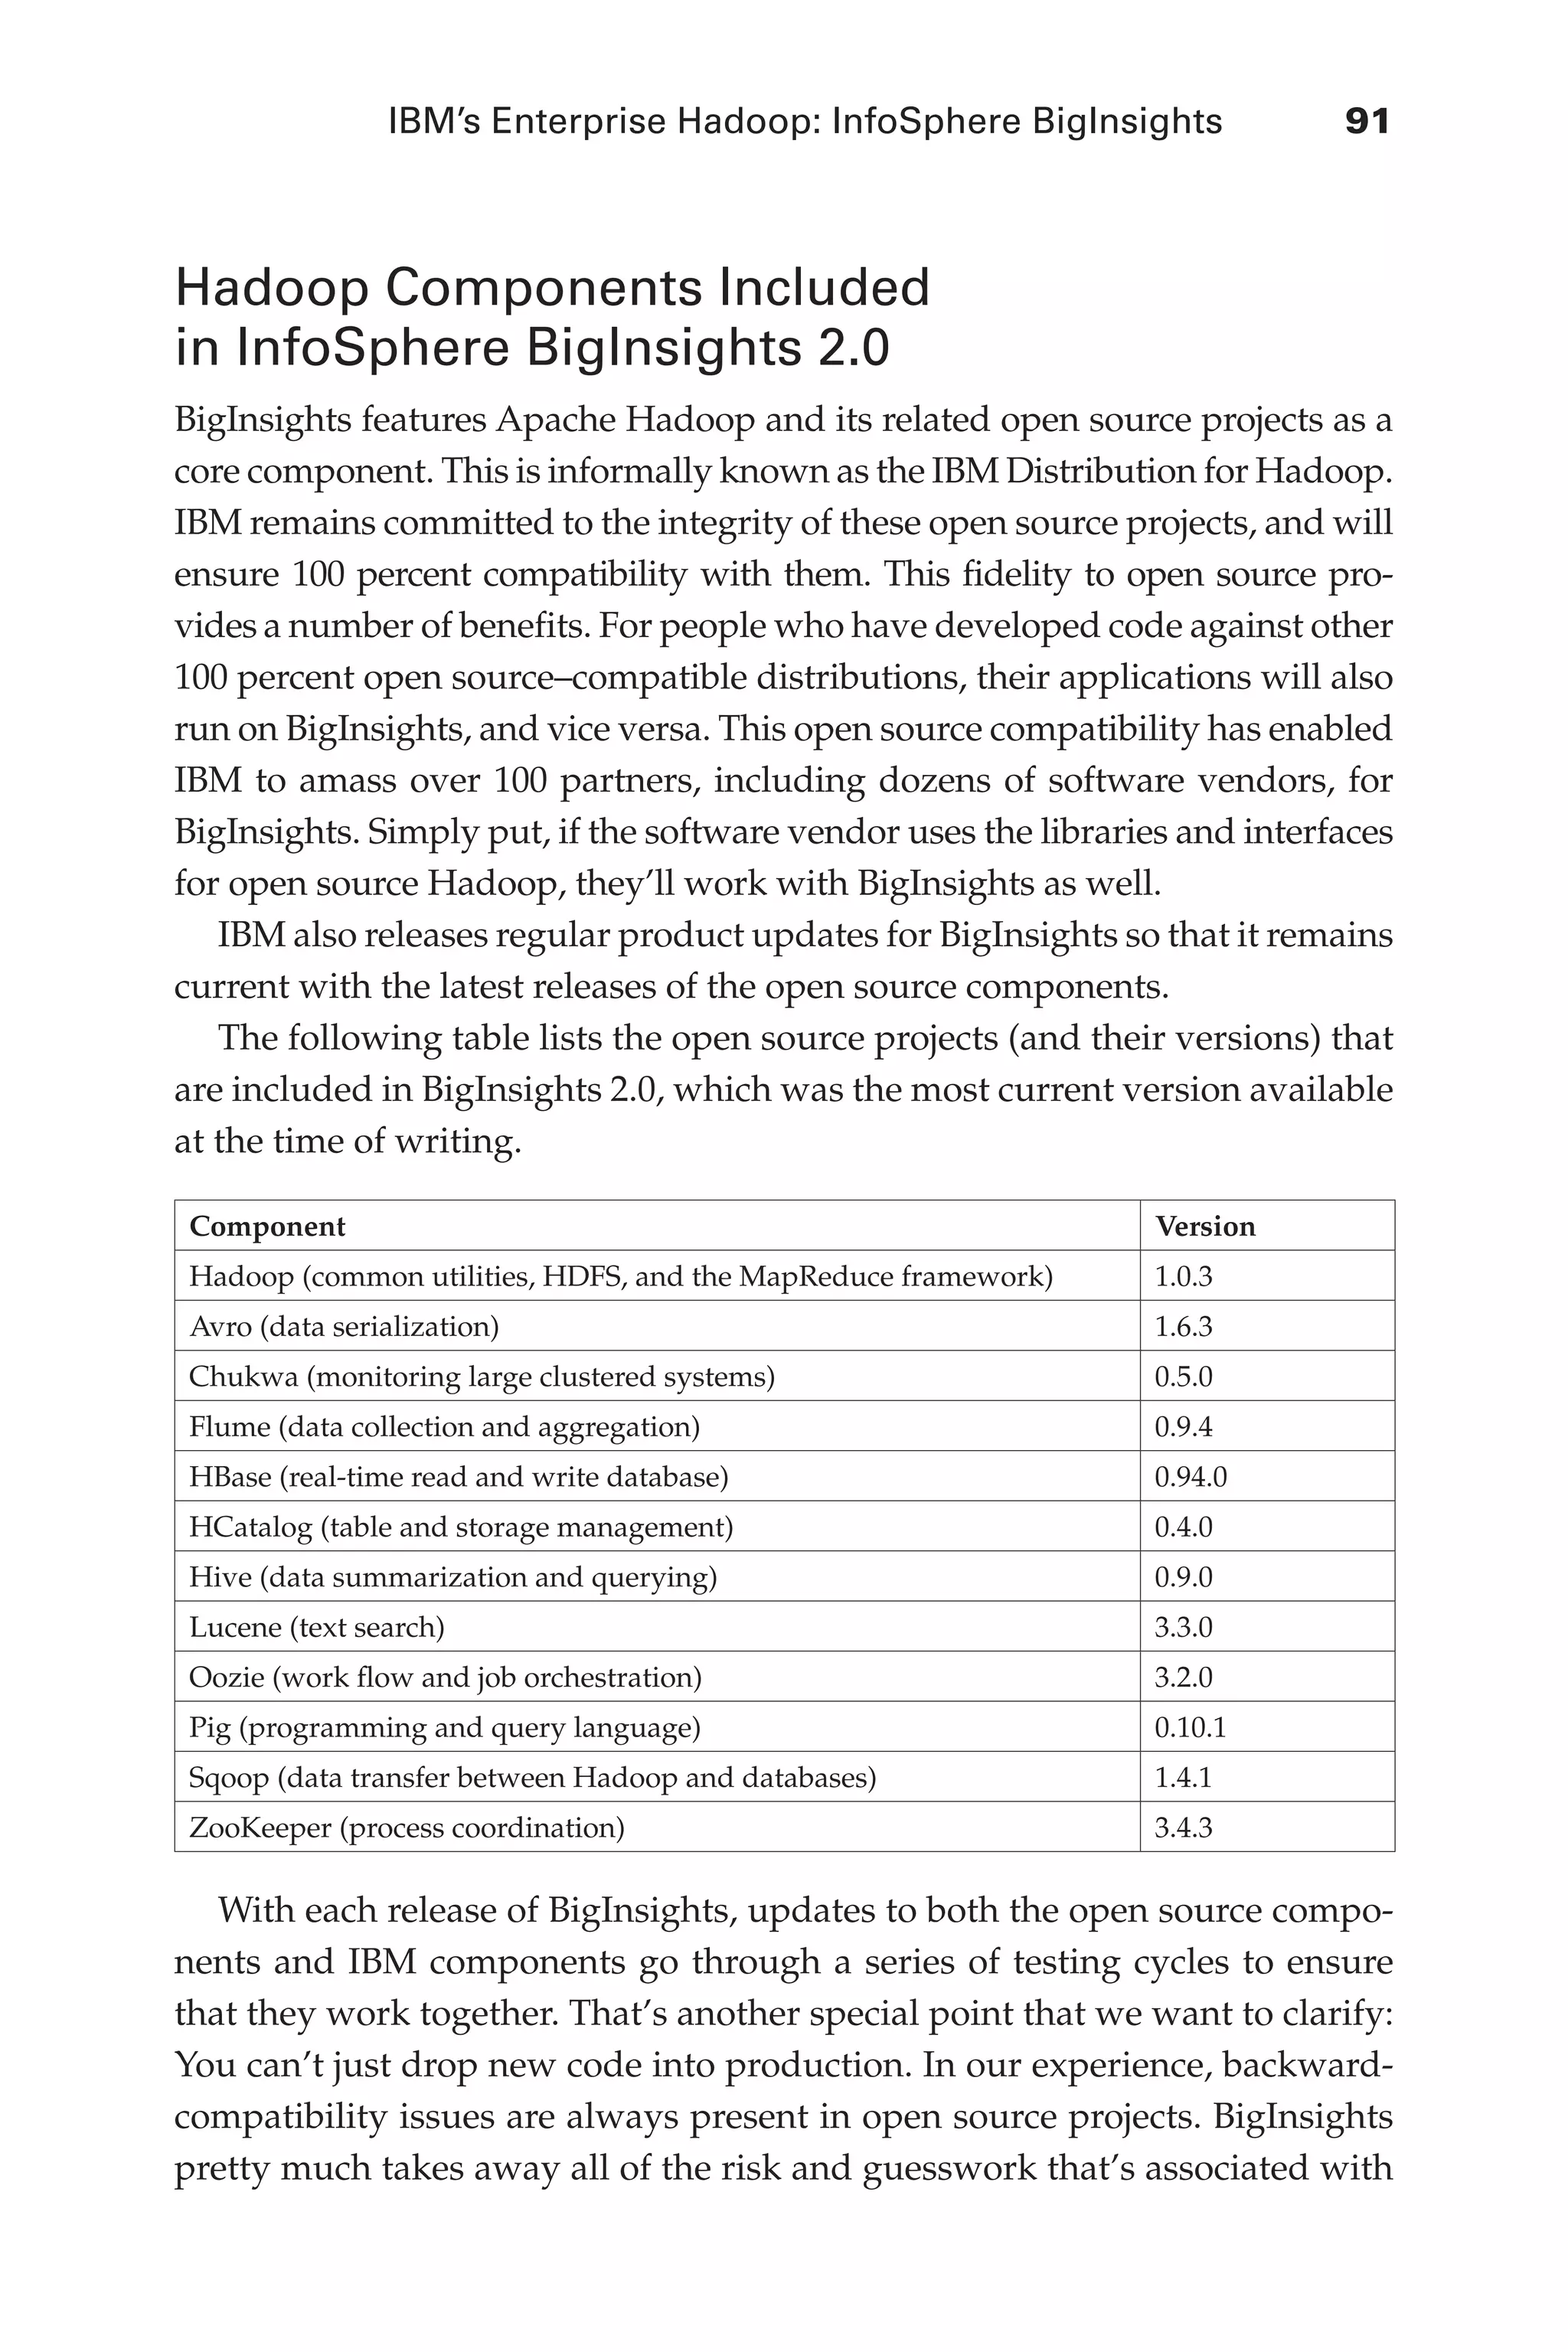
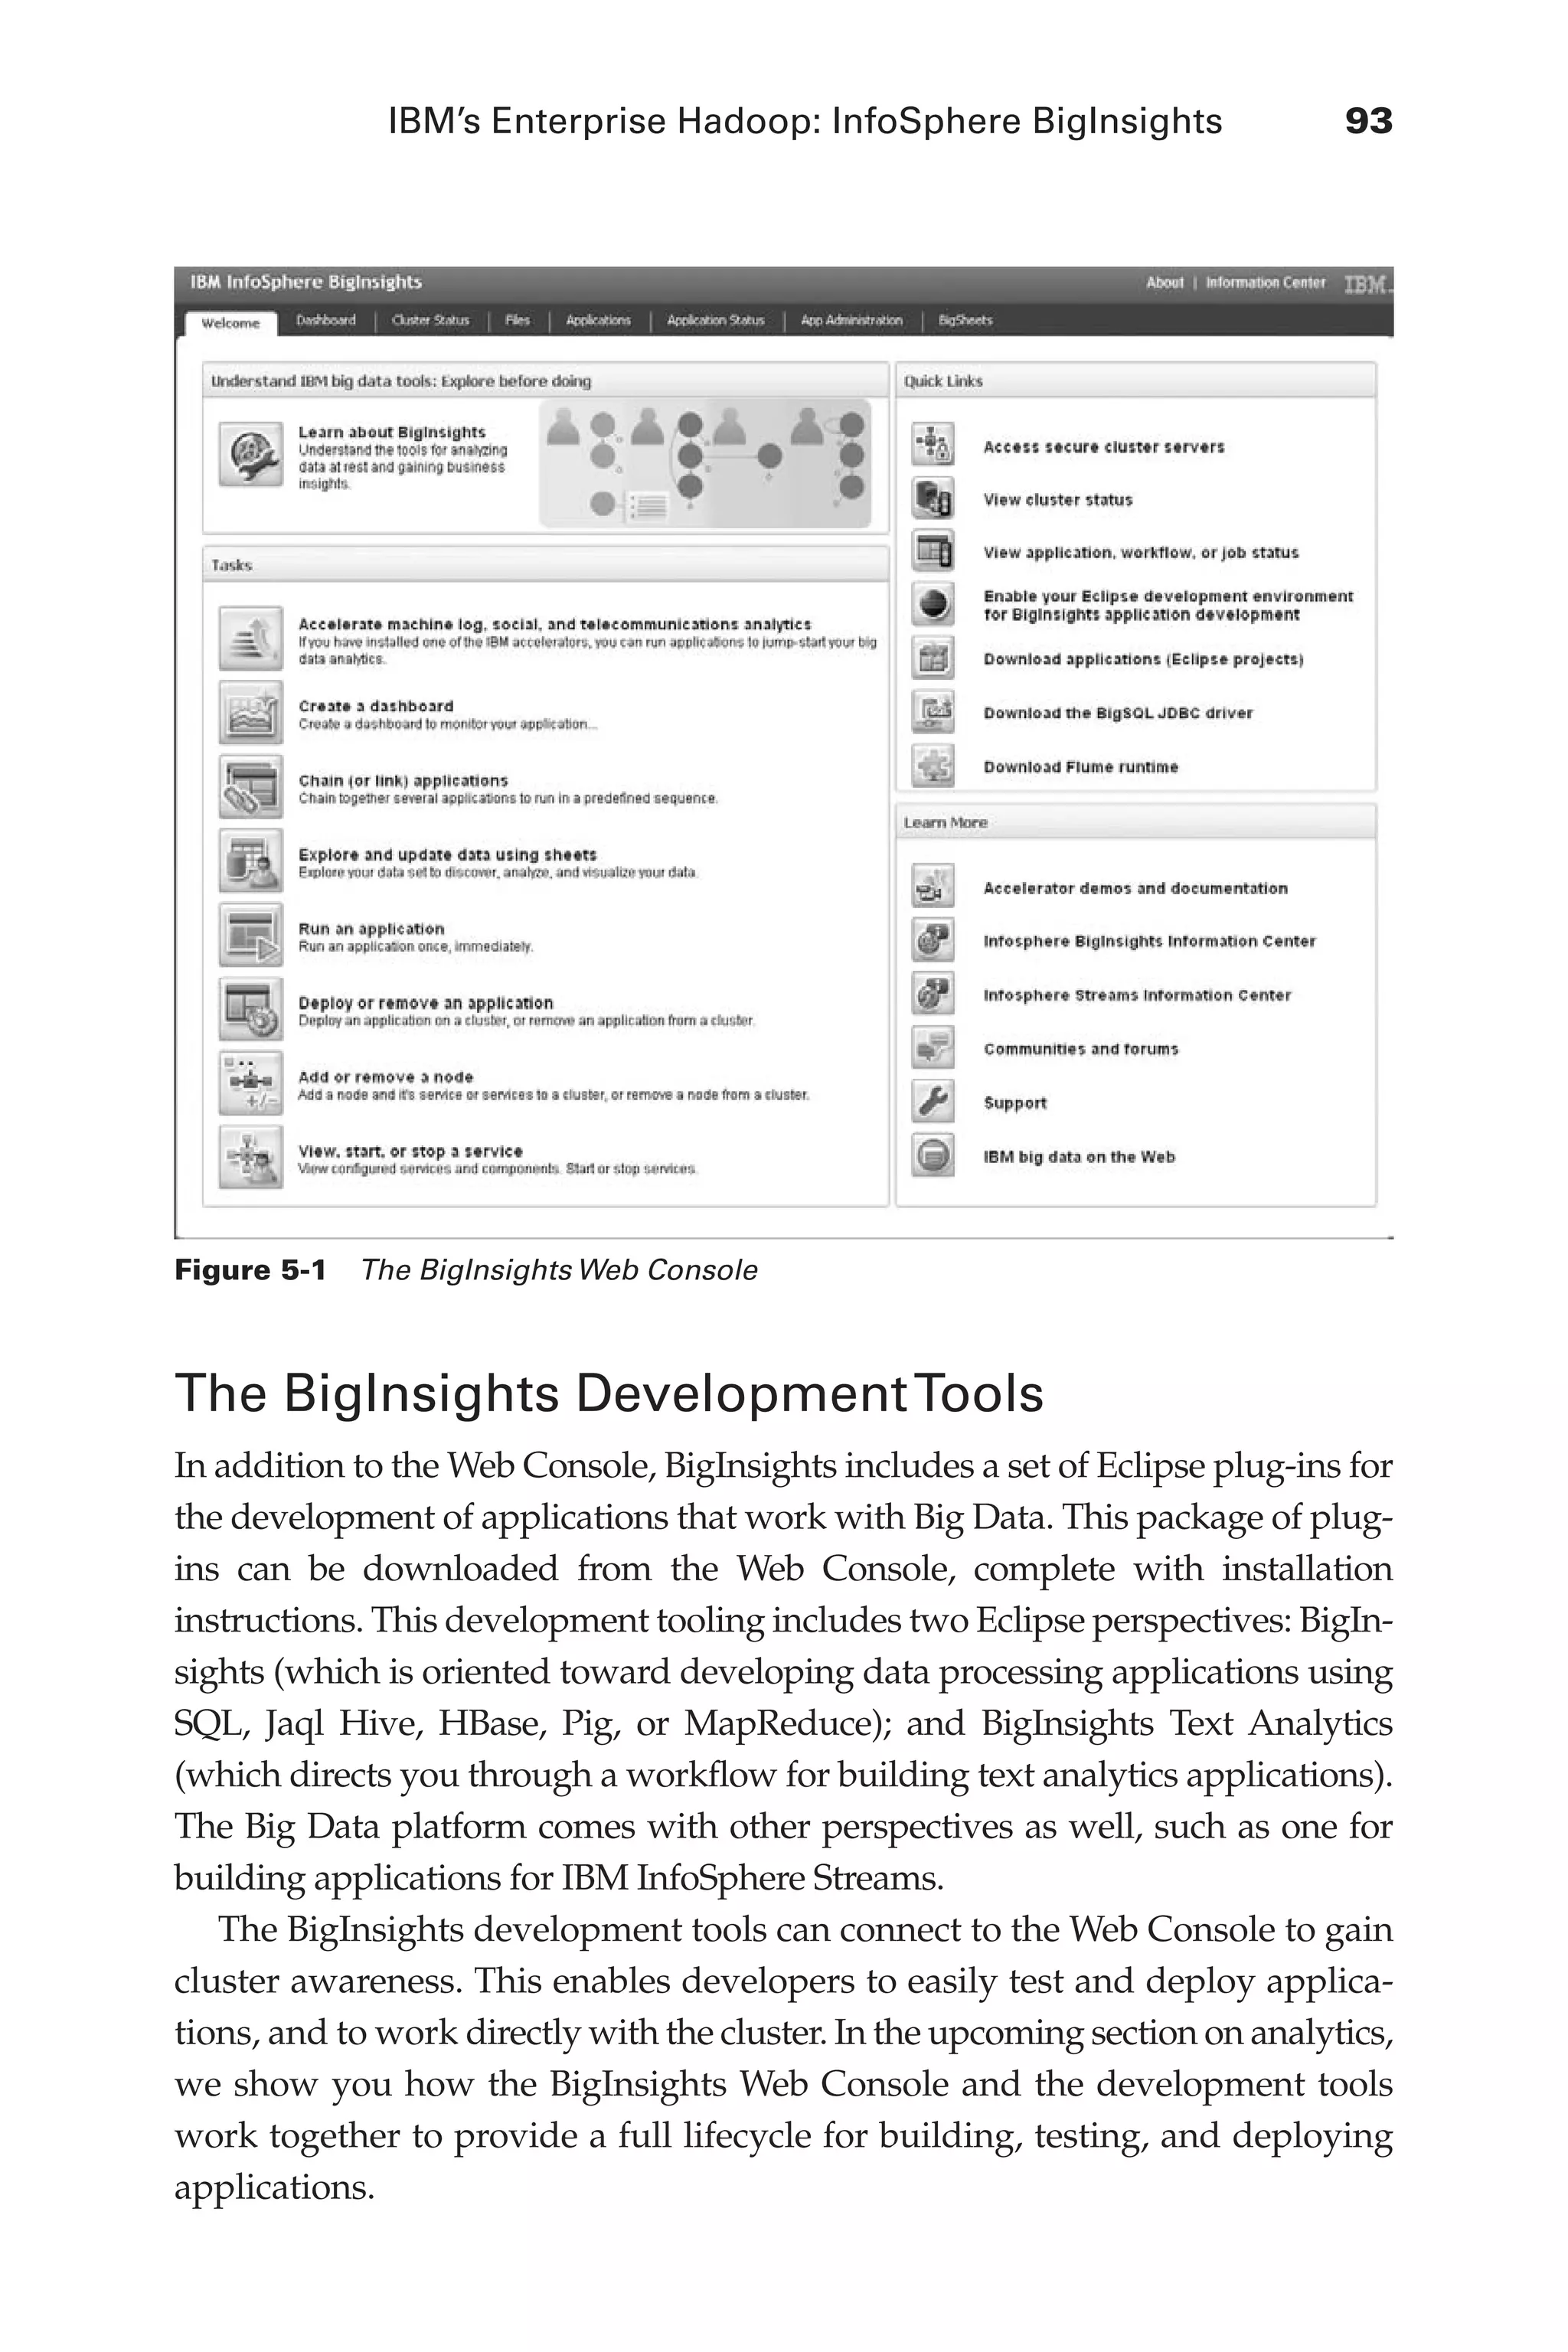
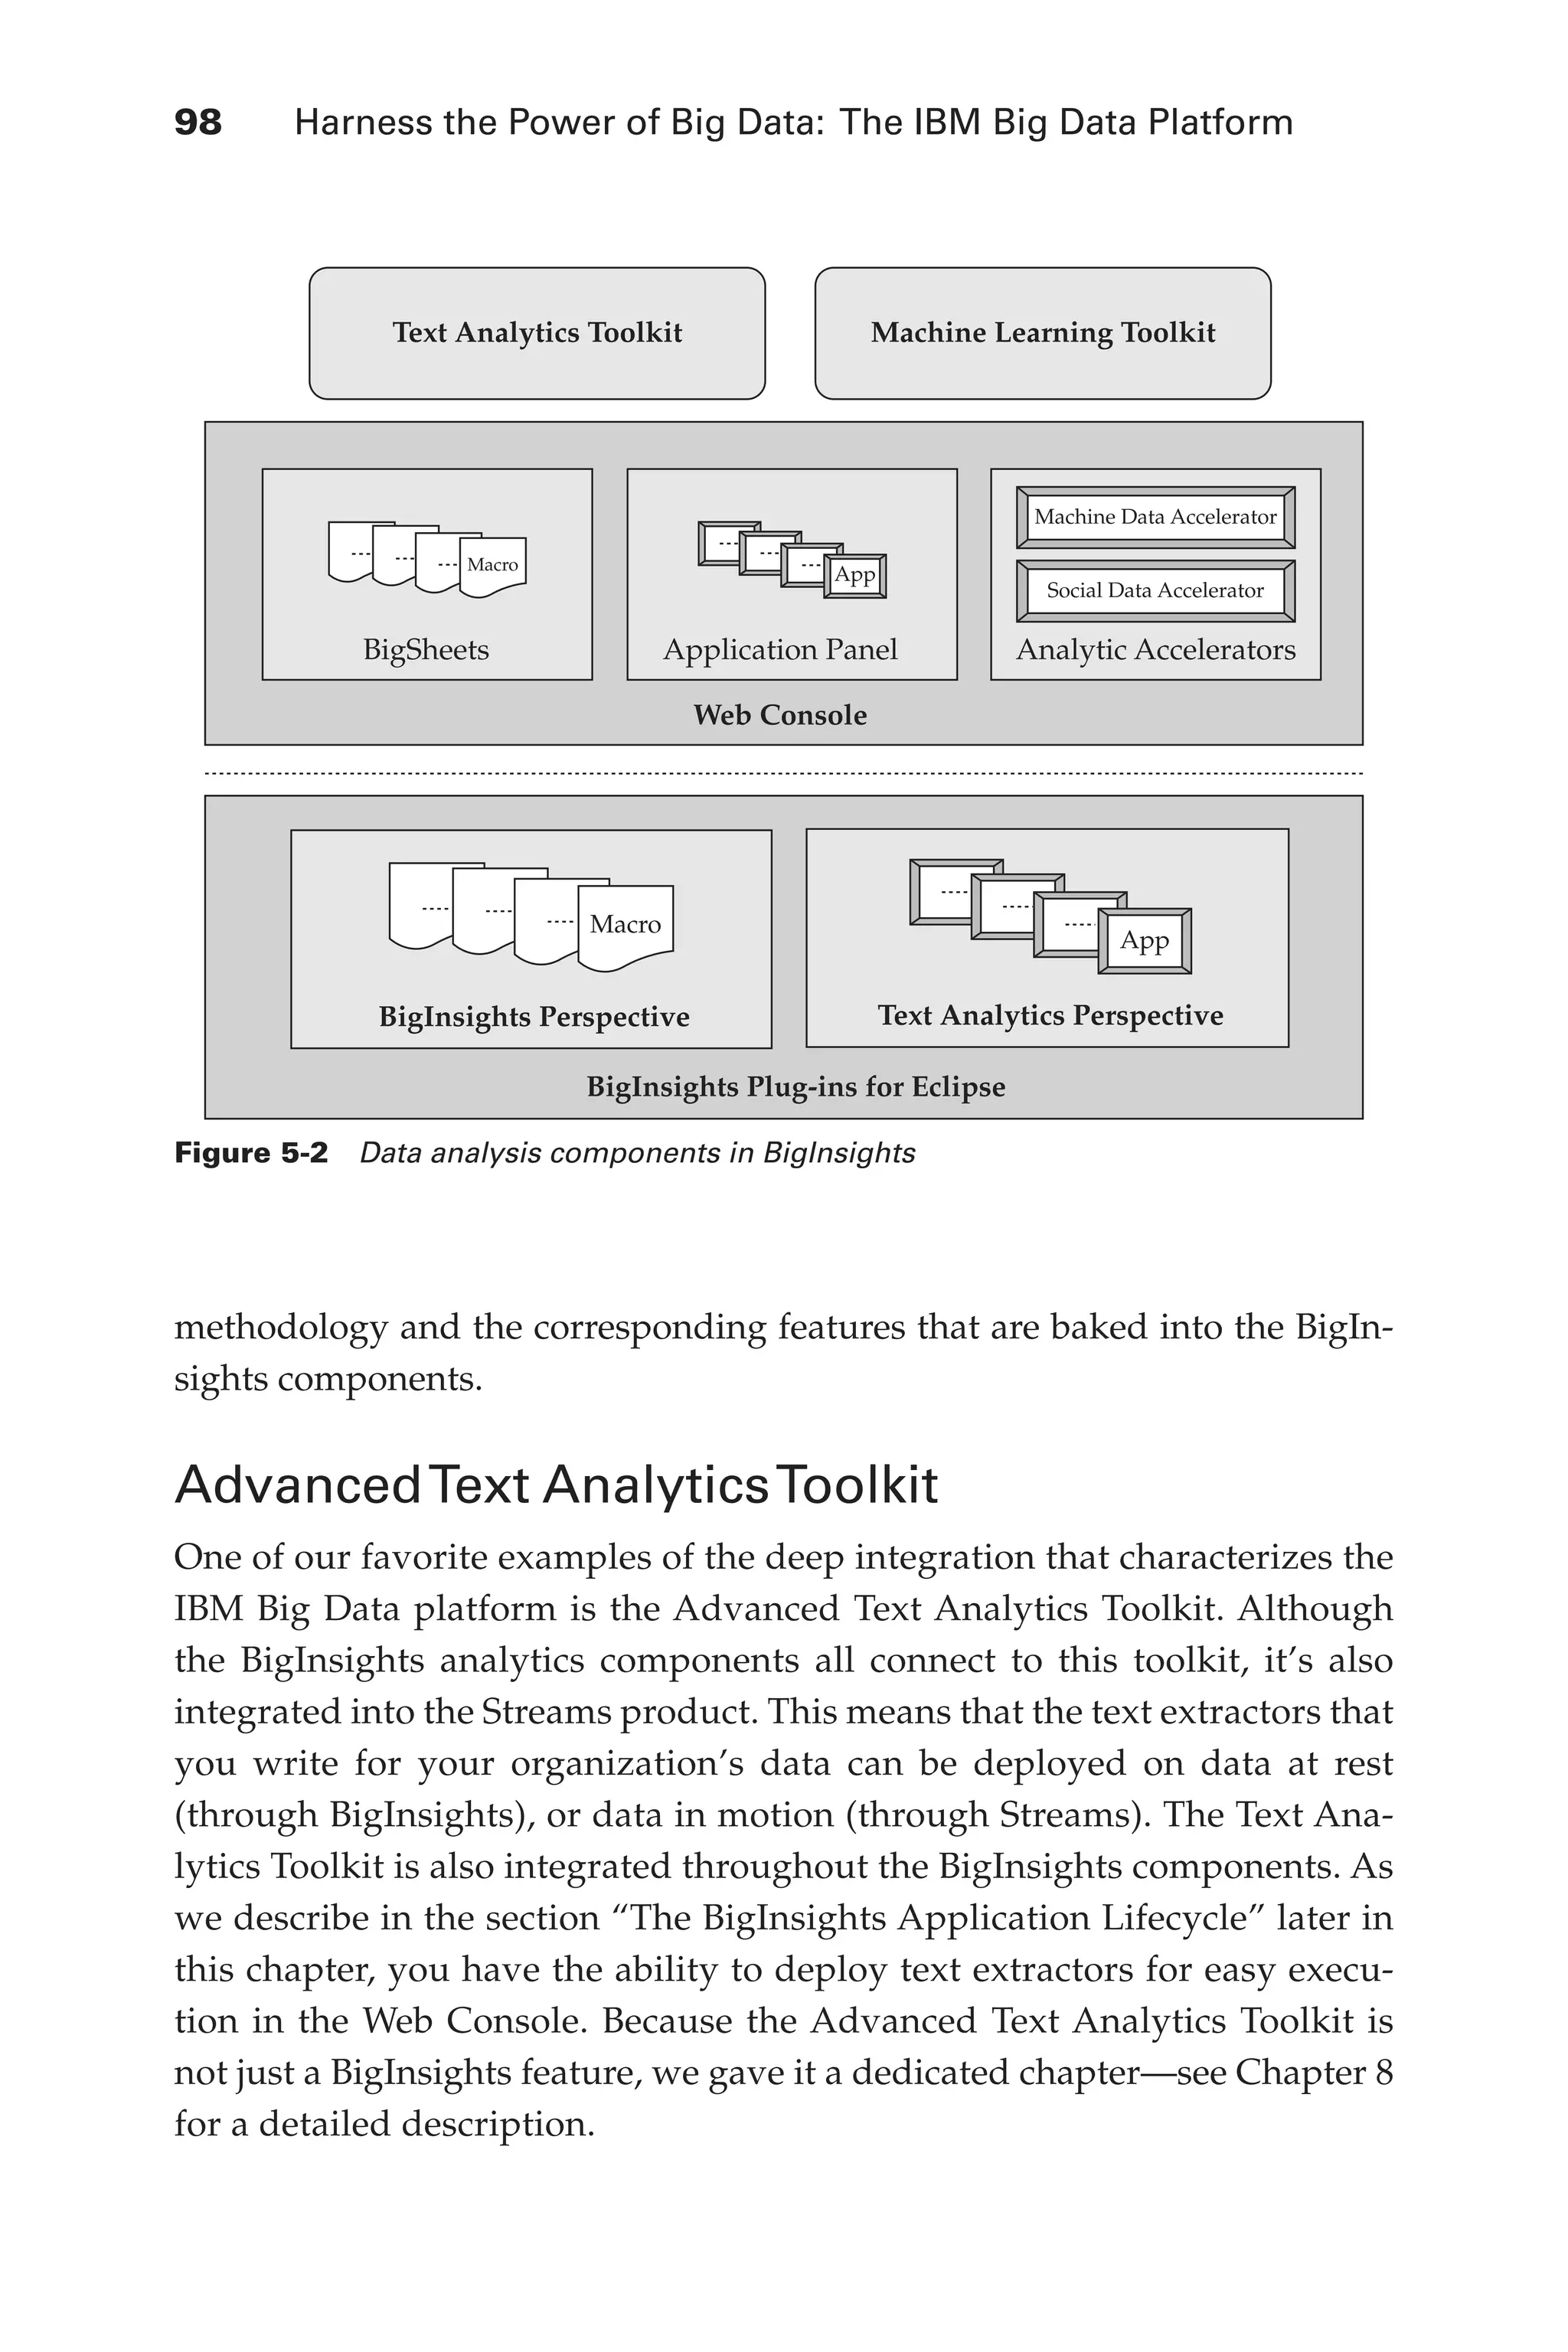
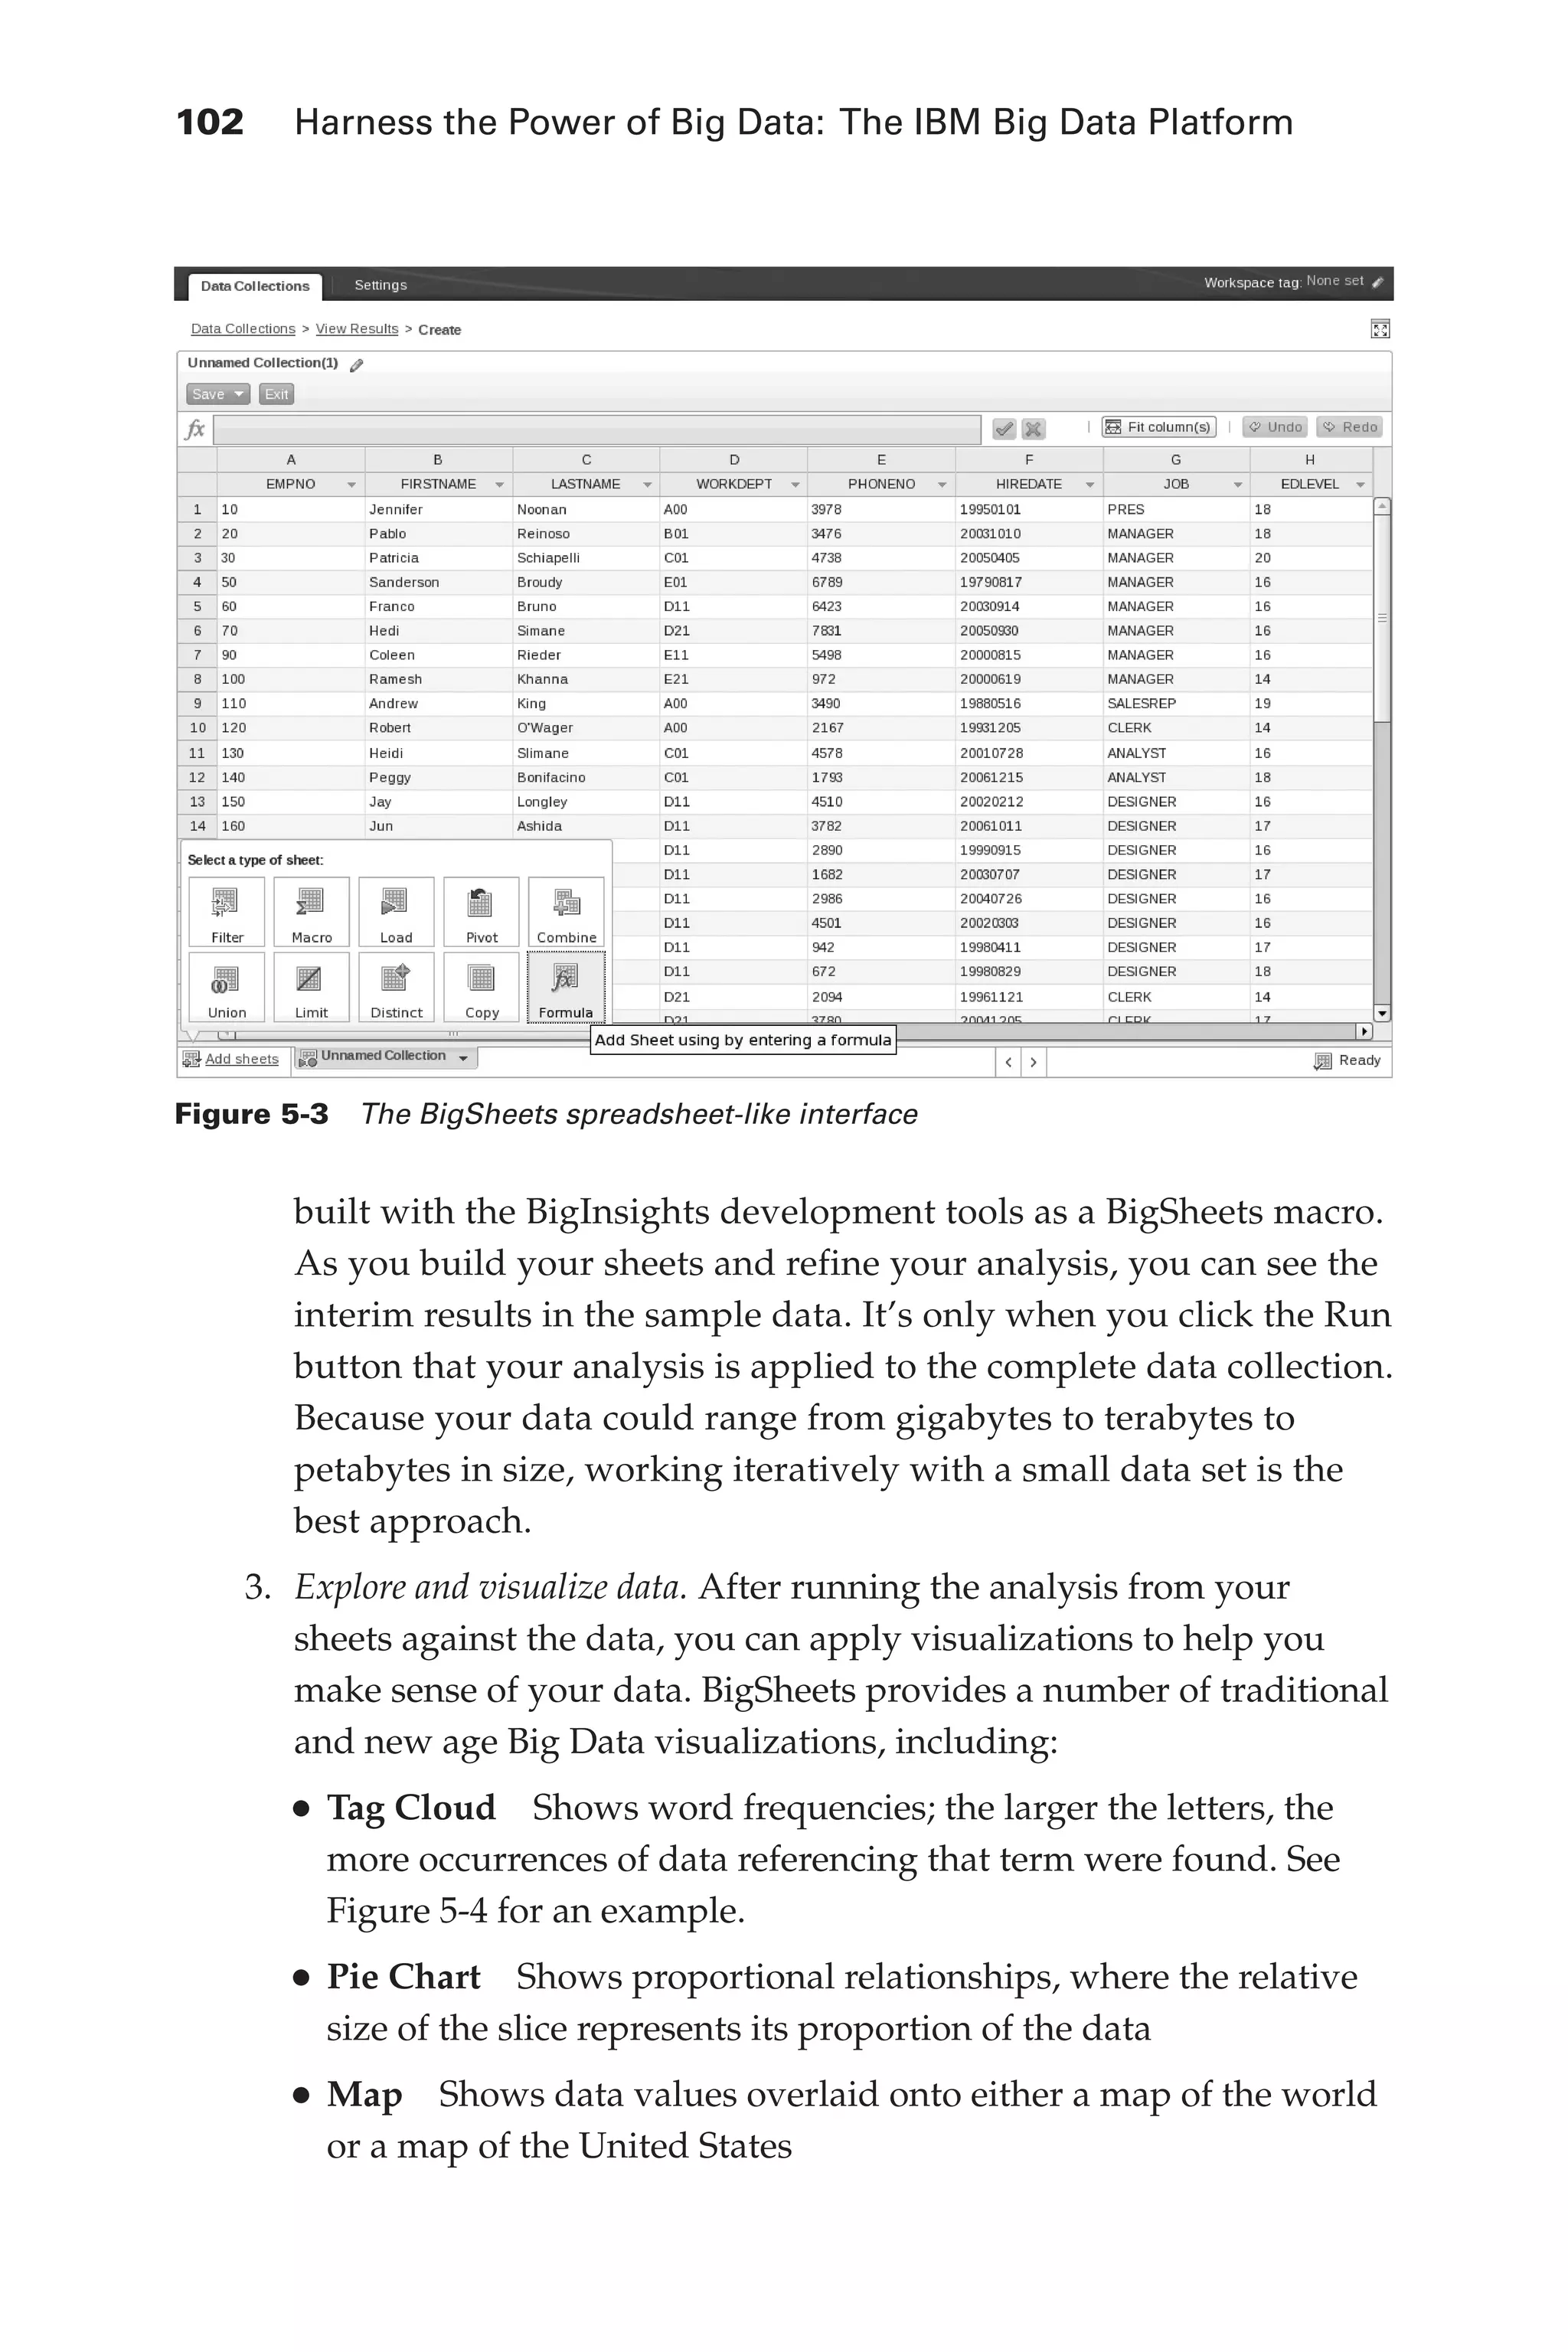
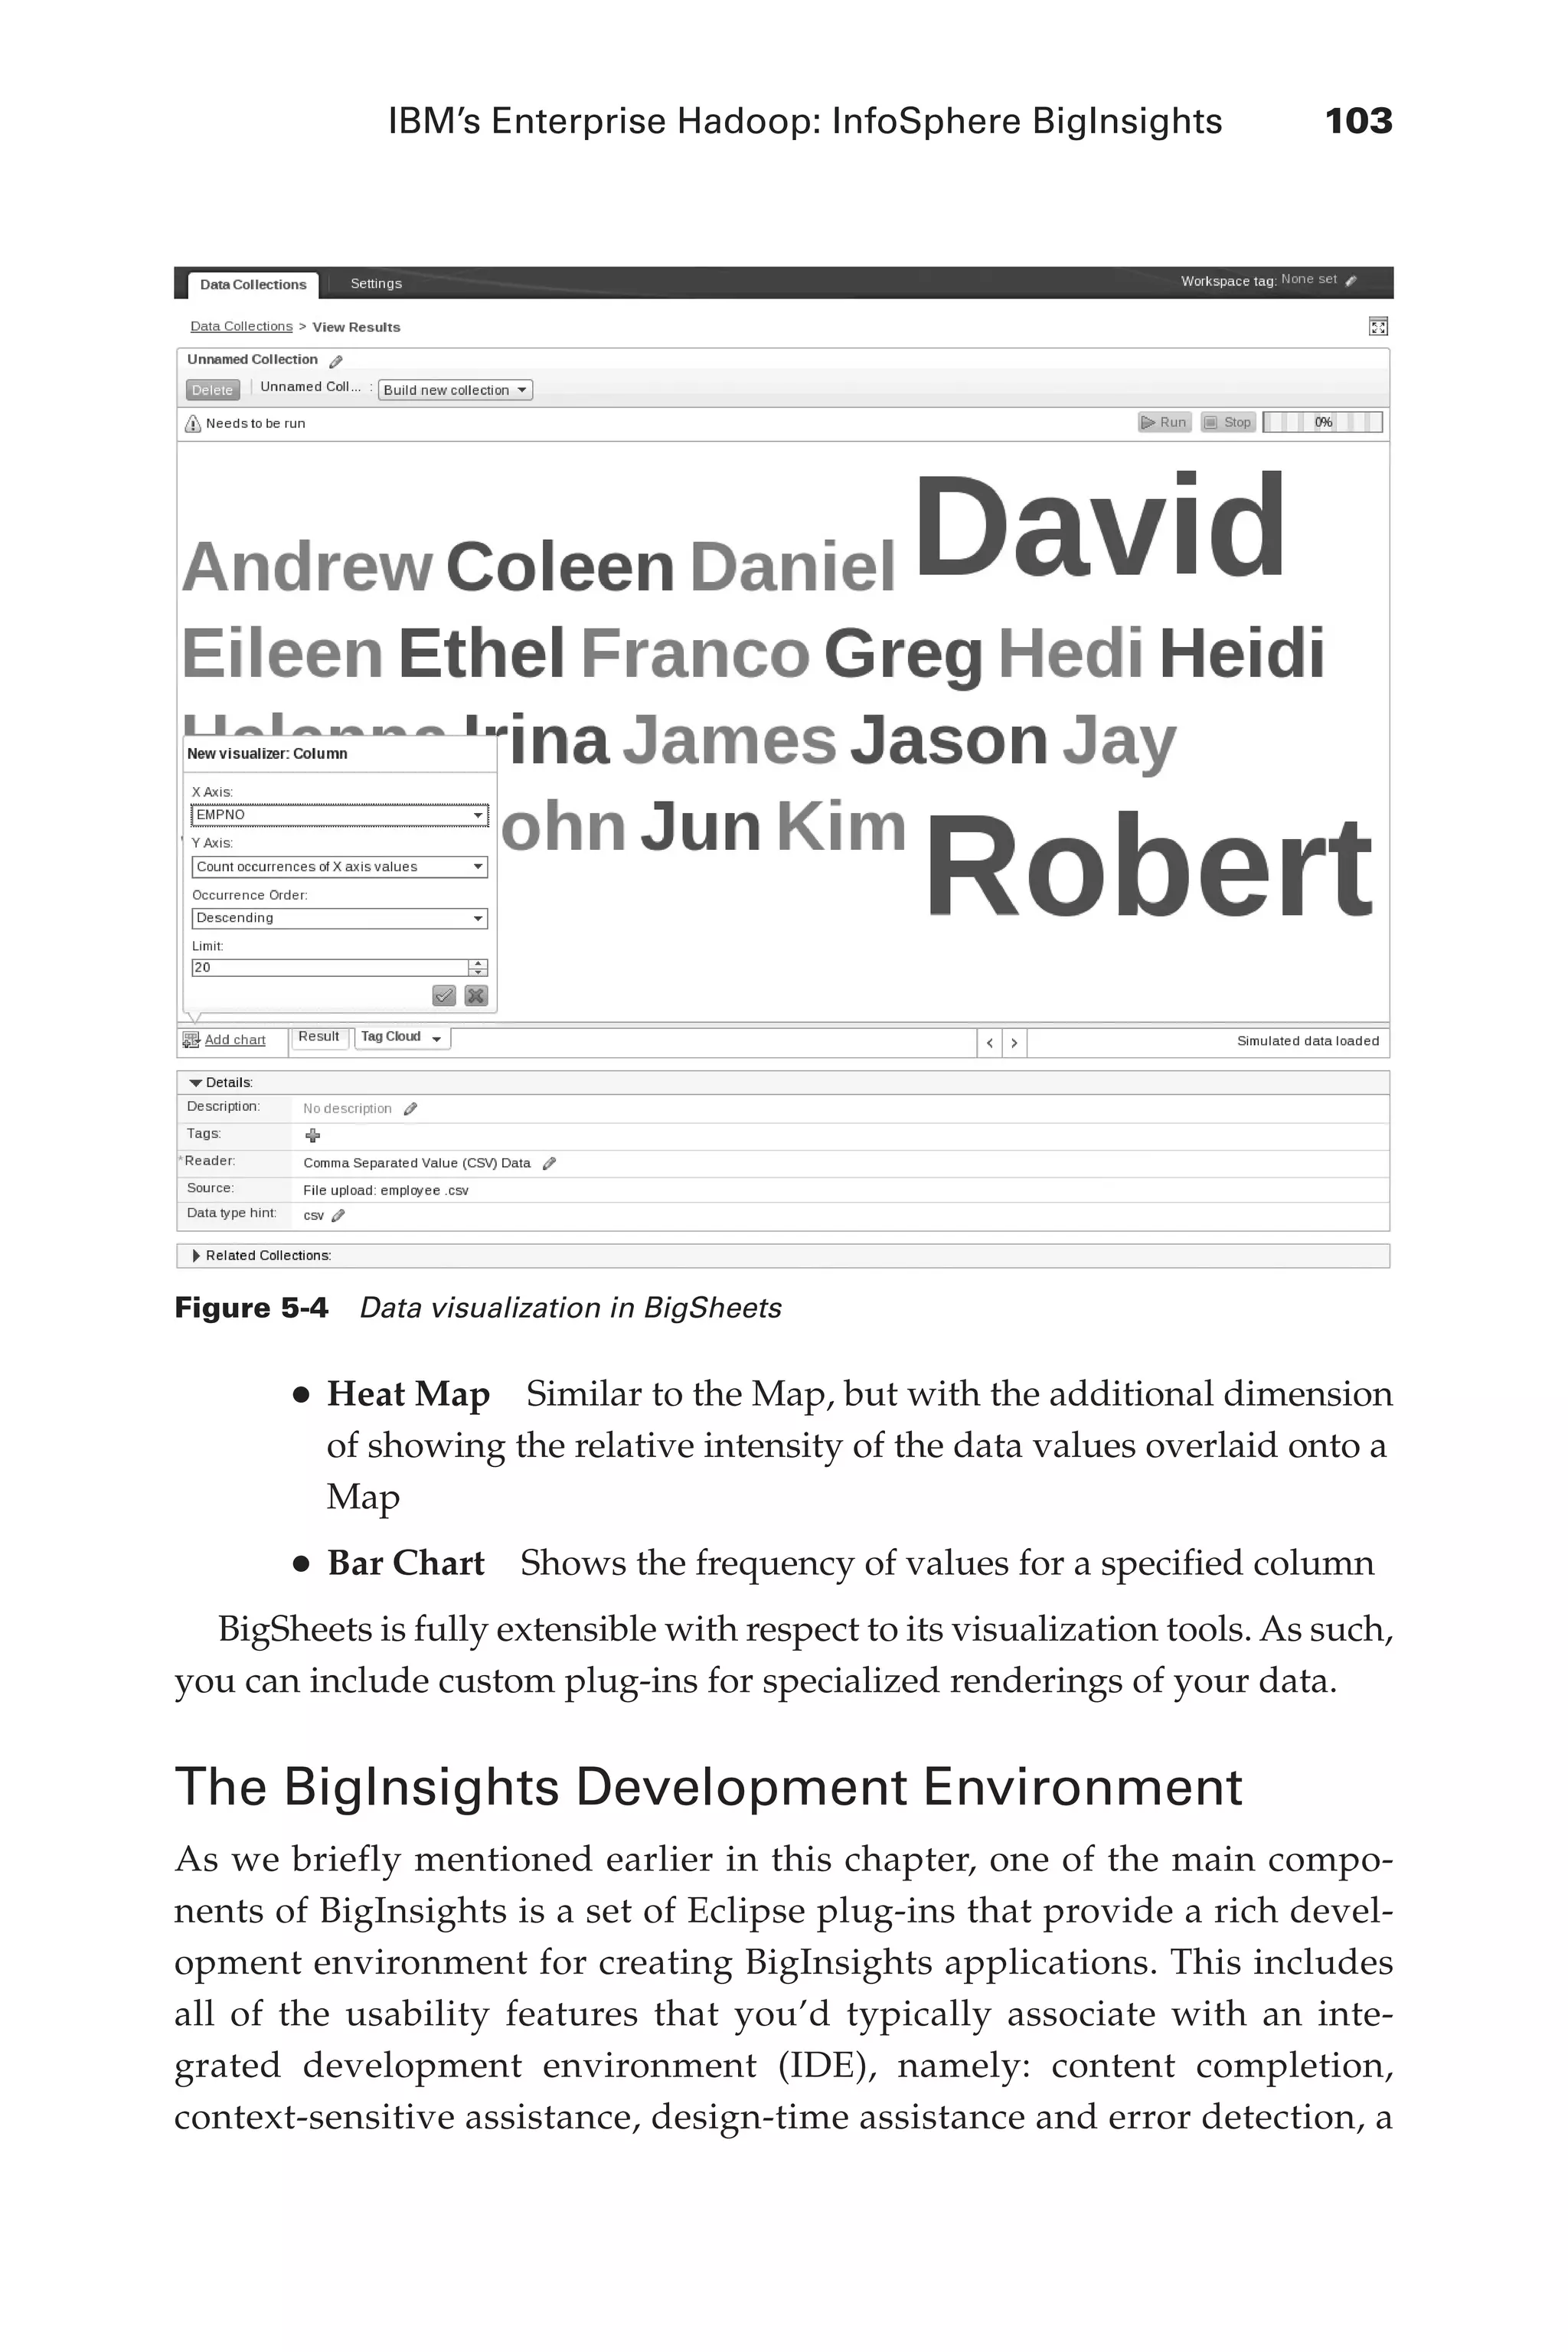
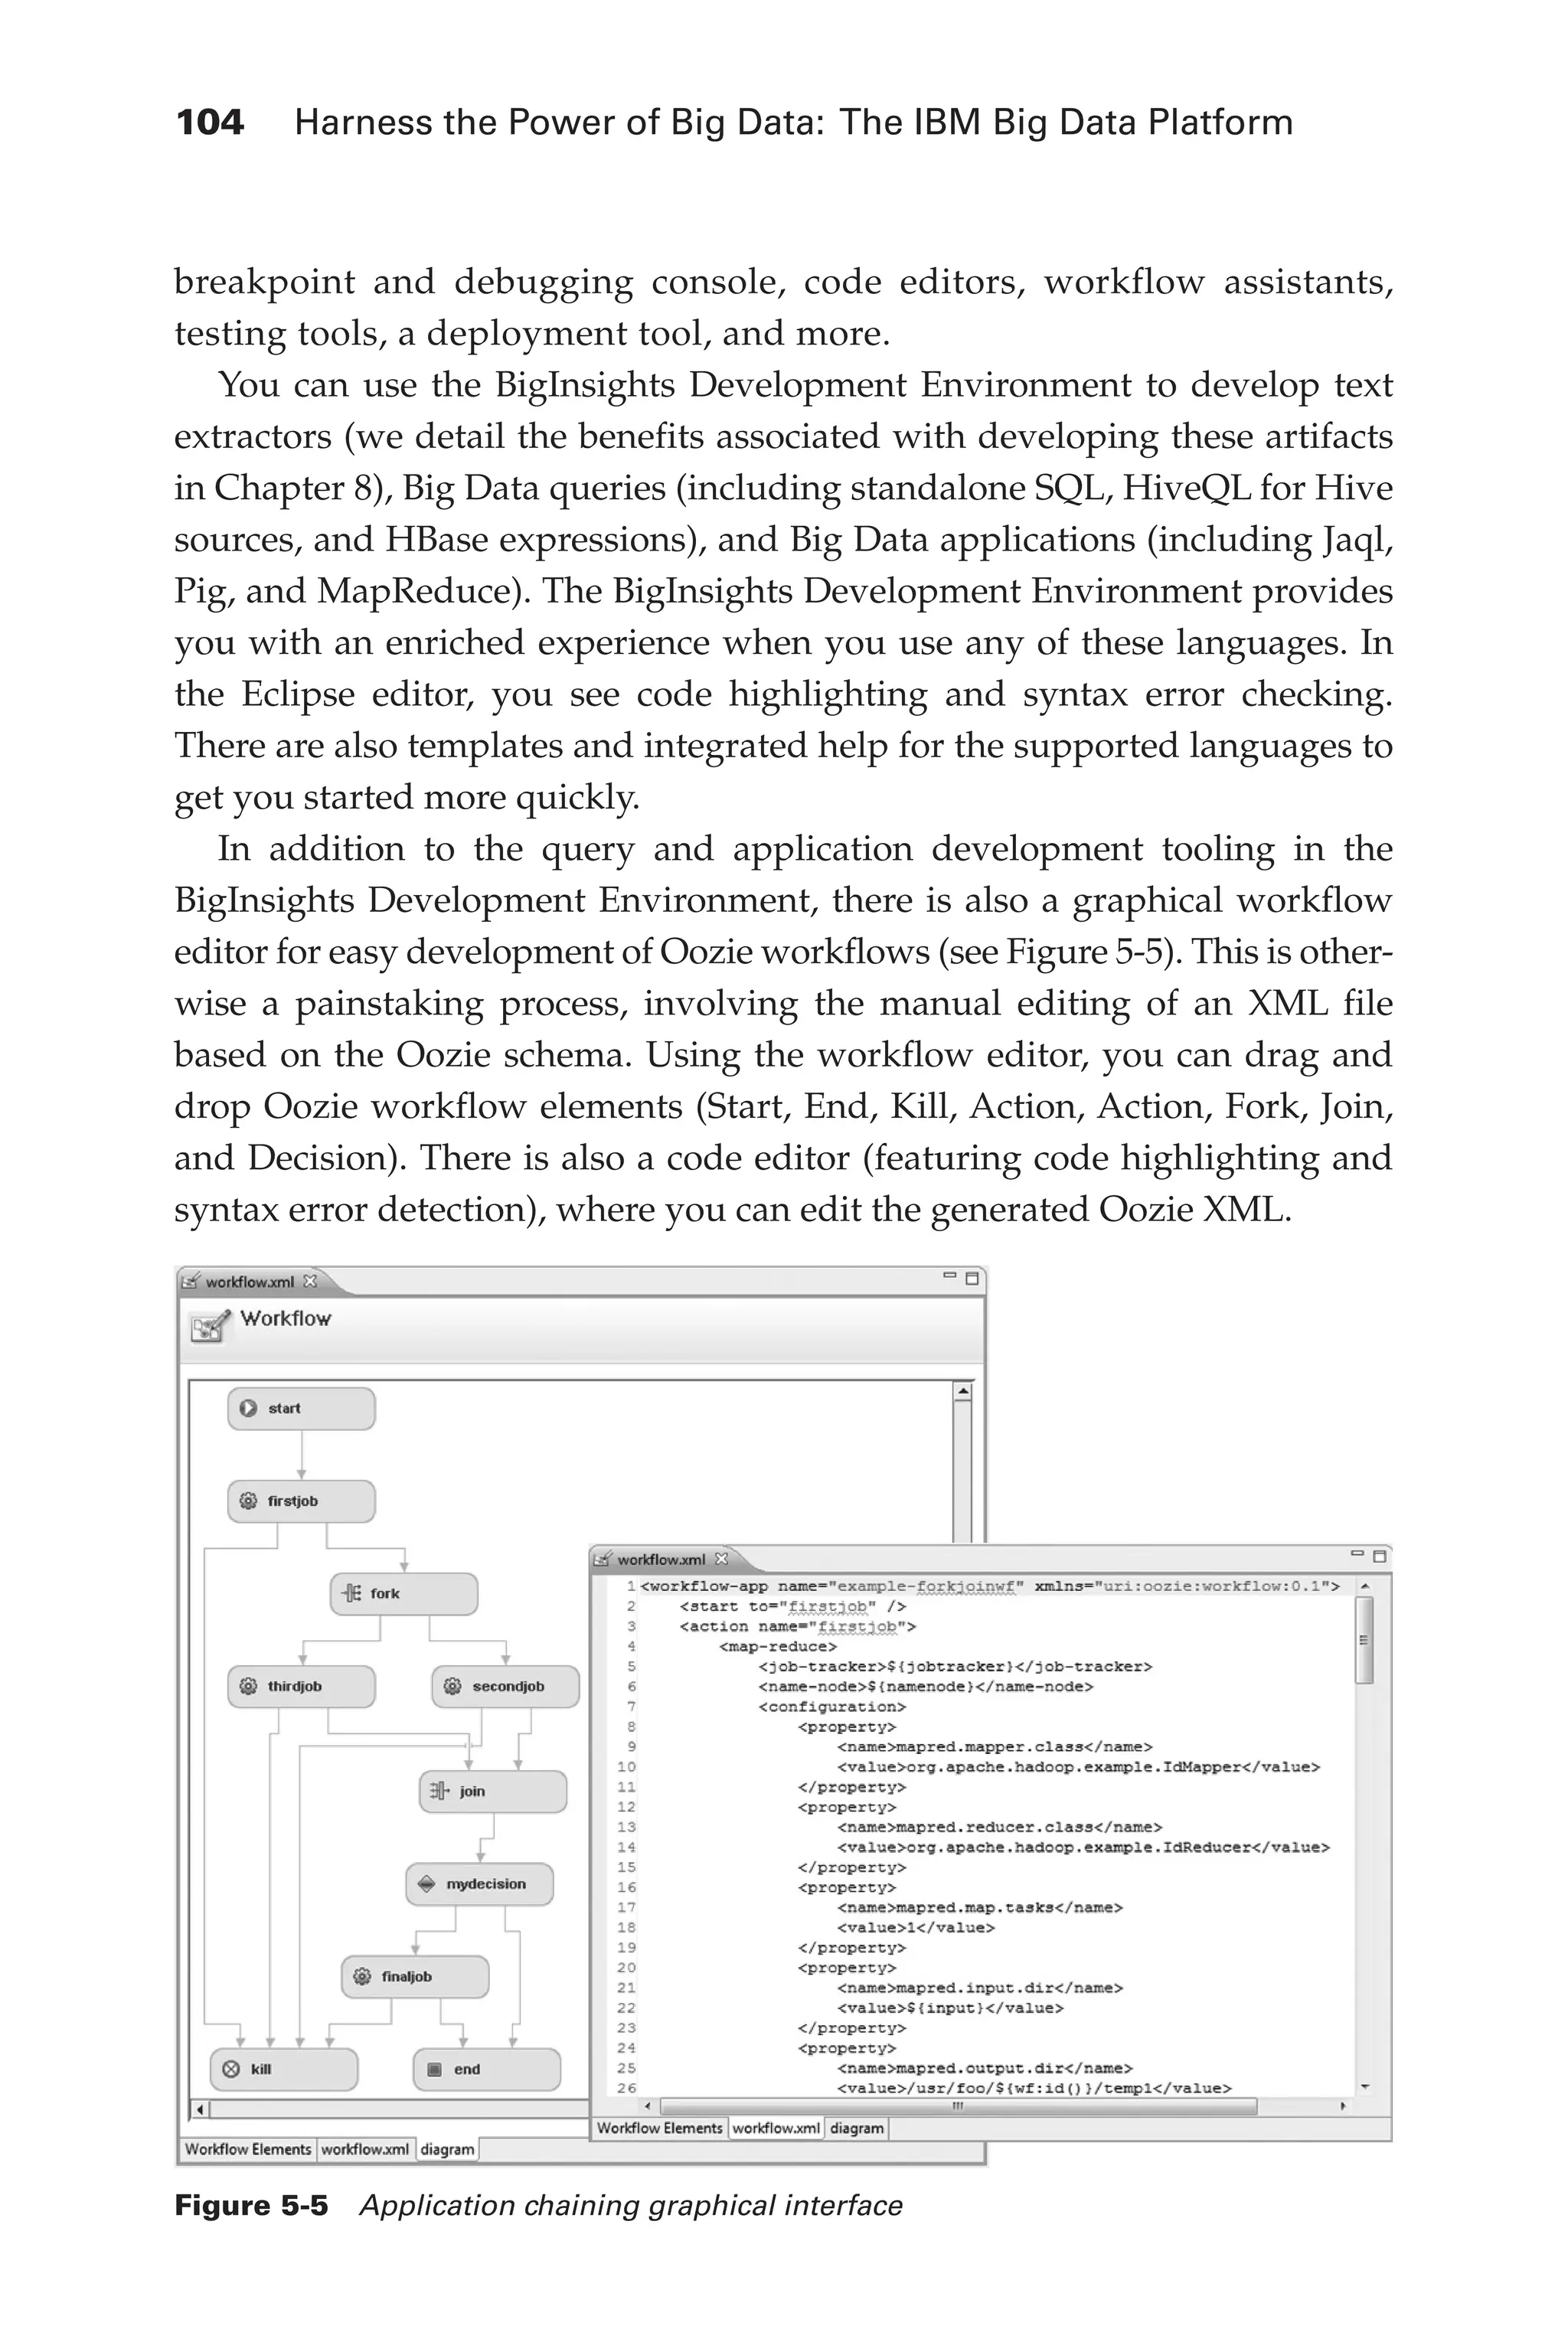
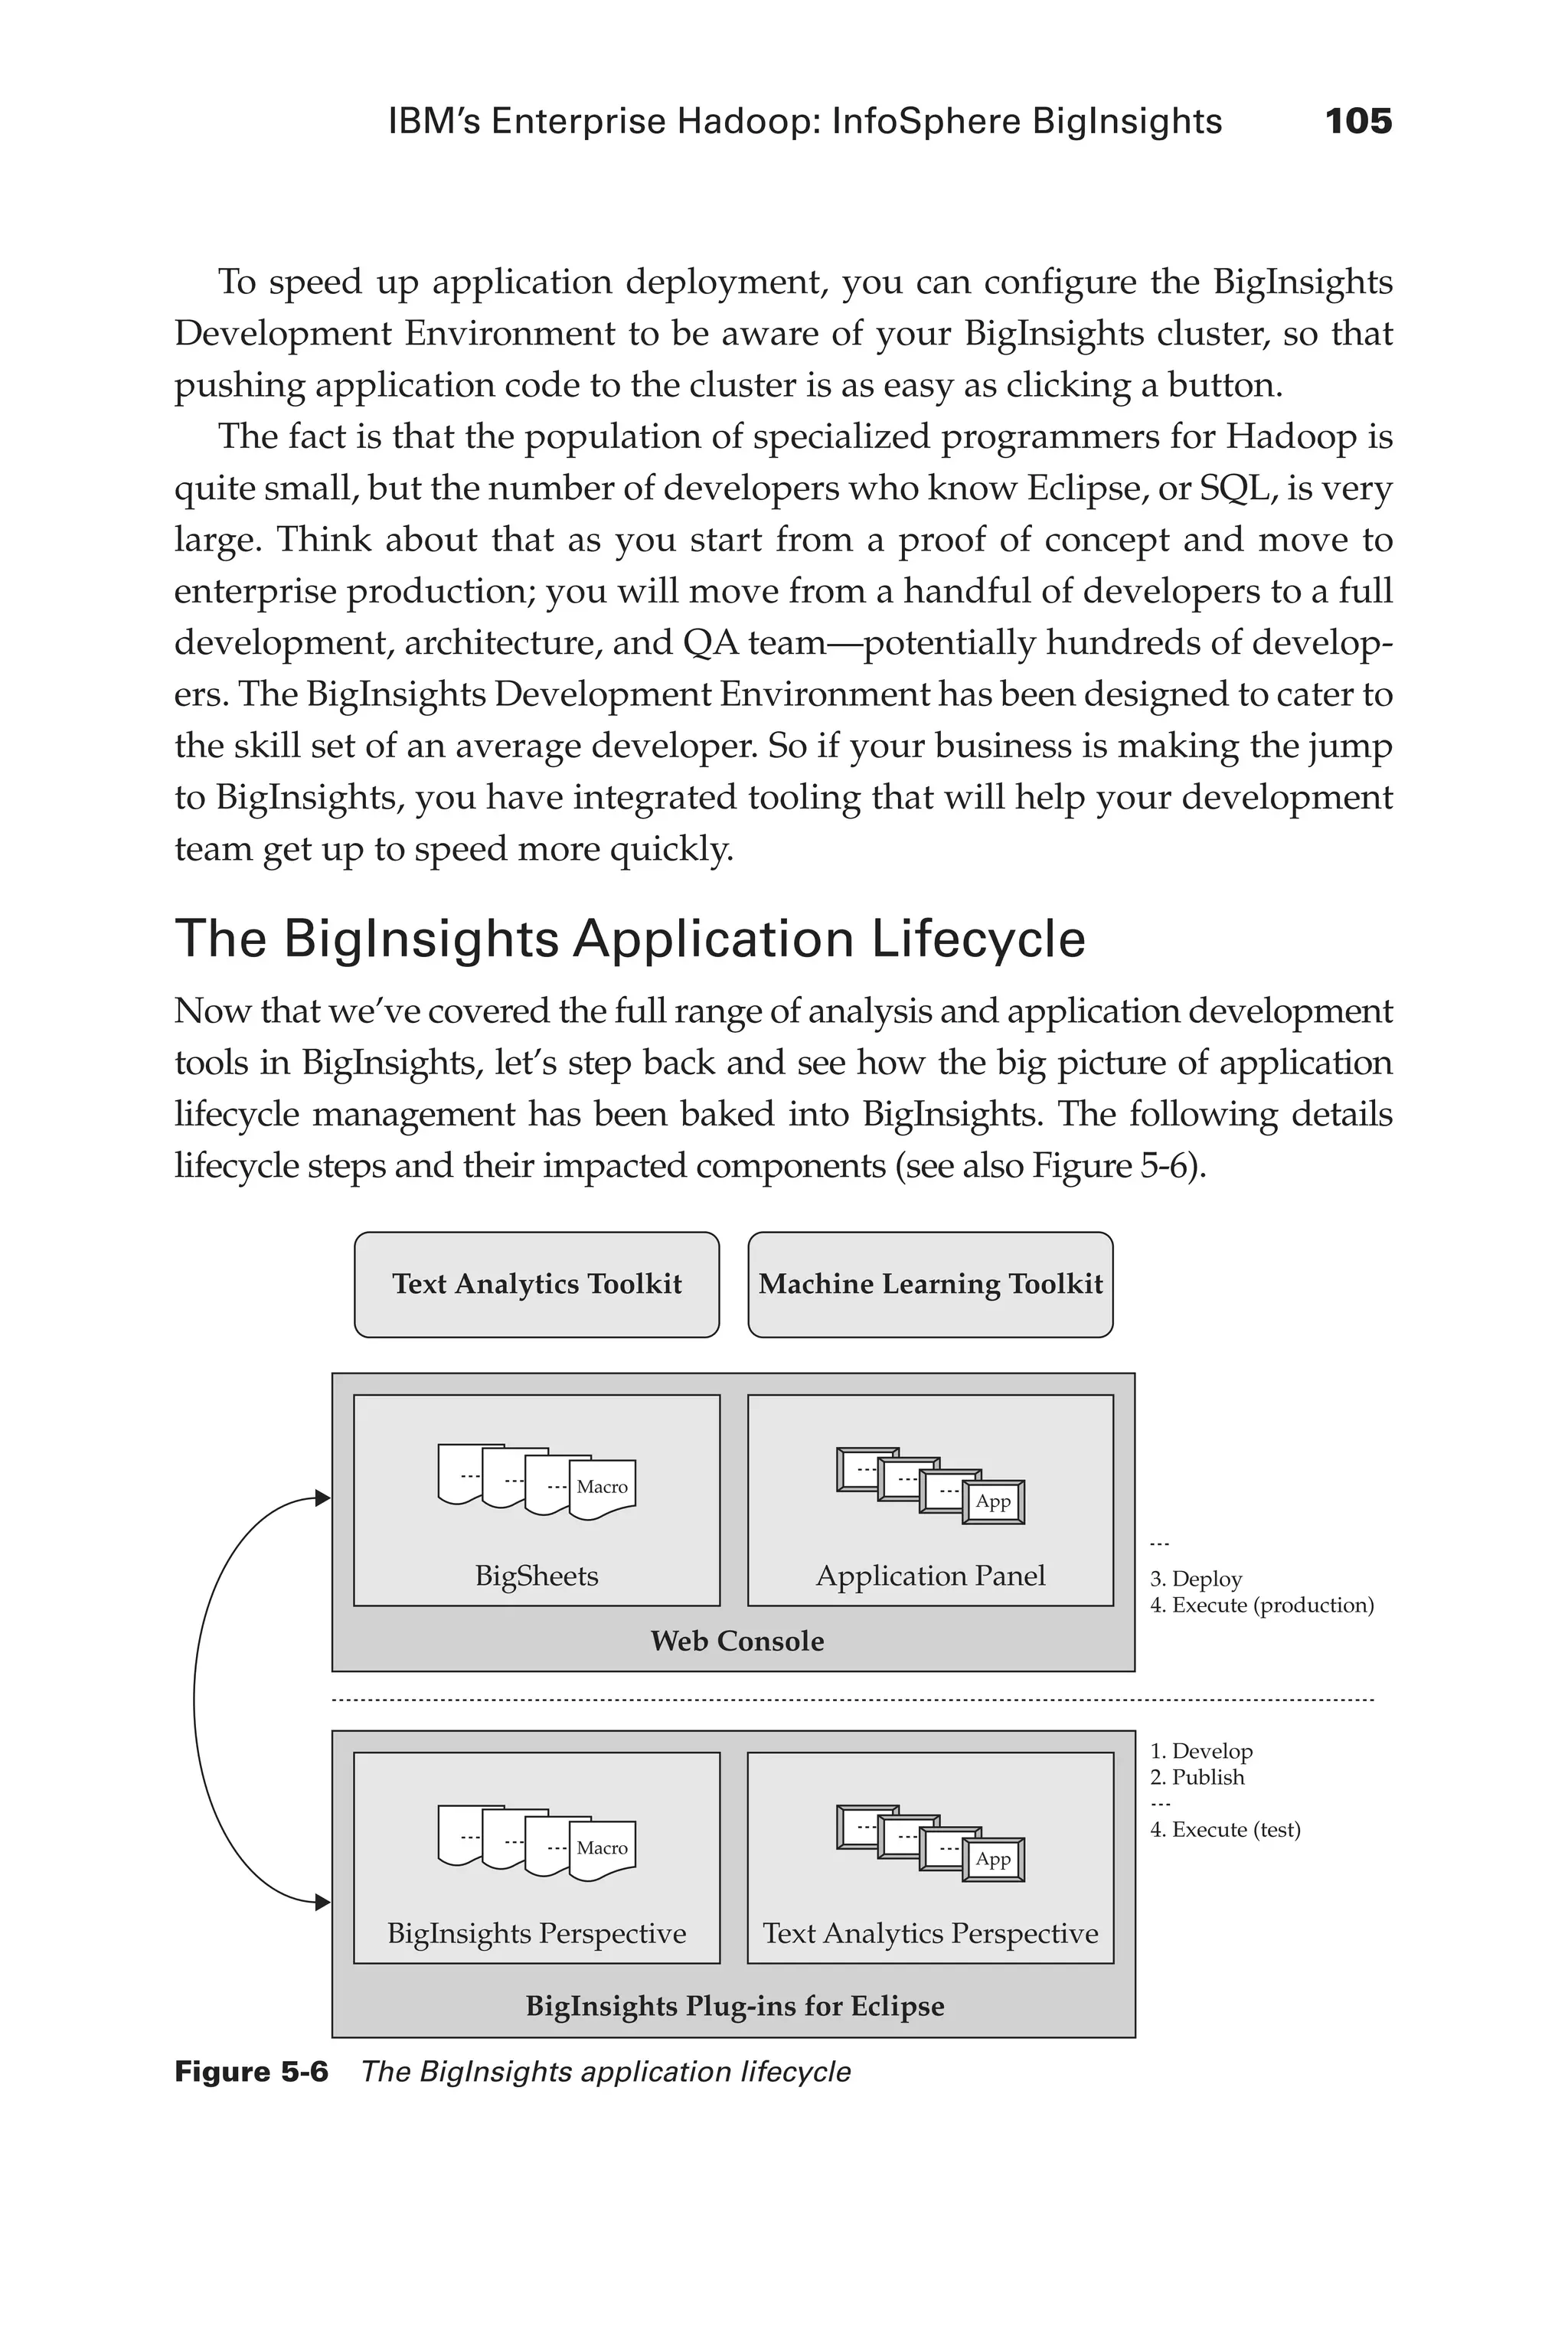
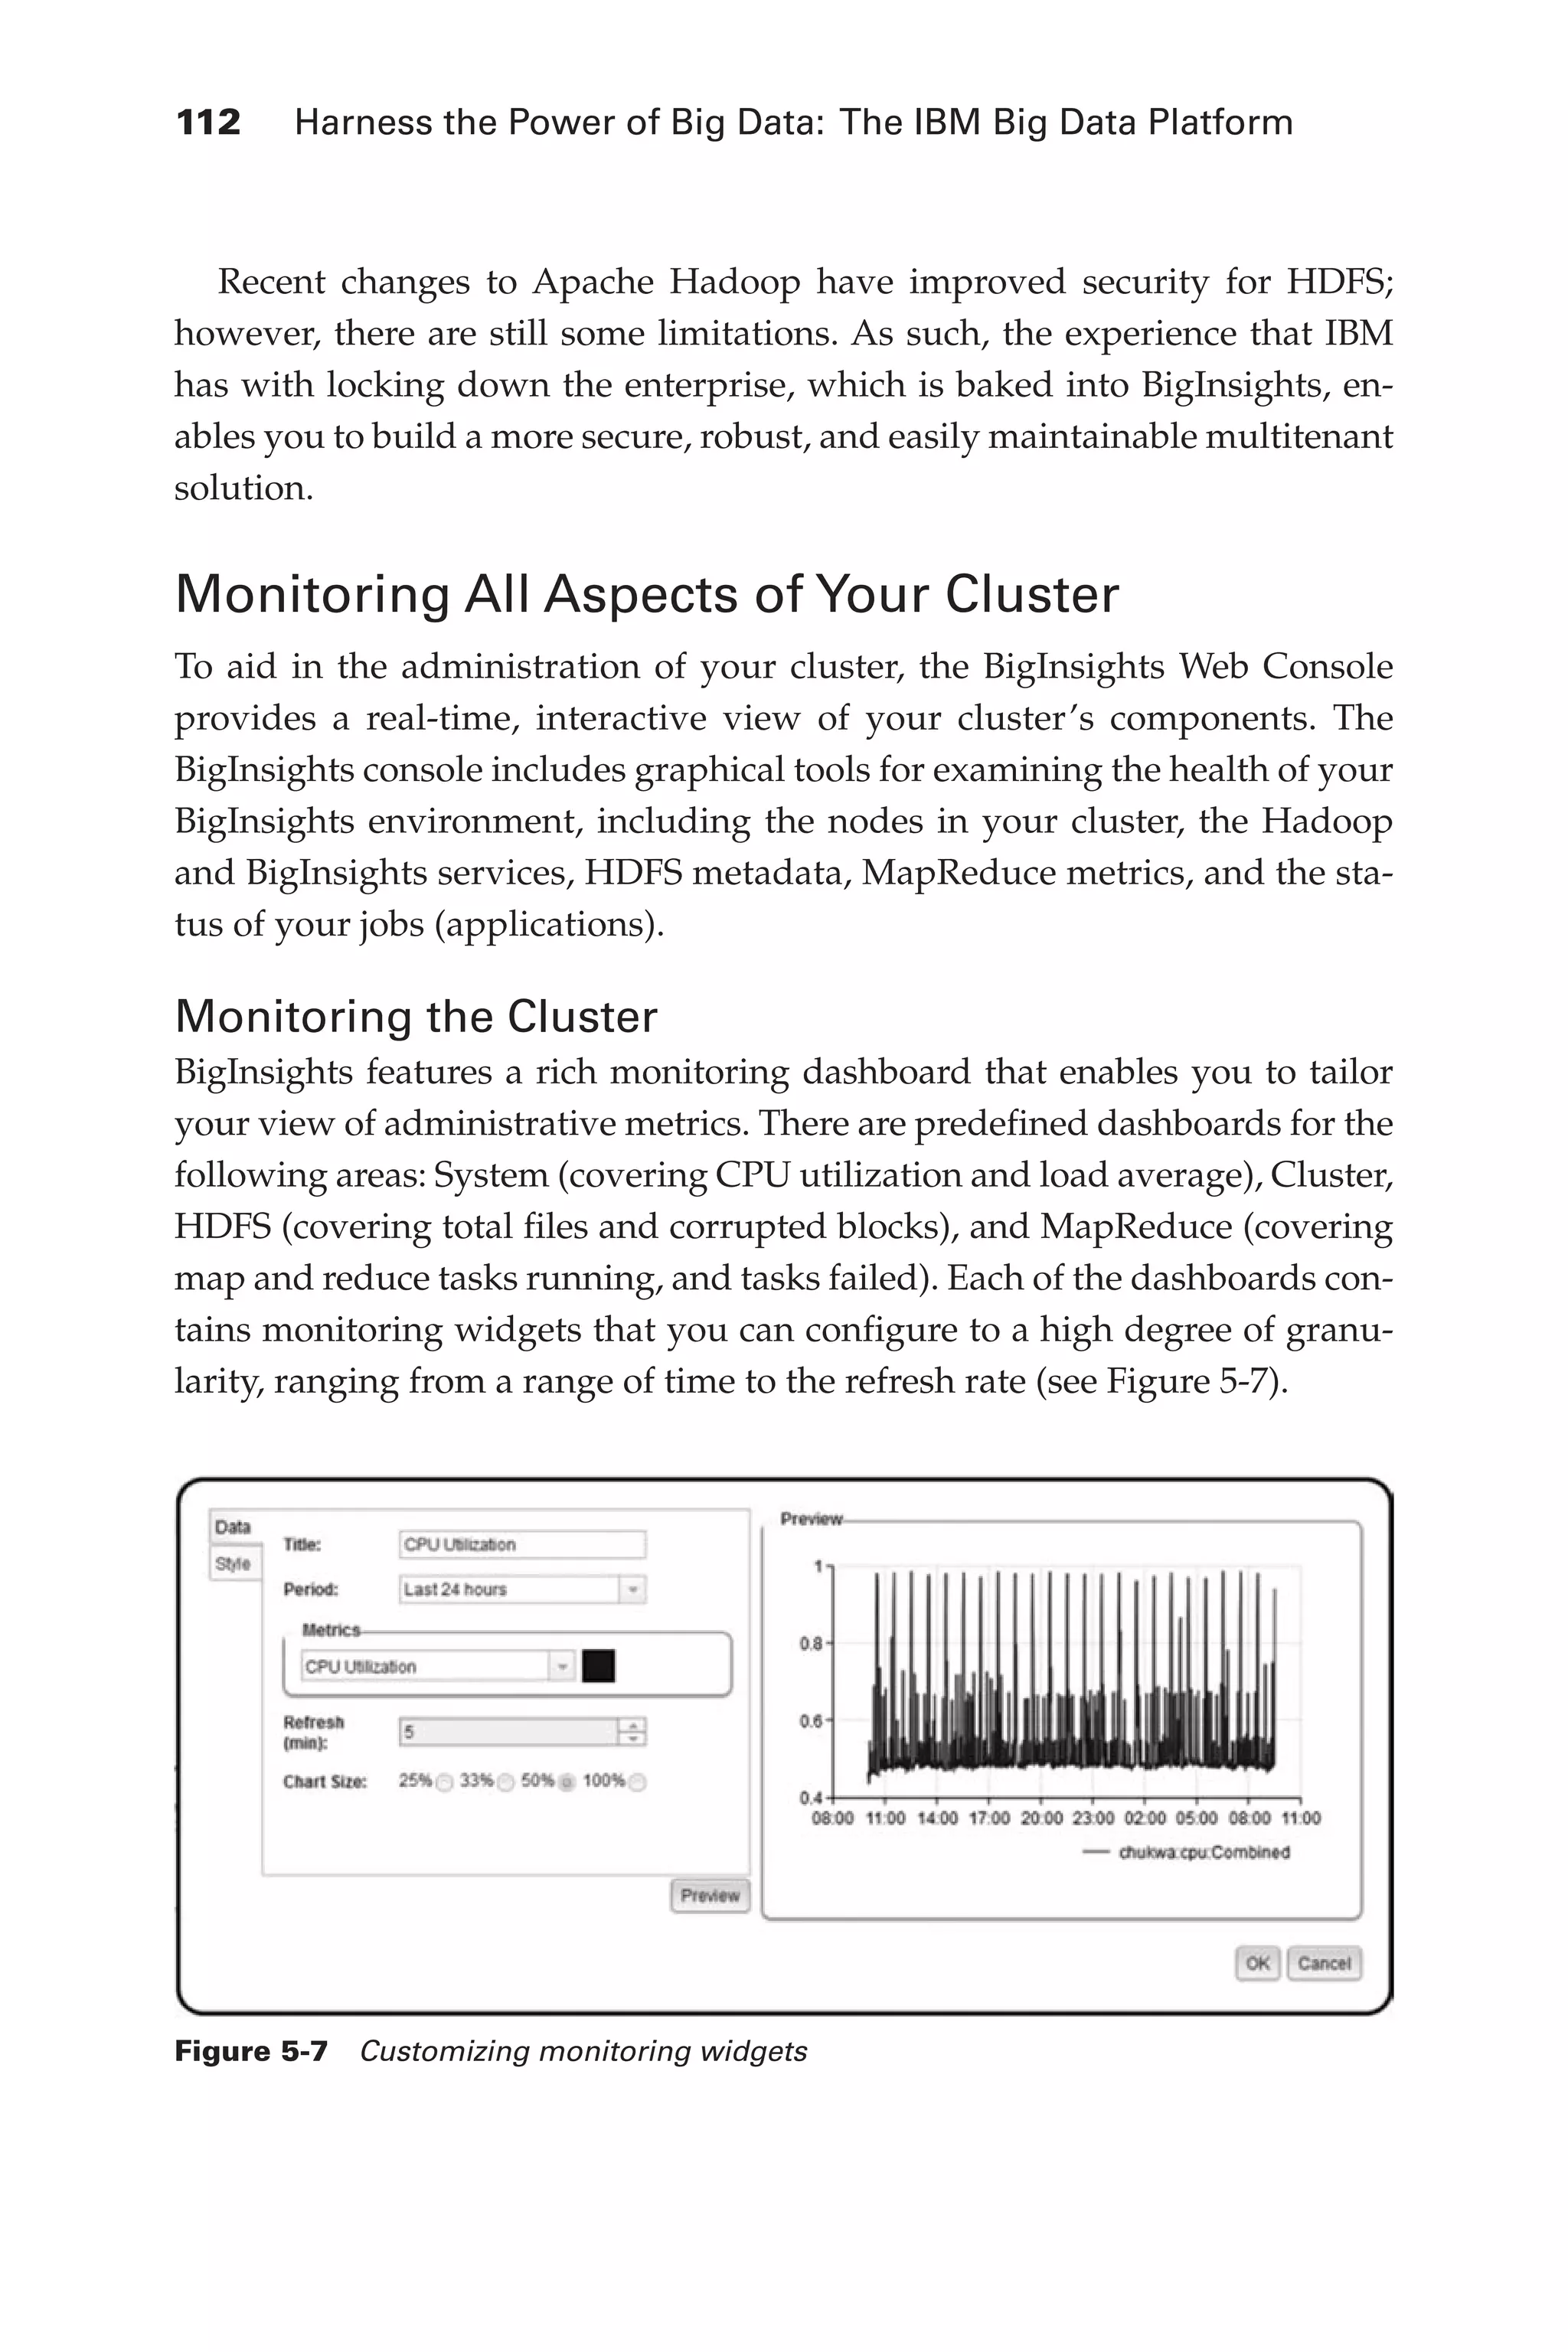
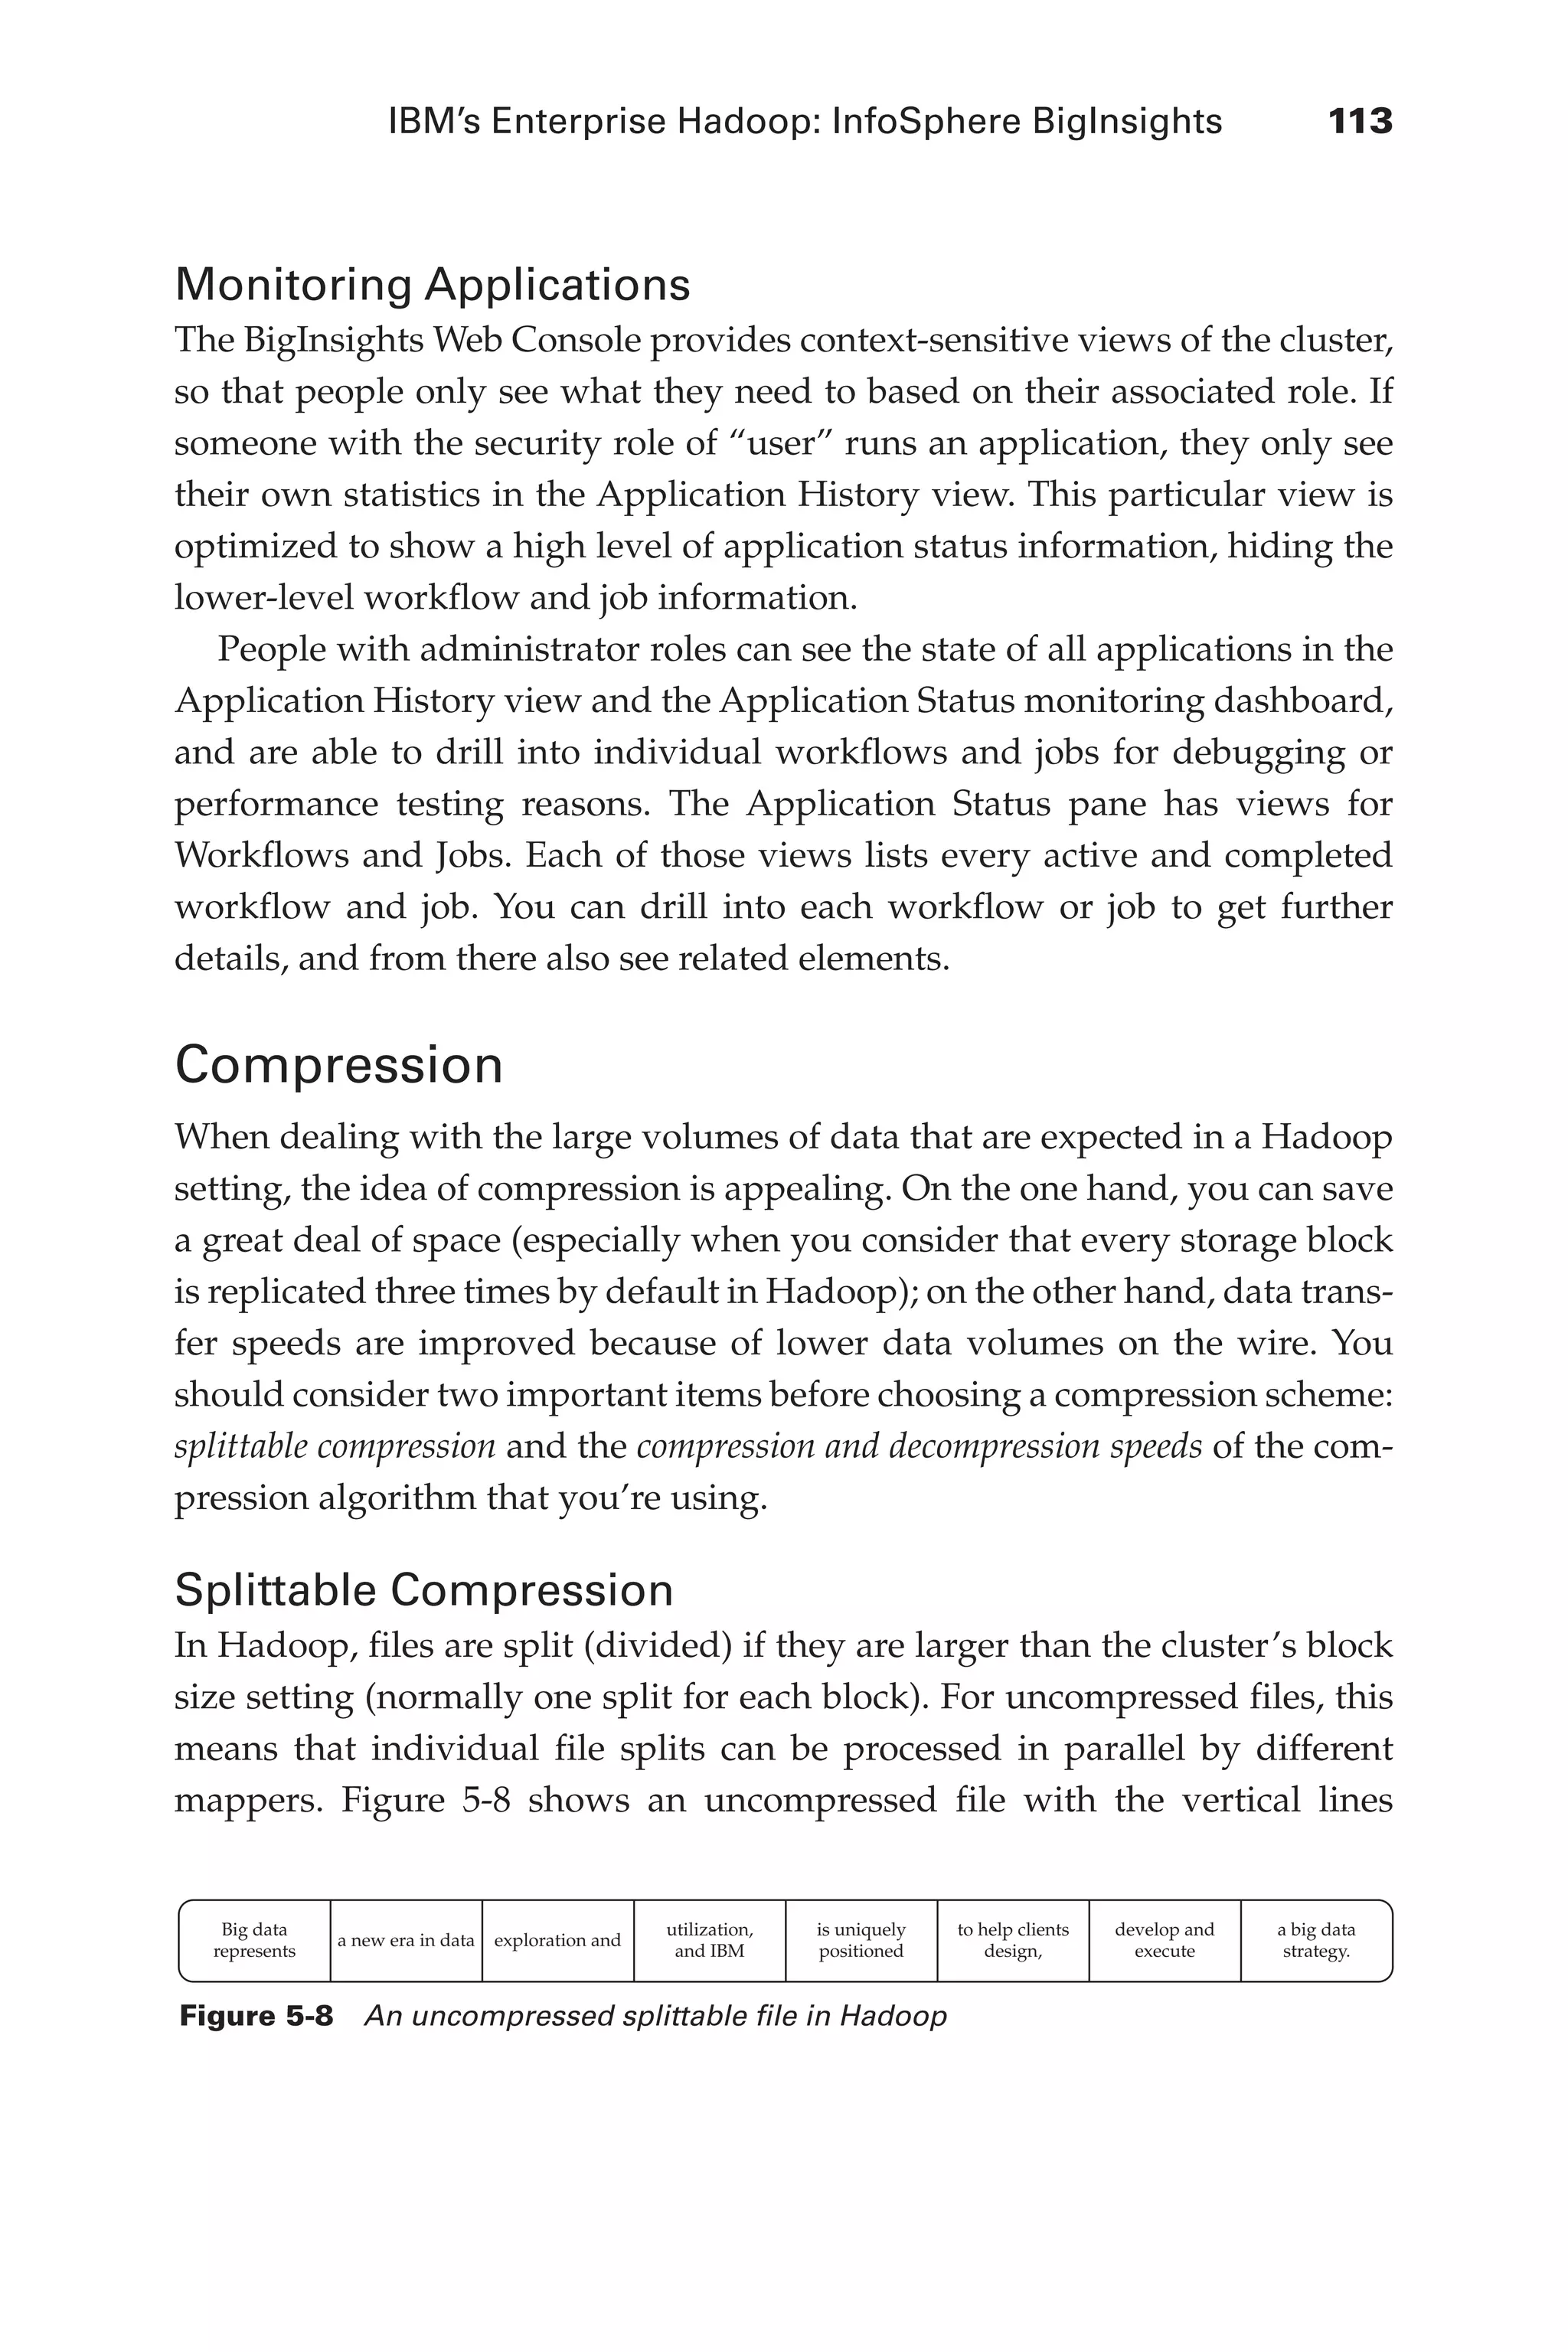
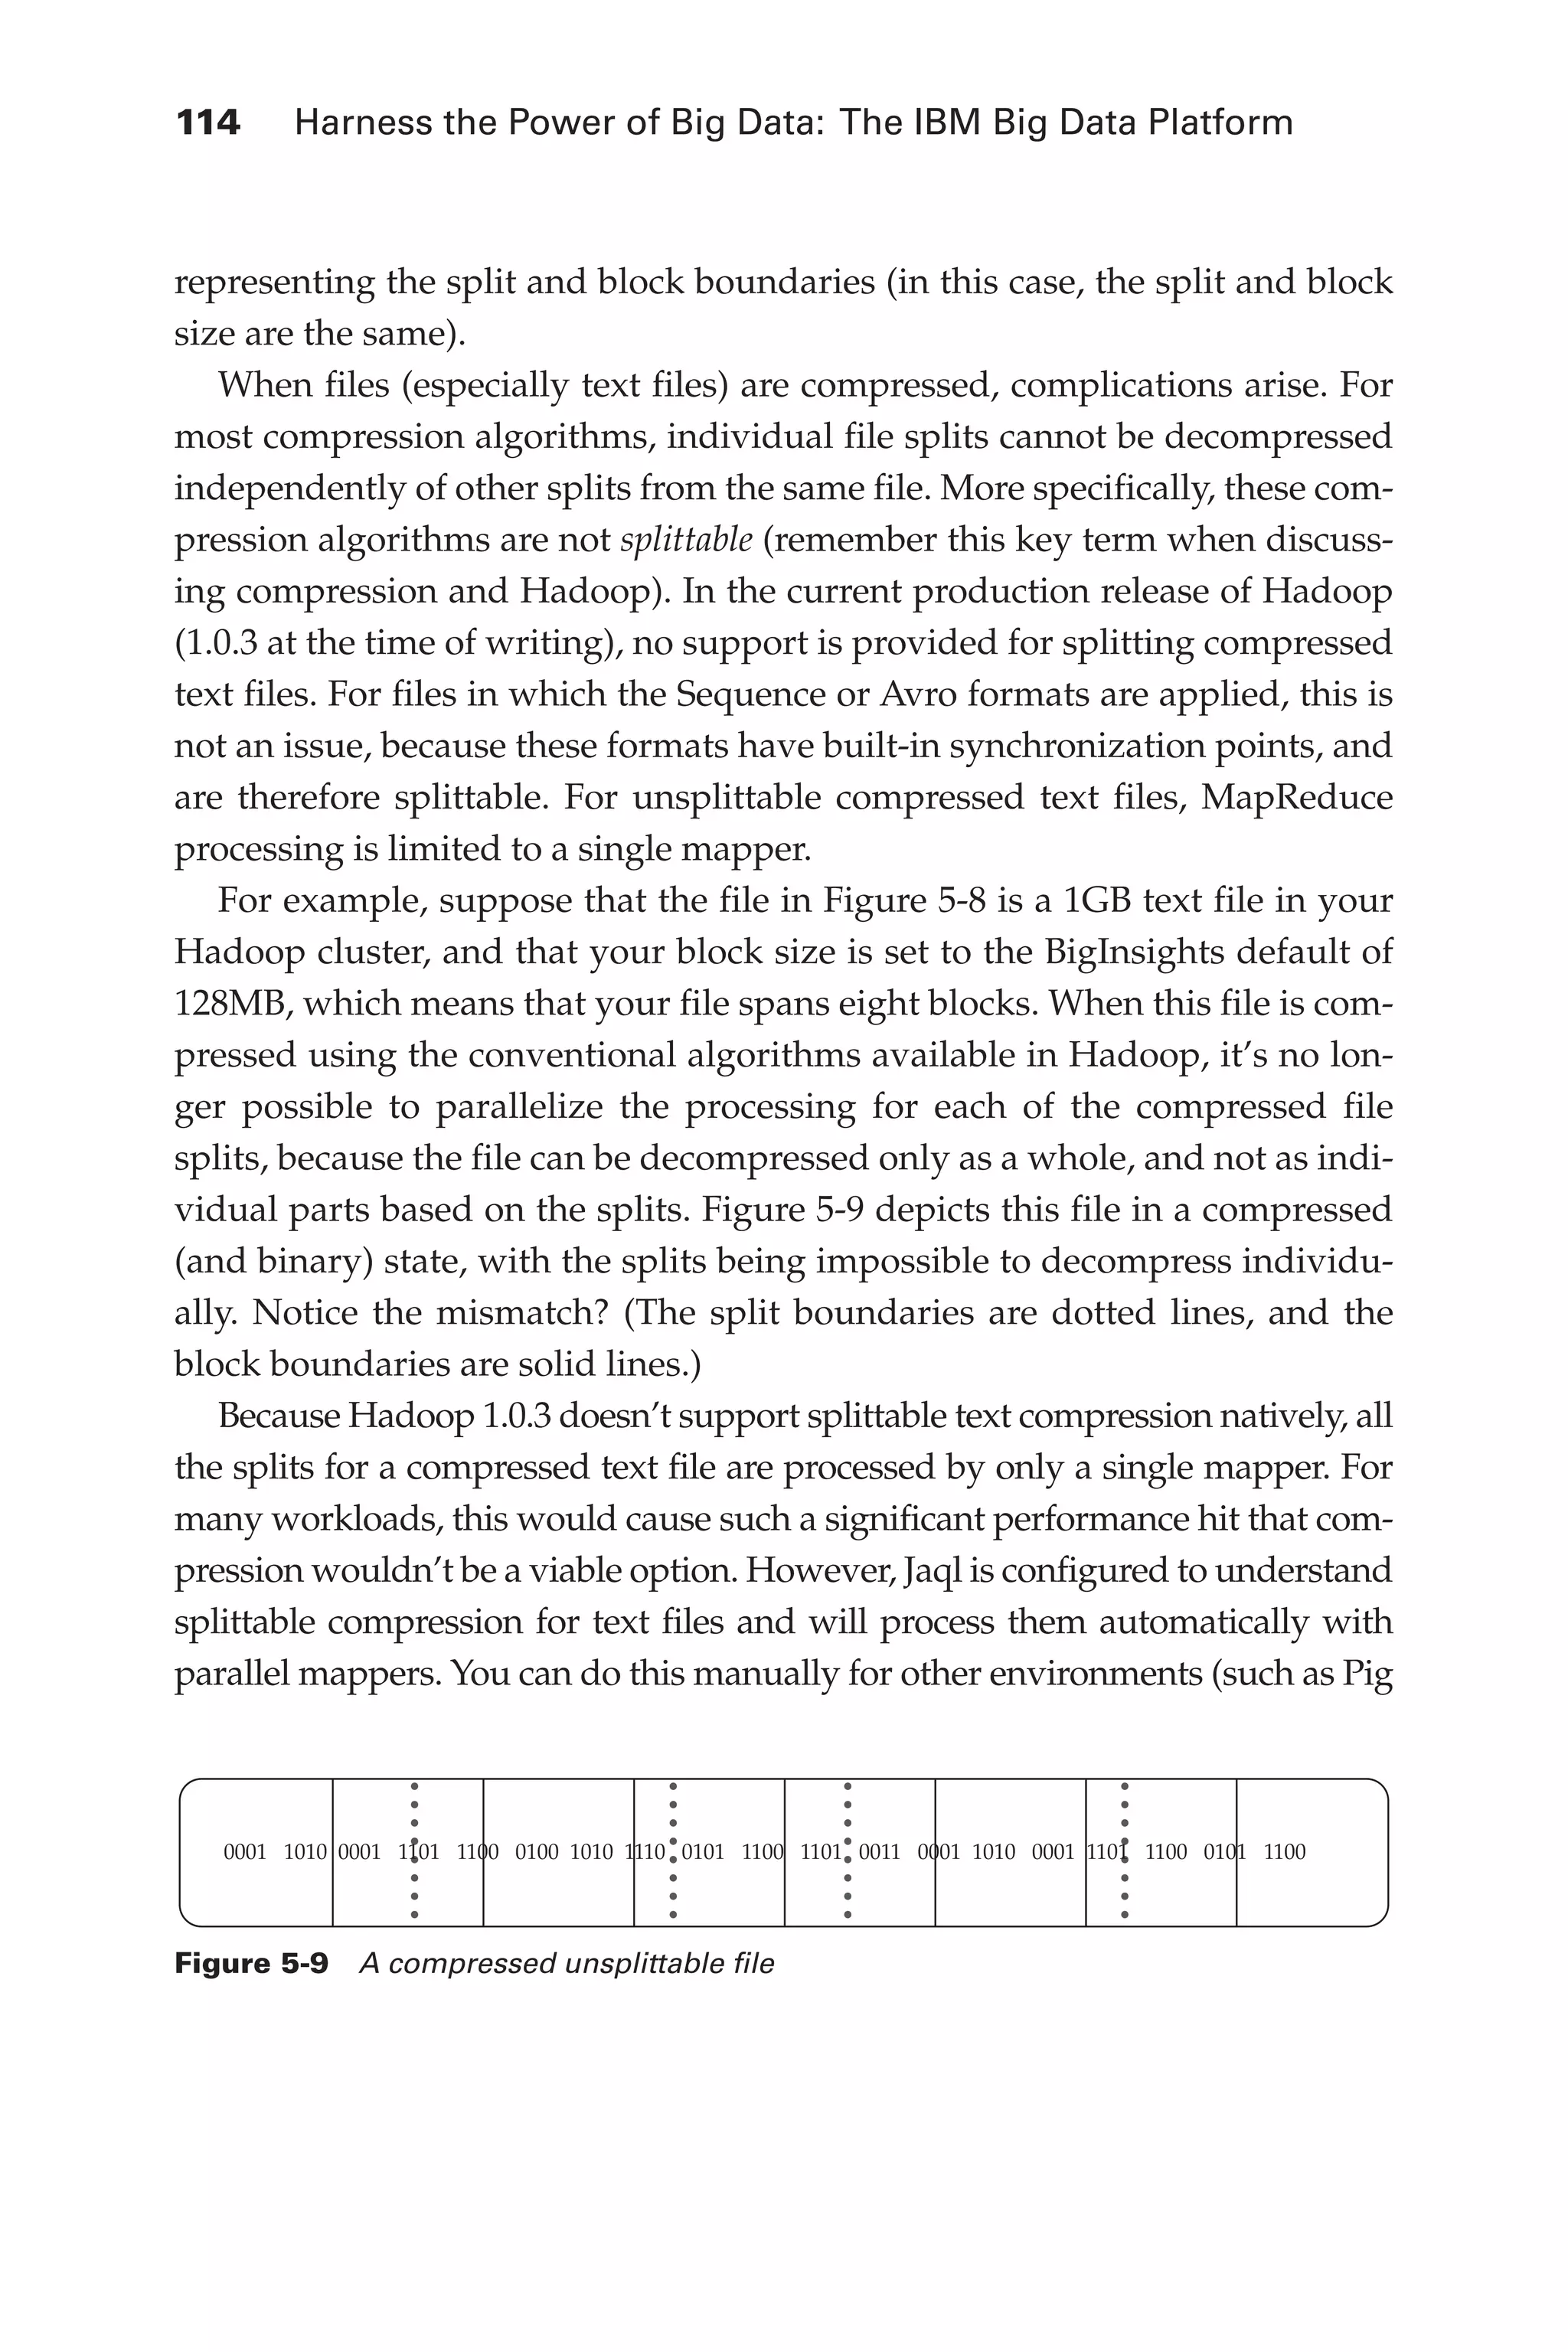
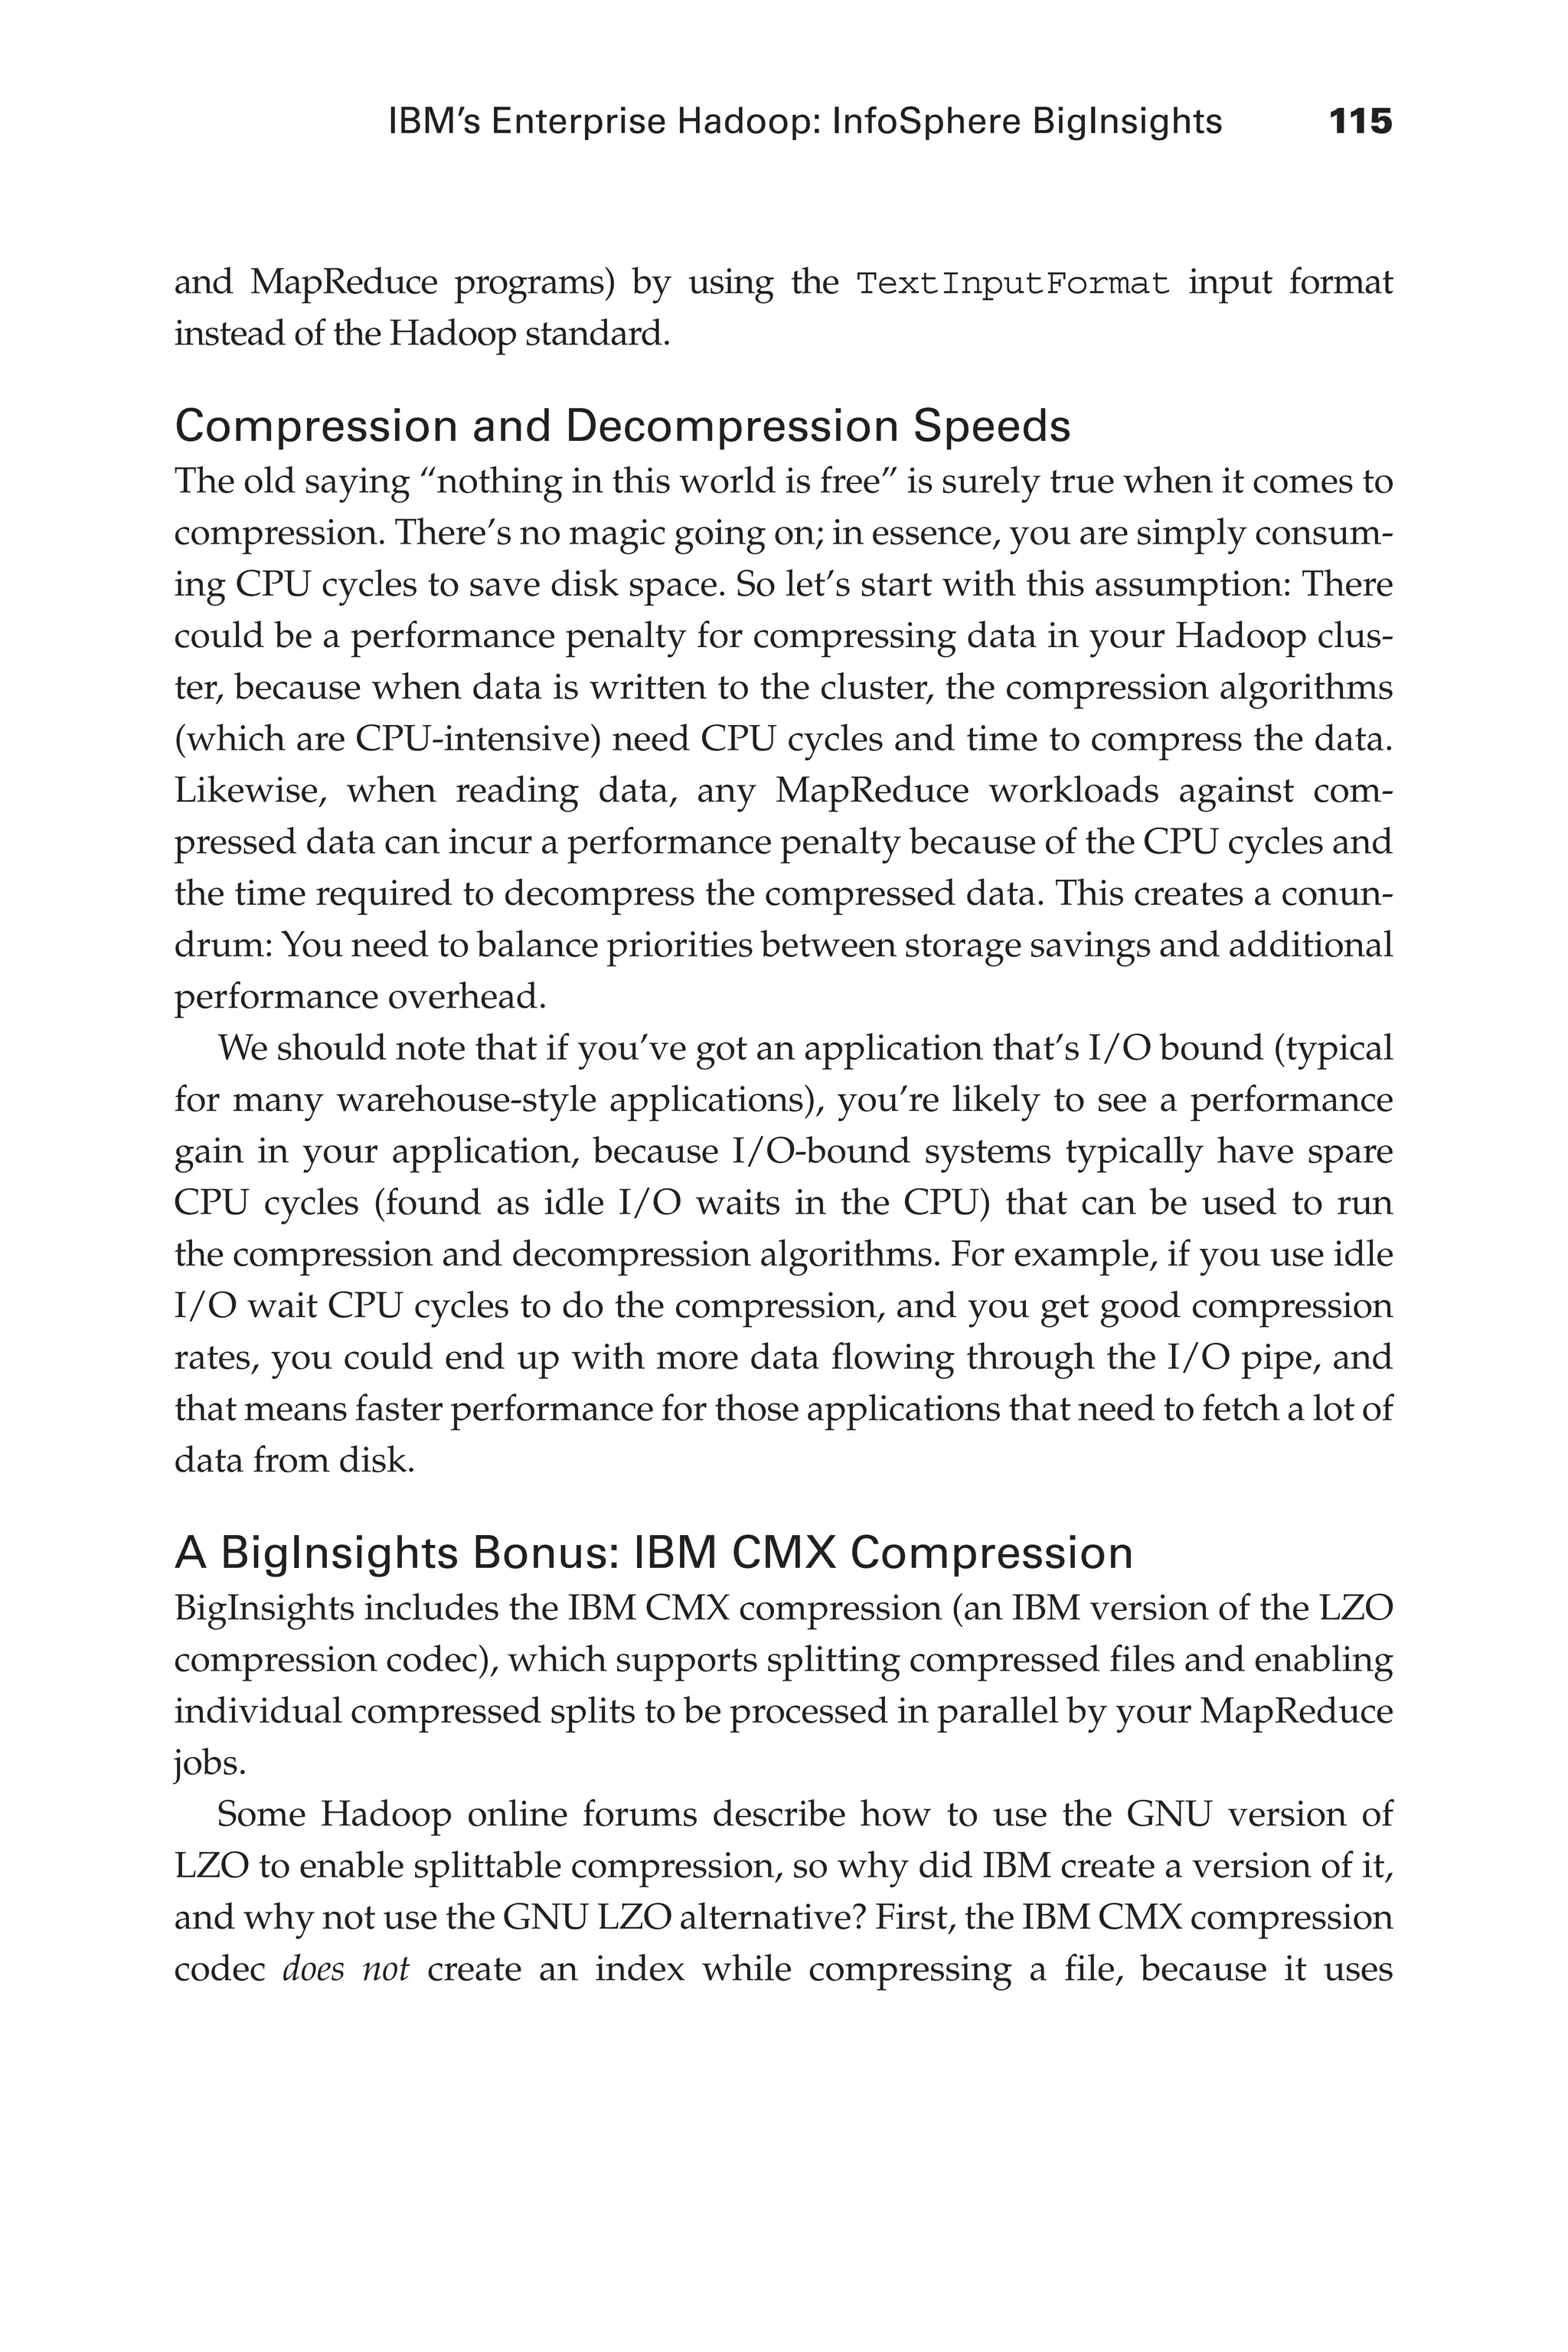
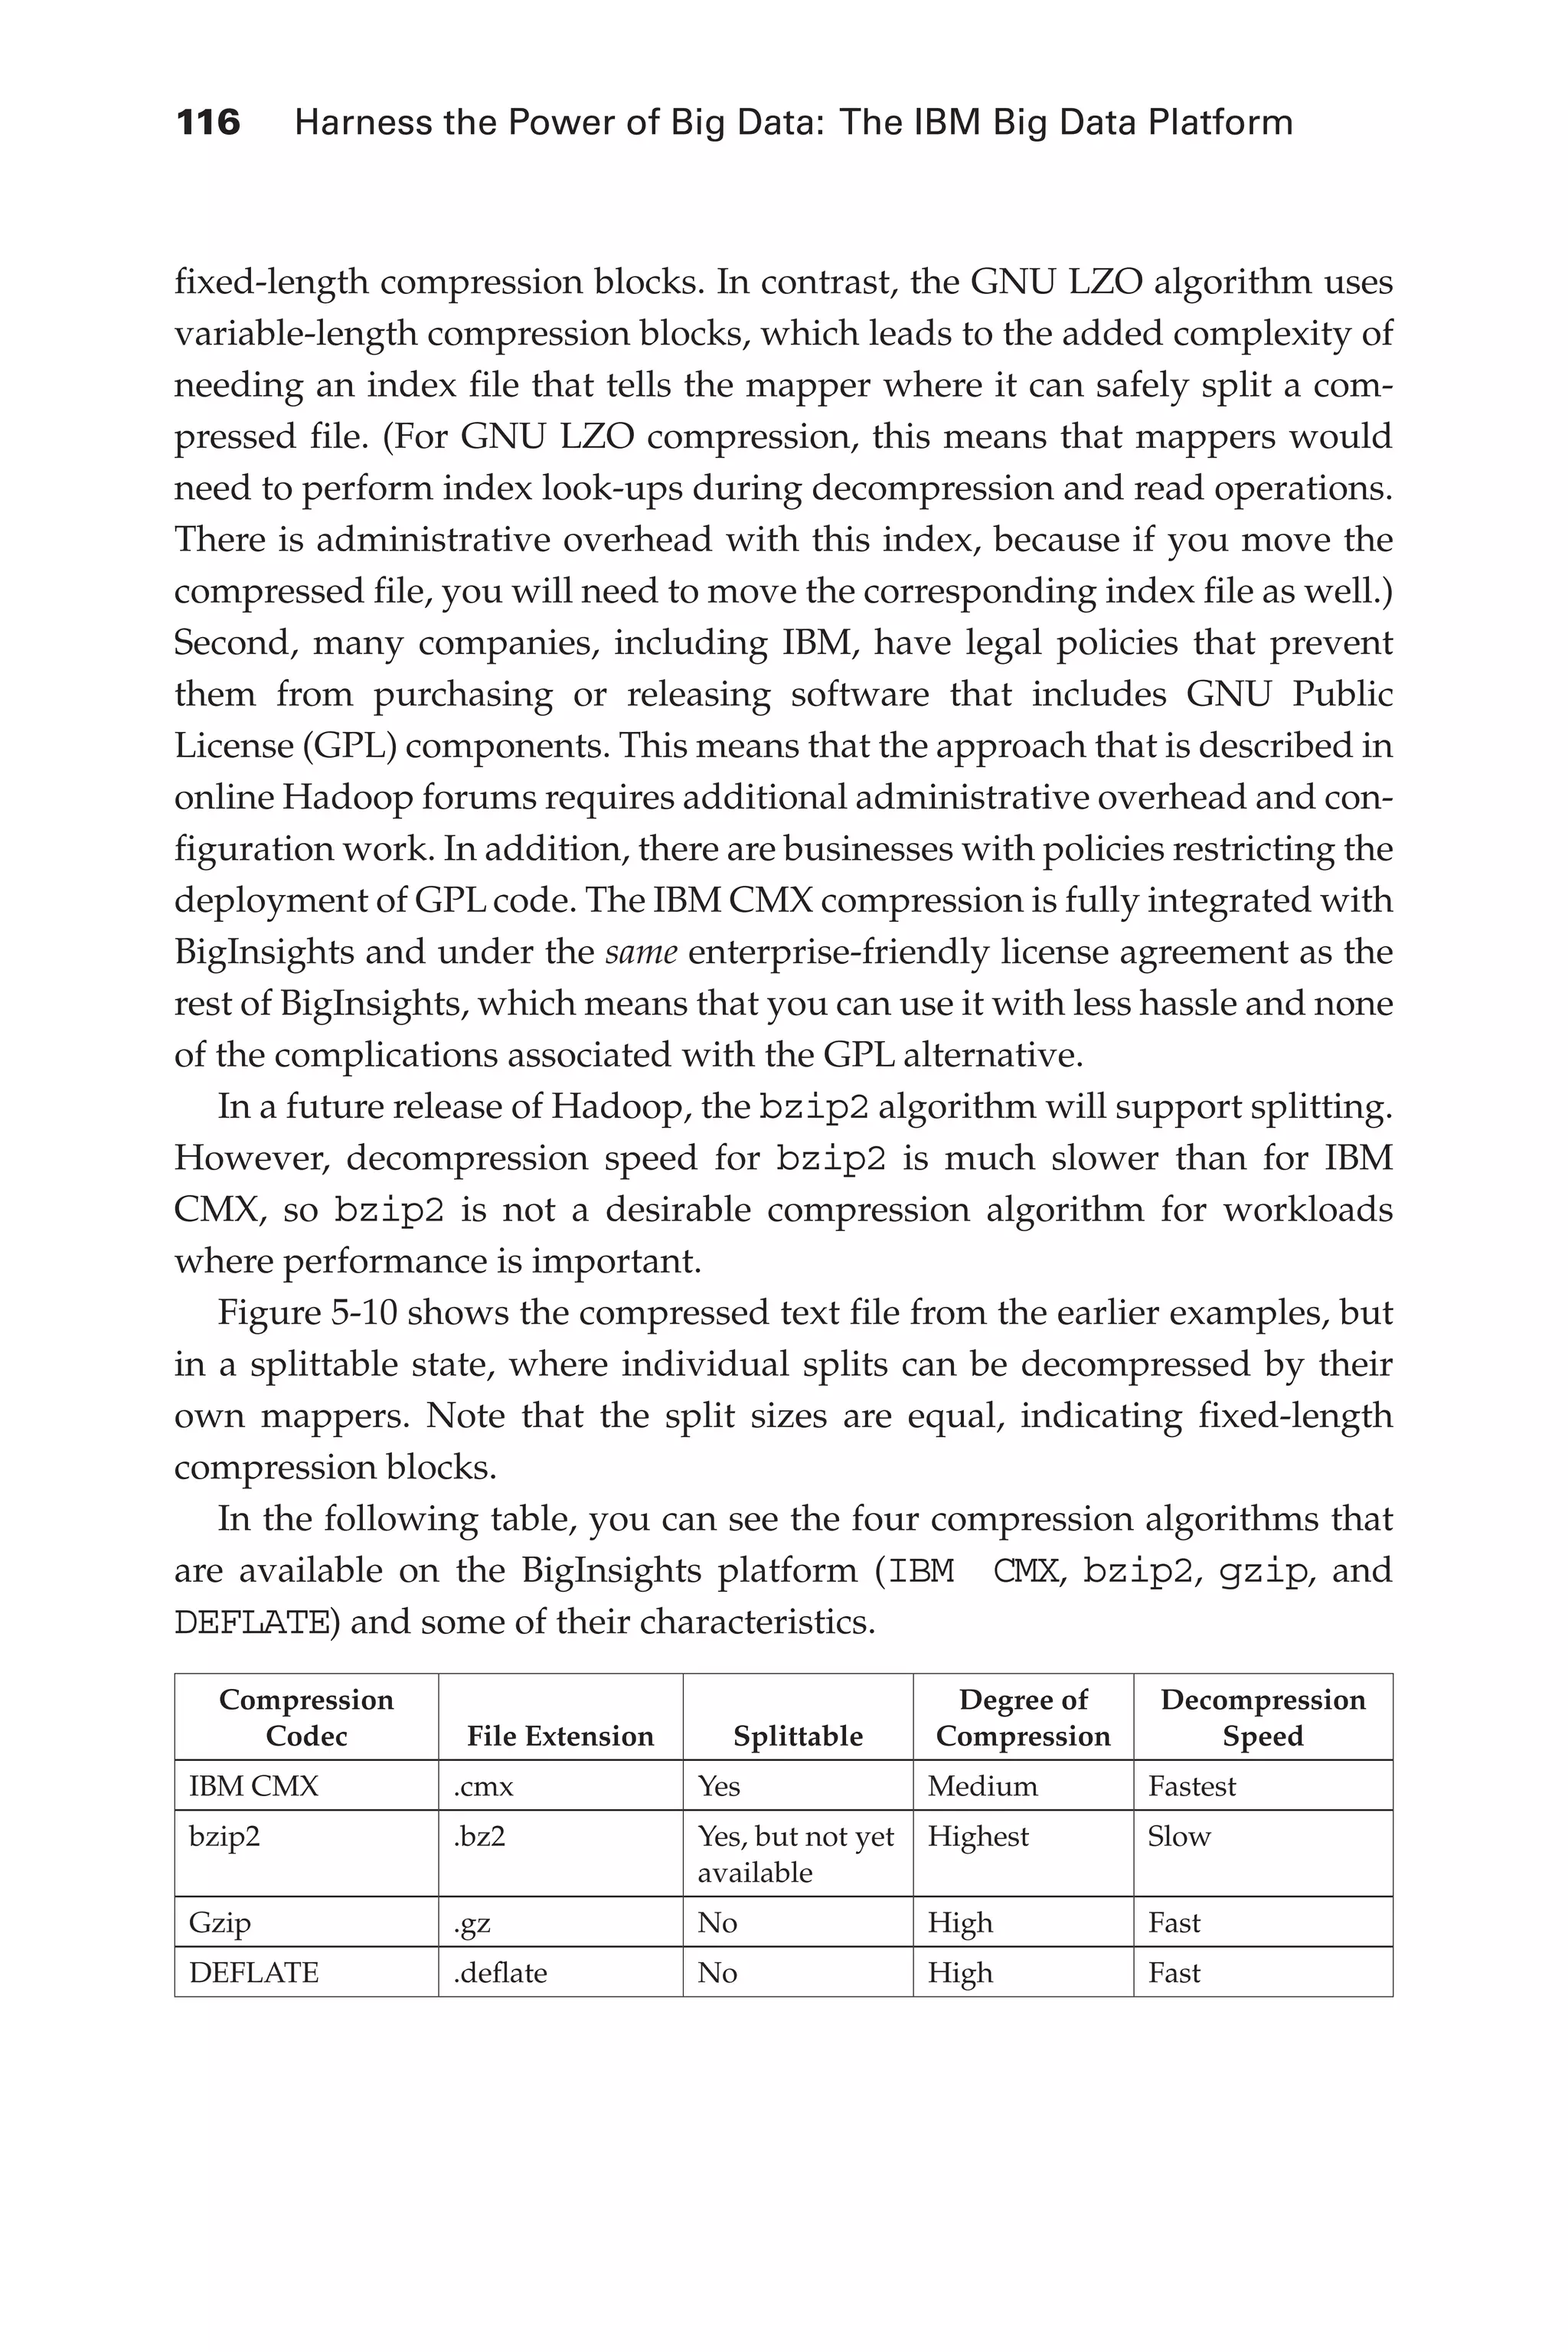
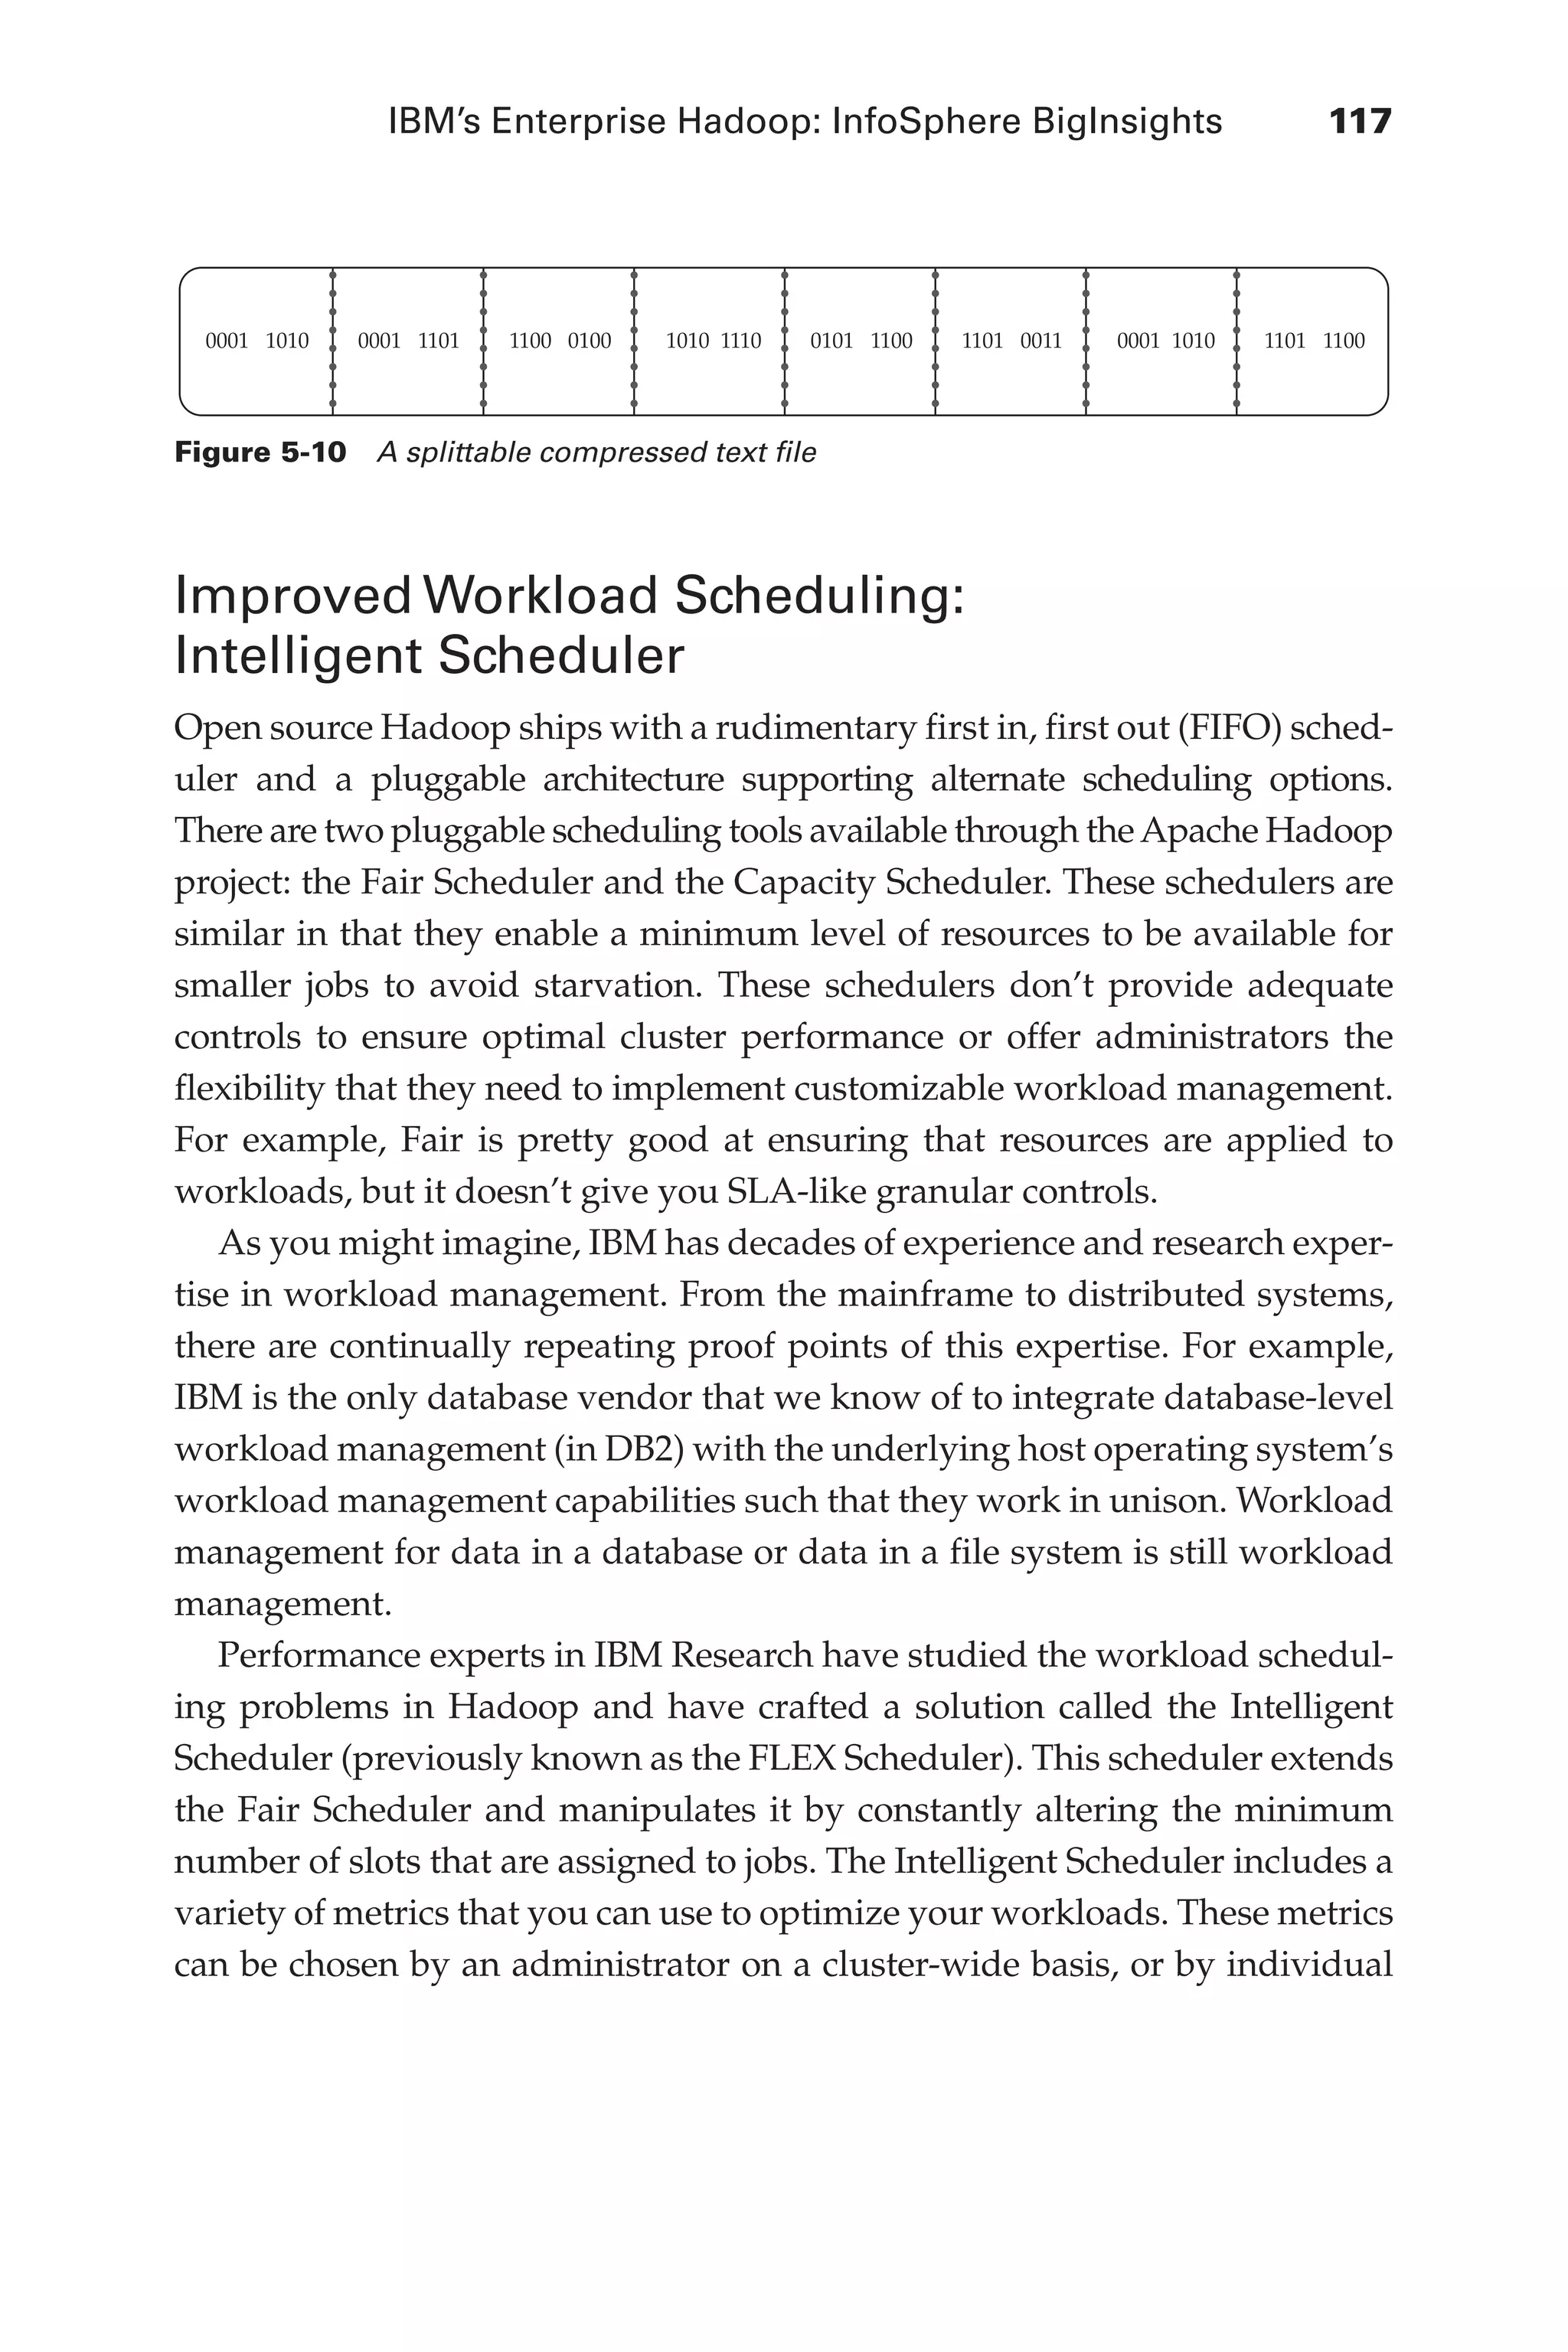
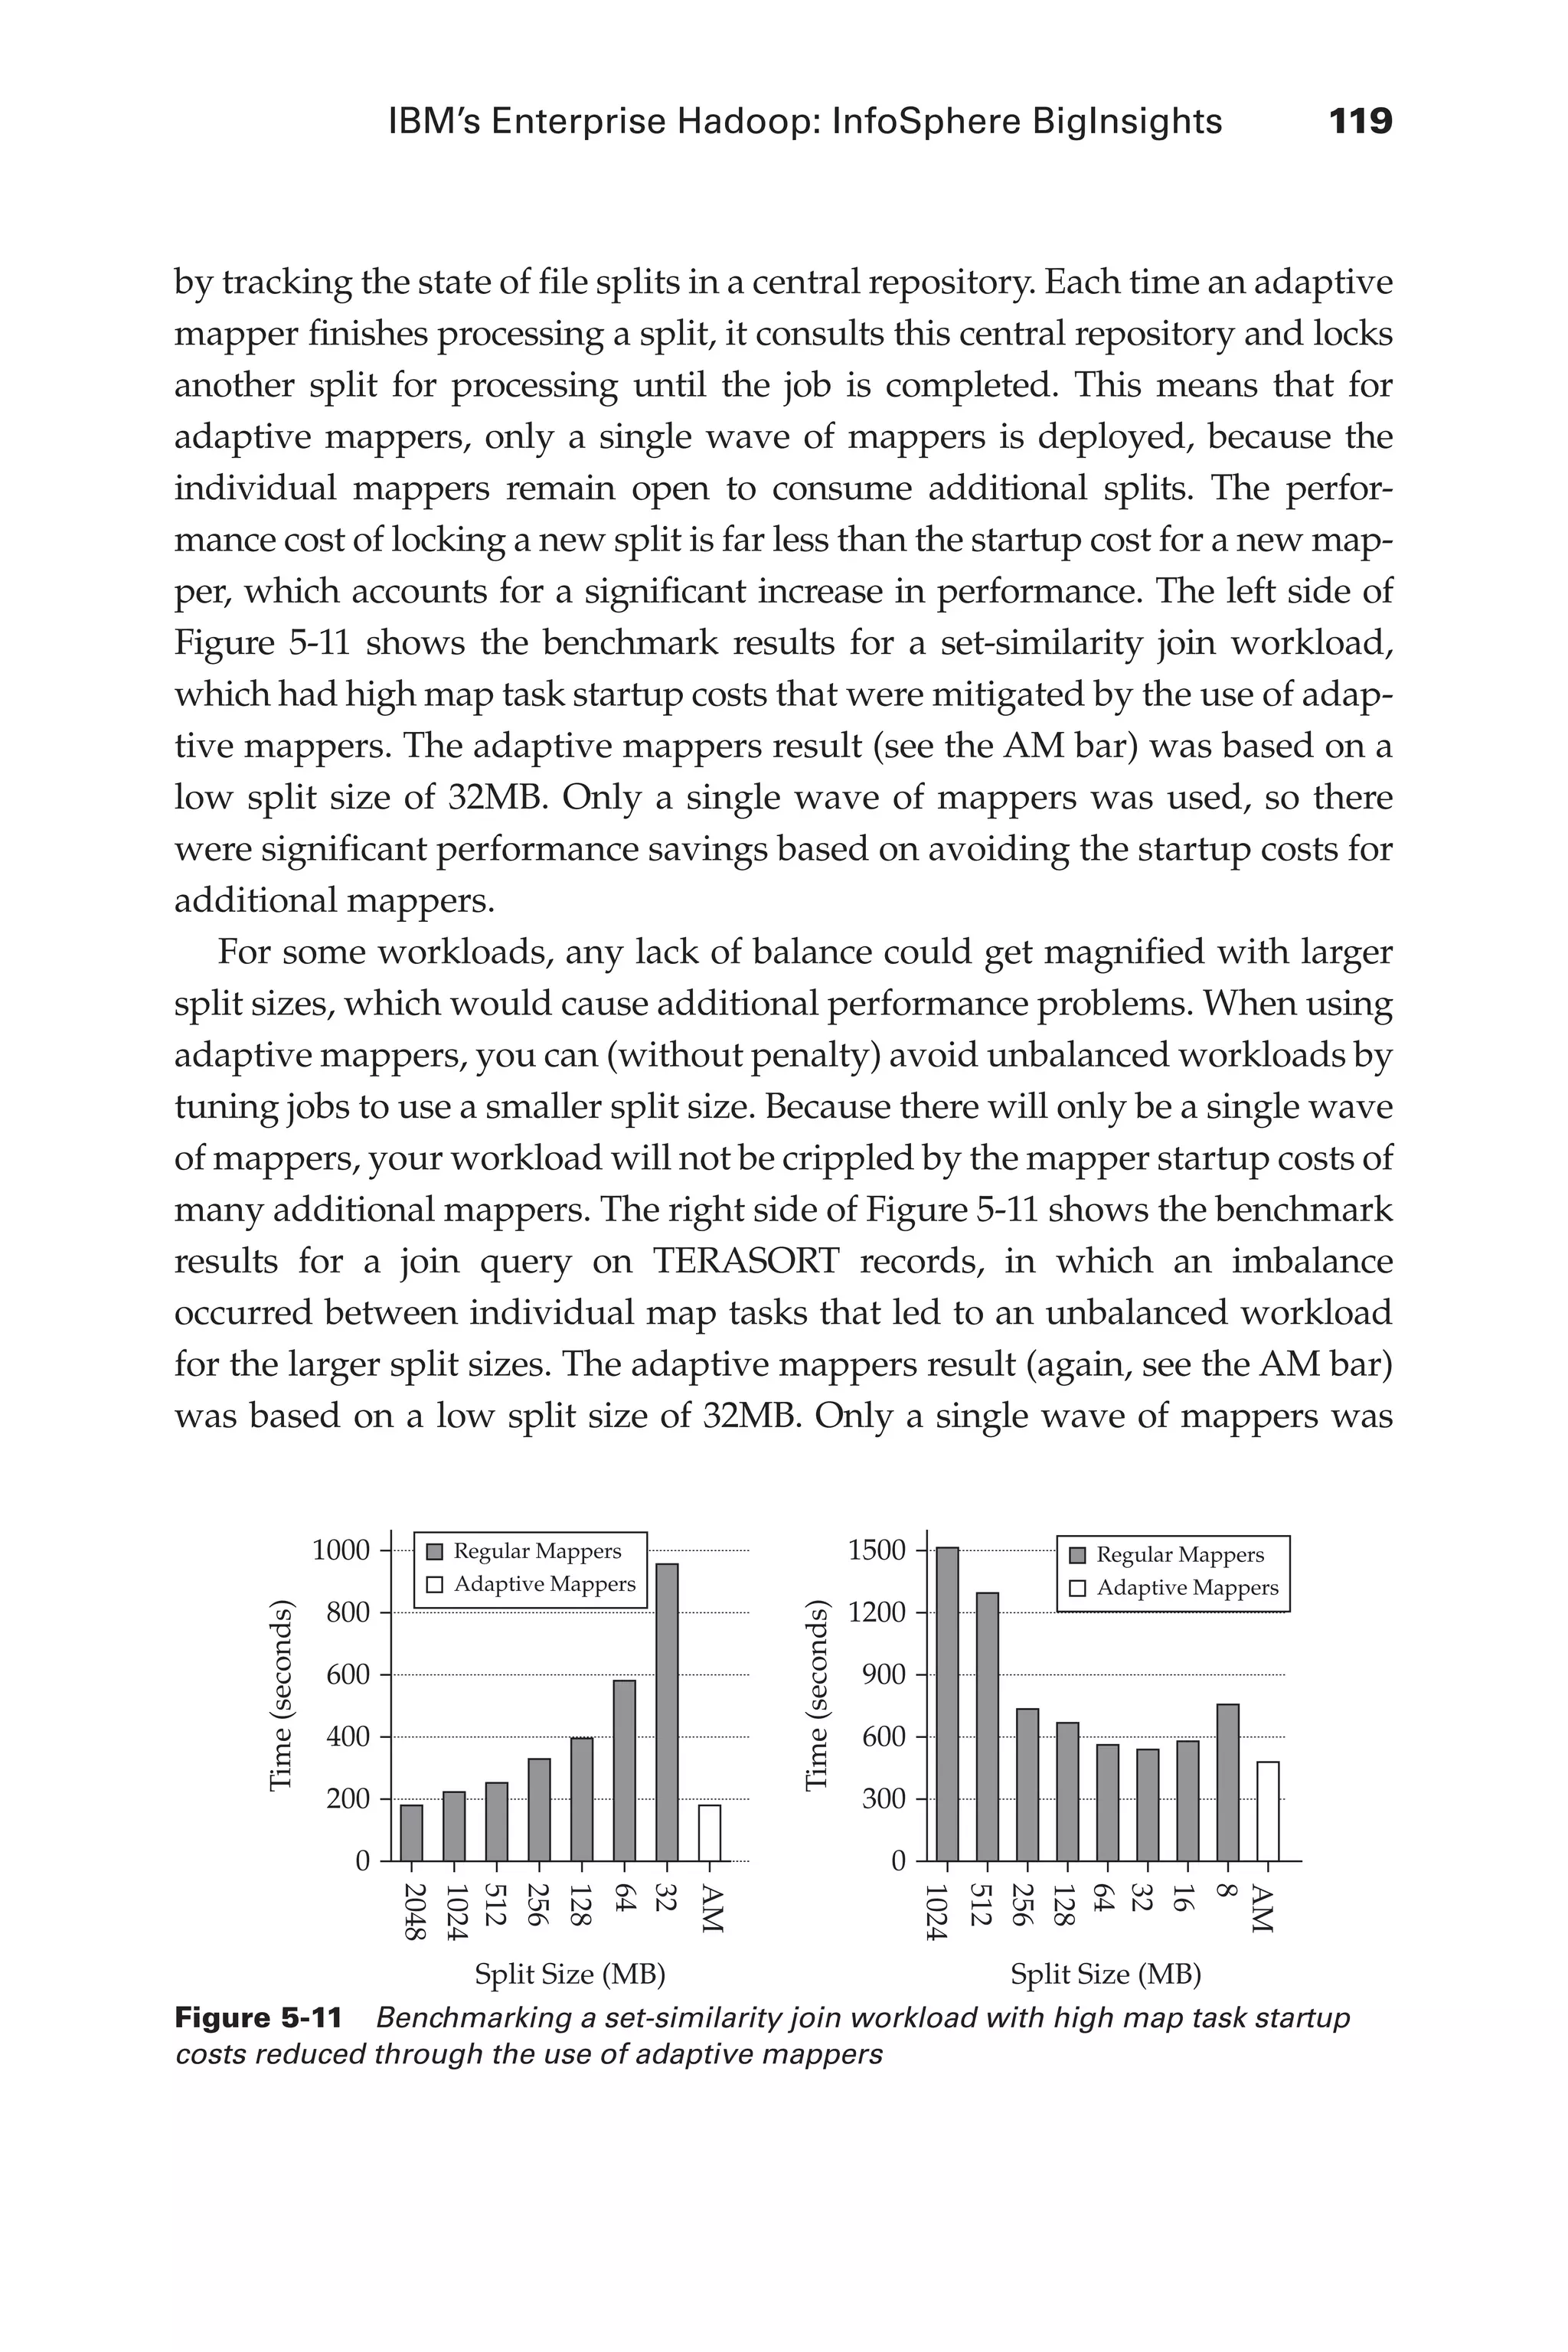


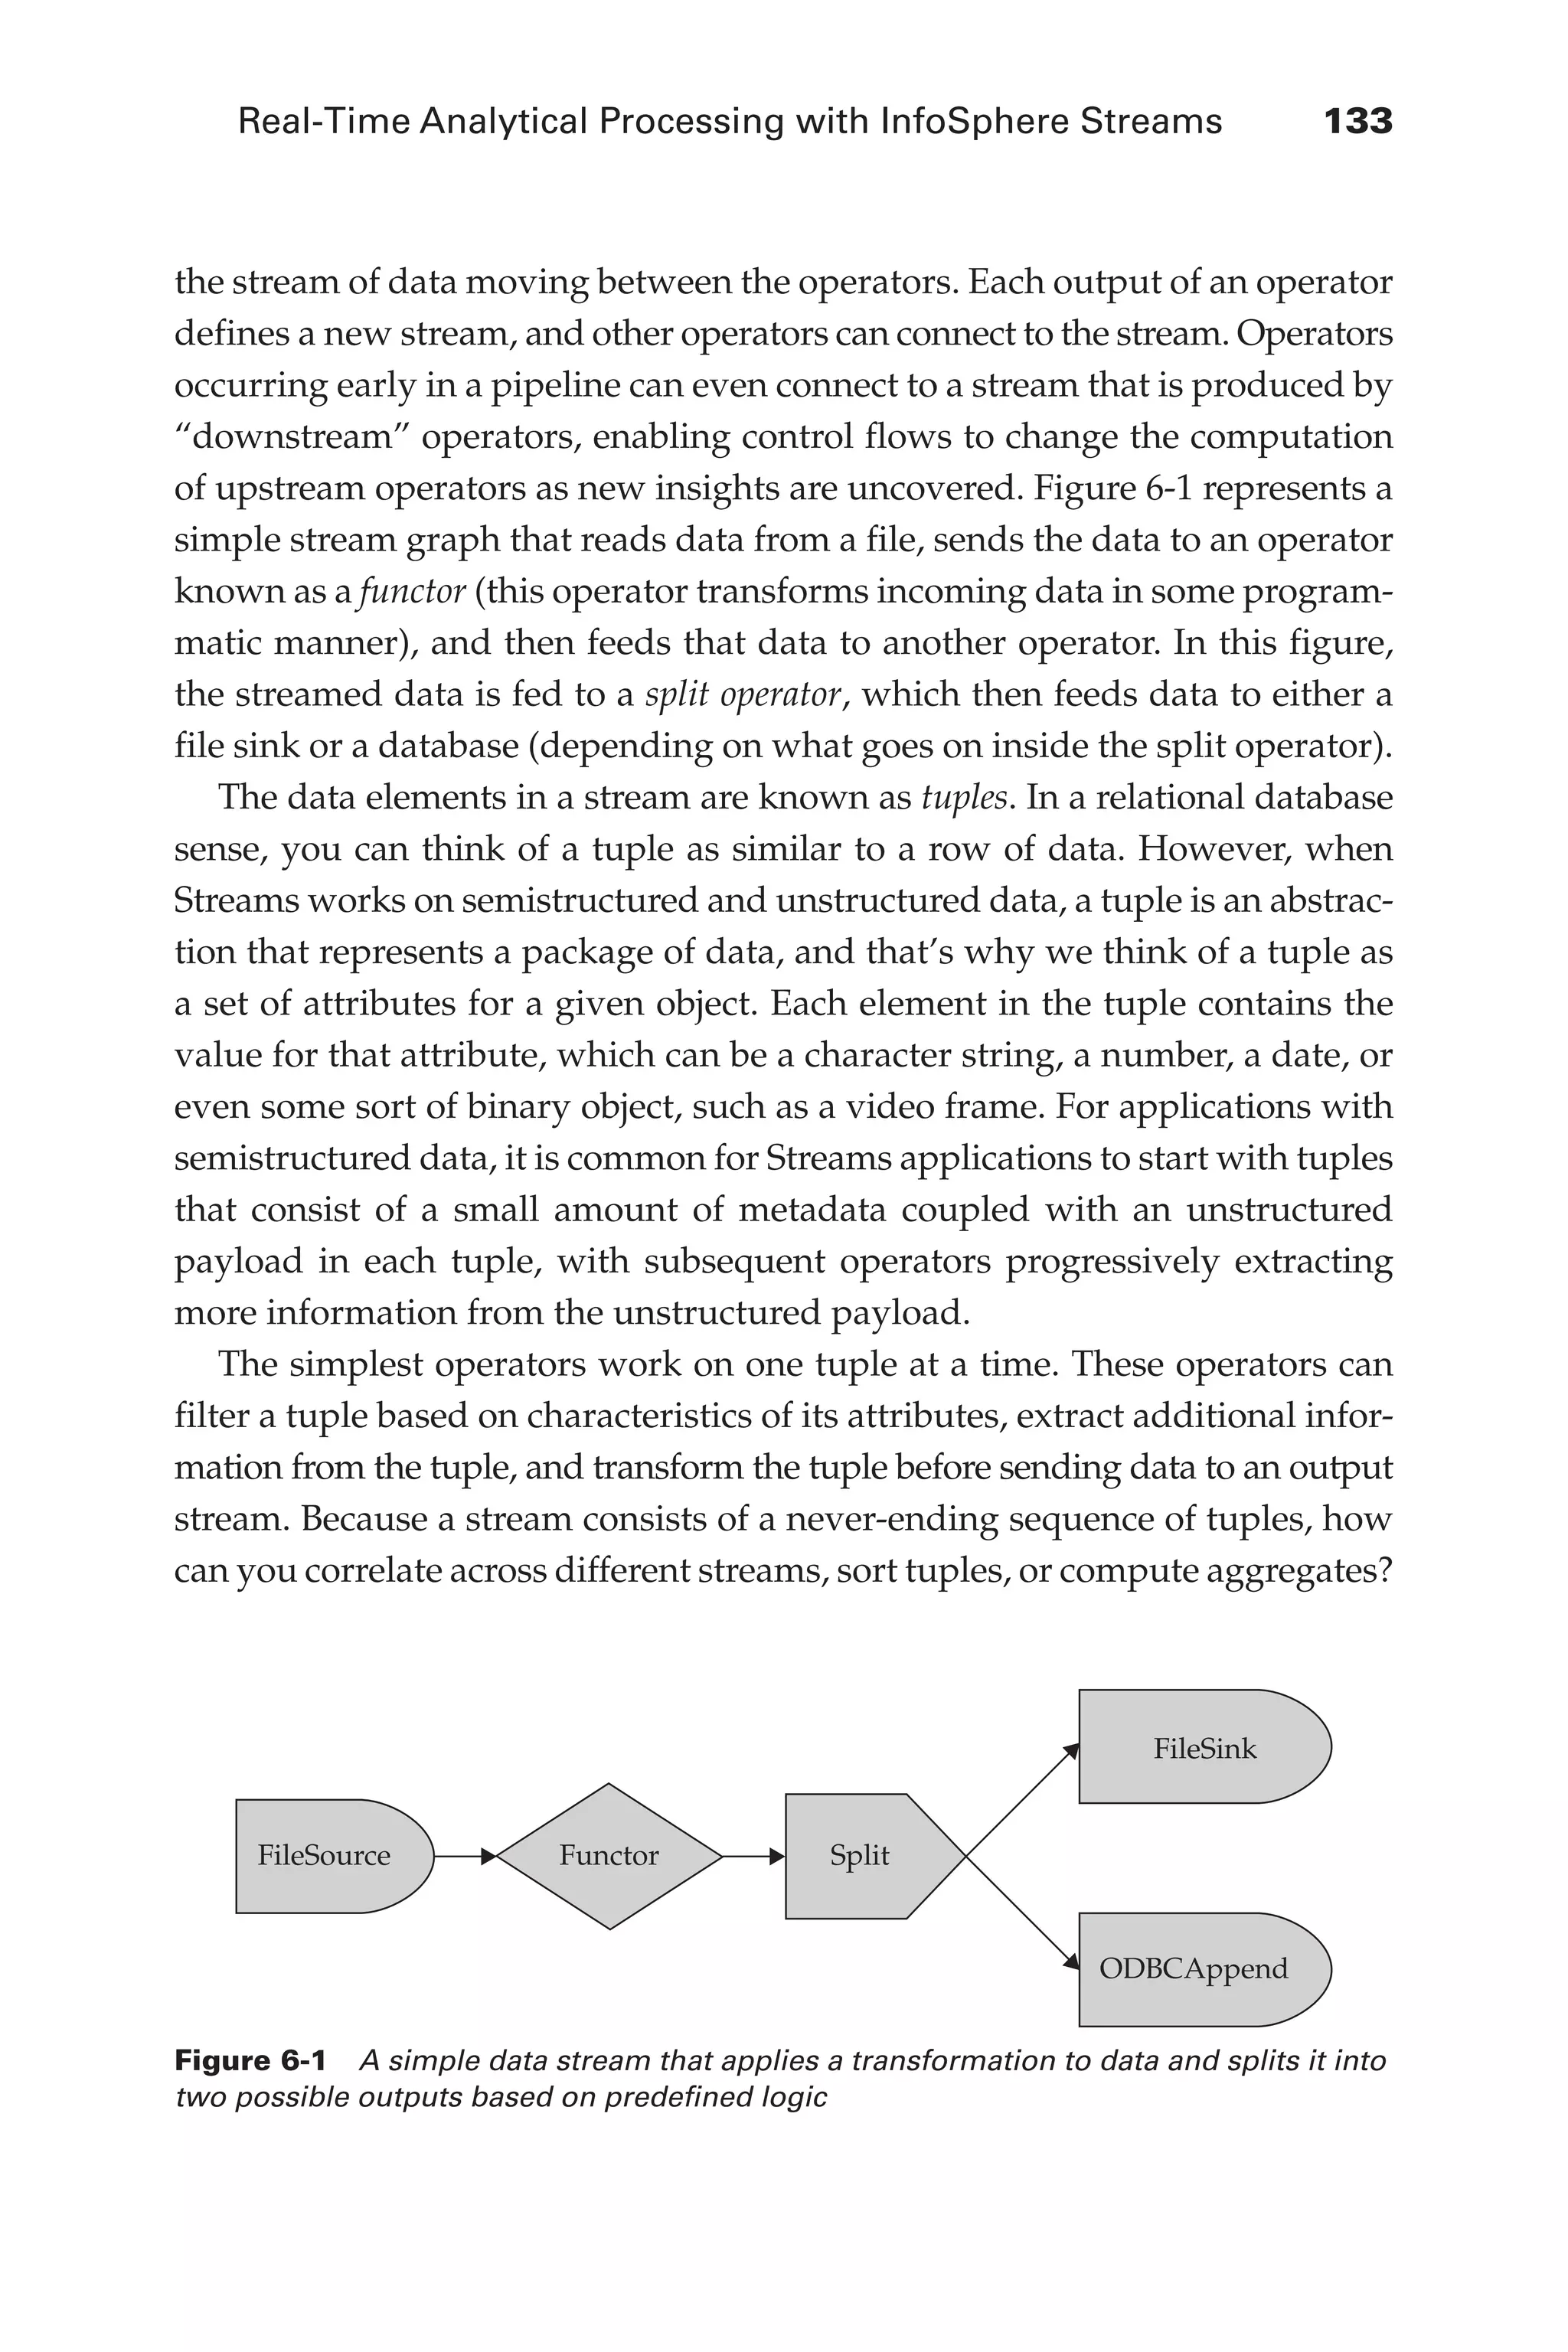
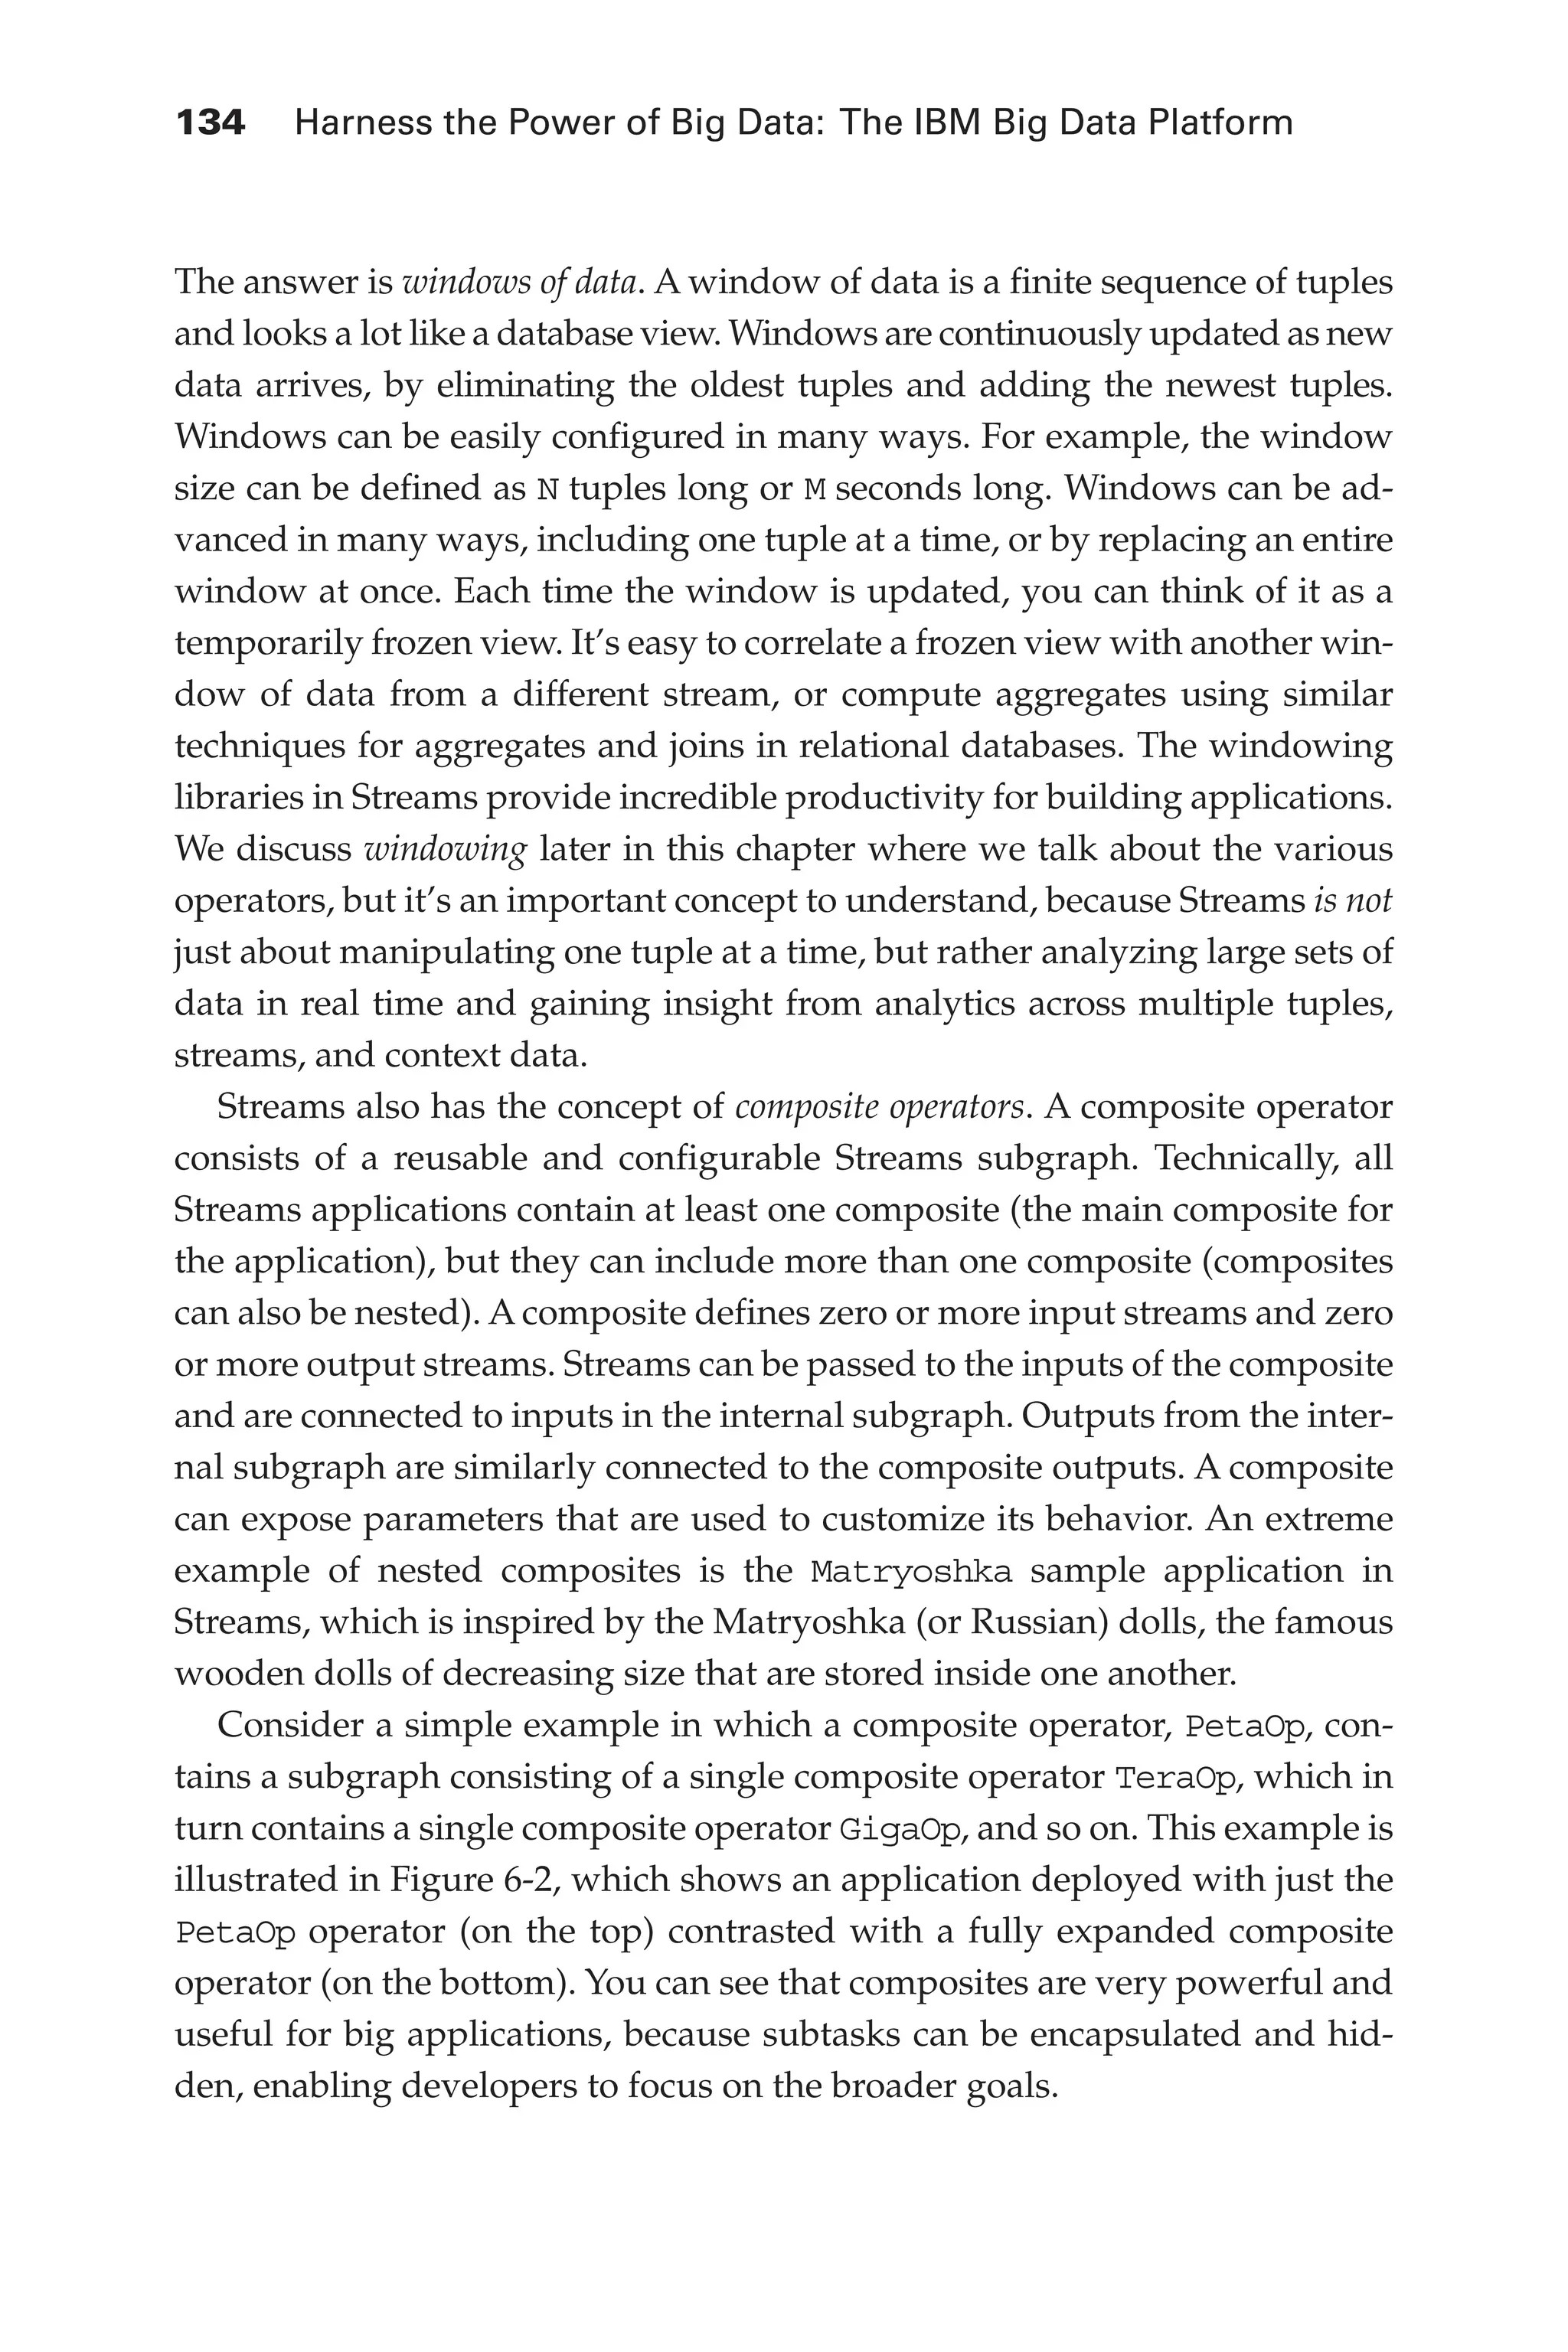
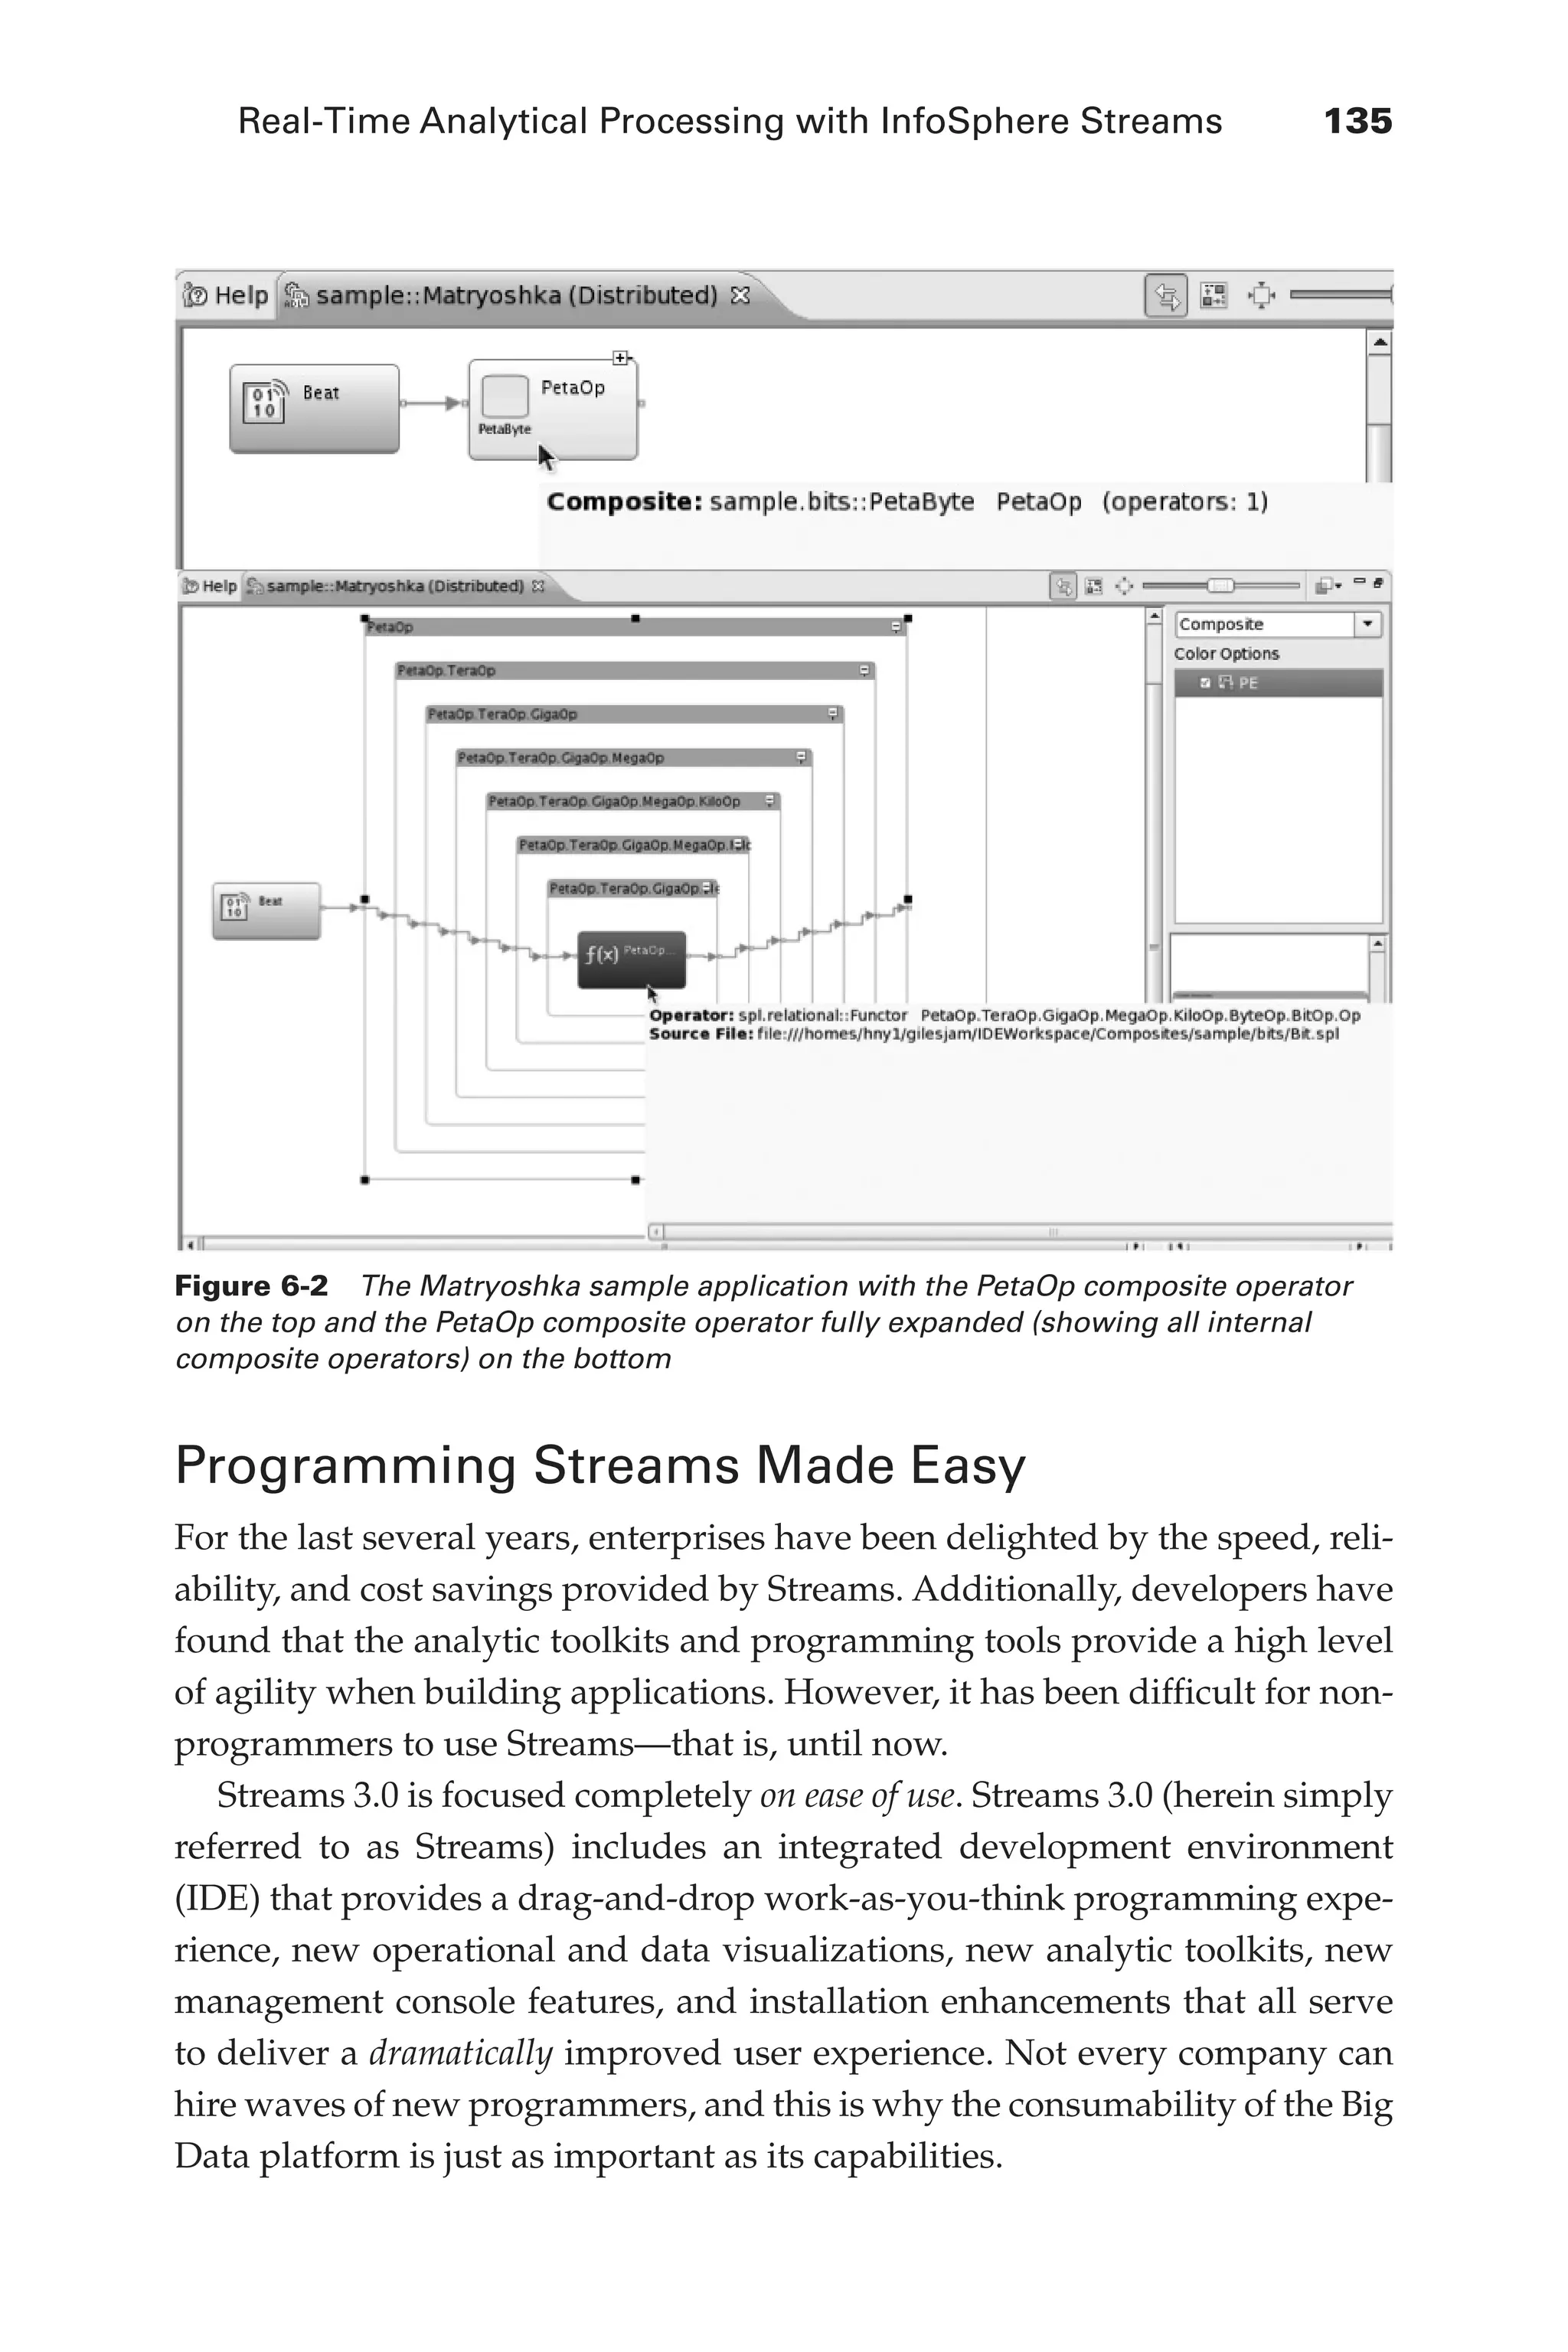
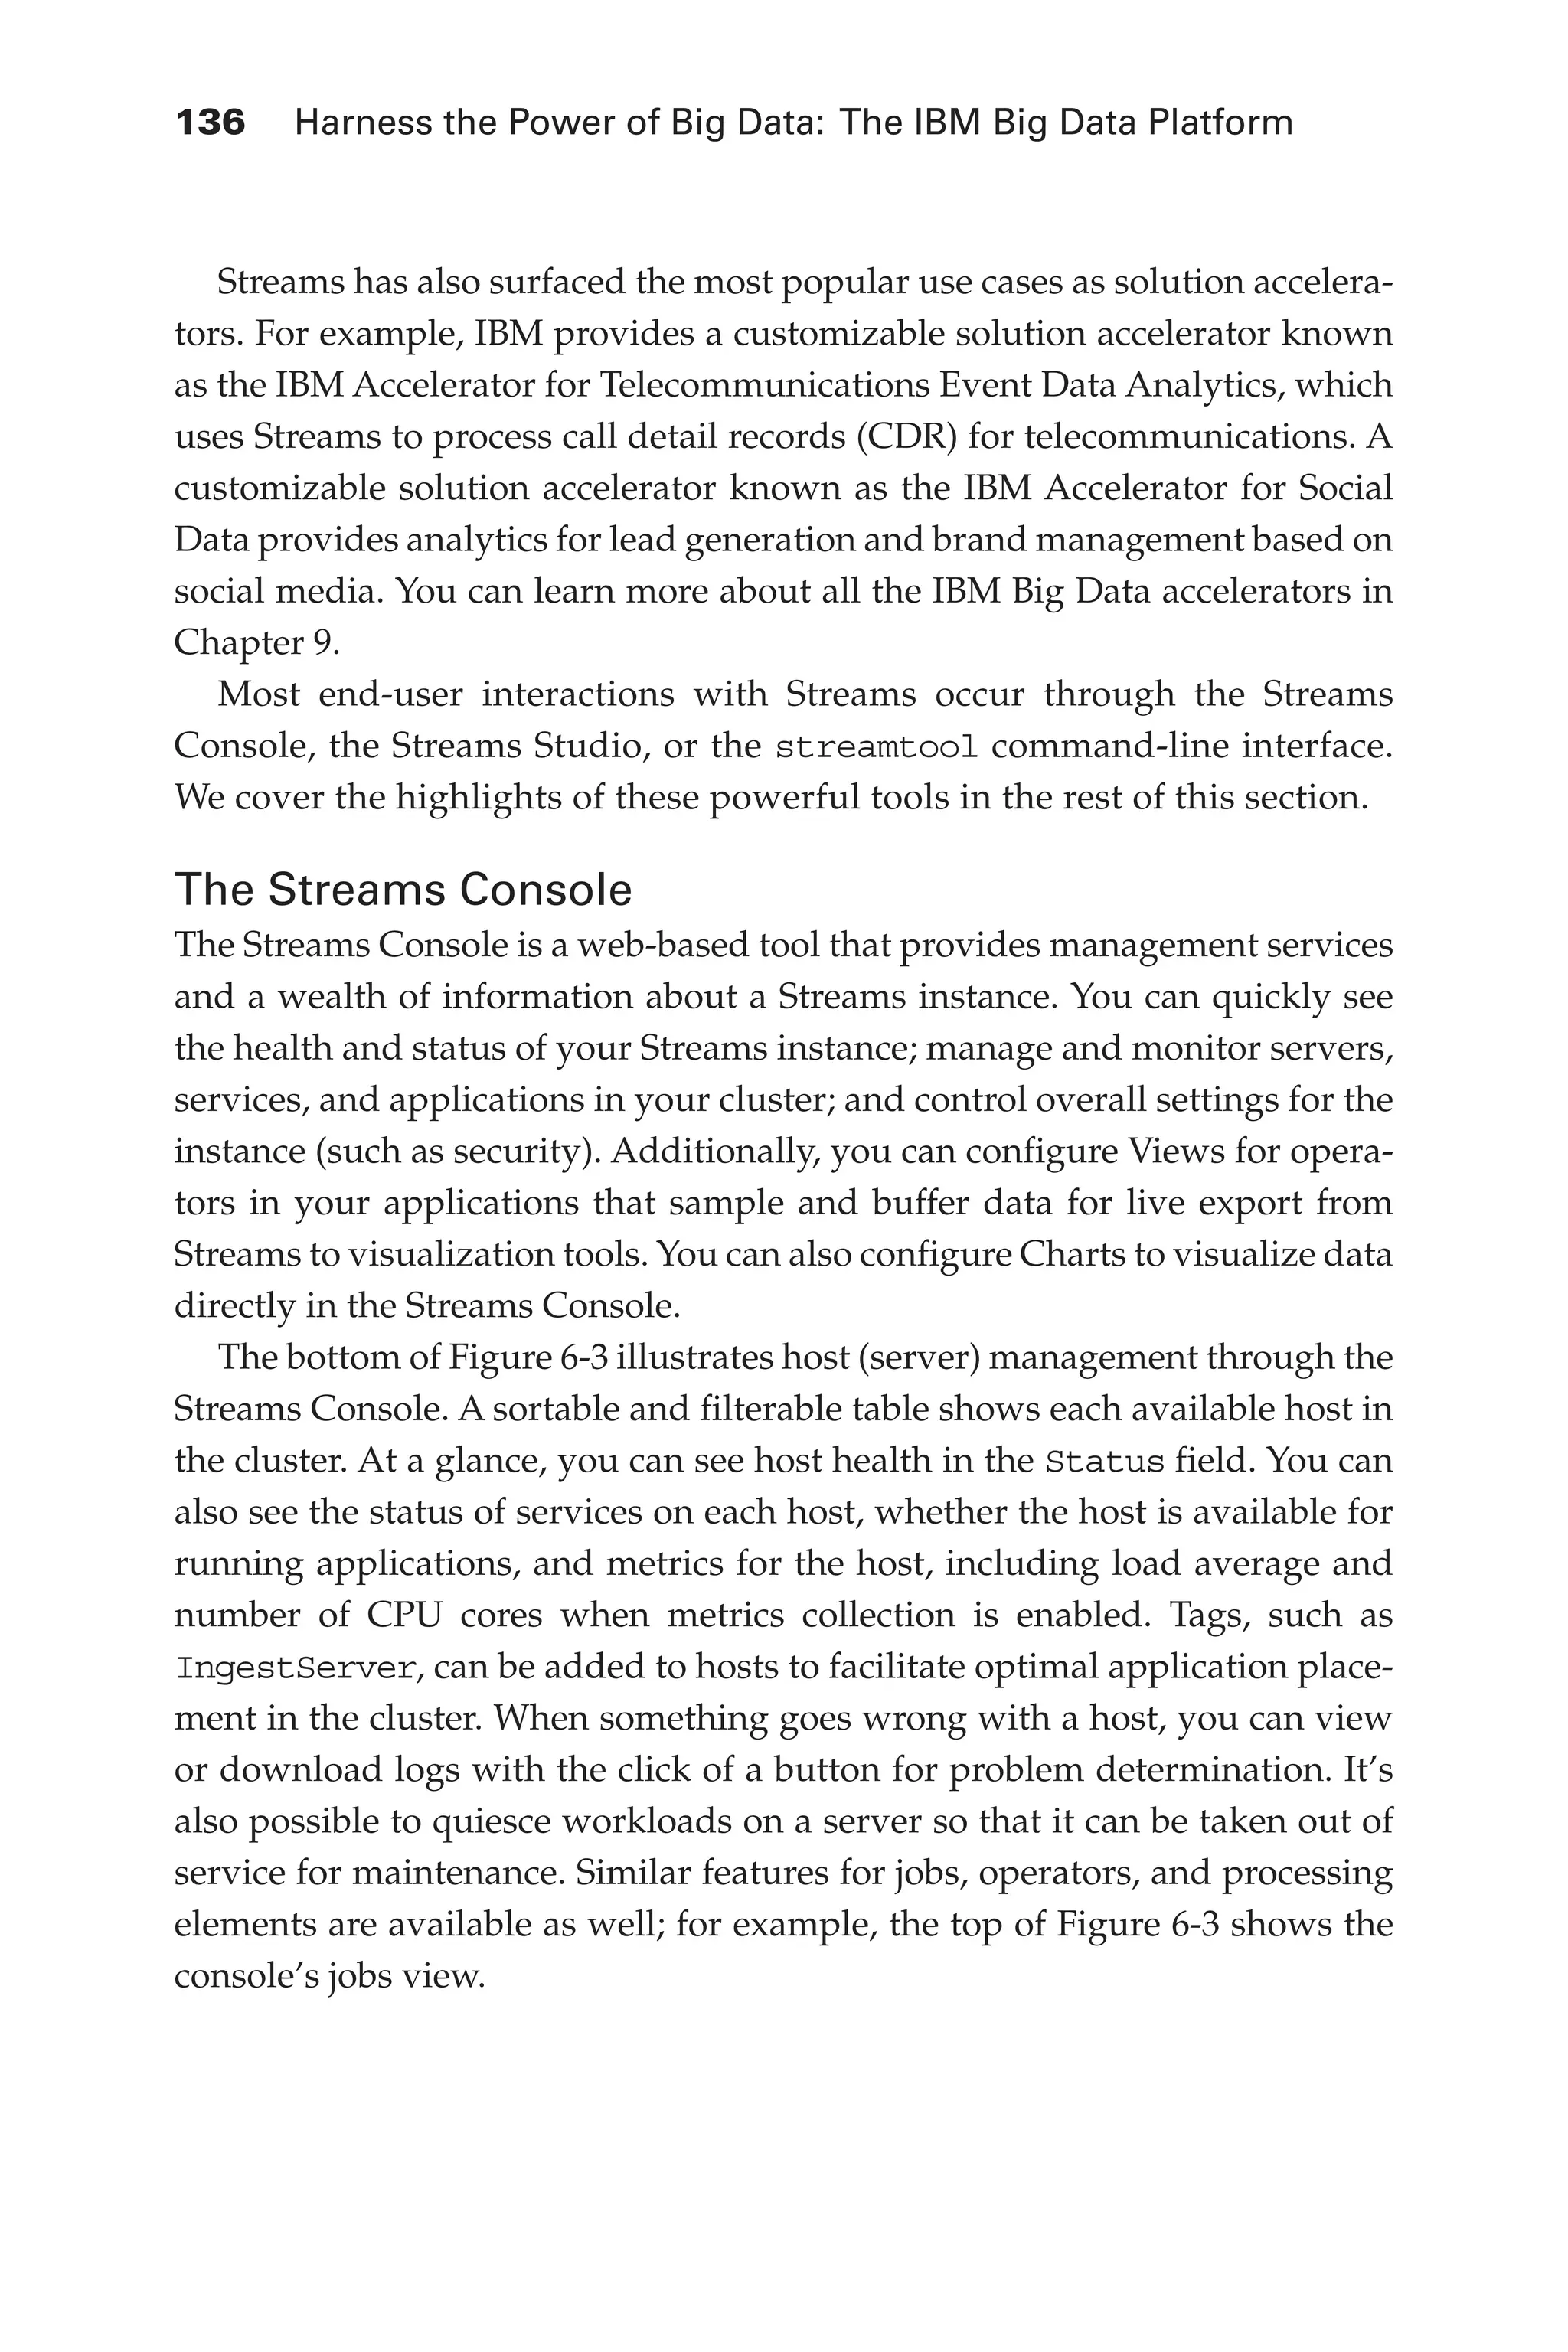
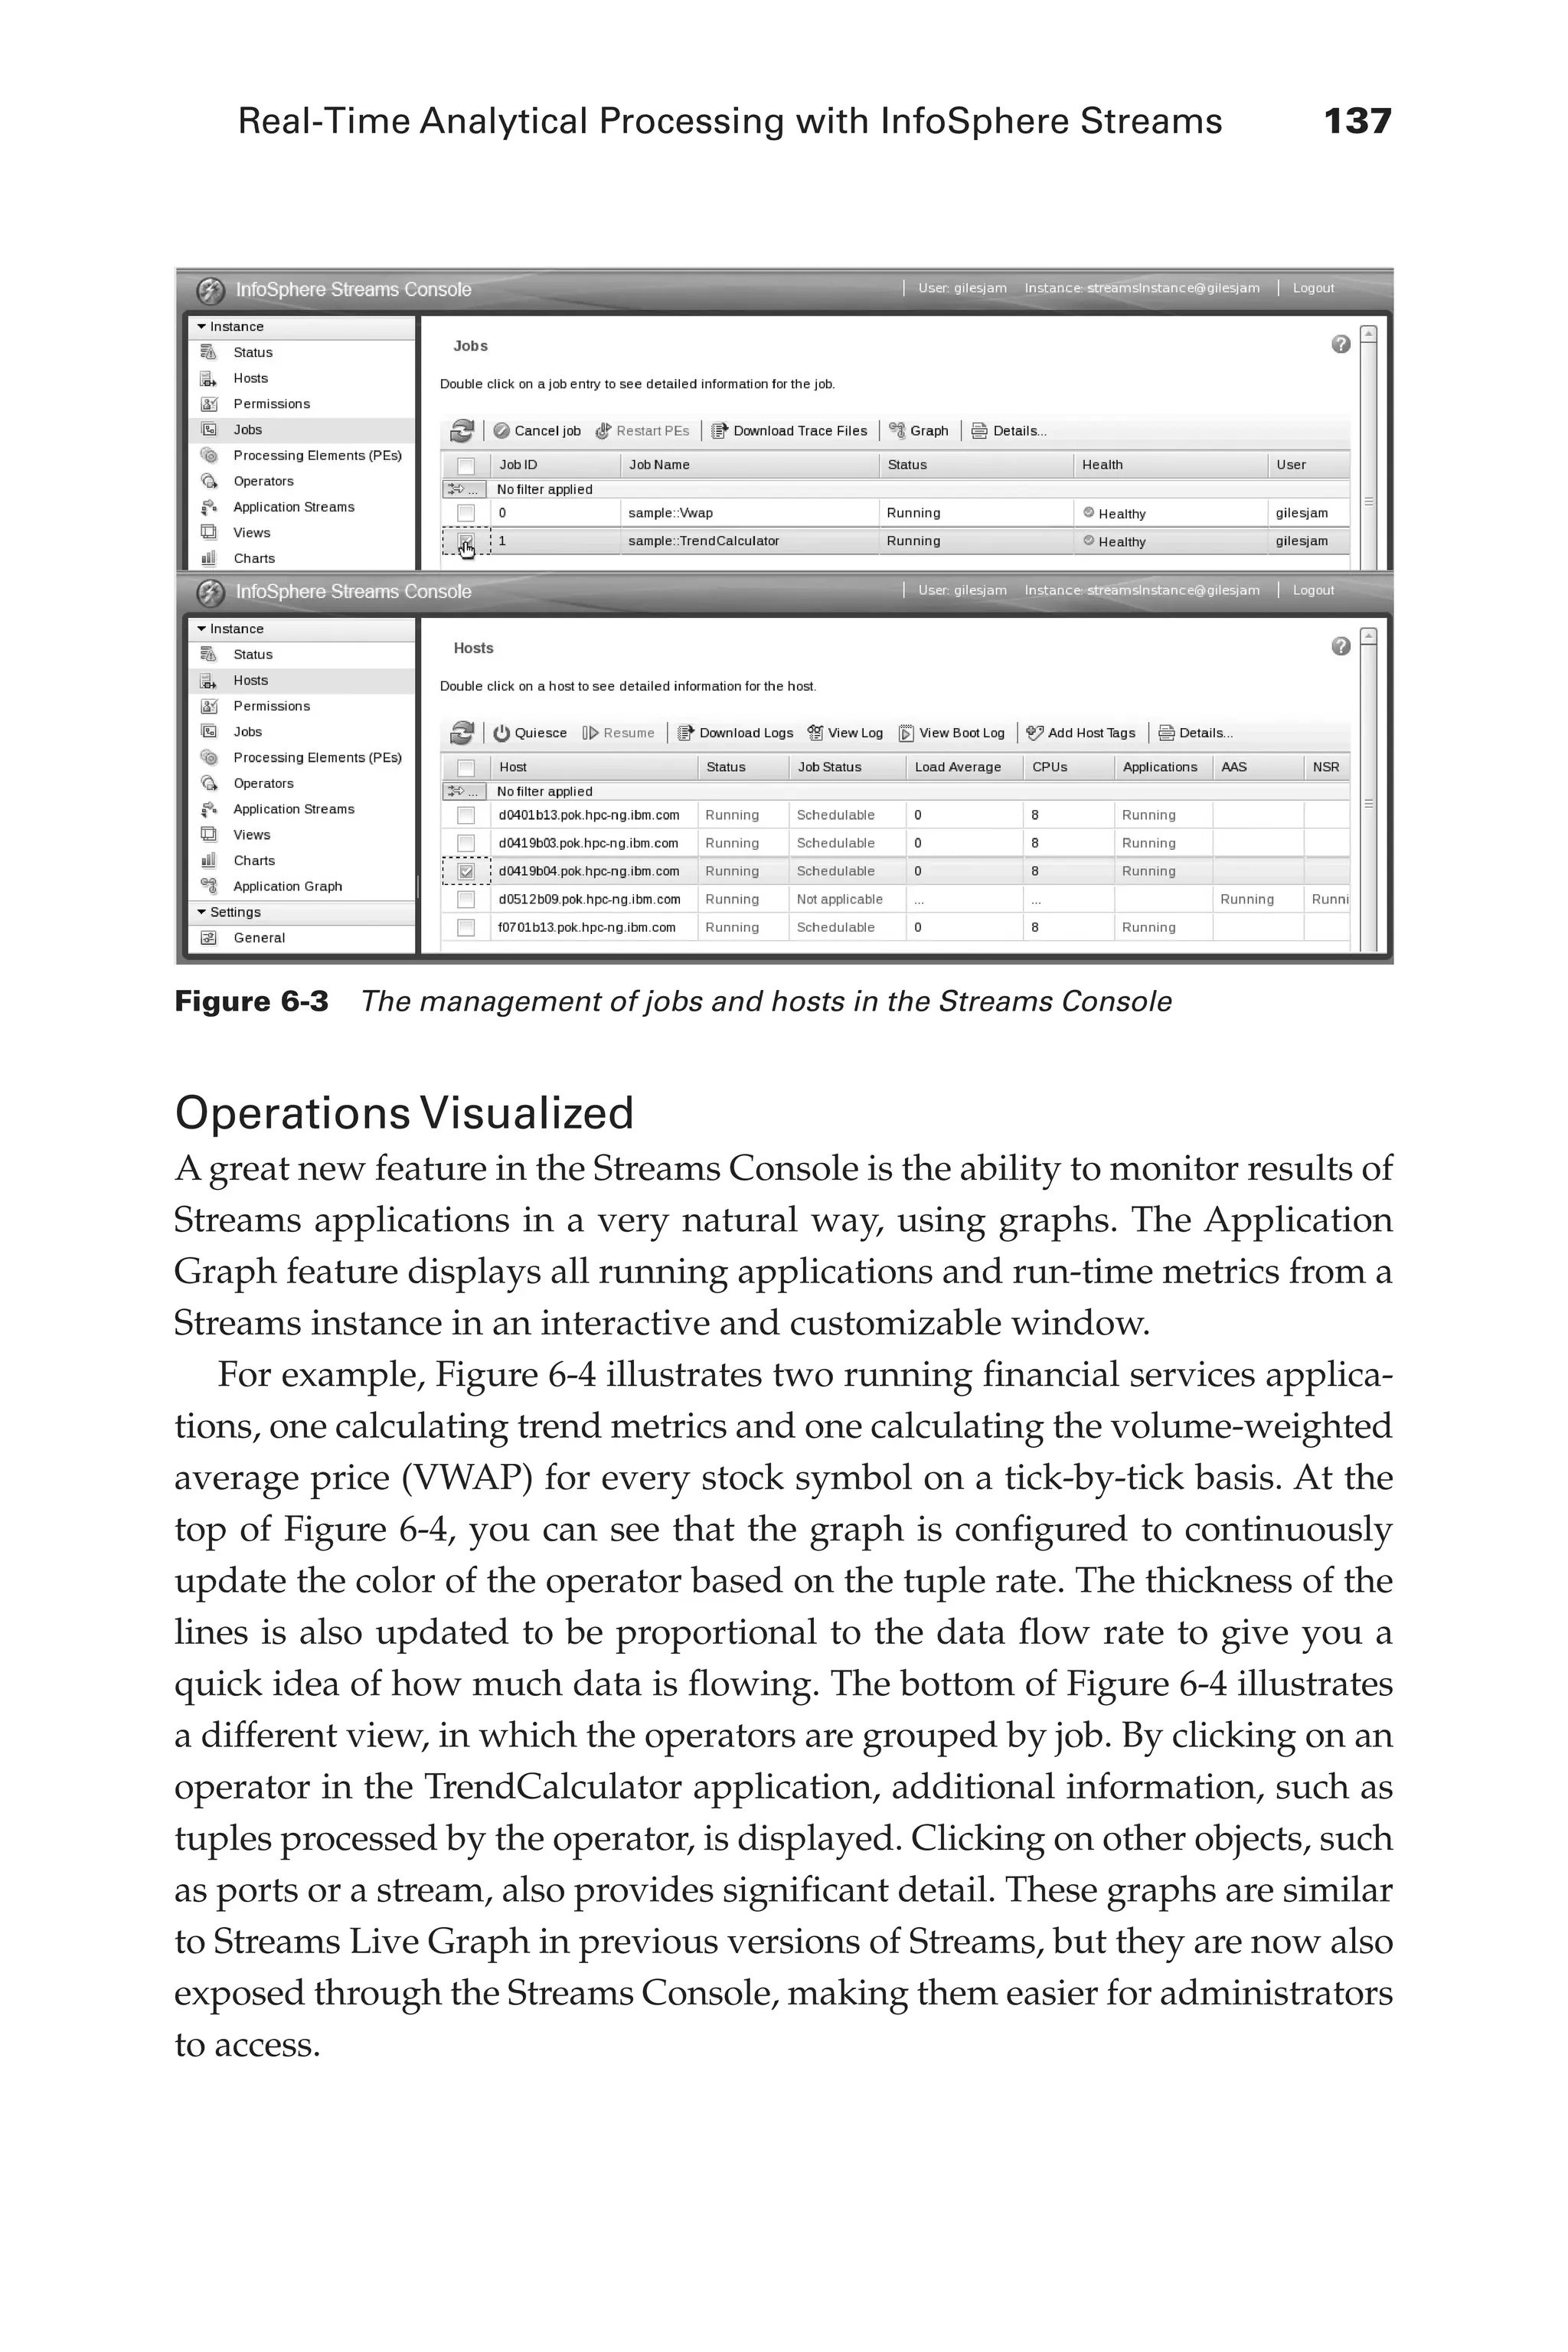
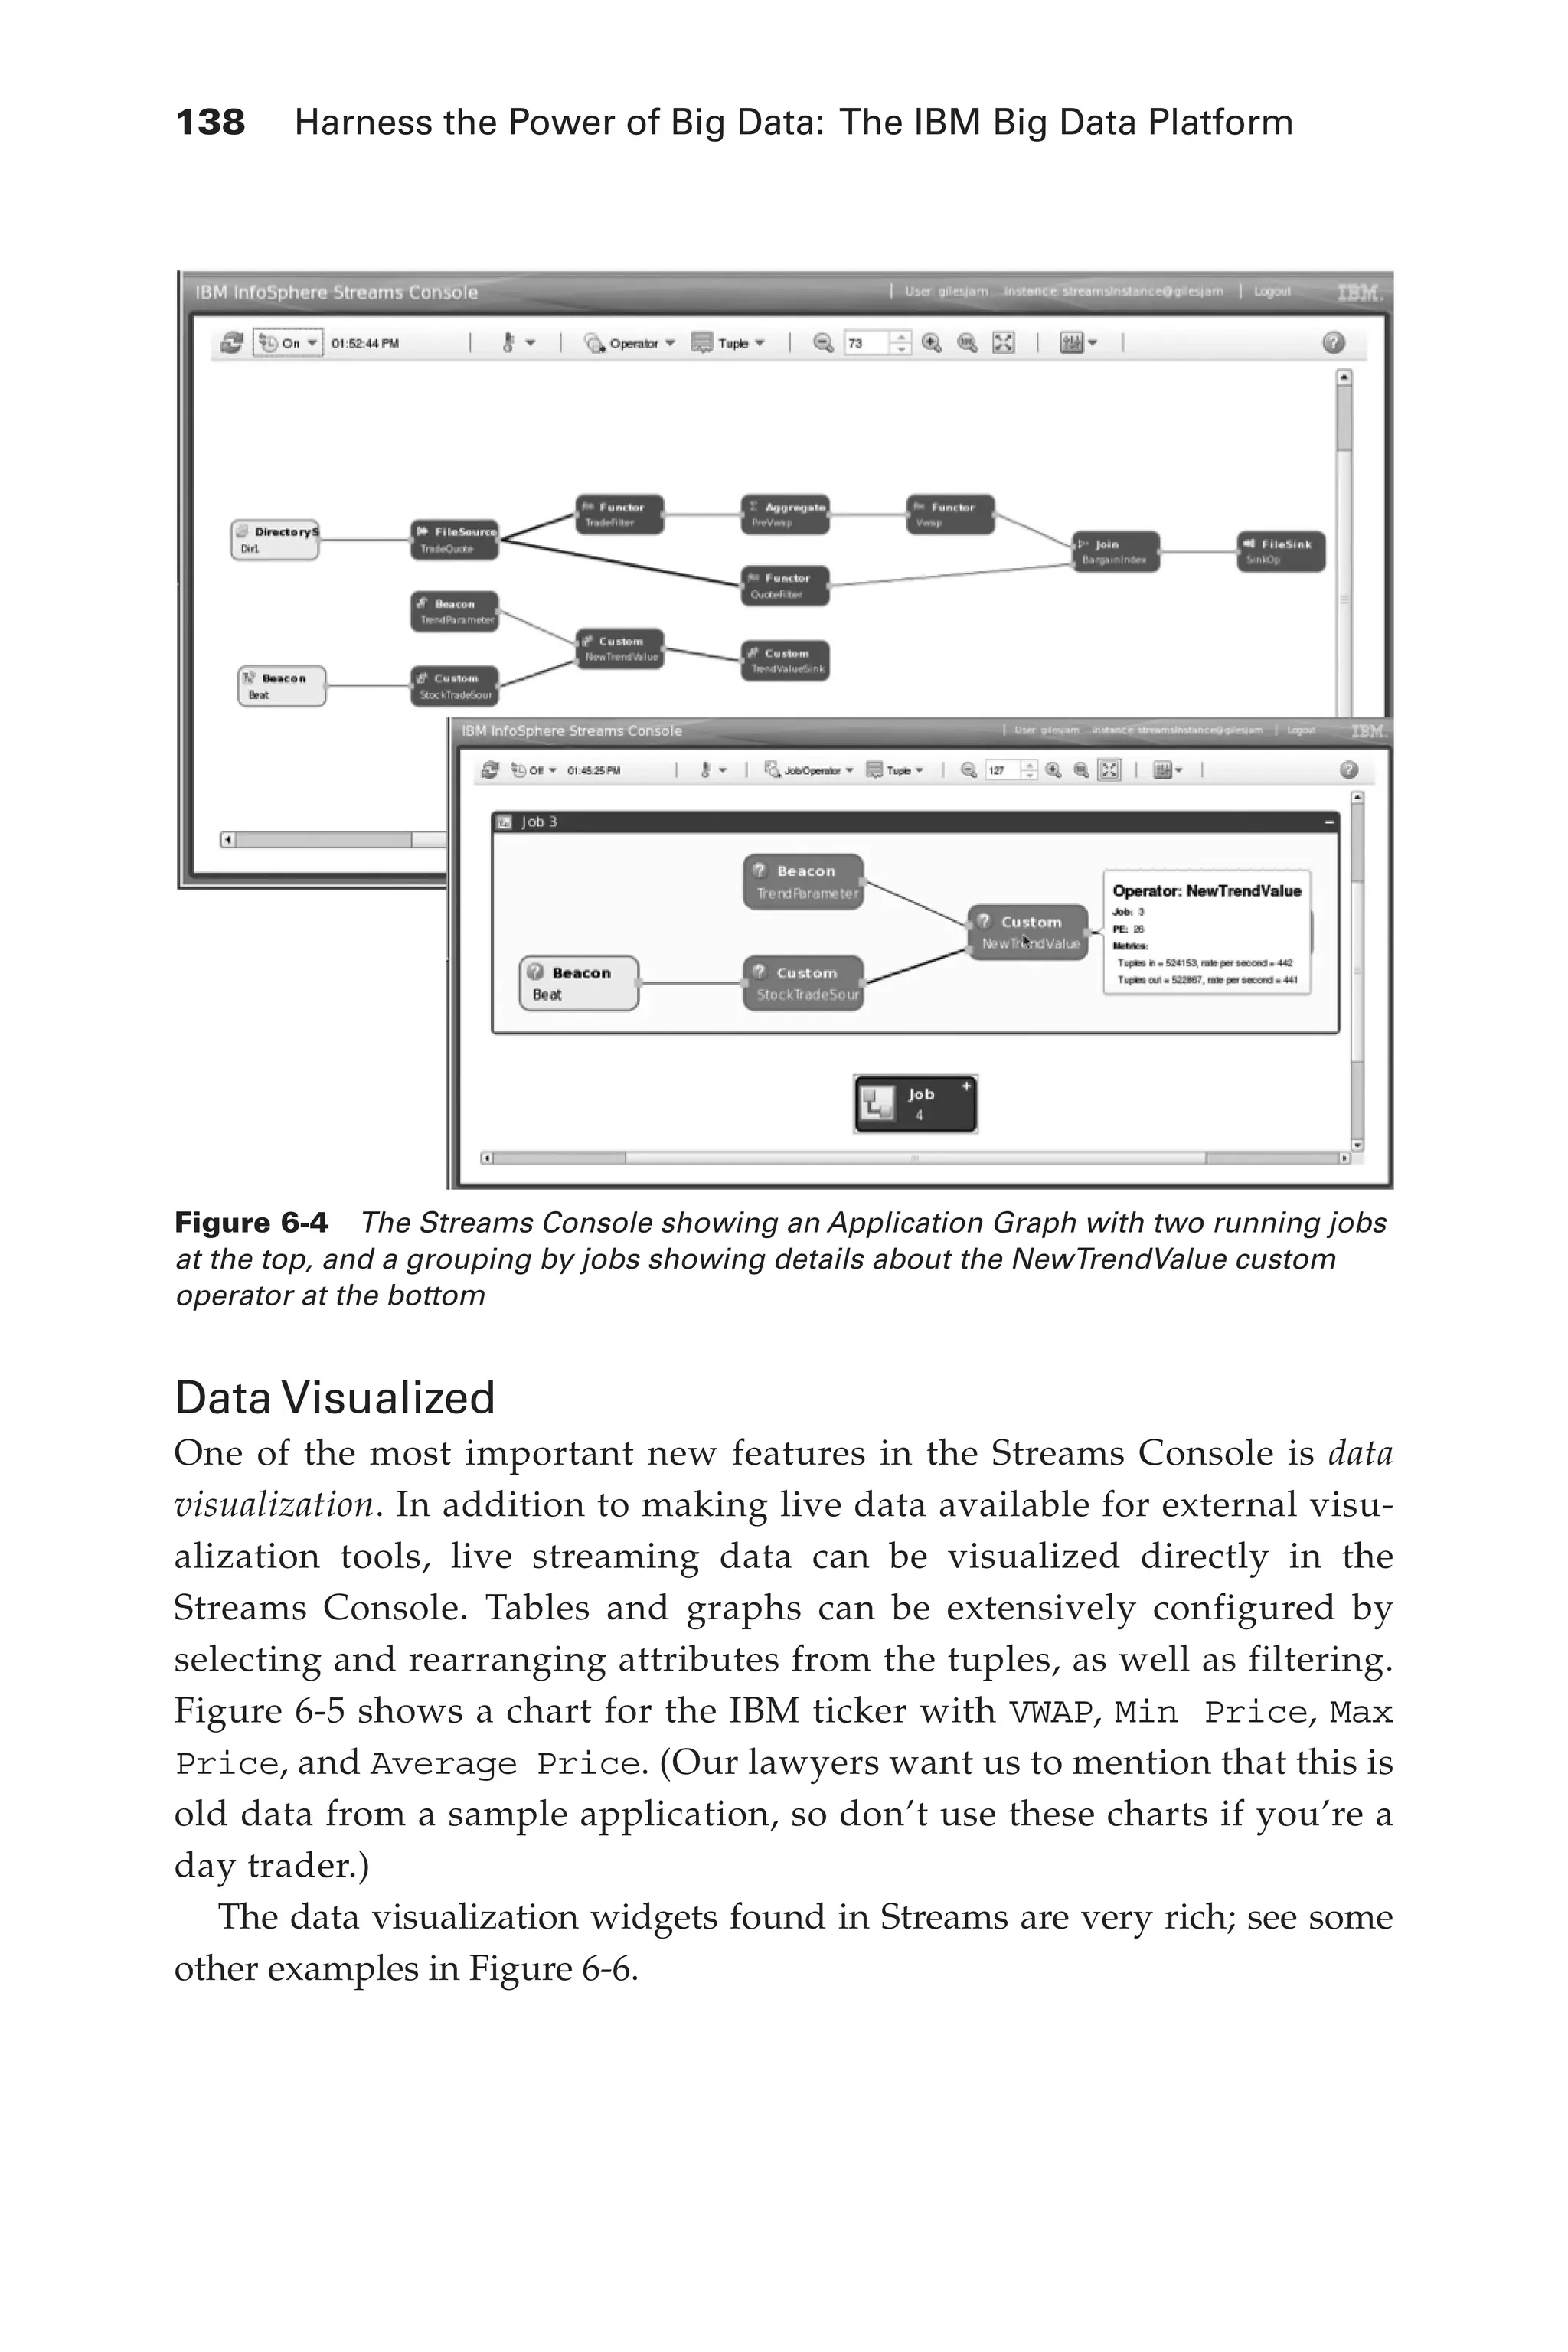
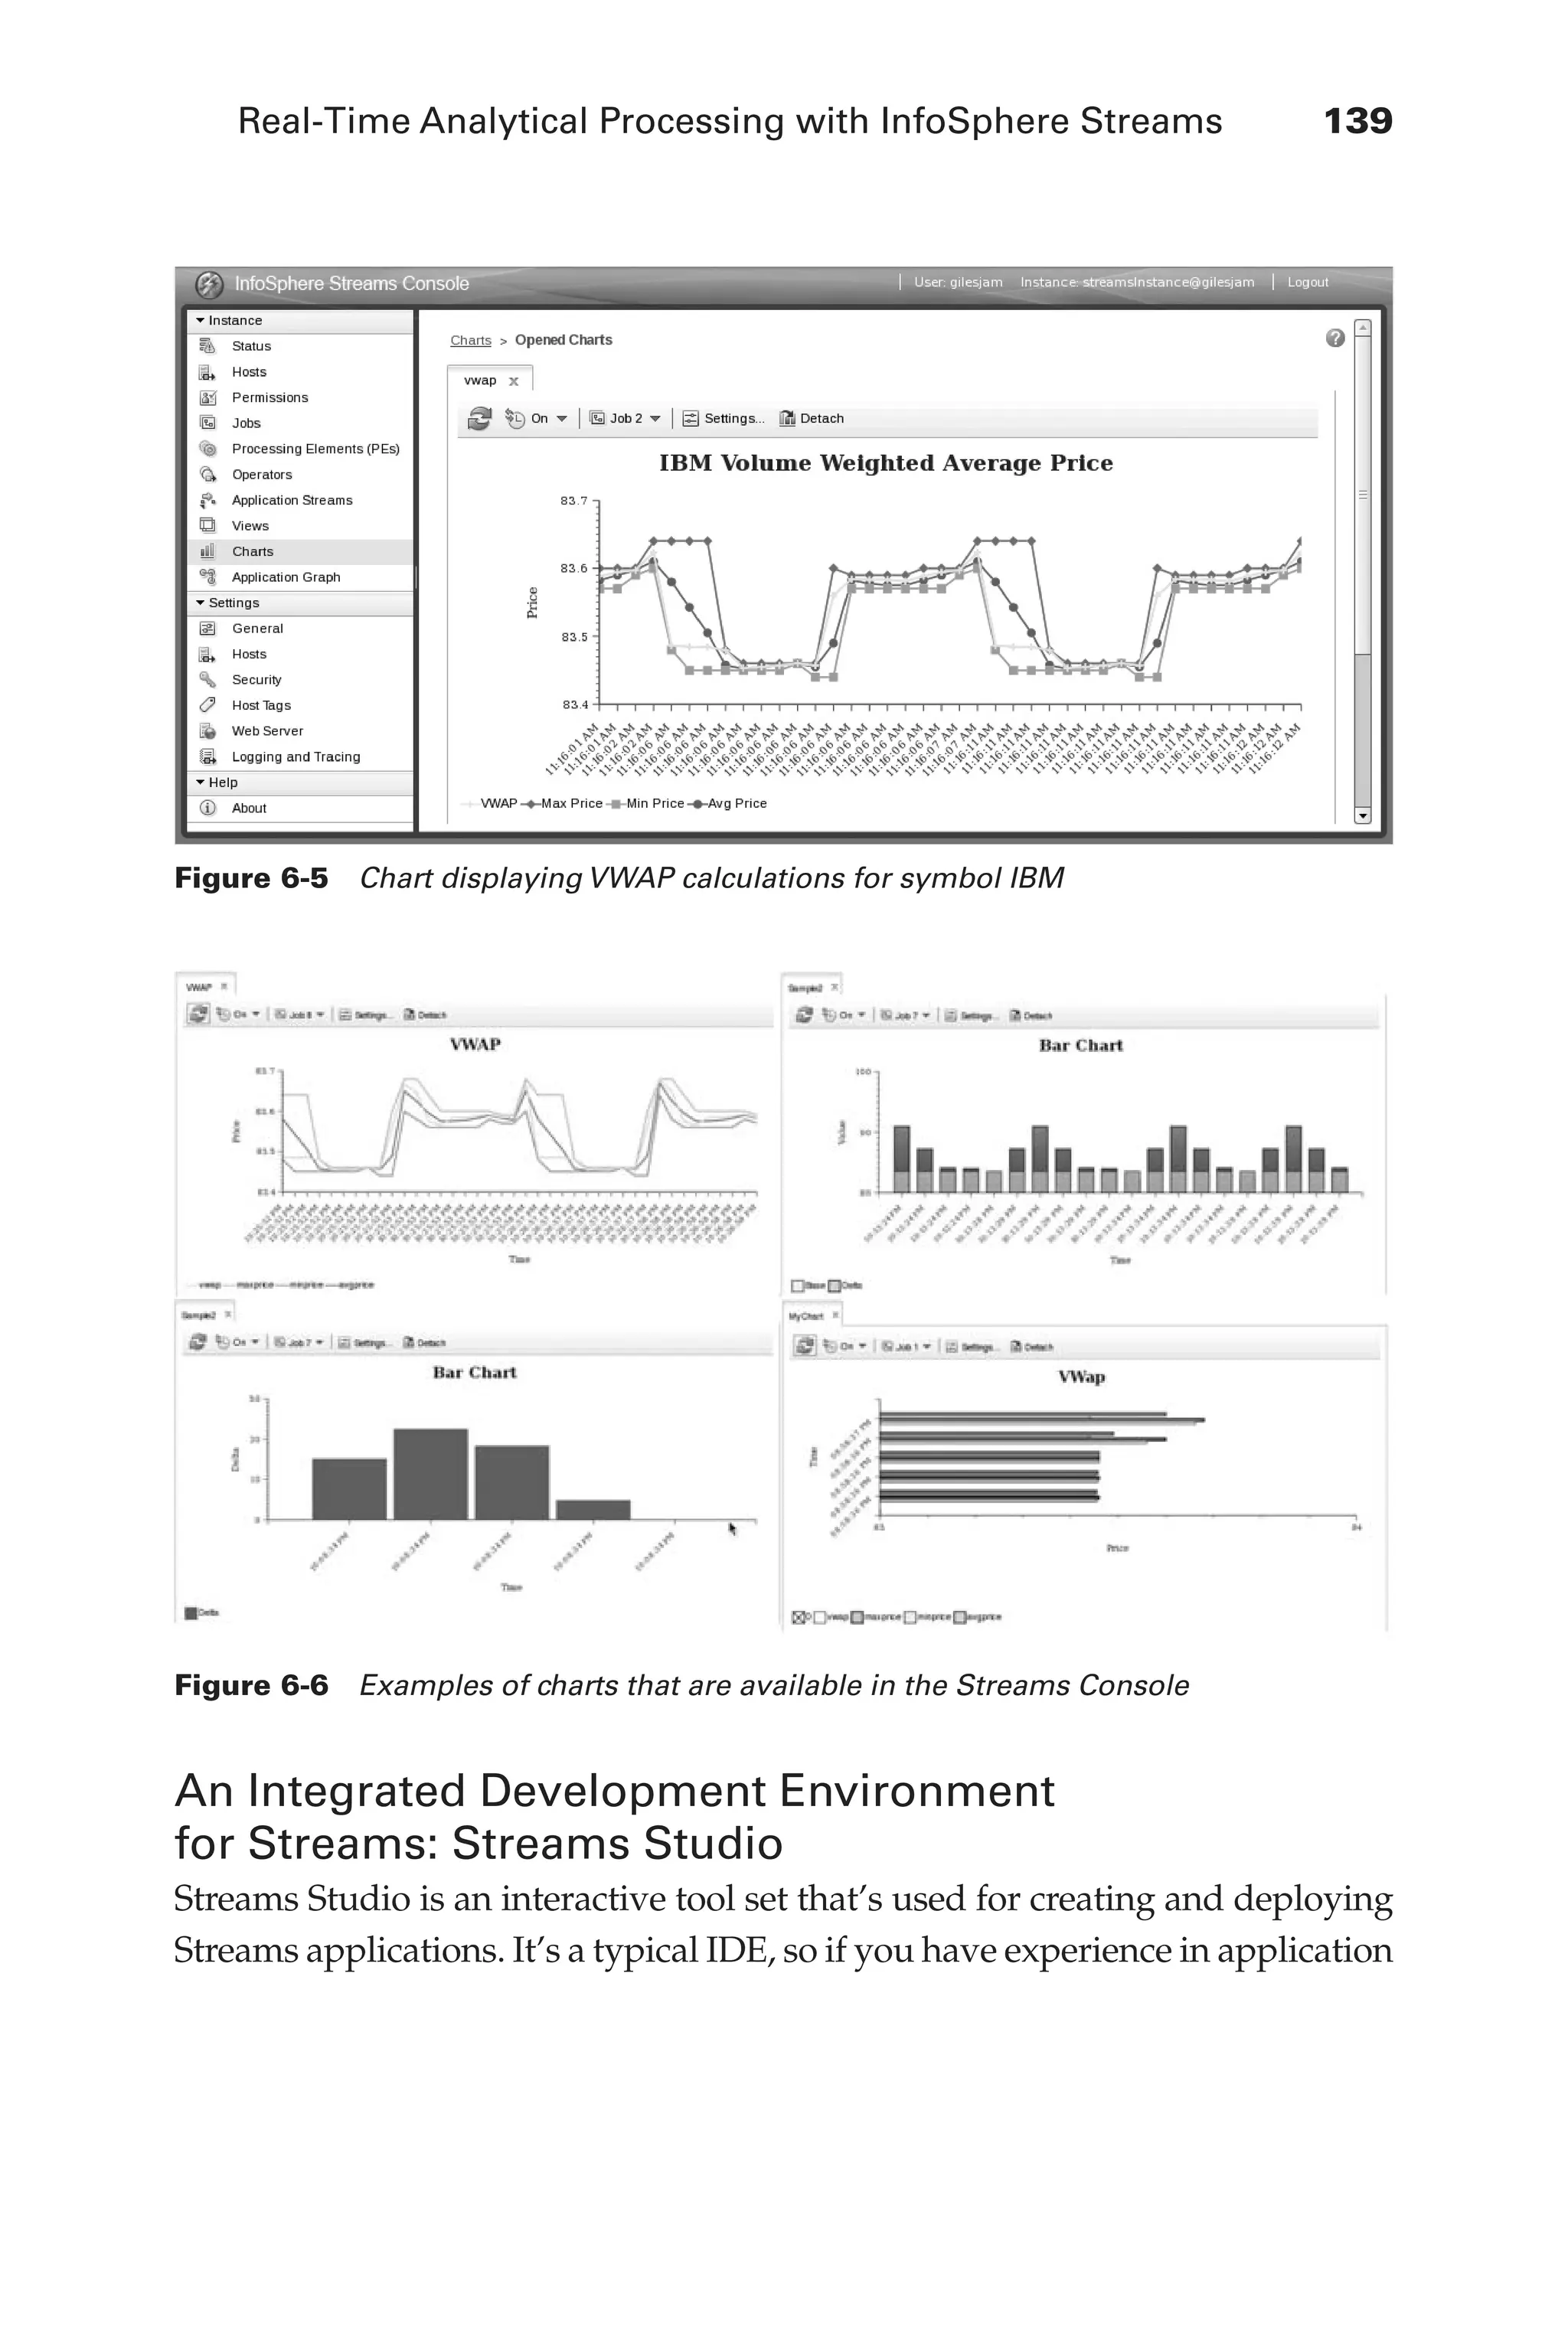
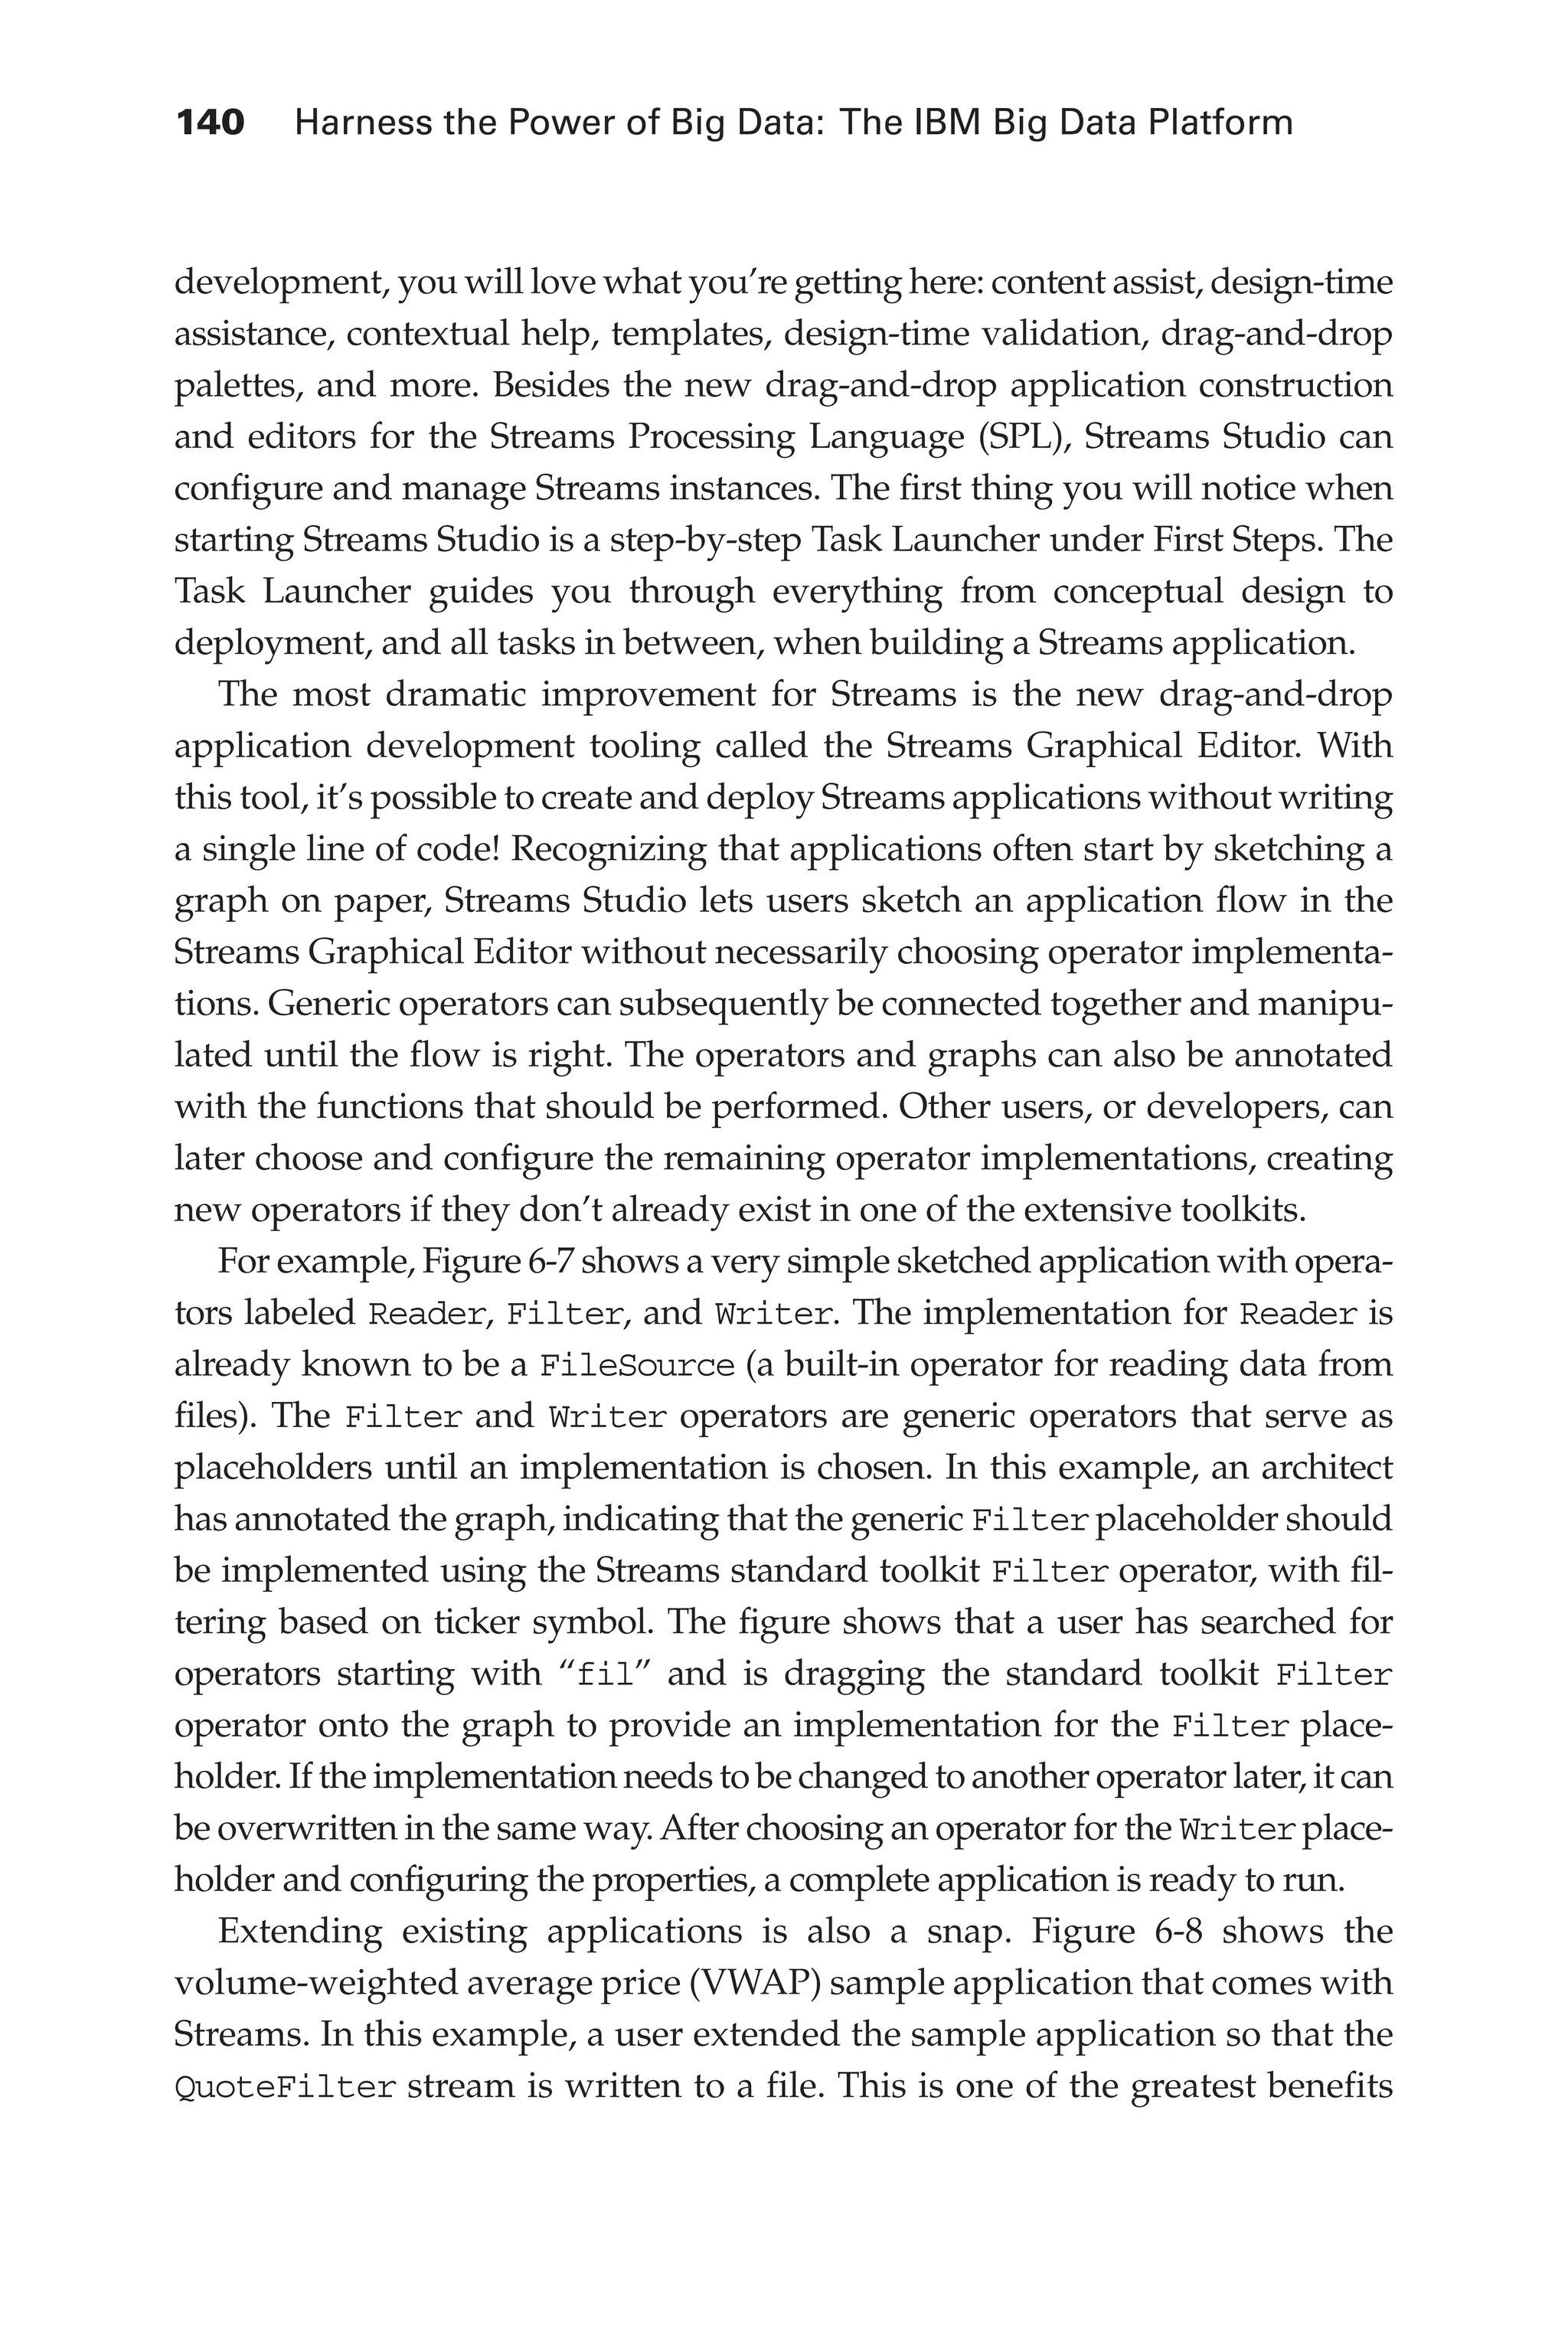
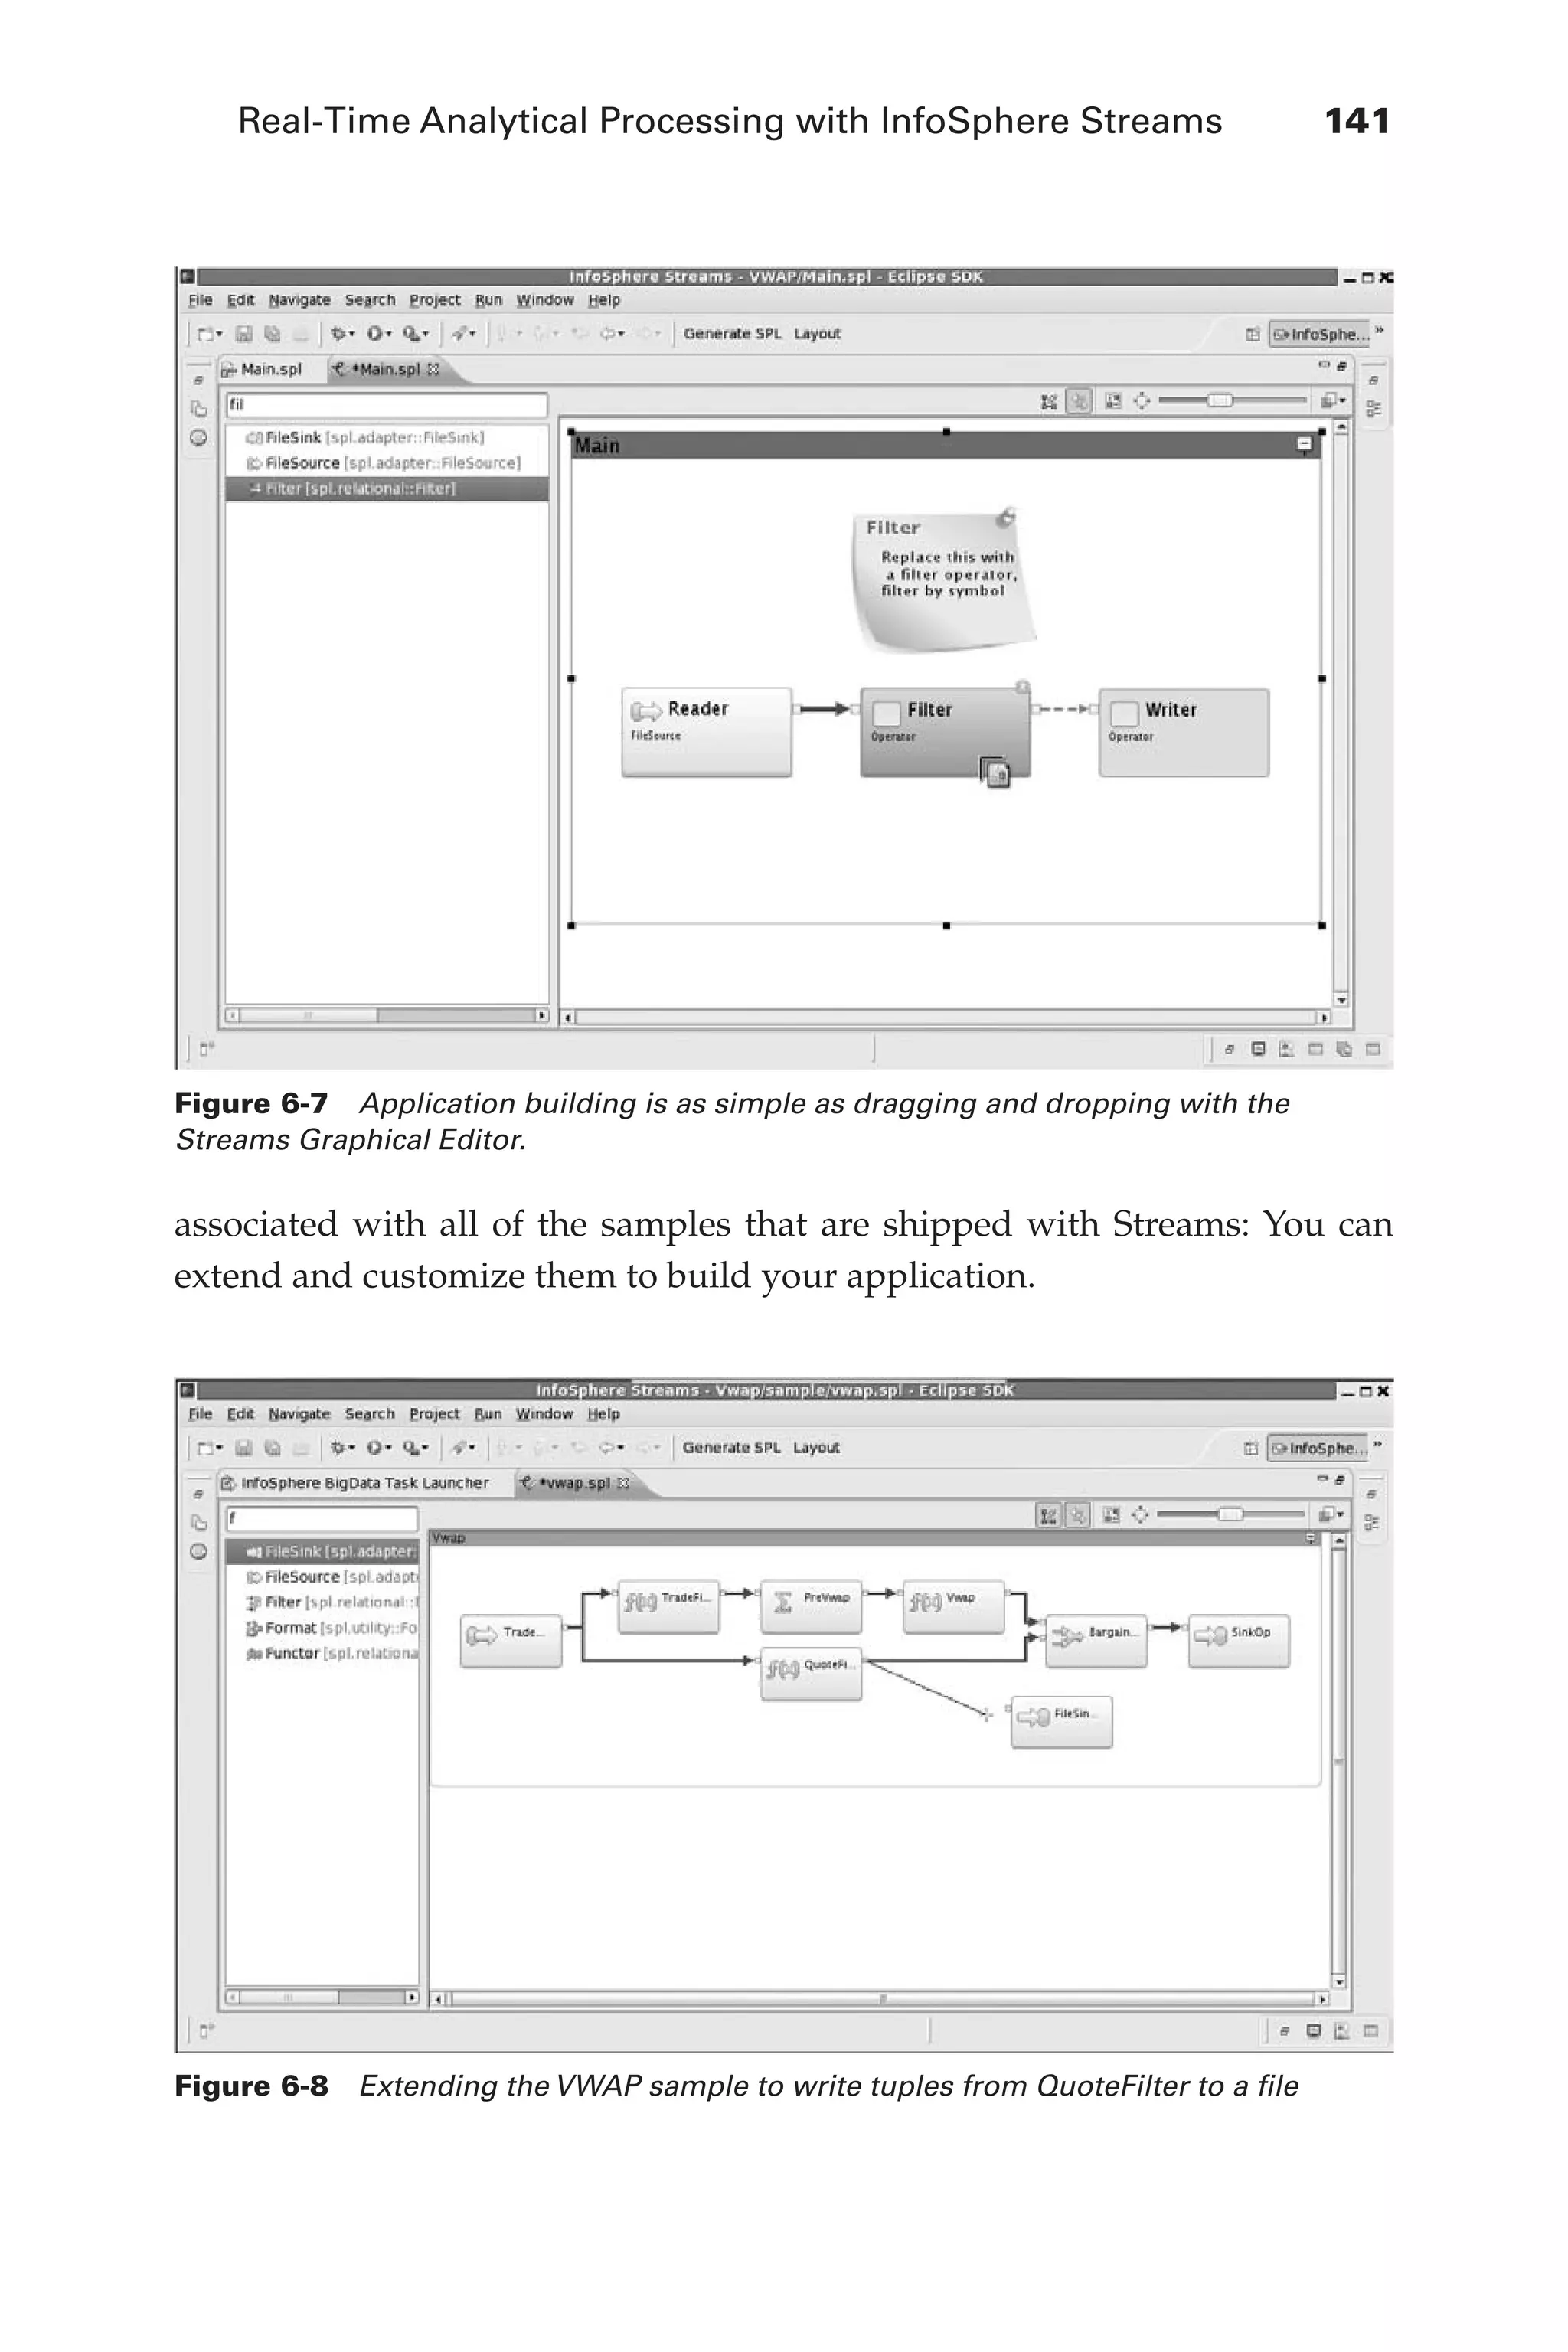
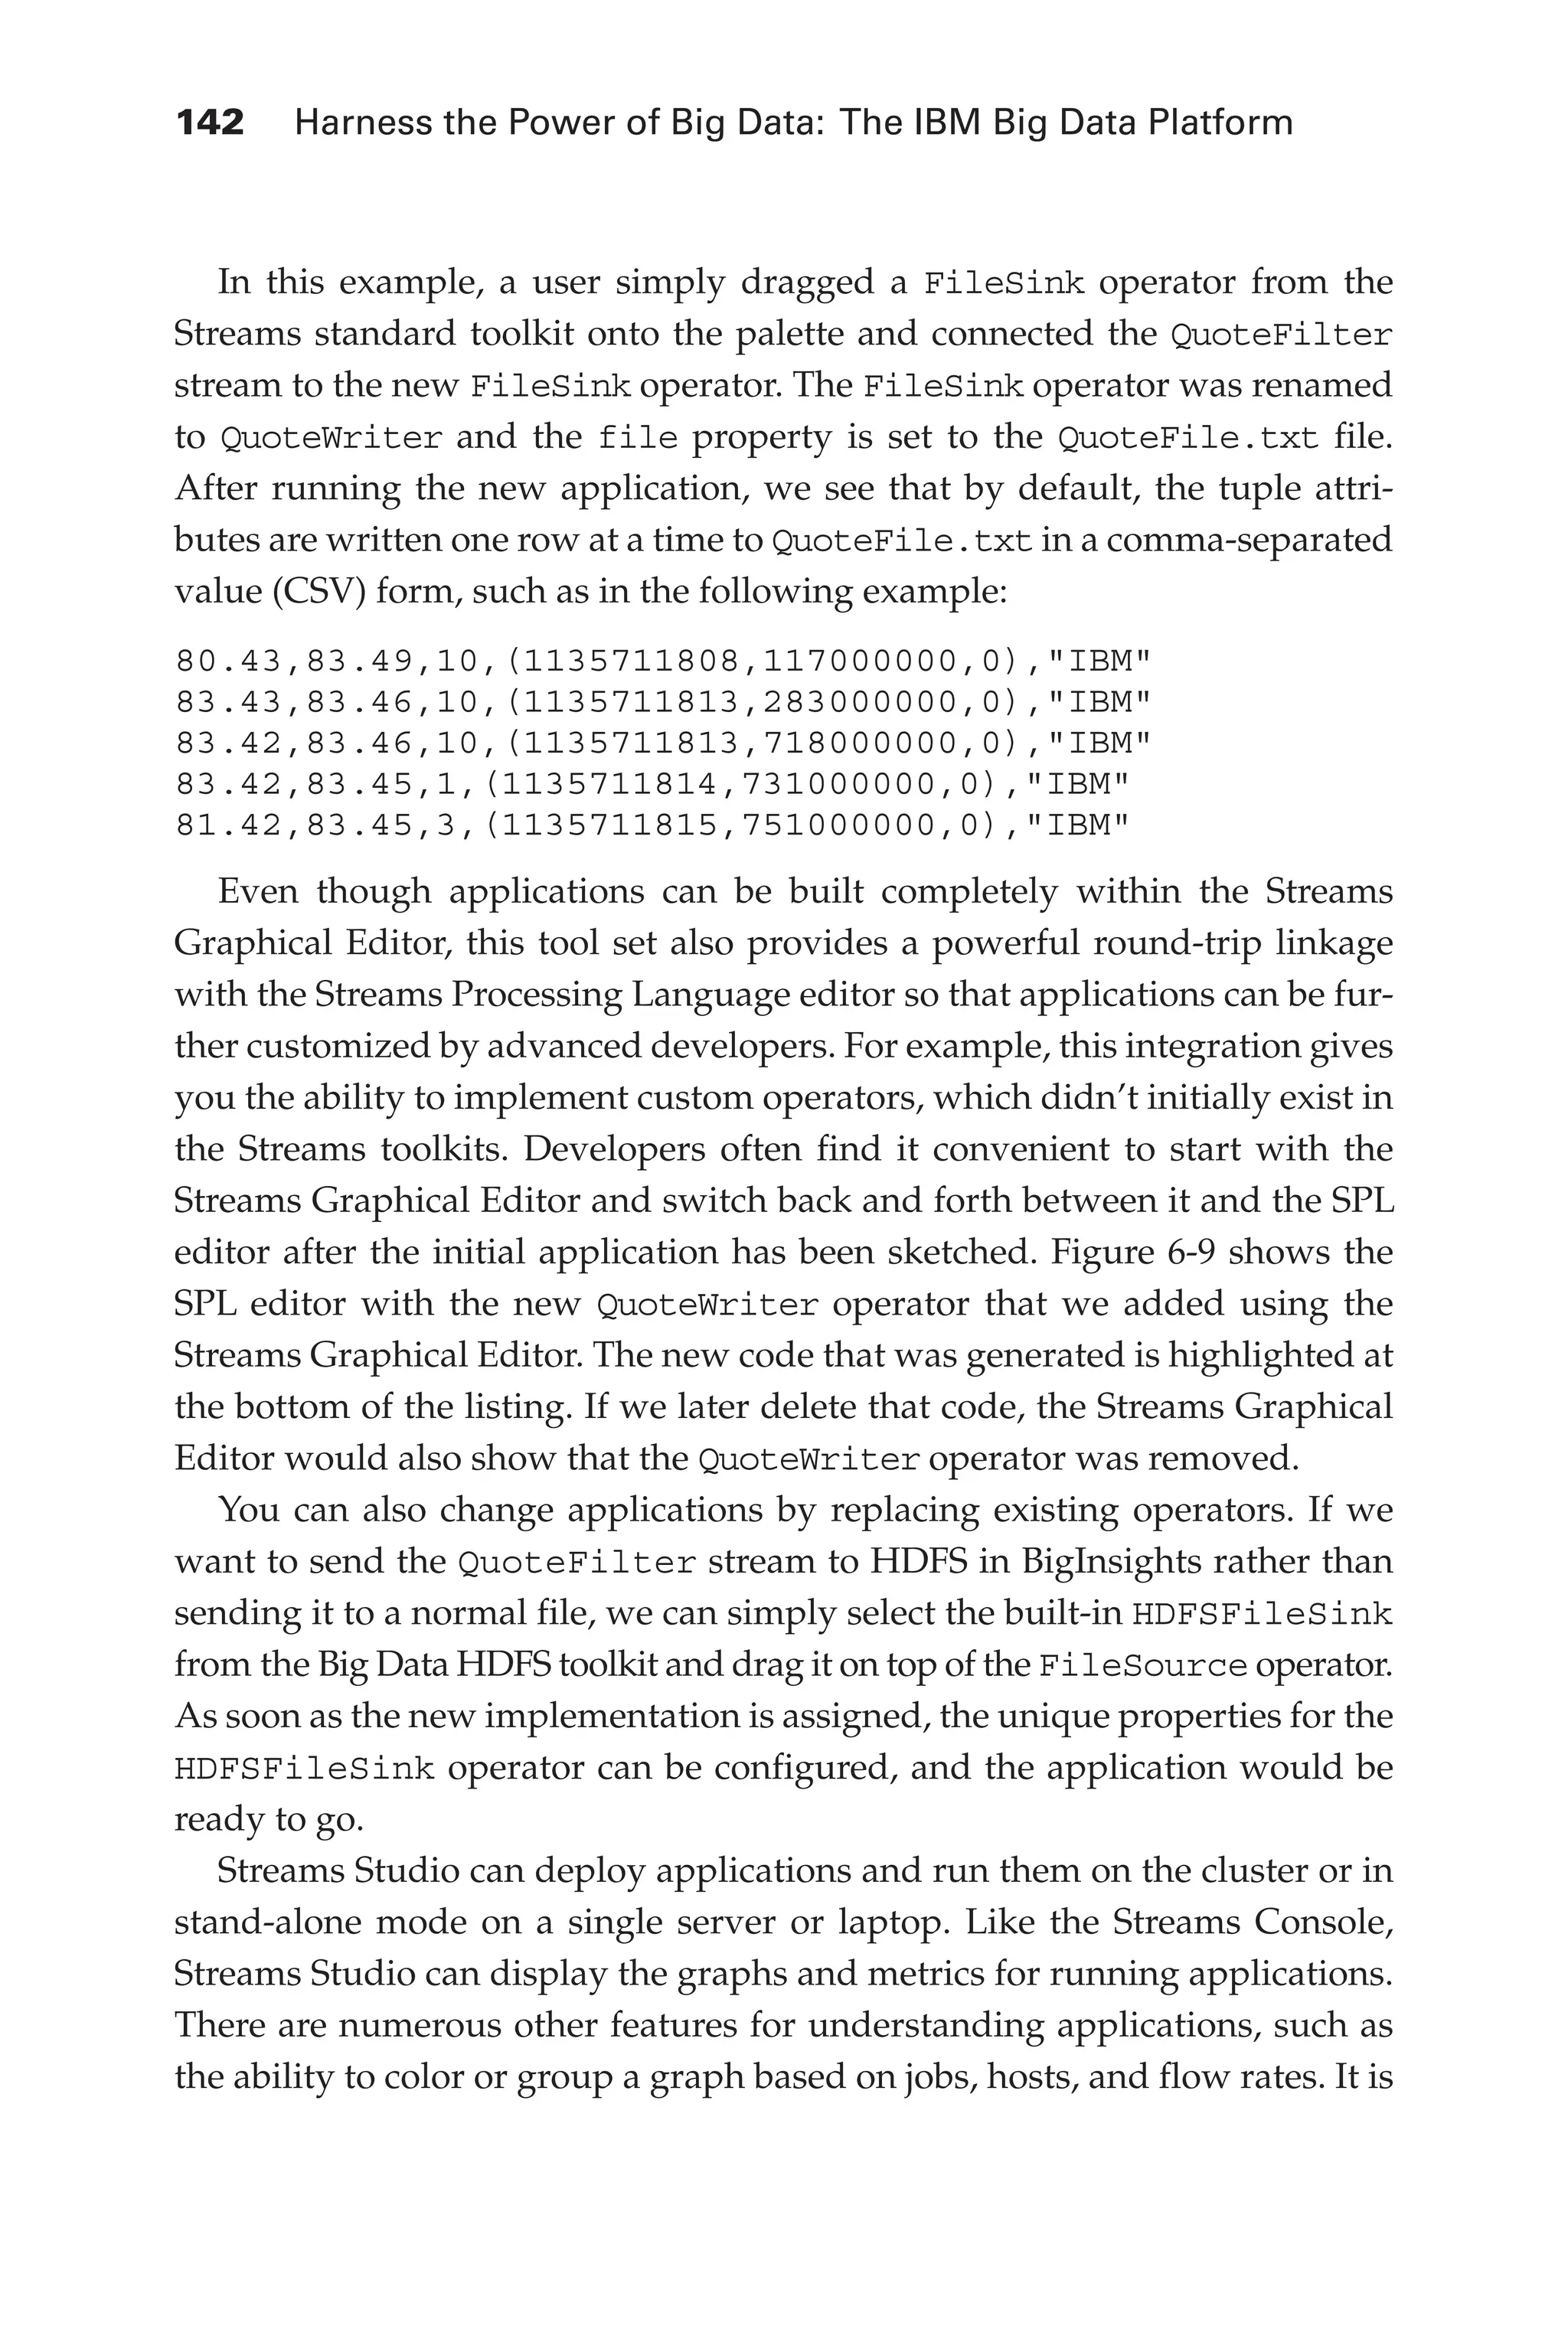
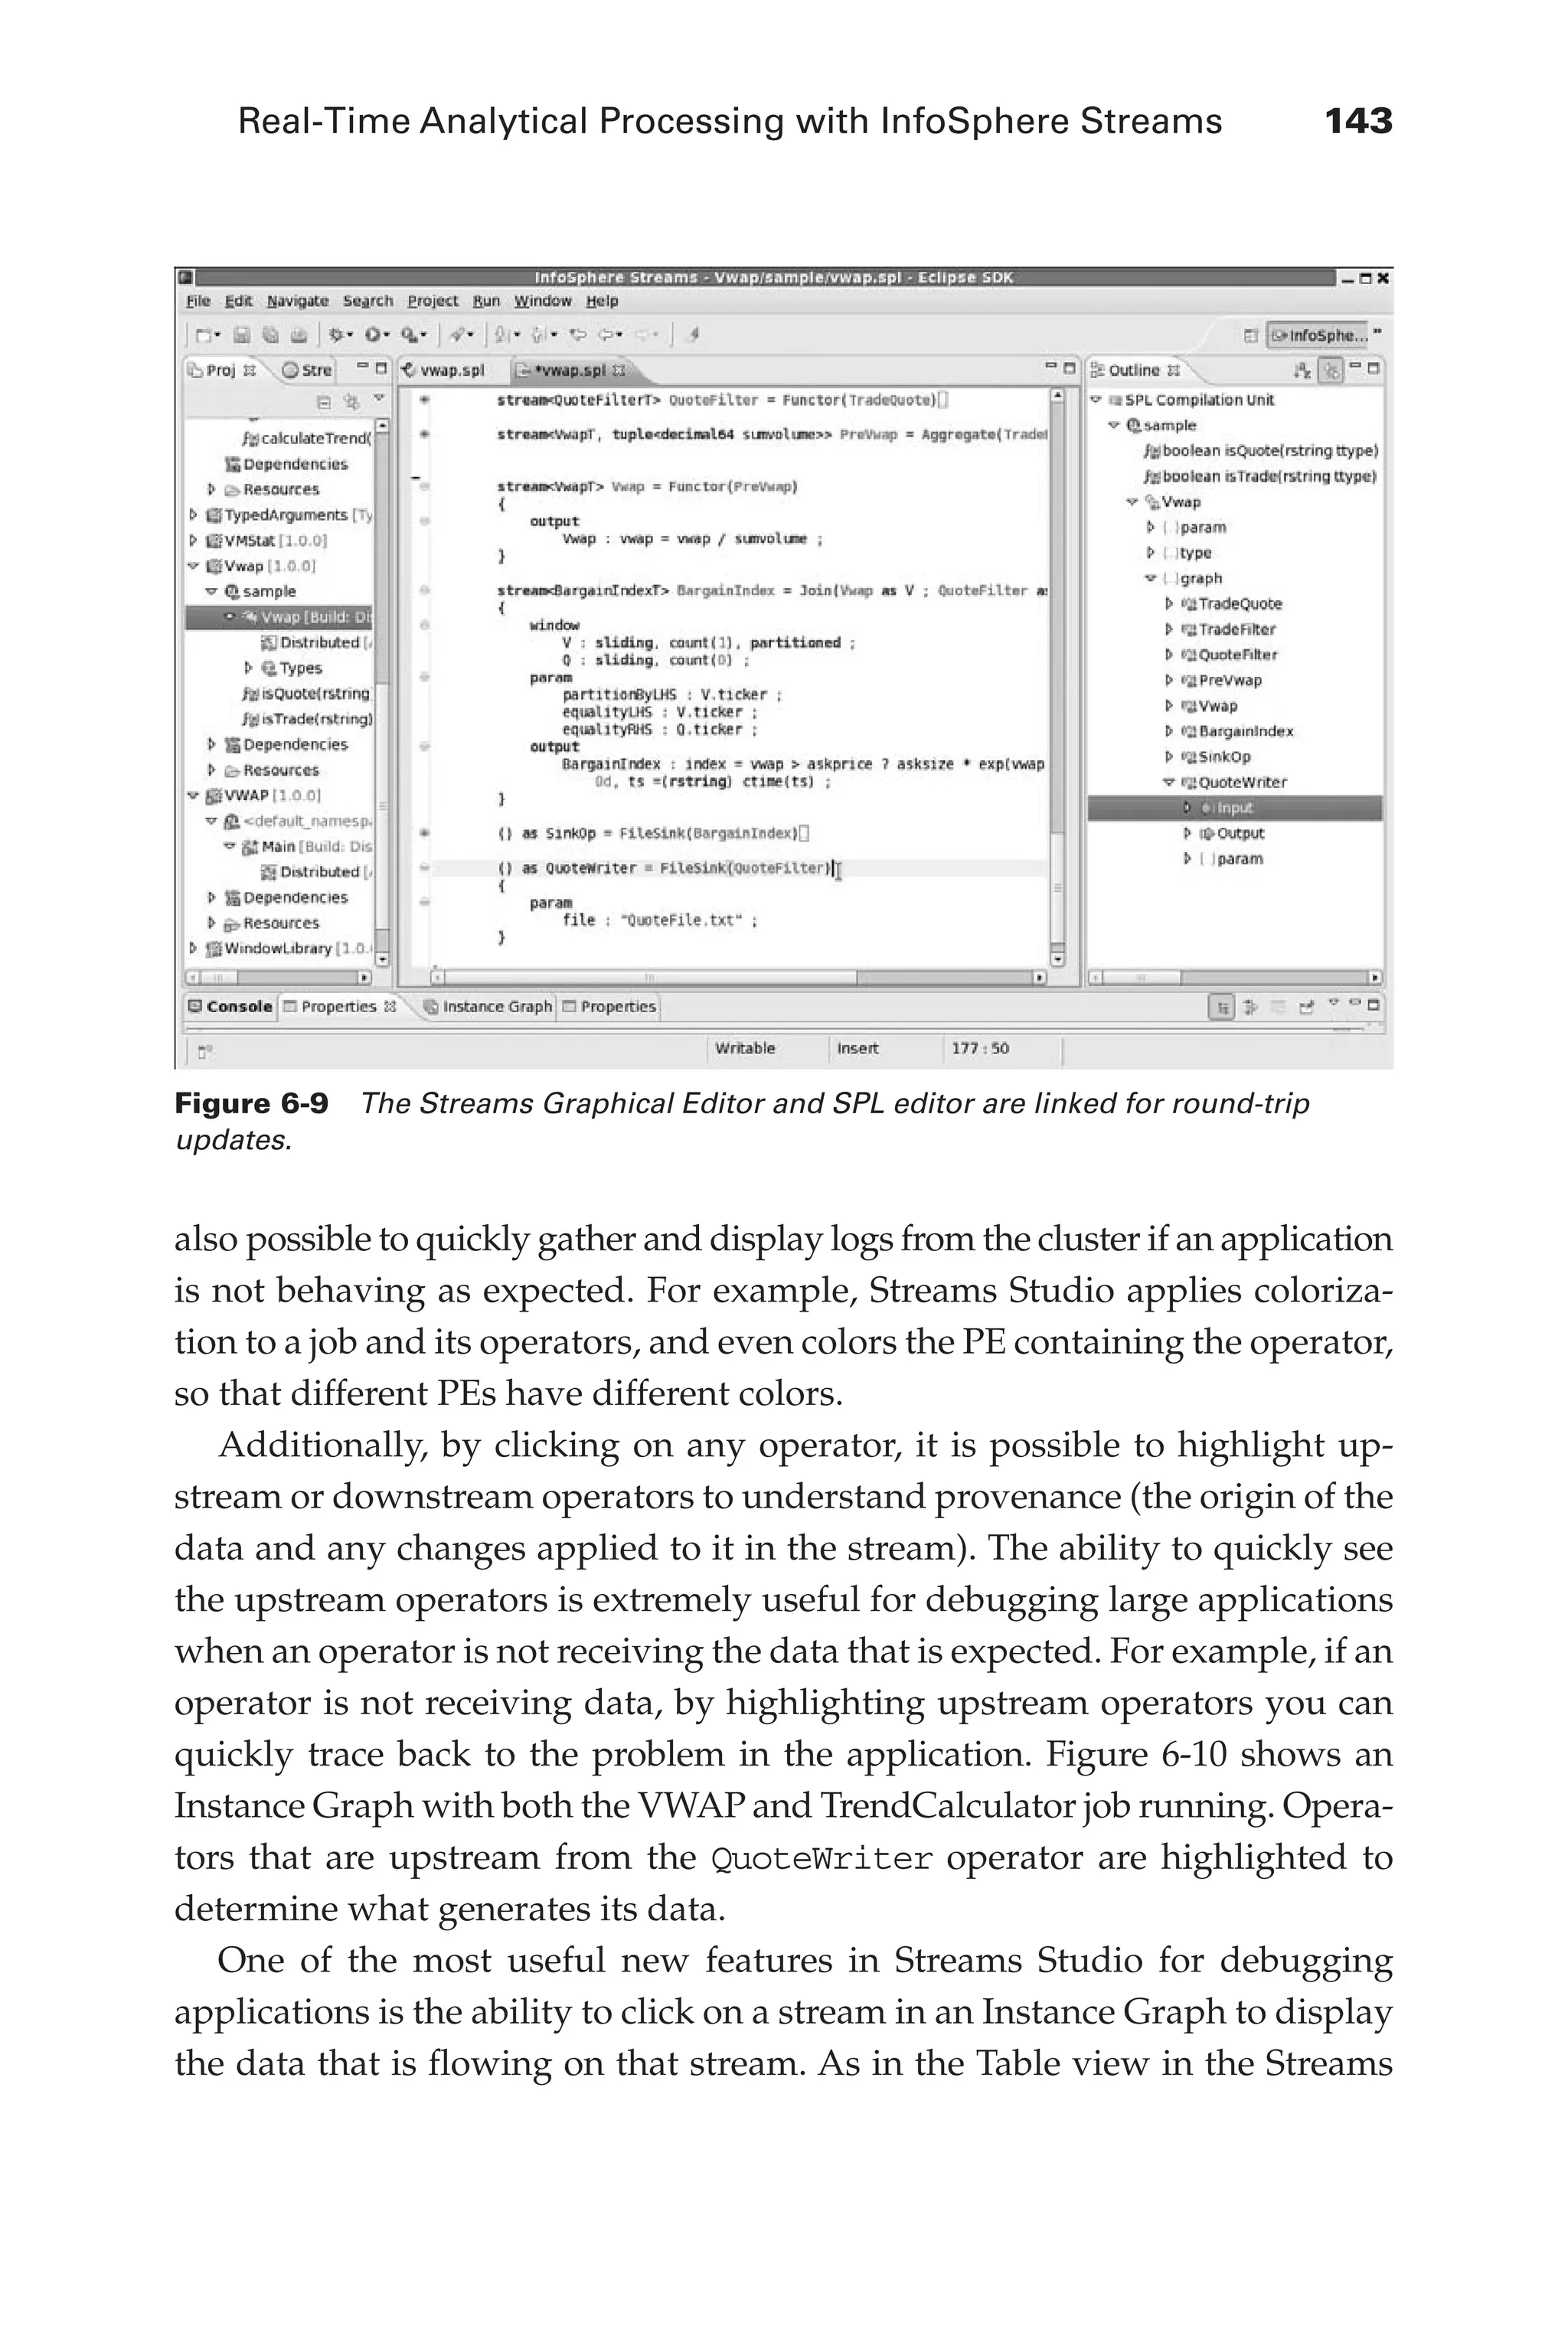
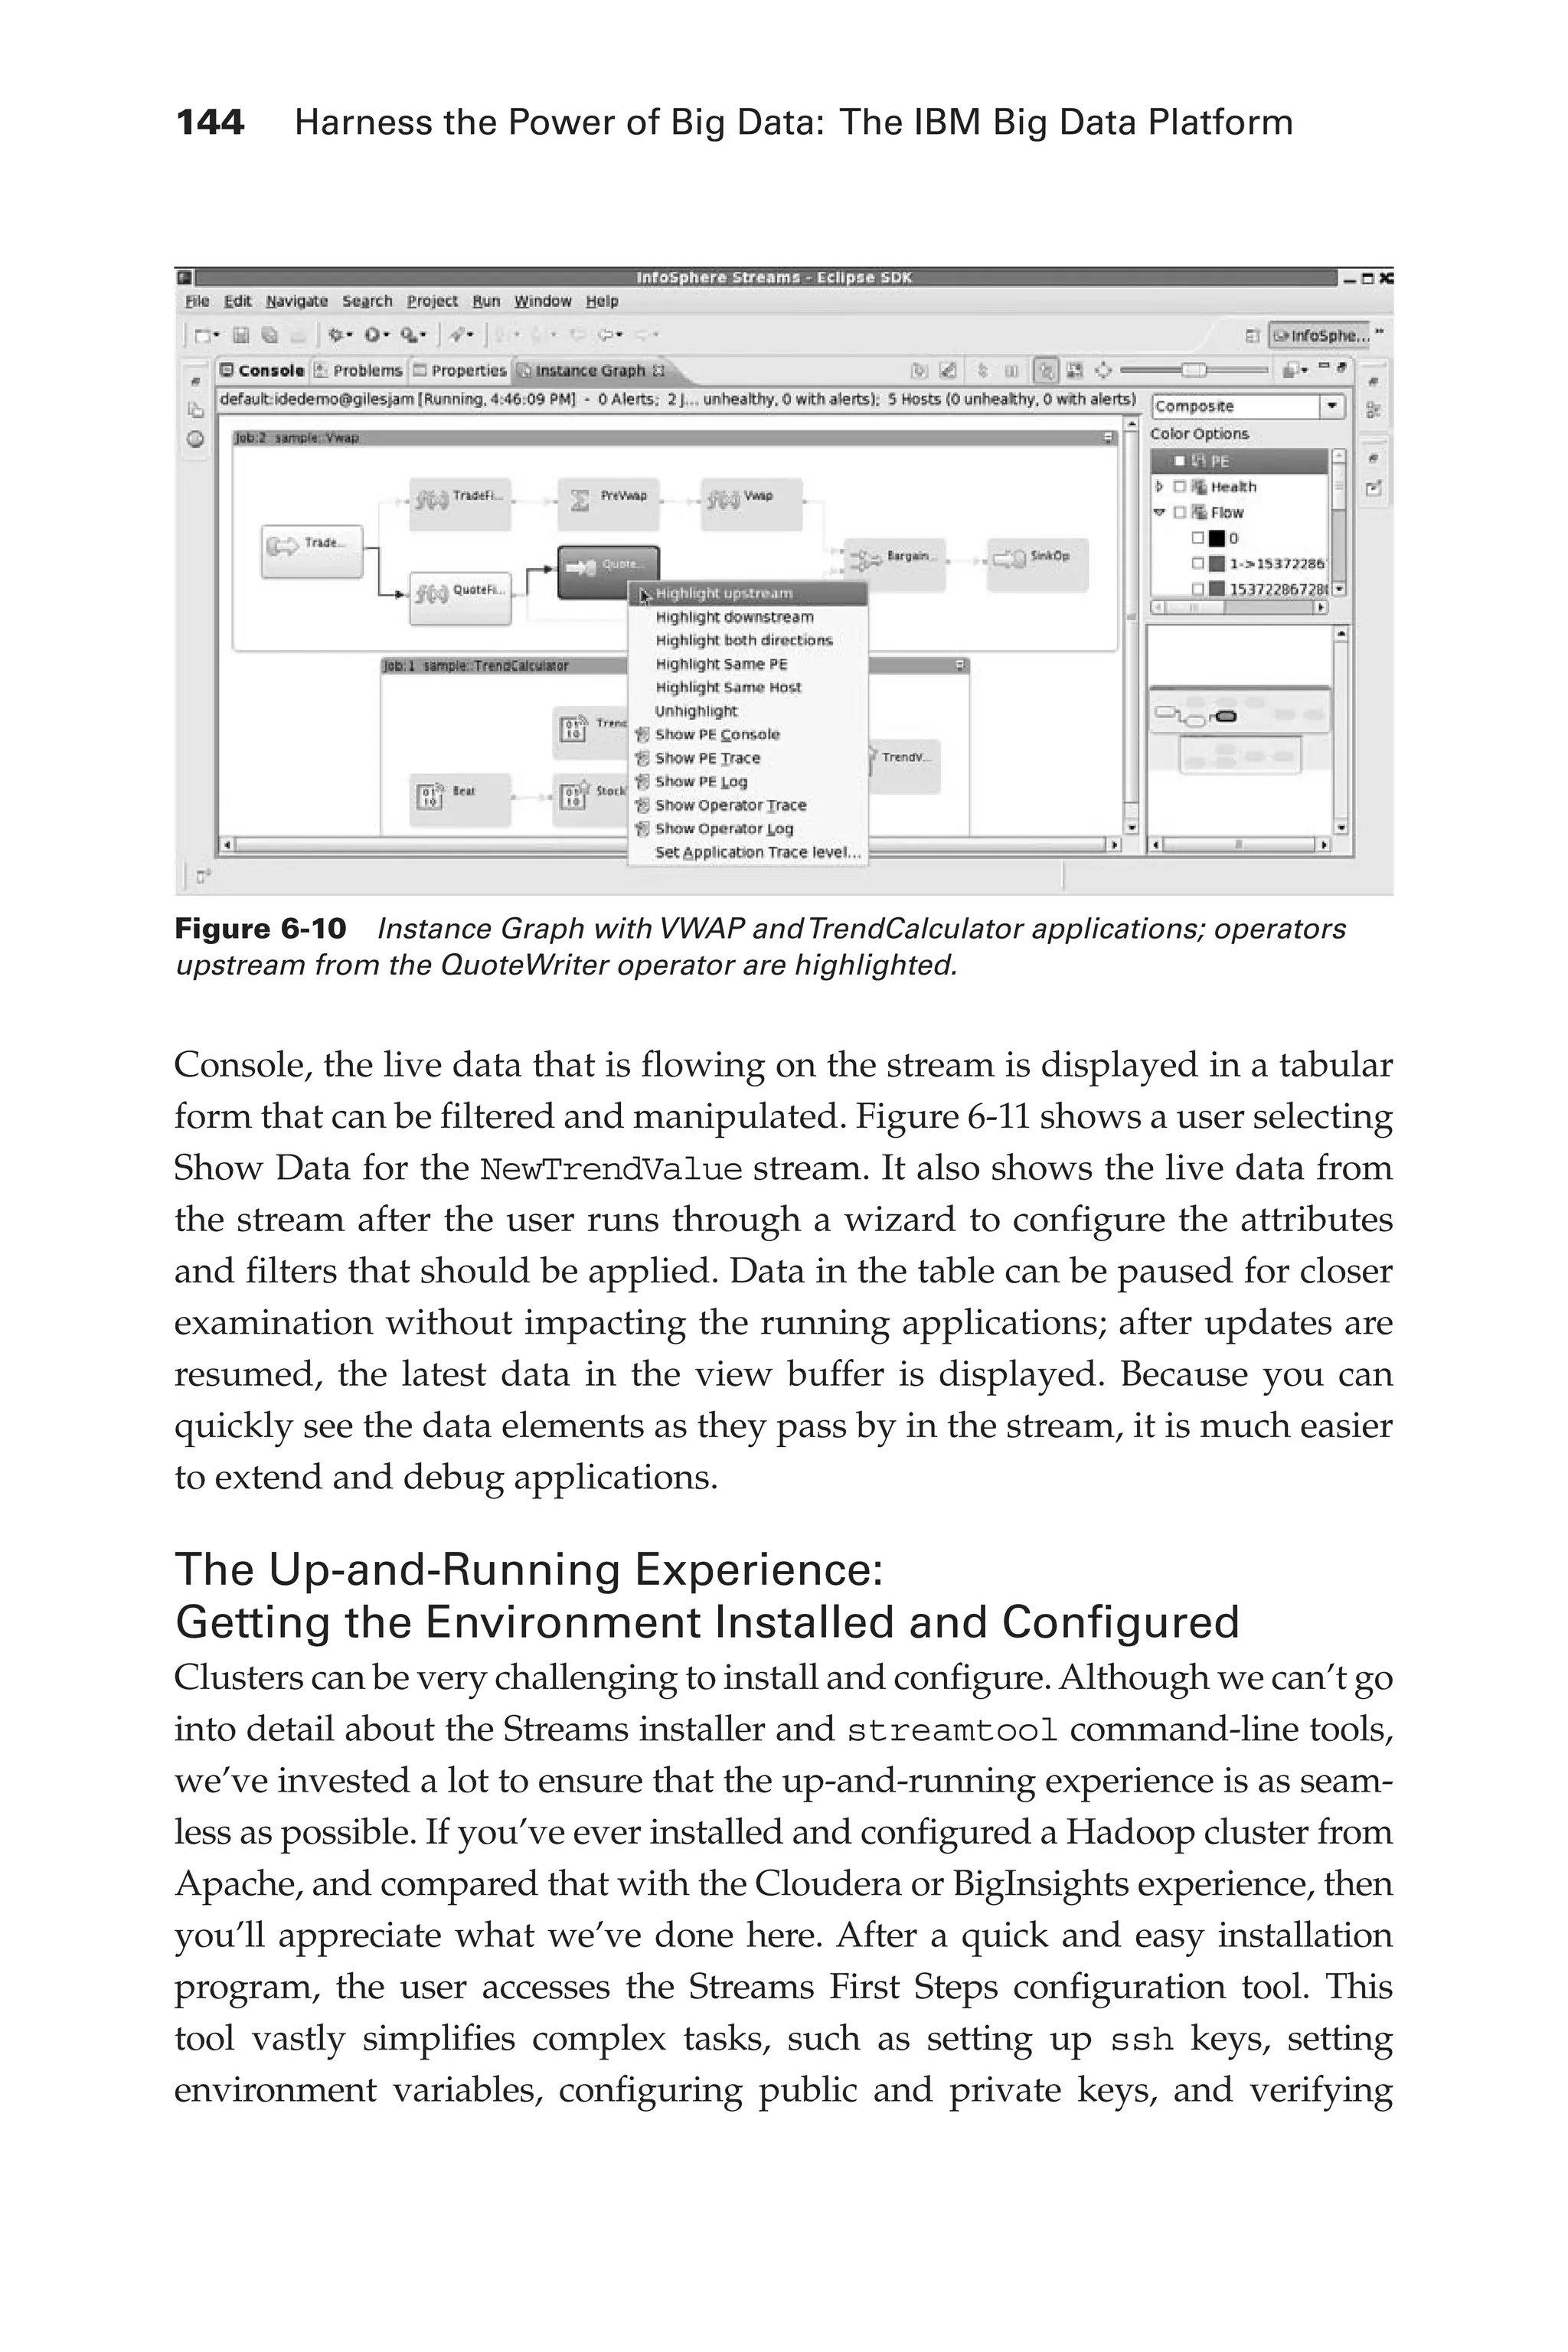
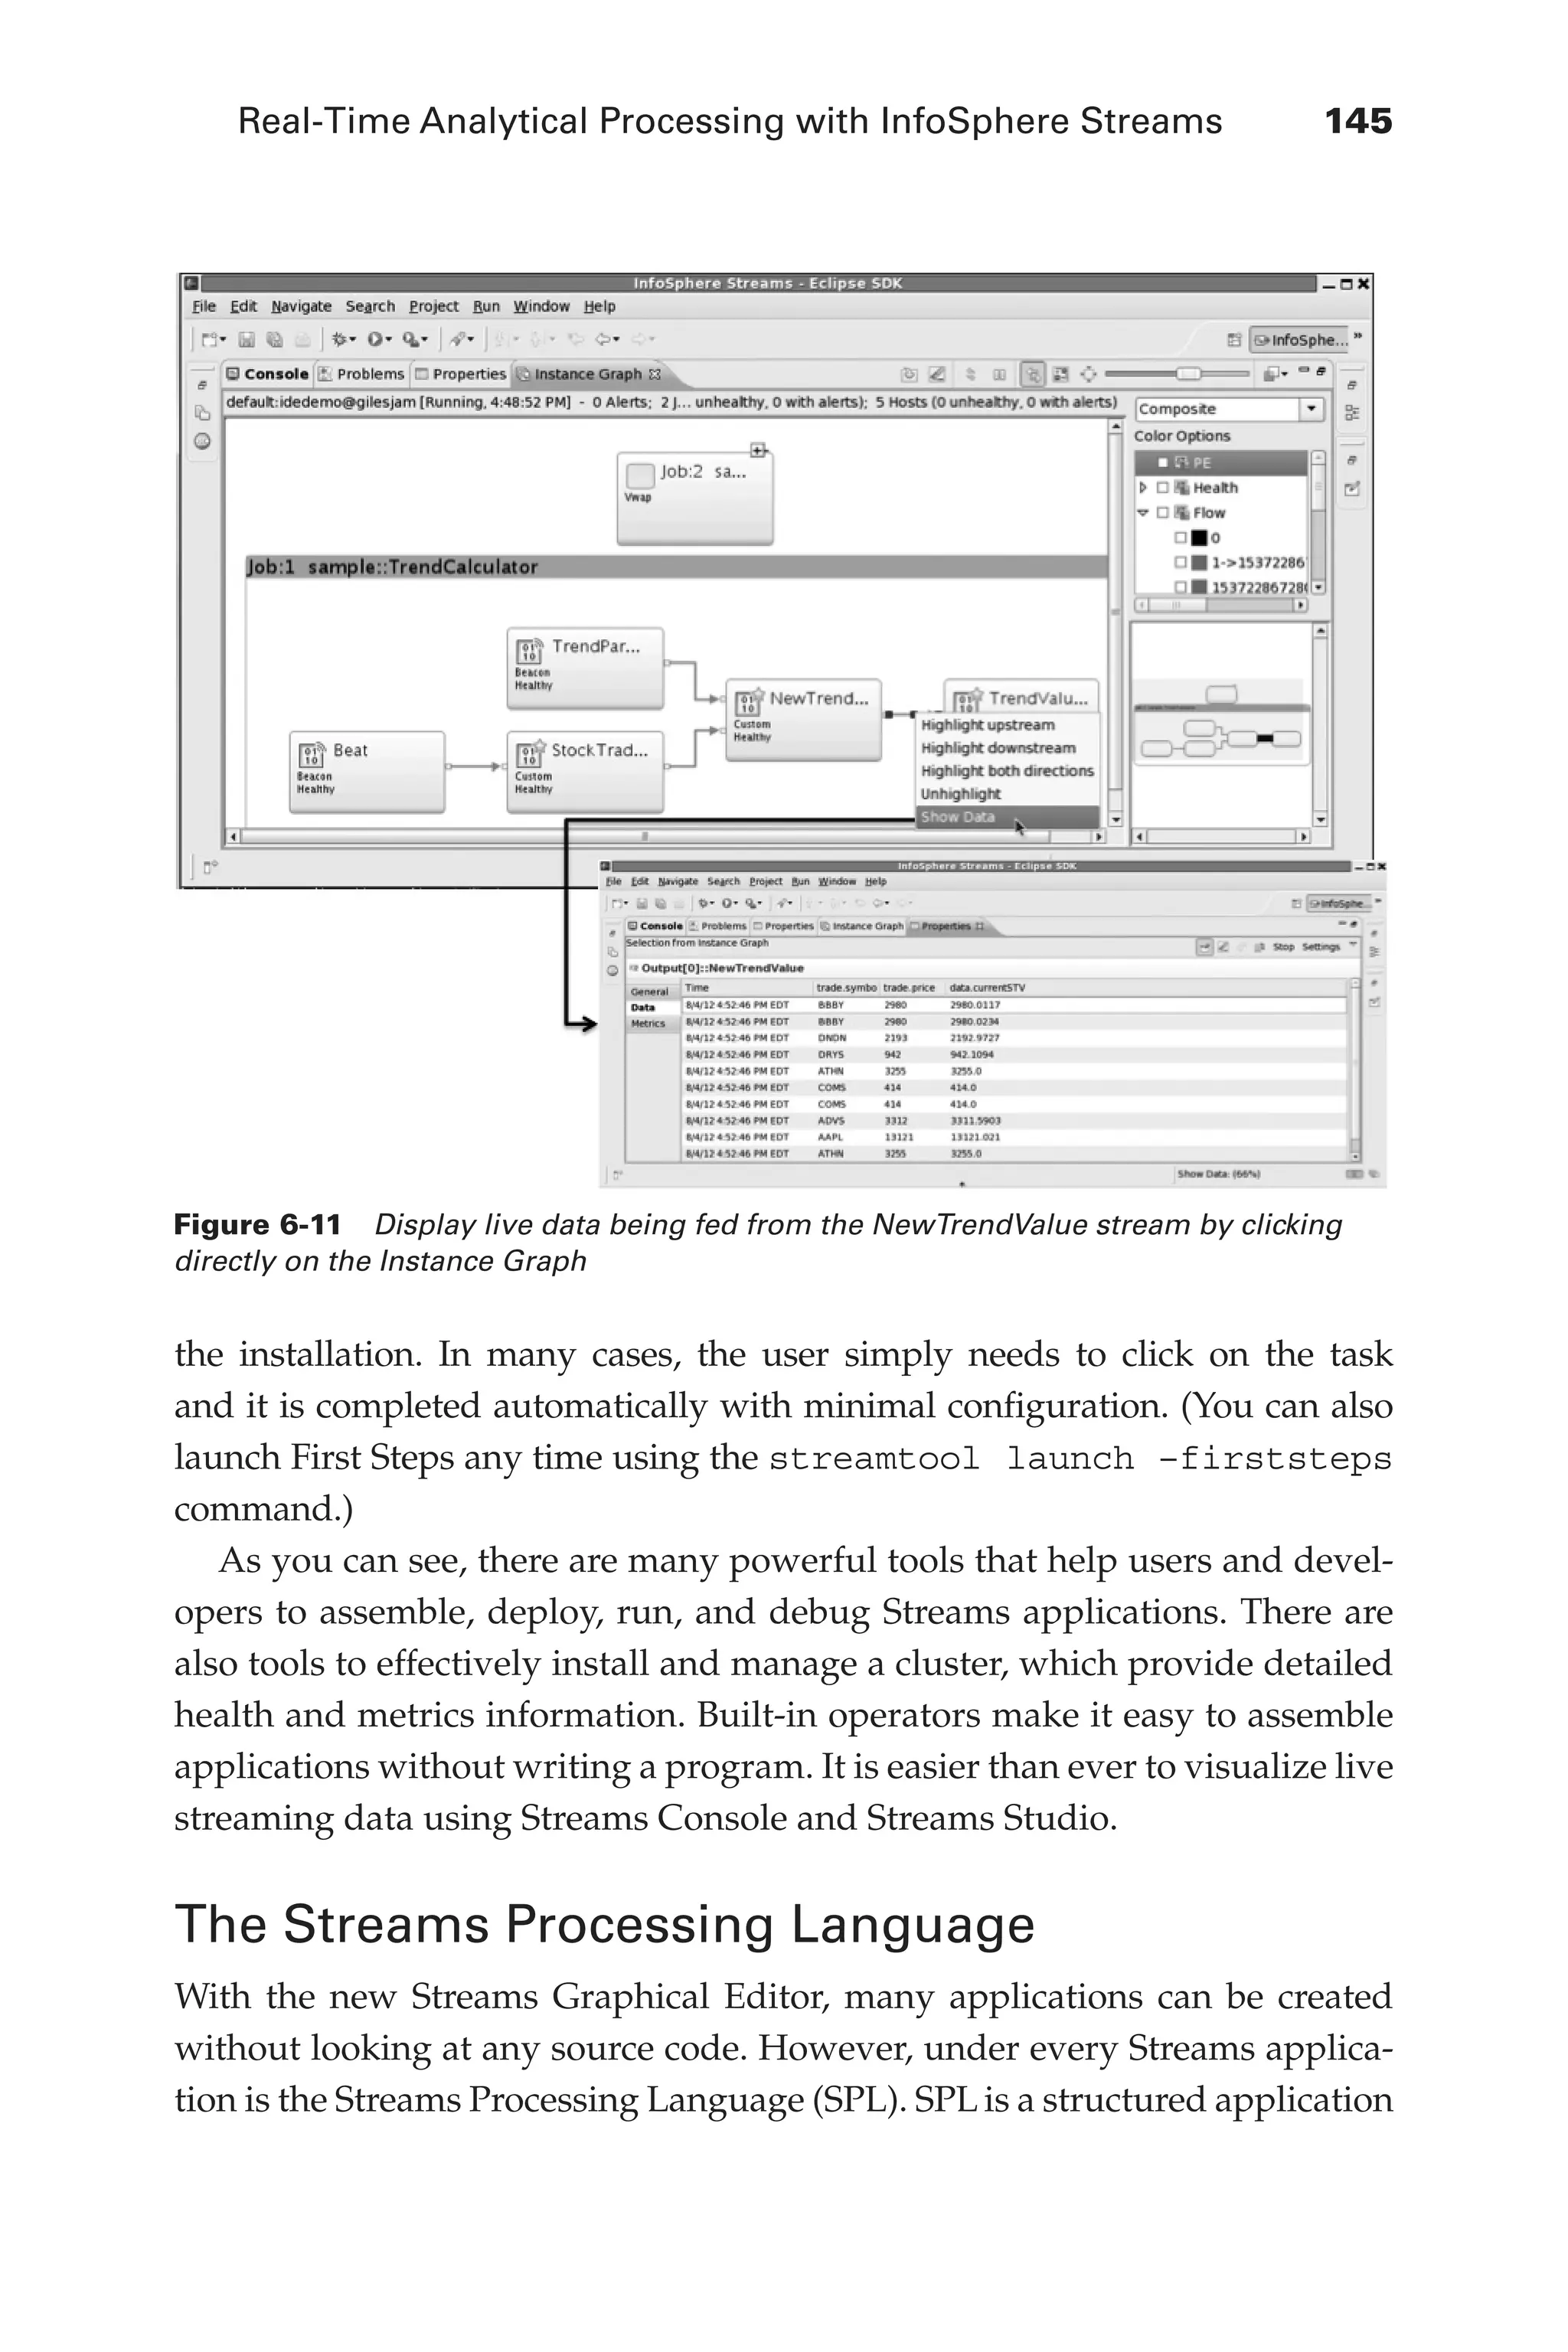
![146 Harness the Power of Big Data: The IBM Big Data Platform
Flash 6X9 / Harness the Power of Big Data:The IBM Big Data Platform / Zikopoulos / 817-5
development language that can be used to build Streams applications. It’s
supported by both the Streams Graphical and the Streams Processing Lan-
guage editors, which are integrated with “round-trip ability” so that it’s pos-
sible to go back and forth between both editors.
SPL is a very powerful declarative language that provides a higher level
of abstraction for building Streams applications than using lower-level
languages or APIs, in the same way that Jaql or Pig makes development
easier for Hadoop compared to writing MapReduce applications directly.
Streams 3.0 introduces a new XML data type and operators to process
XML natively. Source and sink adapters support XML data, XML can be
queried and manipulated with new operators and functions, and Streams
tuples can be converted to and from XML. Additionally, SPL has been
extensively enhanced with new built-in functions and operators; in fact,
one of our partners, Dr. Alex Philp, Founder and CTO of TerraEchos, Inc.,
noted that their developers can “deliver applications 45 percent faster due
to the agility of [the] Streams Processing Language.” We think that Bó
Thide, a professor at Sweden’s top-ranked Uppsala University, said it best
when referring to SPL: “Streams allows me to again be a Space Physicist
instead of a Computer Scientist.” After all, technology is great, but if you
can’t quickly apply it to the business need at hand, what’s the point?
Streams-based applications built with the Streams Graphical Editor or
written in SPL are compiled using the Streams compiler, which turns them
into binary (bin) executable code—this executable code runs in the Streams
environment to accomplish tasks on the various servers in the cluster. An
SPL program is a text-based representation of the graph that we discussed in
the preceding section: It defines the sources, sinks, and operators, as well as
the way in which they are interconnected with a stream. For example, the
following SPL code reads data from a file line by line into tuples, converts
each line to uppercase, and then writes each line to standard output.
composite toUpper {
graph
stream<rstring line> LineStream = FileSource() {
param file : "input_file";
format : line;
}
stream<LineStream> upperedTxt = Functor(LineStream) {
06-ch06.indd 146 04/10/12 11:37 AM](https://image.slidesharecdn.com/imm14100usen-130426053301-phpapp01/75/Harness-the-power-of-Big-Data-177-2048.jpg)
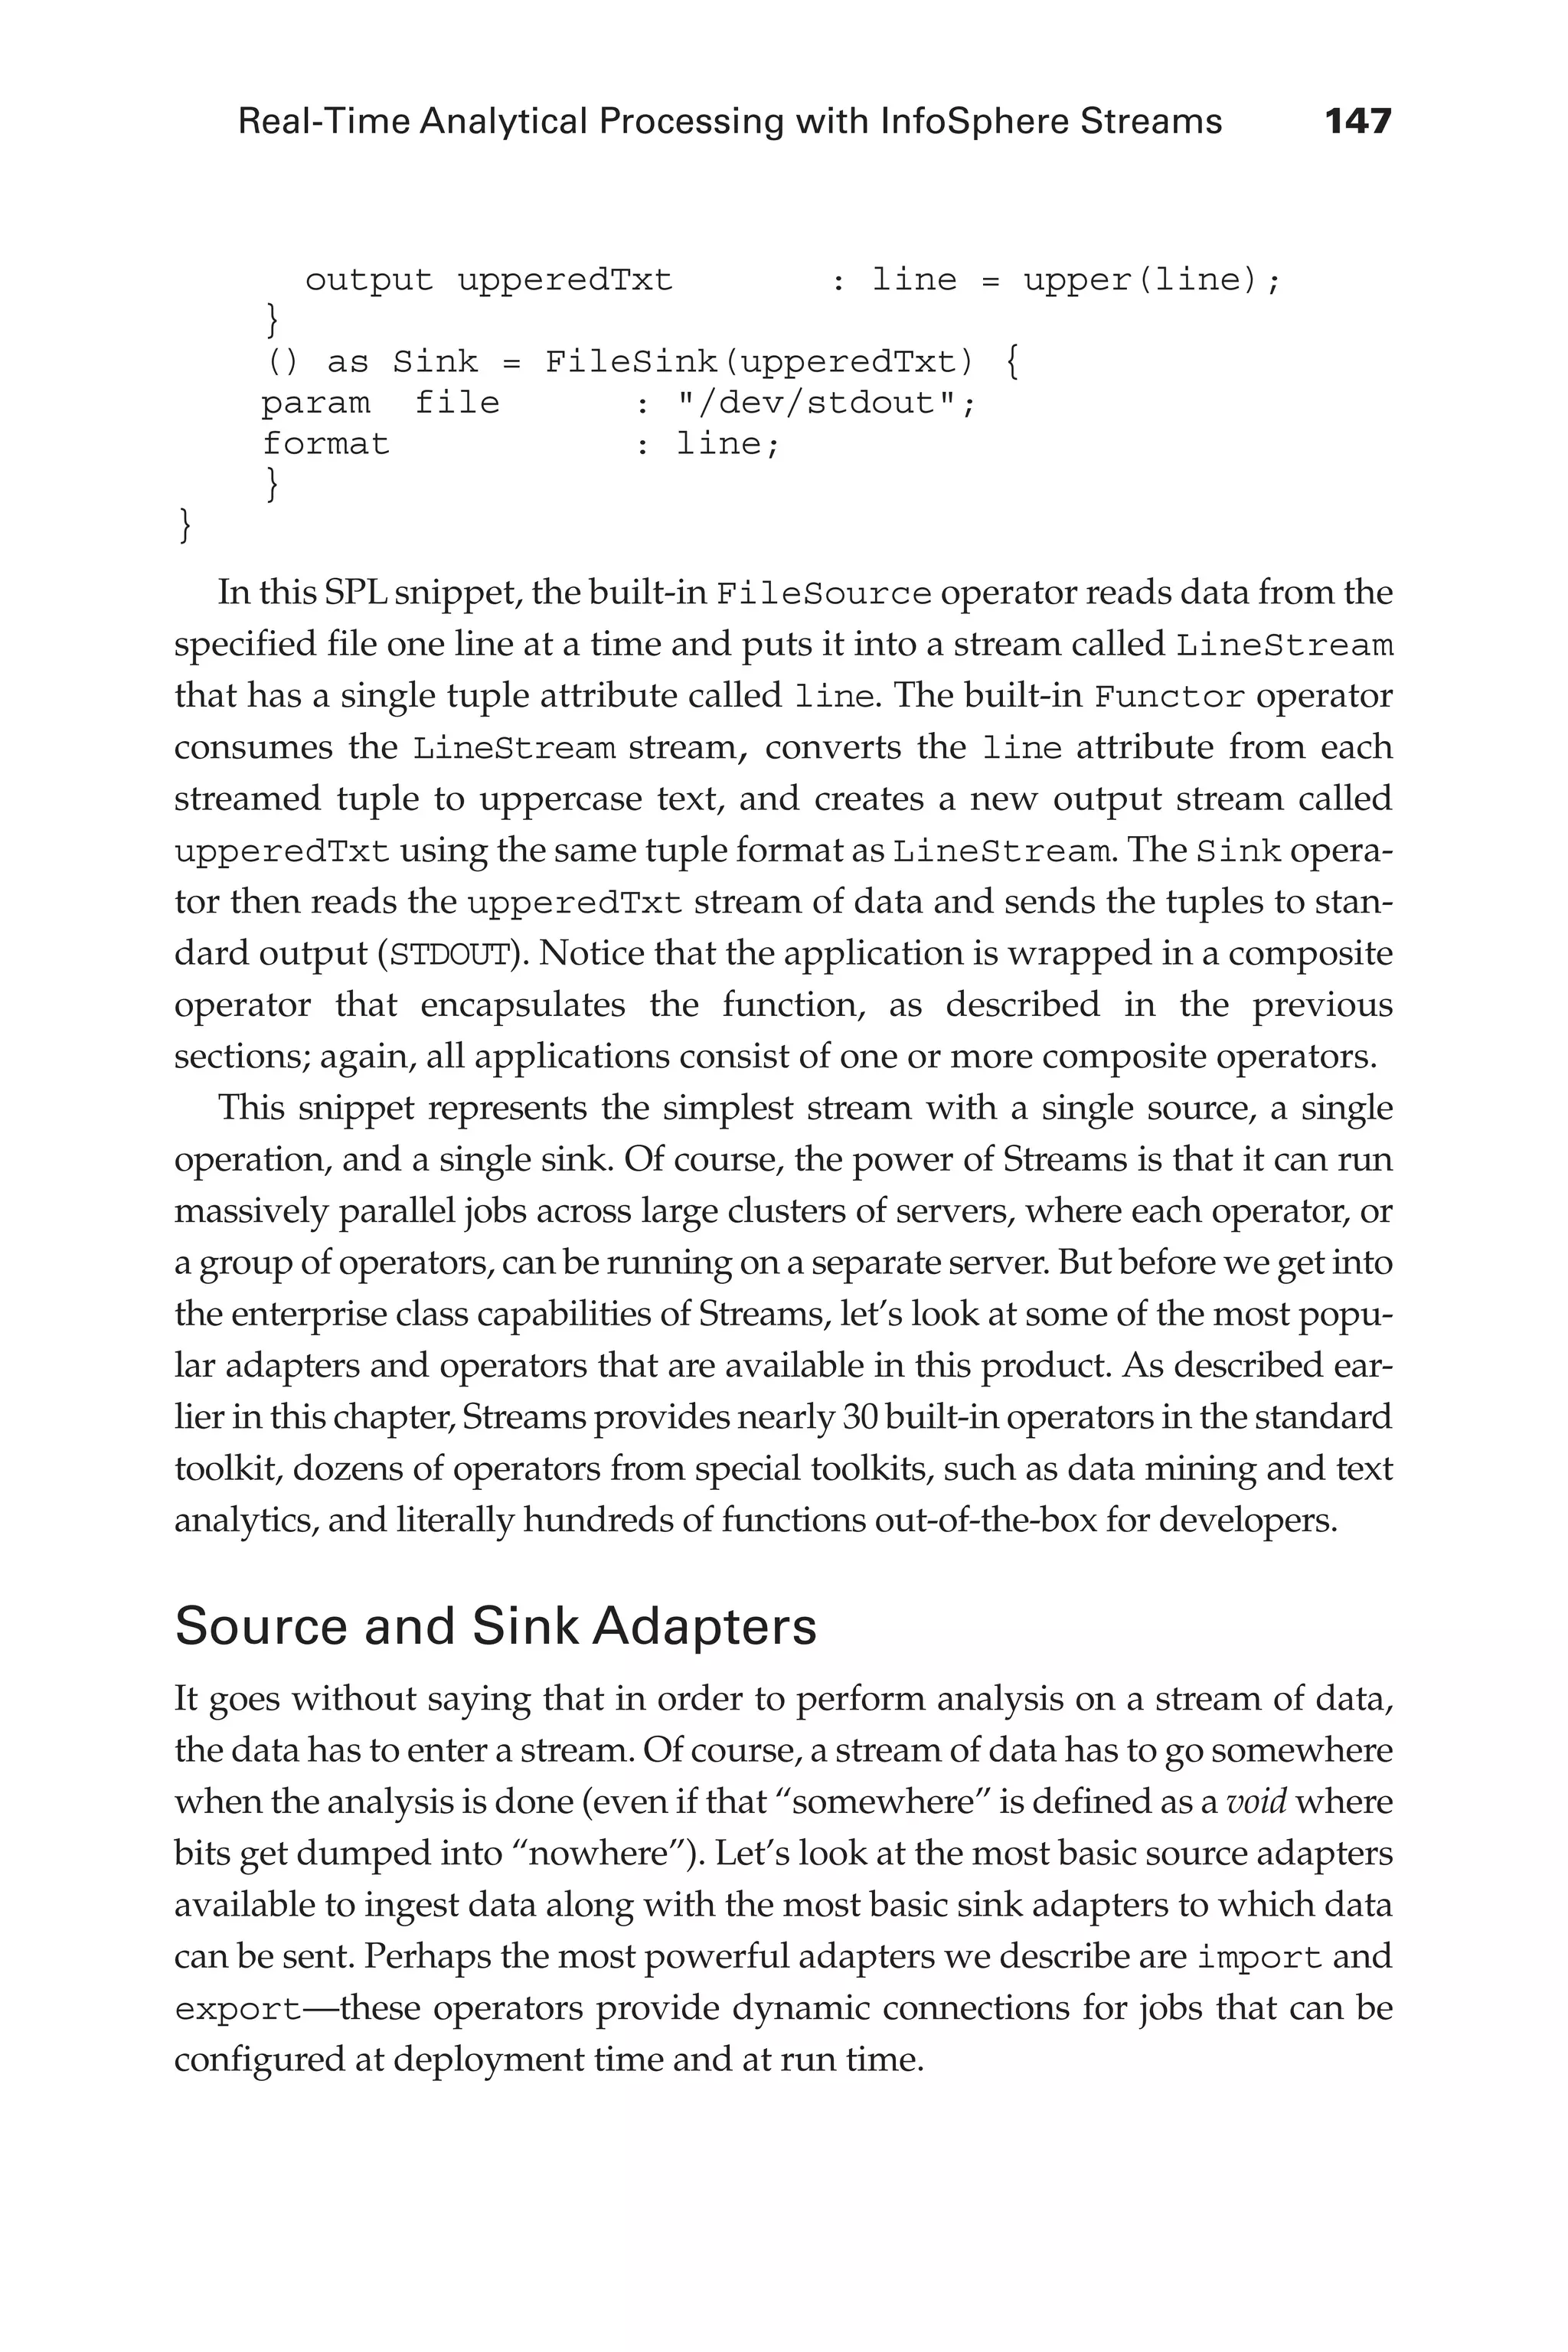
![150 Harness the Power of Big Data: The IBM Big Data Platform
Flash 6X9 / Harness the Power of Big Data:The IBM Big Data Platform / Zikopoulos / 817-5
Filter
The filter operator is similar to a filter in an actual water stream, or in
your furnace or car: its purpose is to allow only some of the streaming con-
tents to pass. A Streams filter operator removes tuples from a data stream
based on a user-defined condition specified as a parameter to the operator.
After you’ve programmatically specified a condition, the first output port
defined in the operator will receive any tuples that satisfy that condition. You
can optionally specify a second output port to receive any tuples that did not
satisfy the specified condition. (If you’re familiar with extract, transform, and
load [ETL] flows, this is similar to a match and discard operation.)
Functor
The functor operator reads from an input stream, transforms tuples in flex-
ible ways, and sends new tuples to an output stream. The transformations
can manipulate any of the elements in the stream. For example, you could
extract a data element out of a stream and output the running total of that
element for every tuple that comes through a specific functor operator.
Punctor
The punctor operator adds punctuation into the stream, which can then be
used downstream to separate the stream into multiple windows. For exam-
ple, suppose a stream reads a contact directory listing and processes the data
flowing through that stream. You can keep a running count of last names in
the contact directory by using the punctor operator to add a punctuation
mark into the stream any time your application observes a changed last name
in the stream. You could then use this punctuation mark downstream in an
aggregation functor operator to send out the running total for that name,
later resetting the count back to 0 to start counting the next set of last names.
Sort
The sort operator outputs the tuples that it receives, but in a specified sorted
order. This operator uses a stream window specification. Think about it for a
moment: If a stream represents a constant flow of data, how can you sort that
data? You don’t know whether the next tuple to arrive will need to be sorted
with the first tuple to be sent as output. To overcome this issue, Streams
enables you to specify a window on which to operate. You can specify a win-
dow of tuples in the following ways:
06-ch06.indd 150 04/10/12 11:37 AM](https://image.slidesharecdn.com/imm14100usen-130426053301-phpapp01/75/Harness-the-power-of-Big-Data-181-2048.jpg)

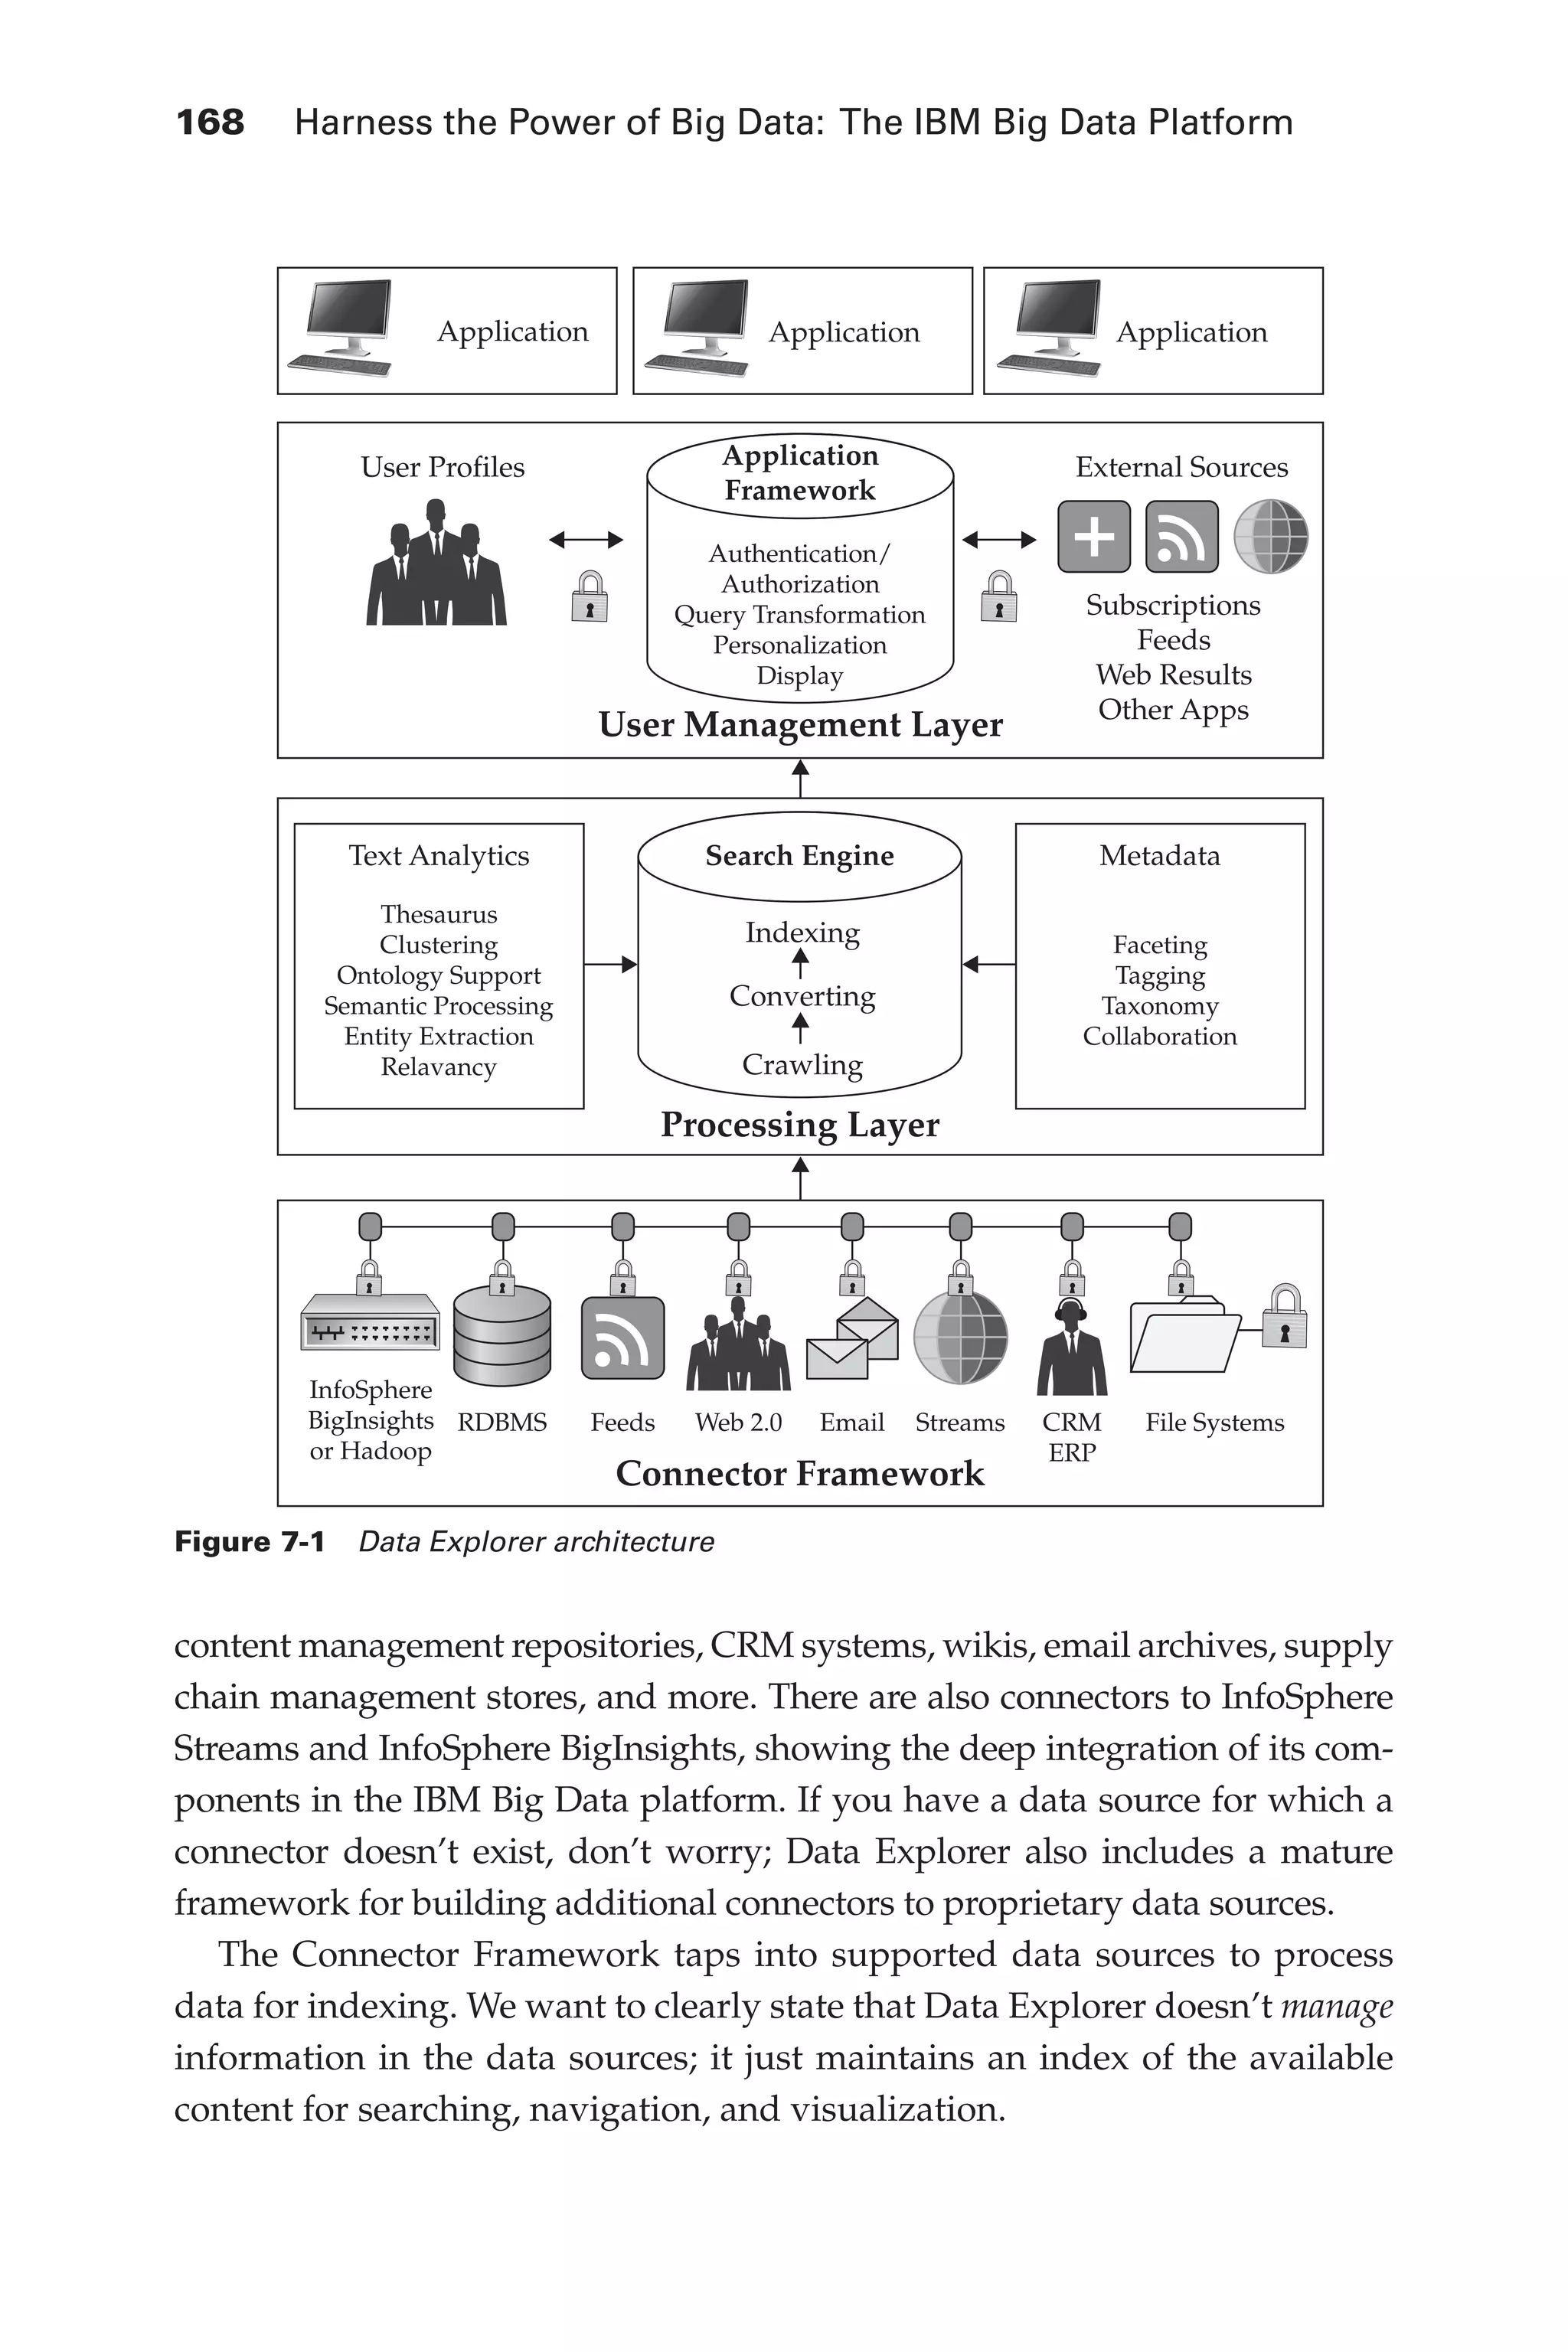
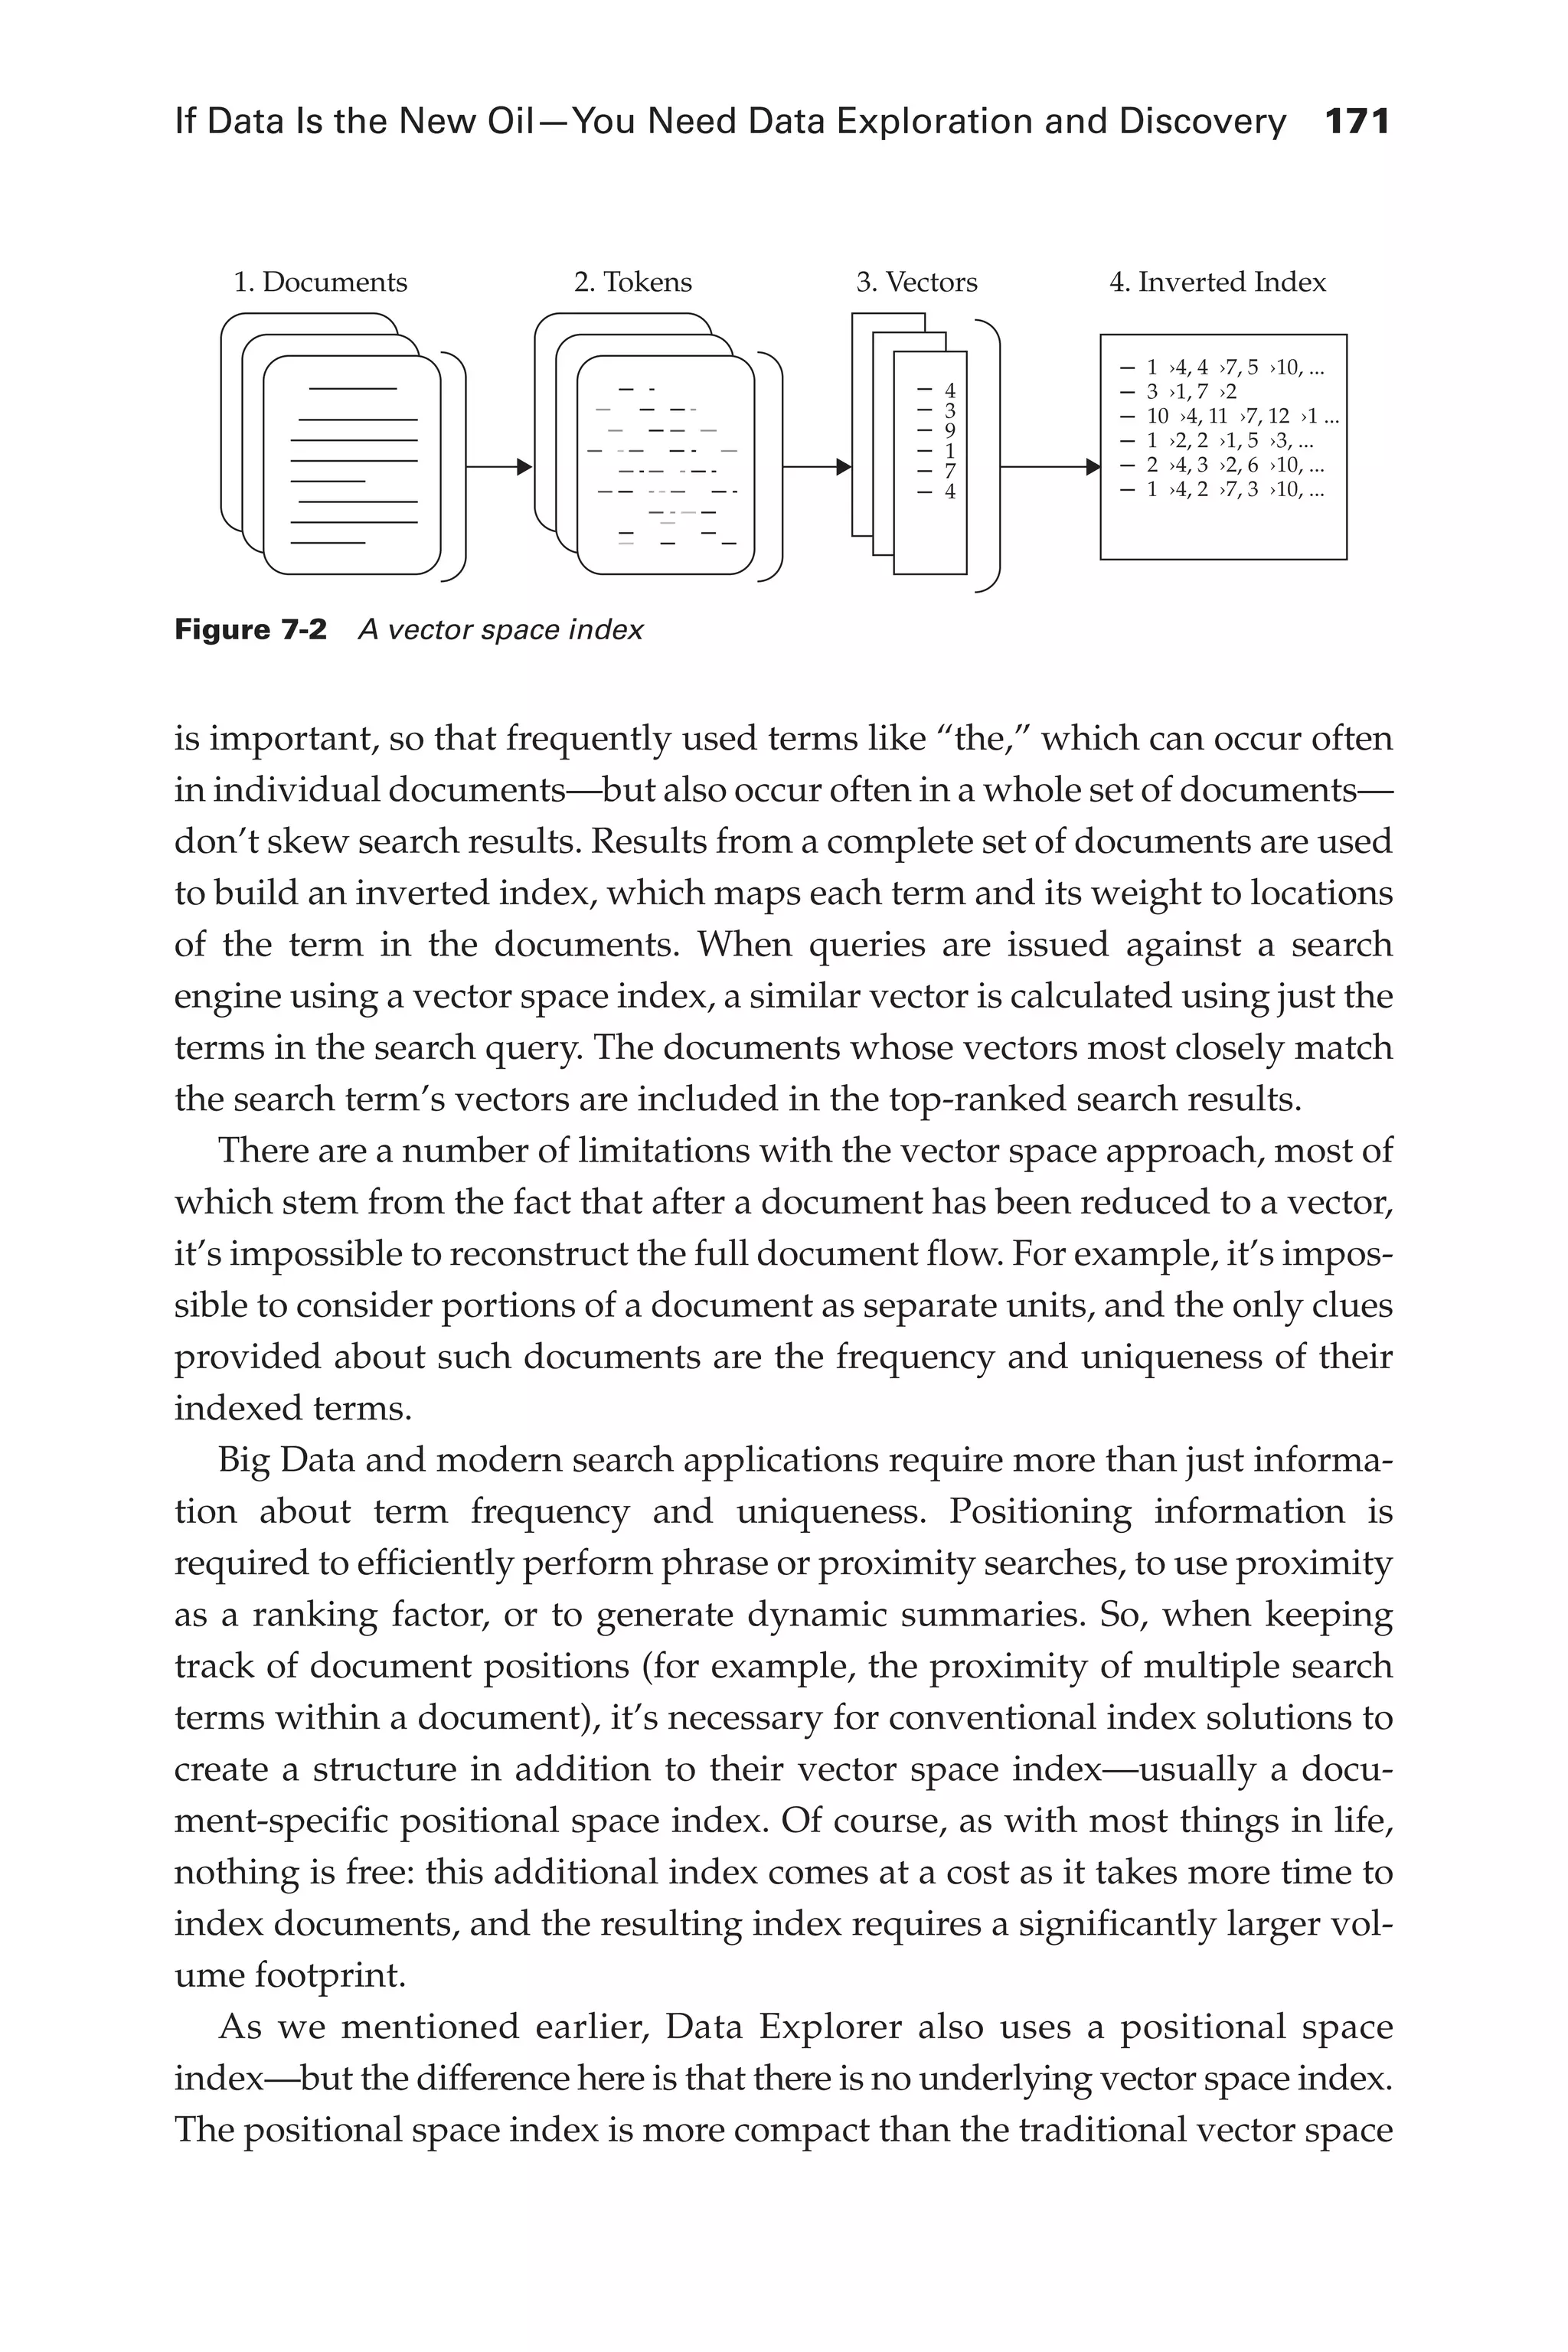
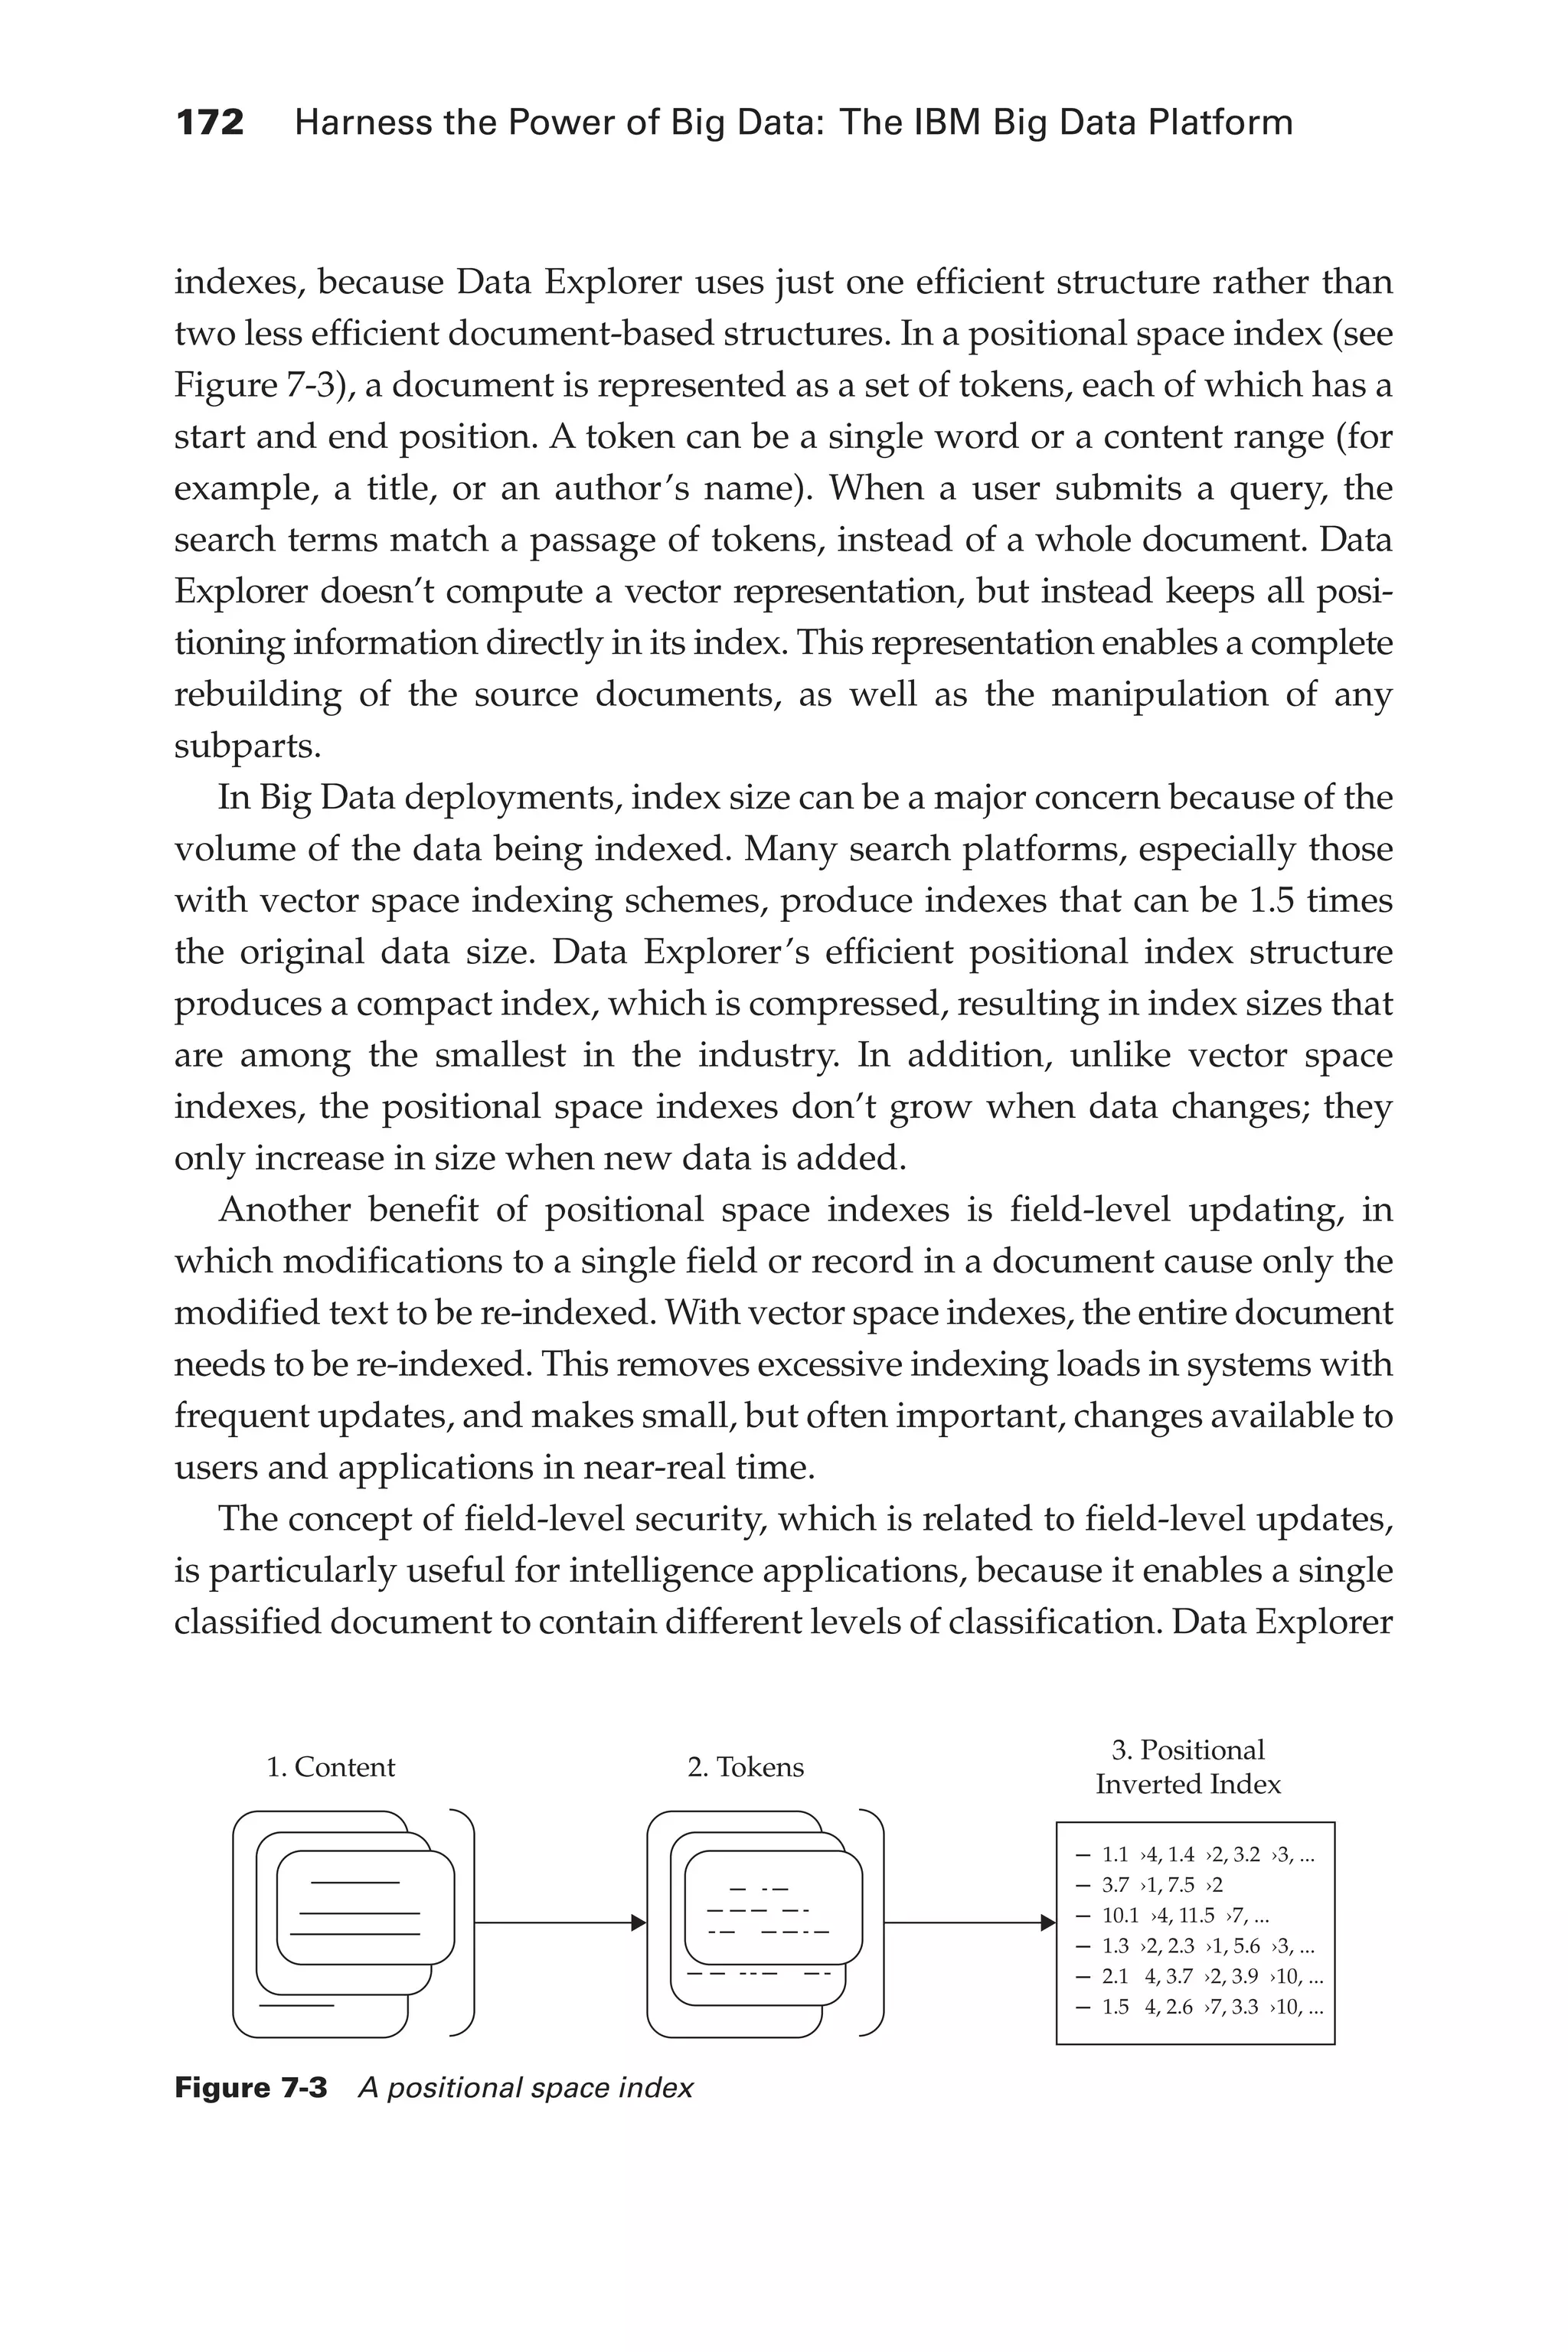
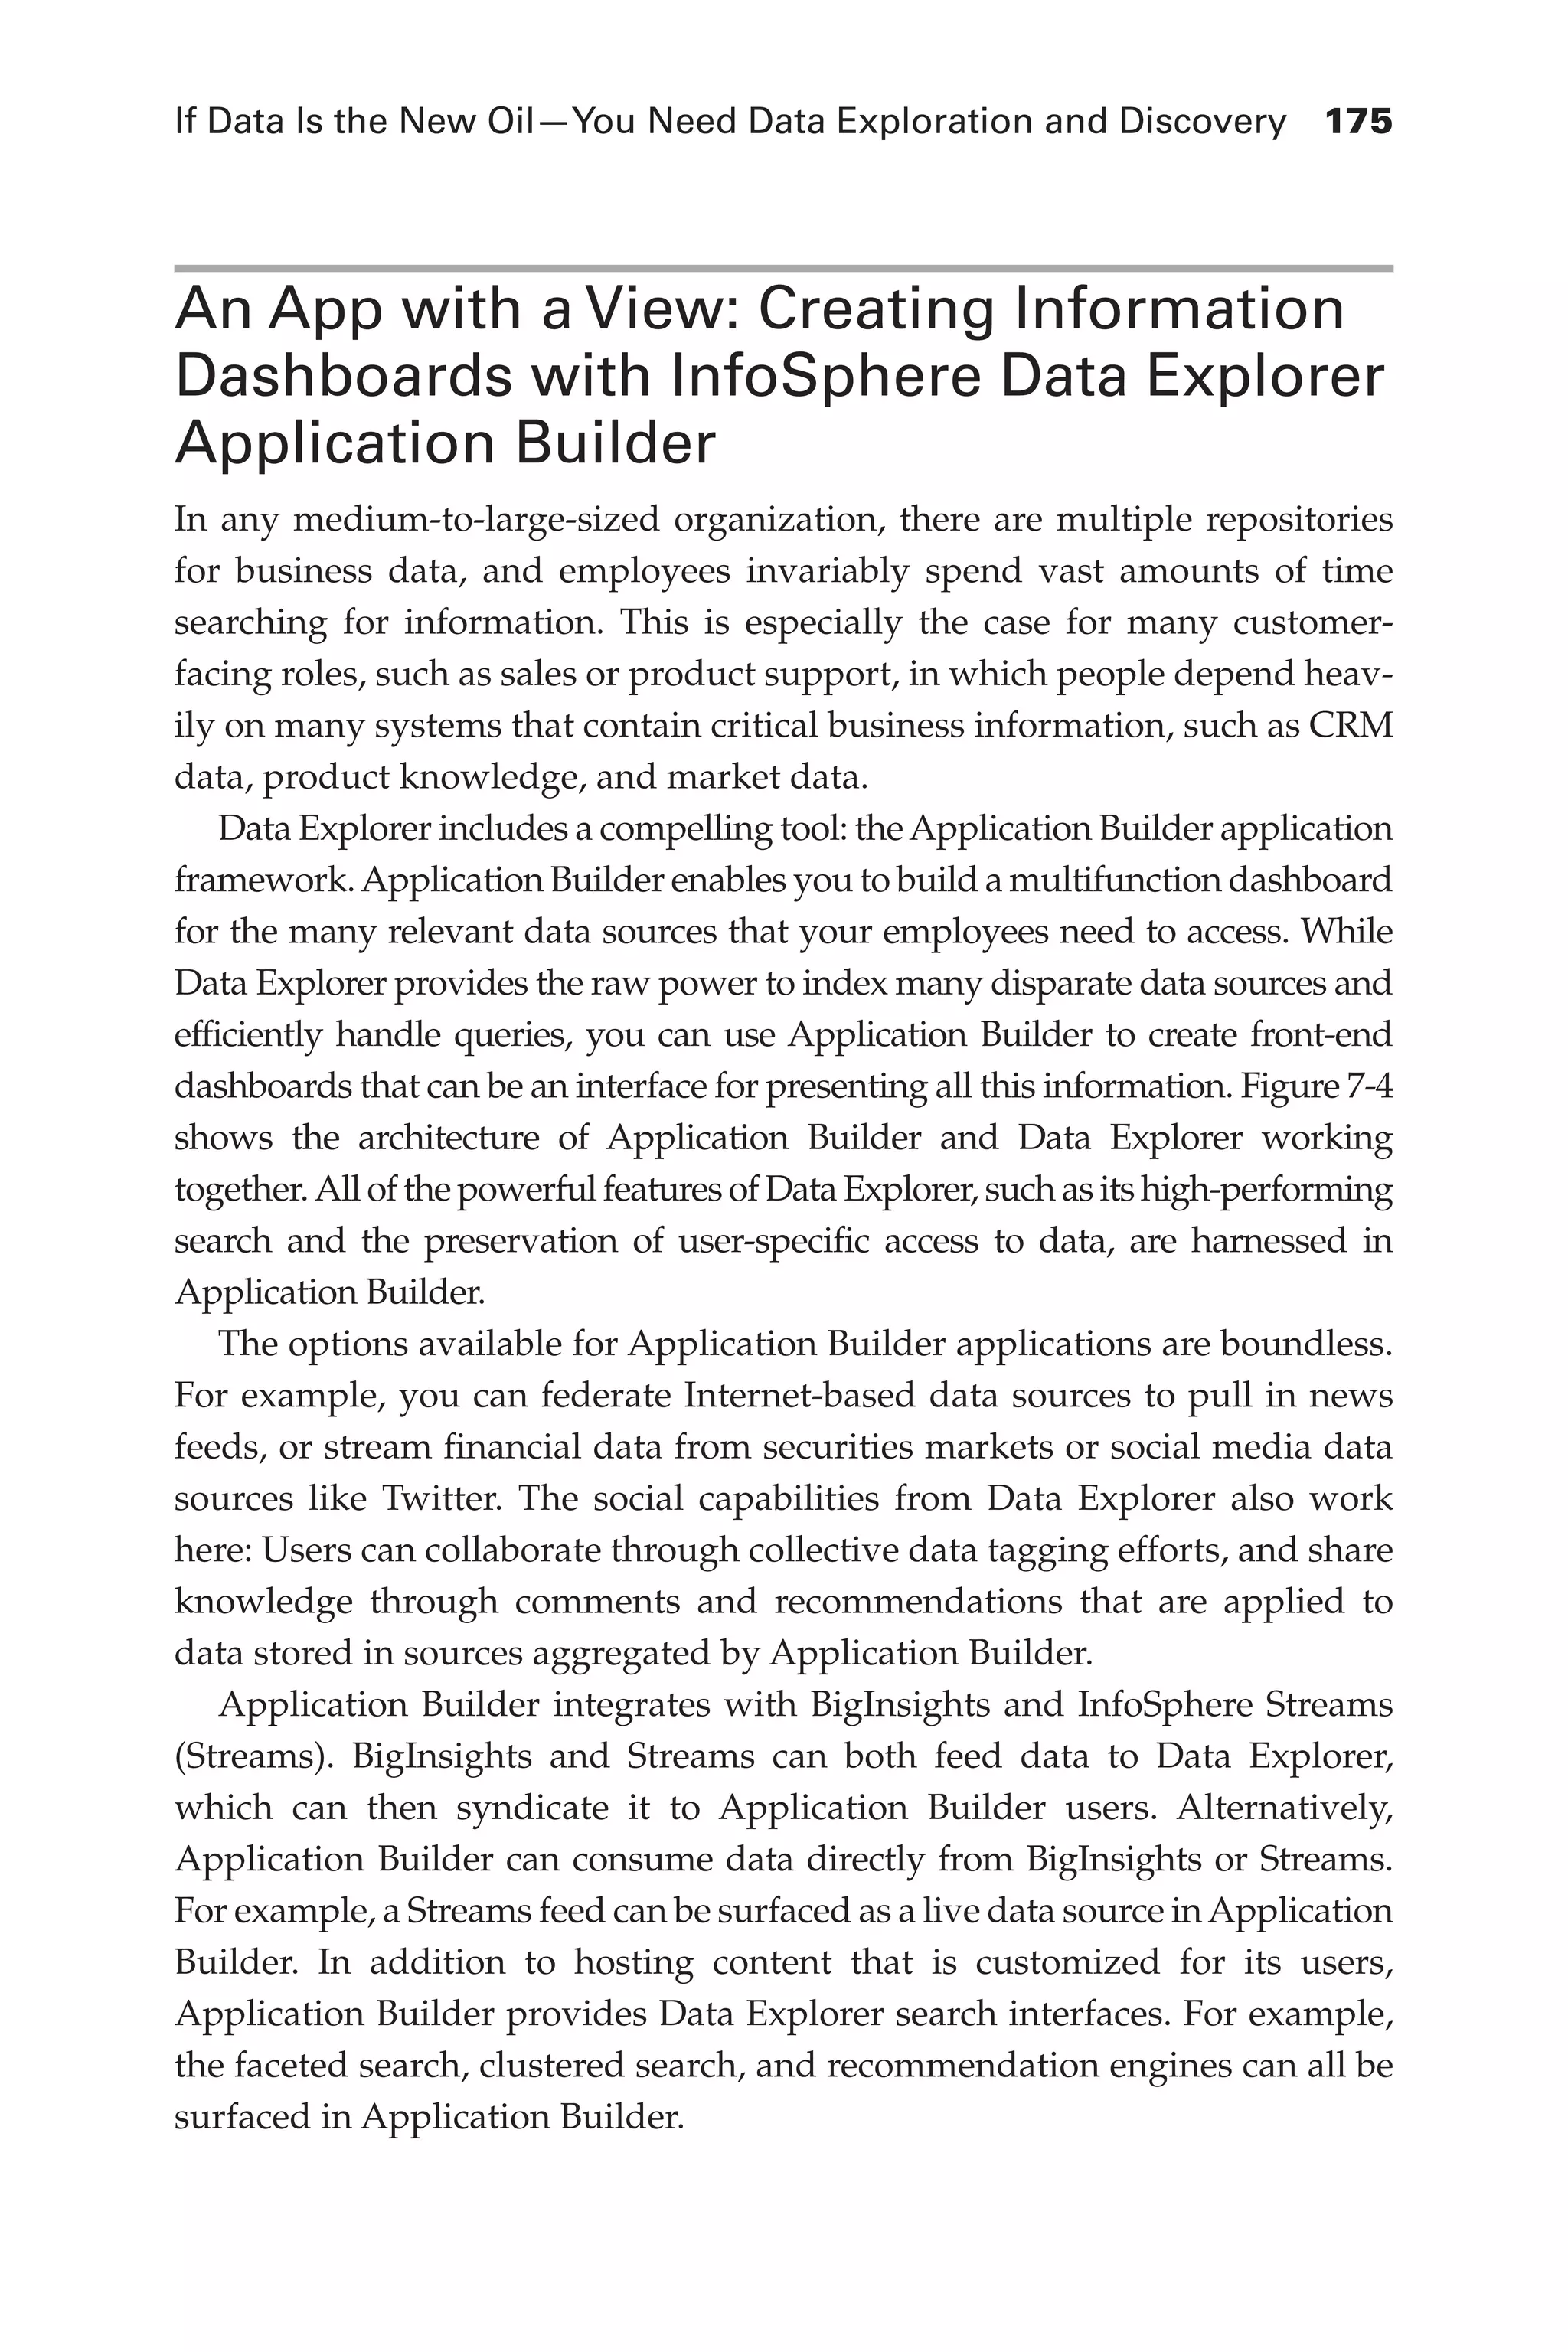
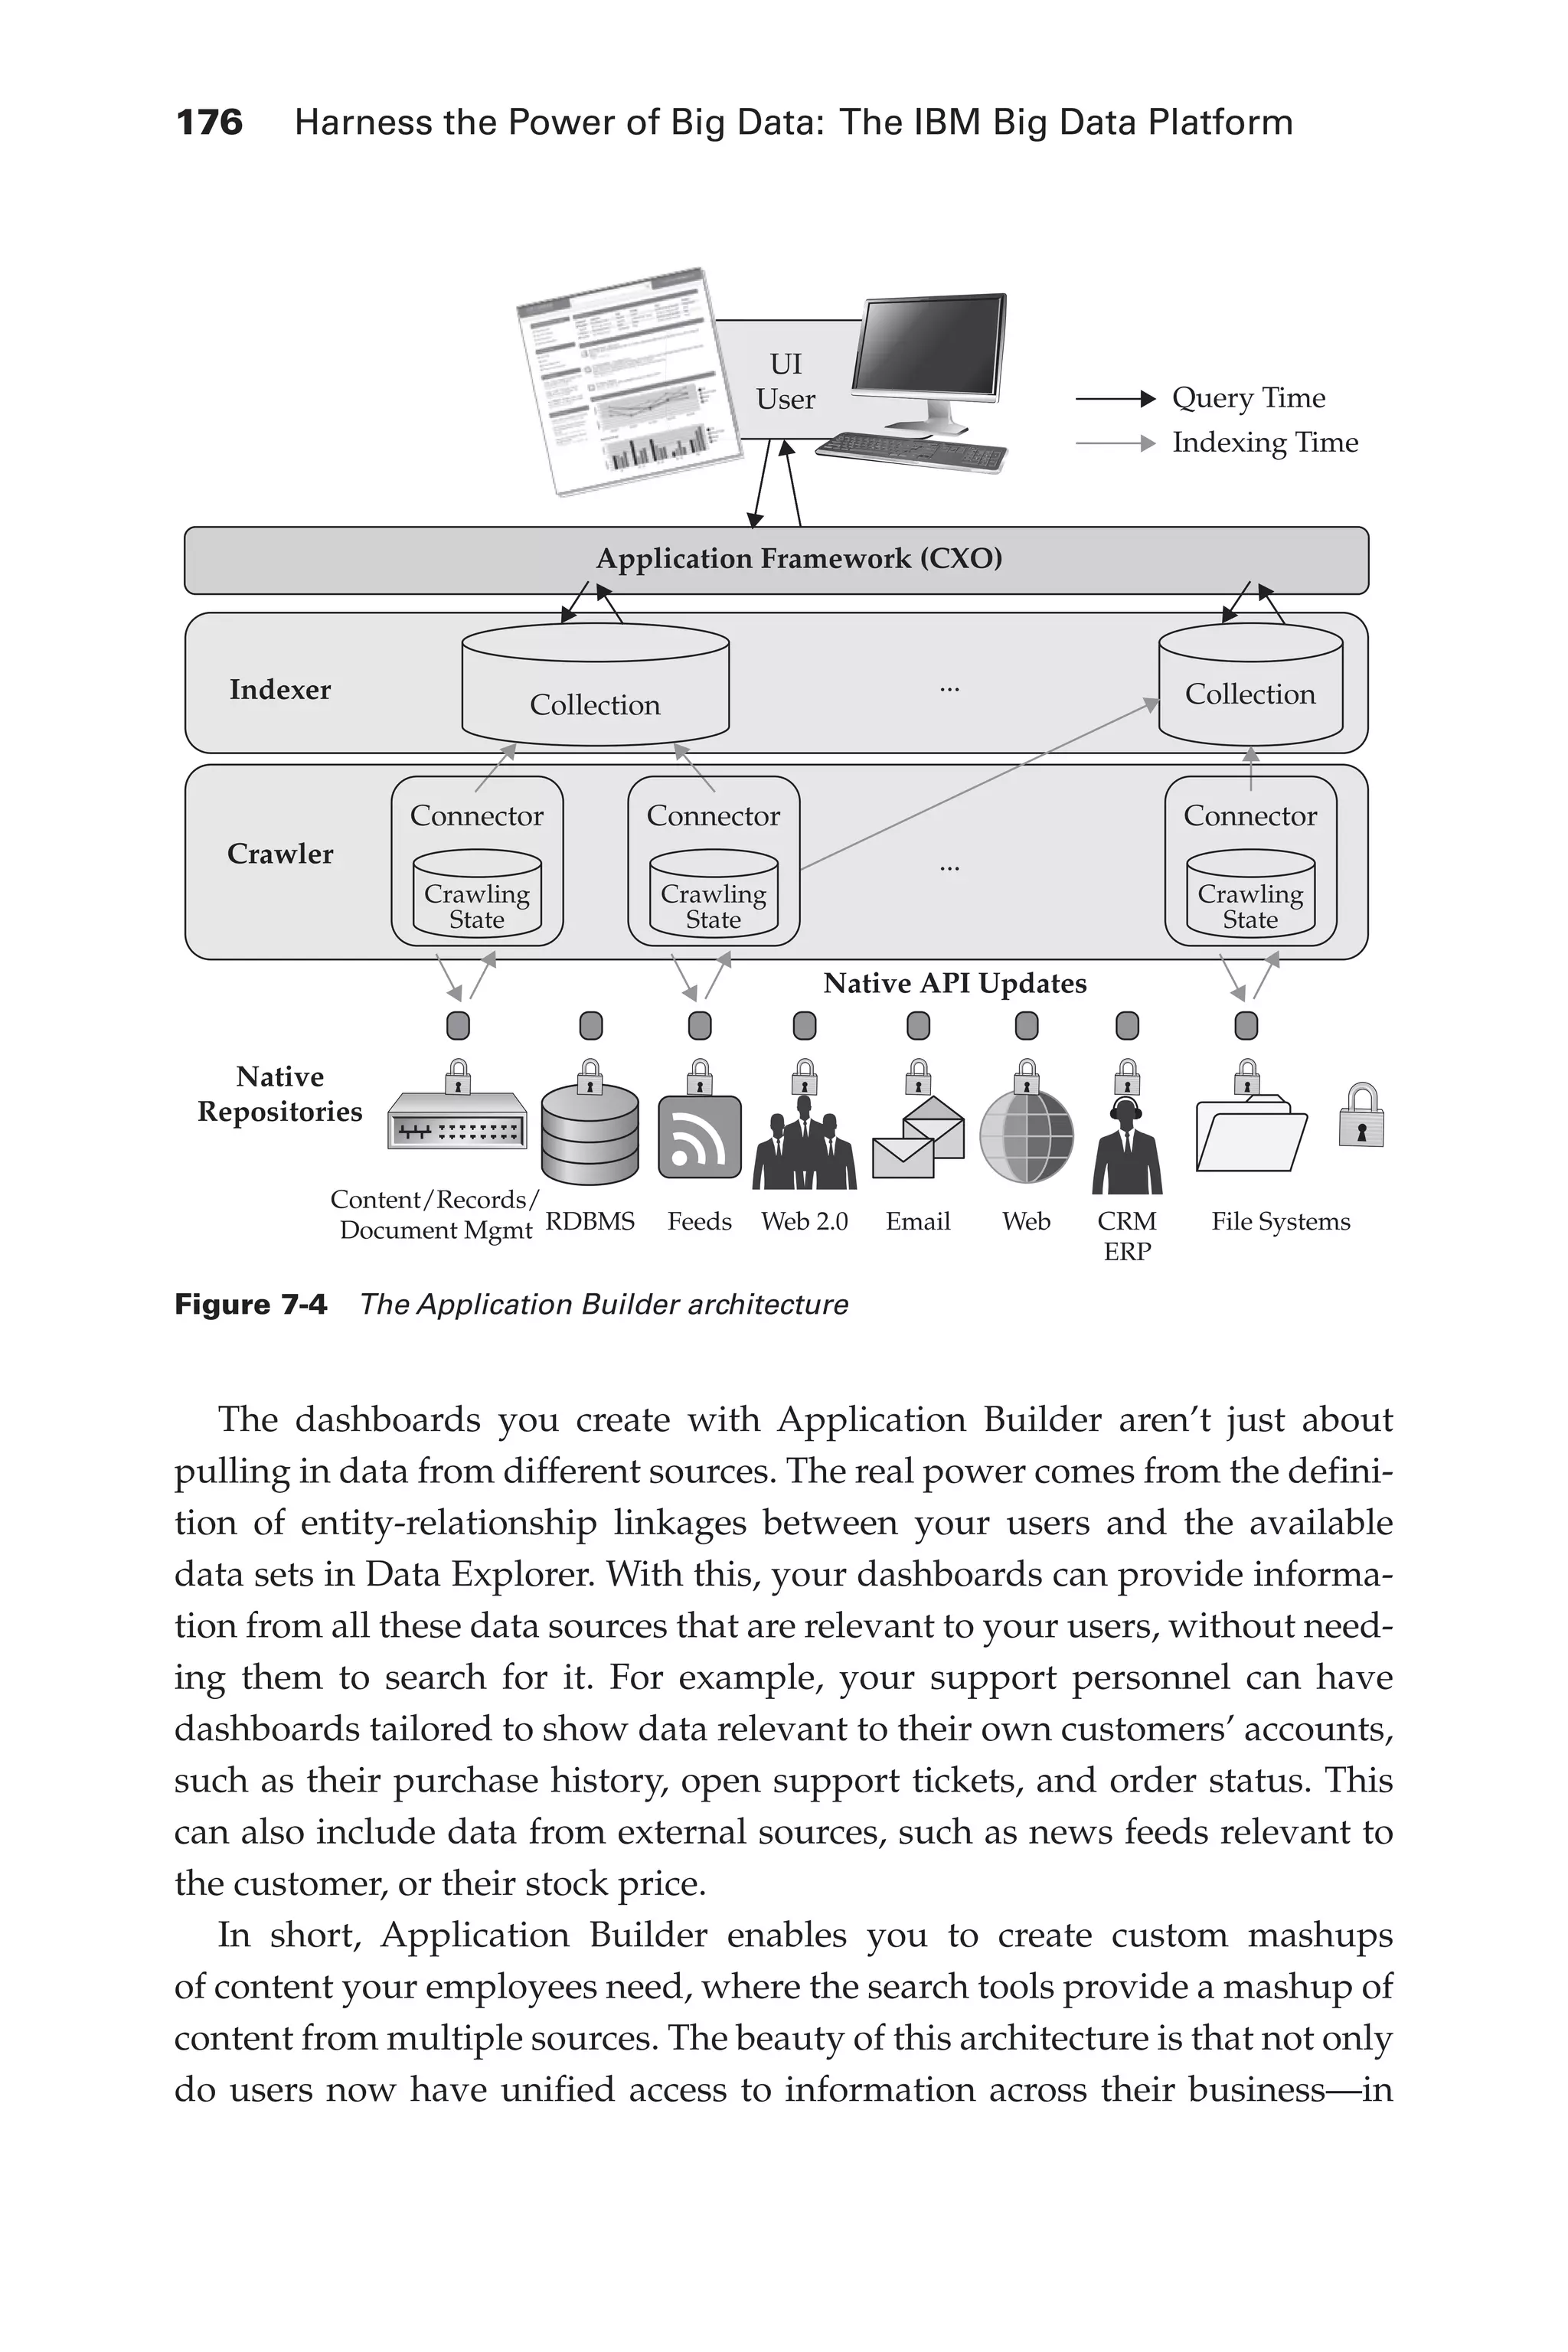


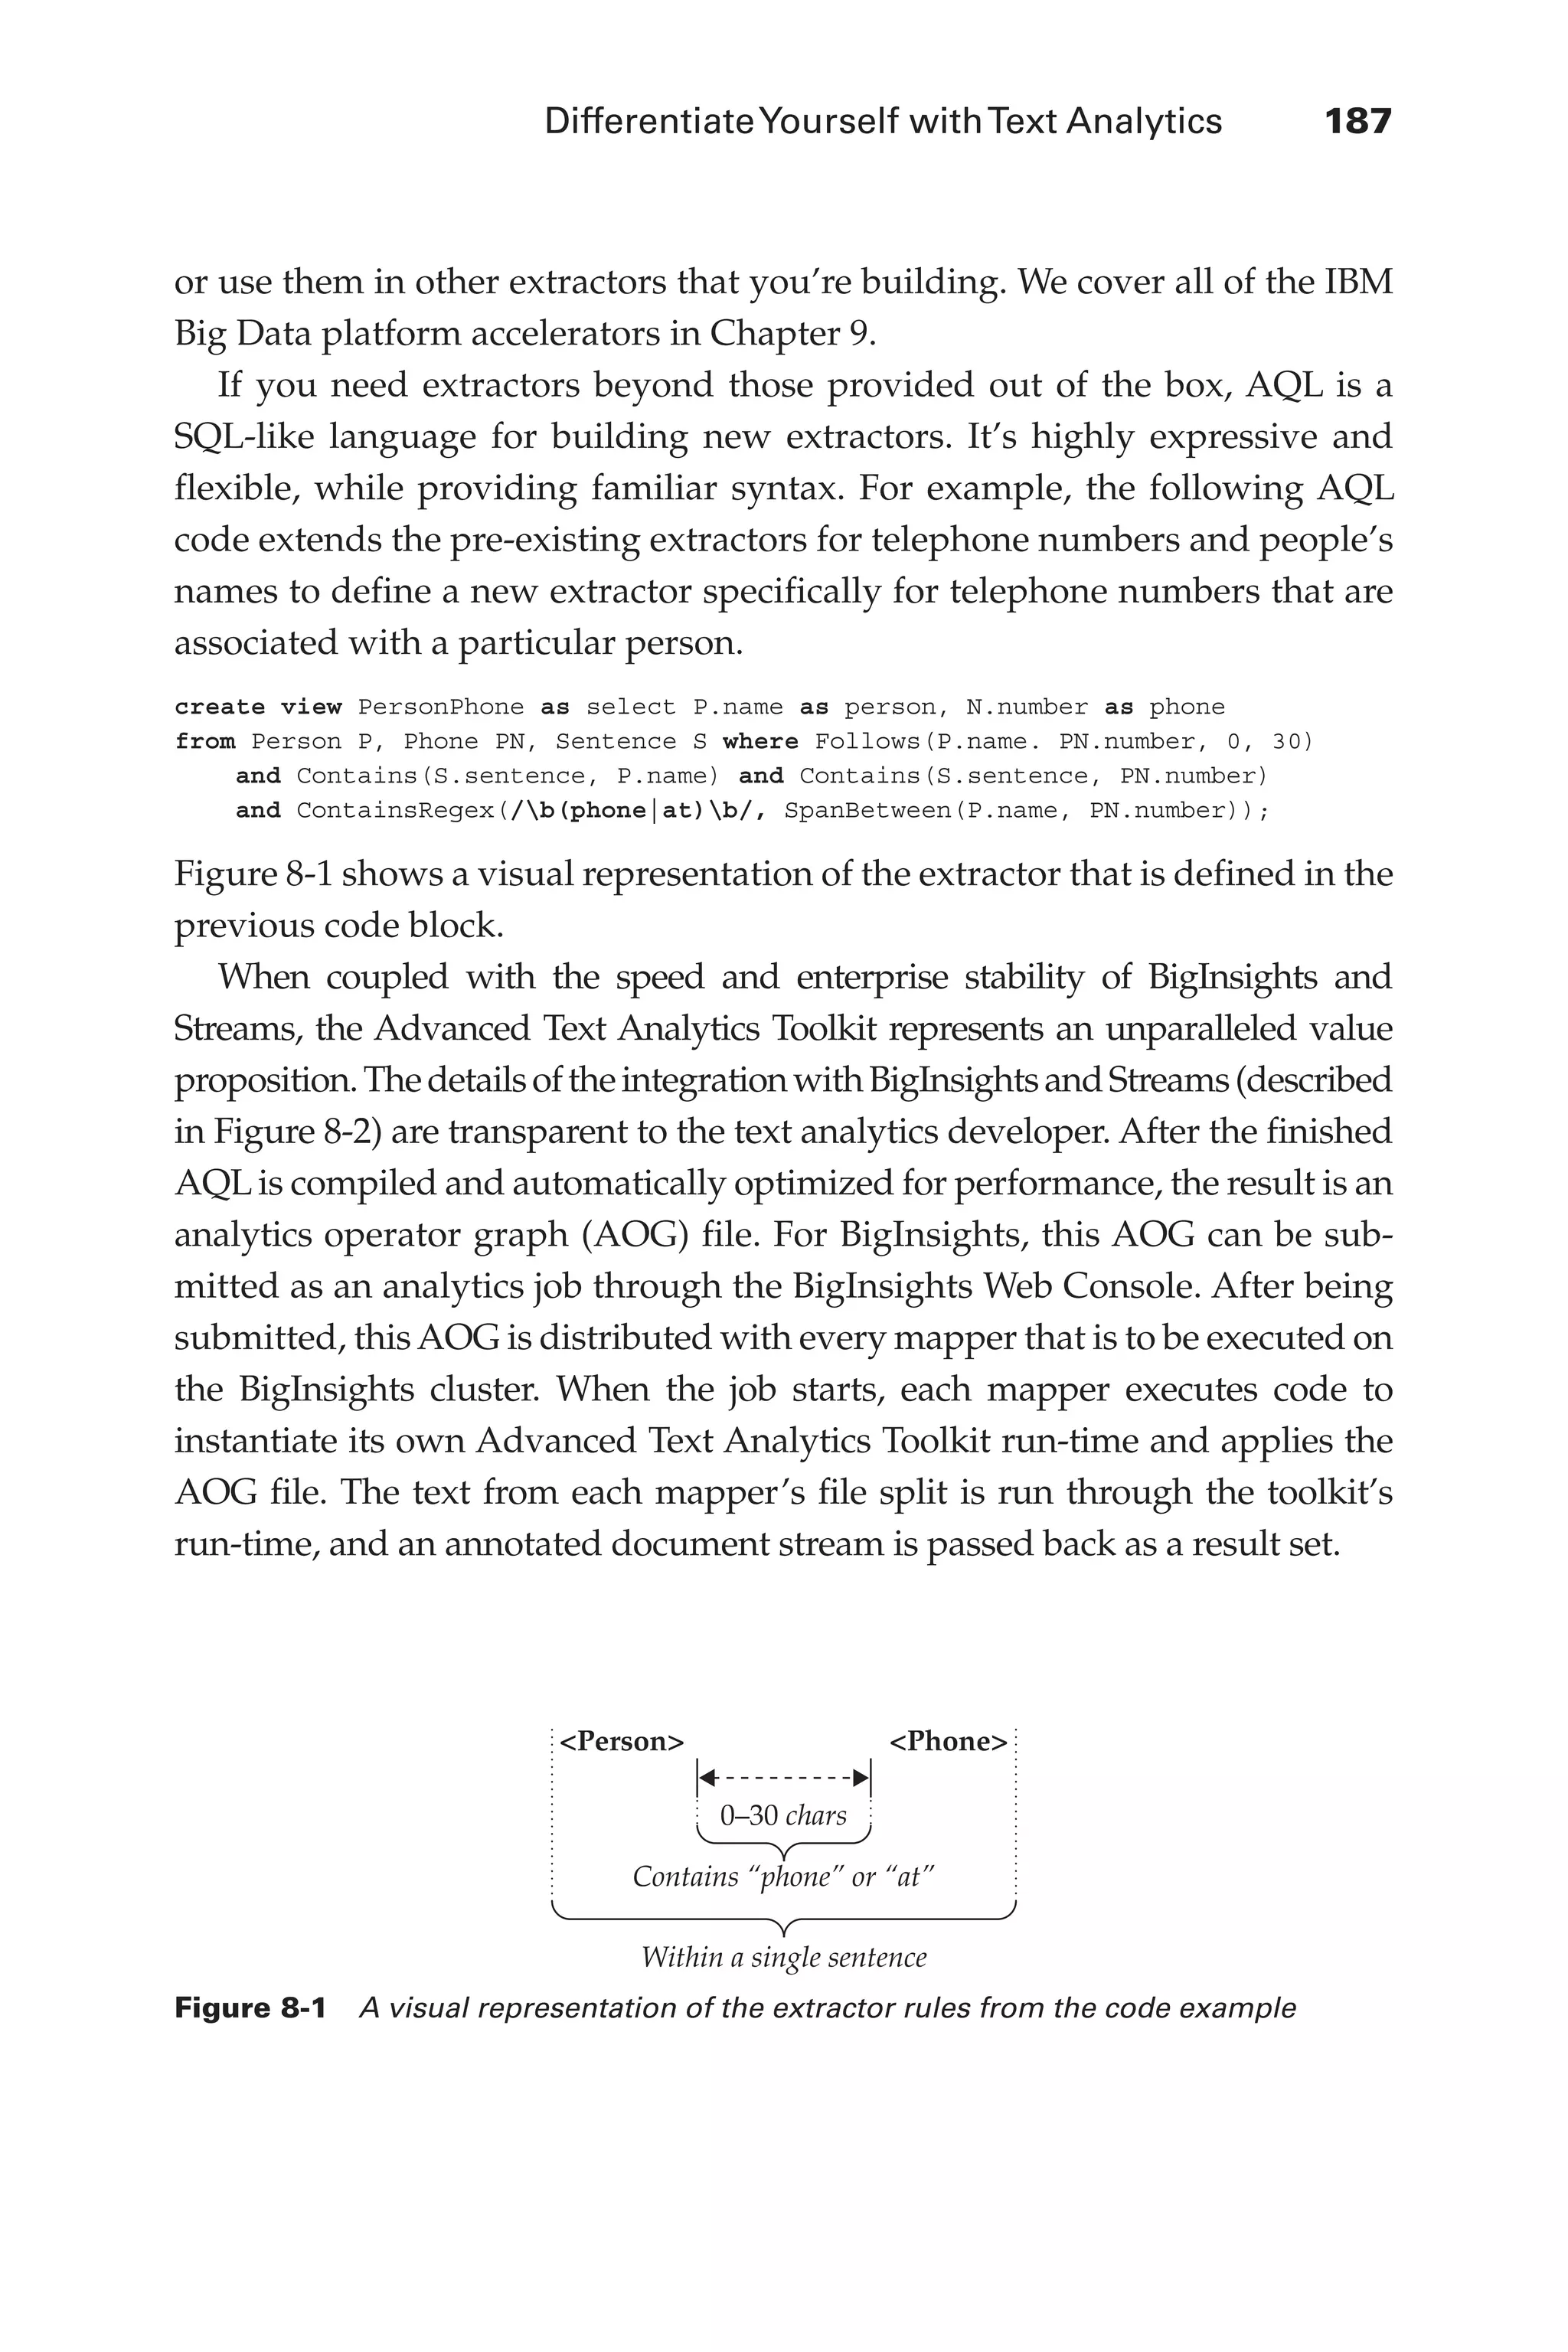
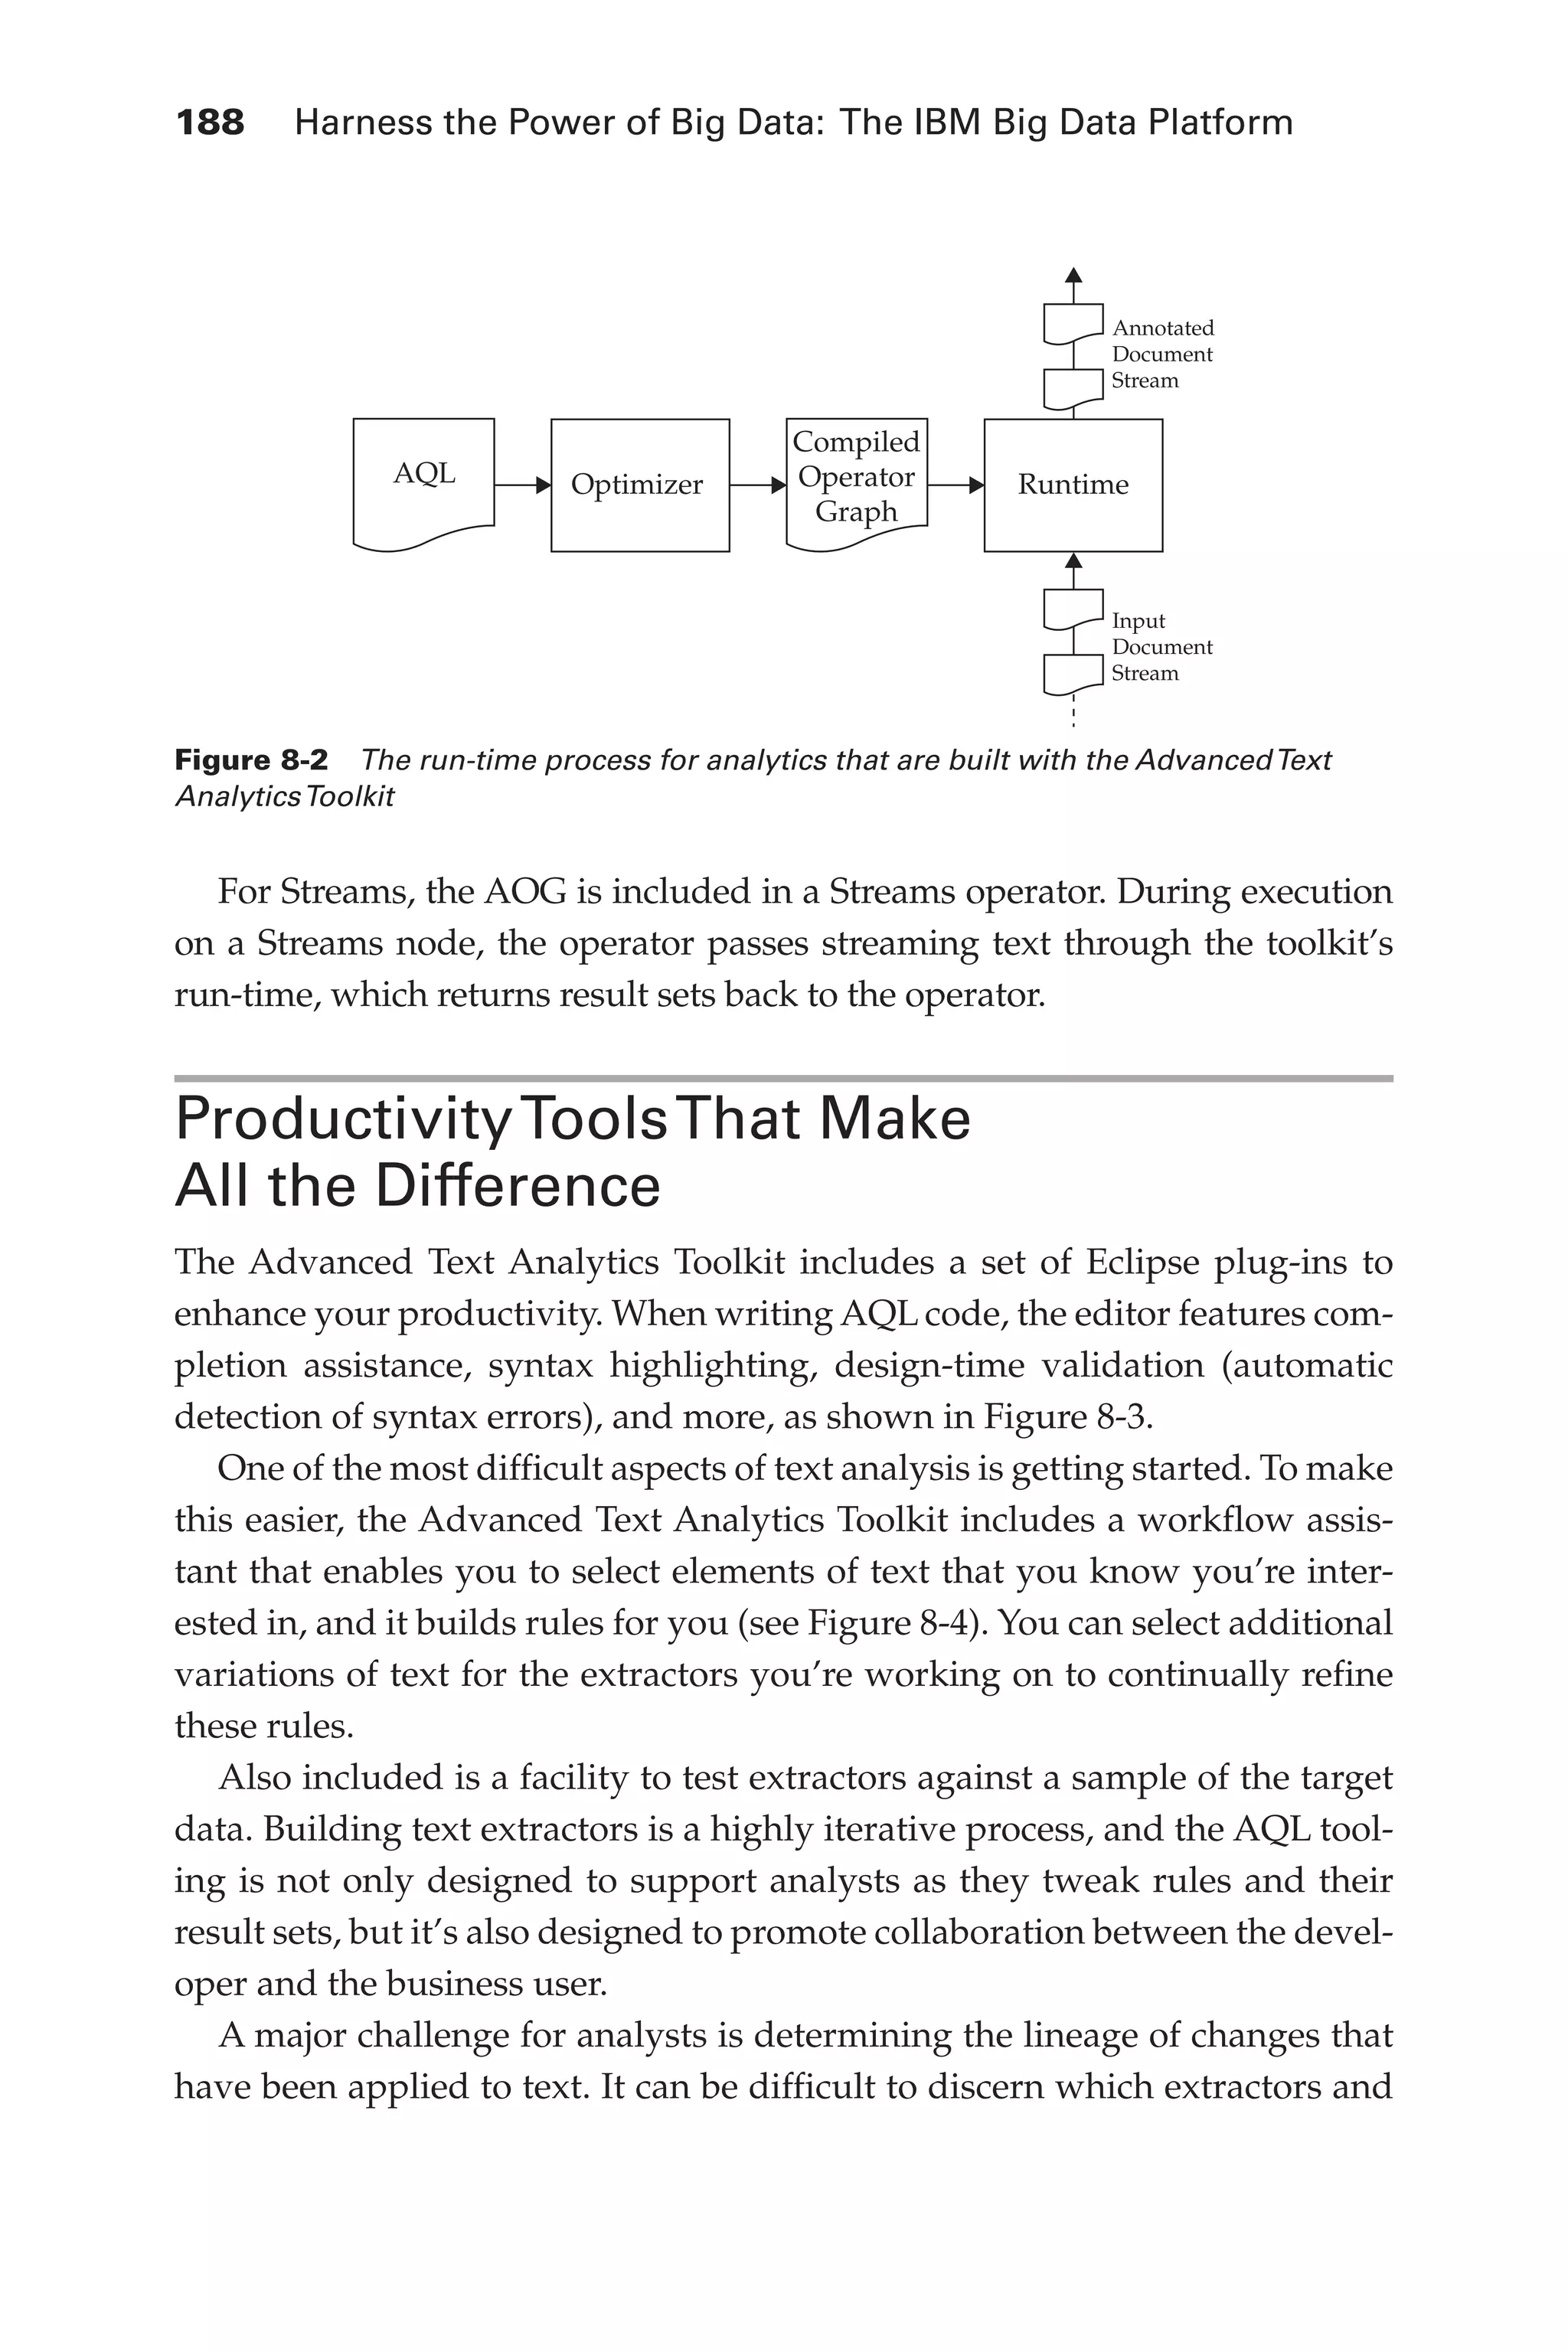
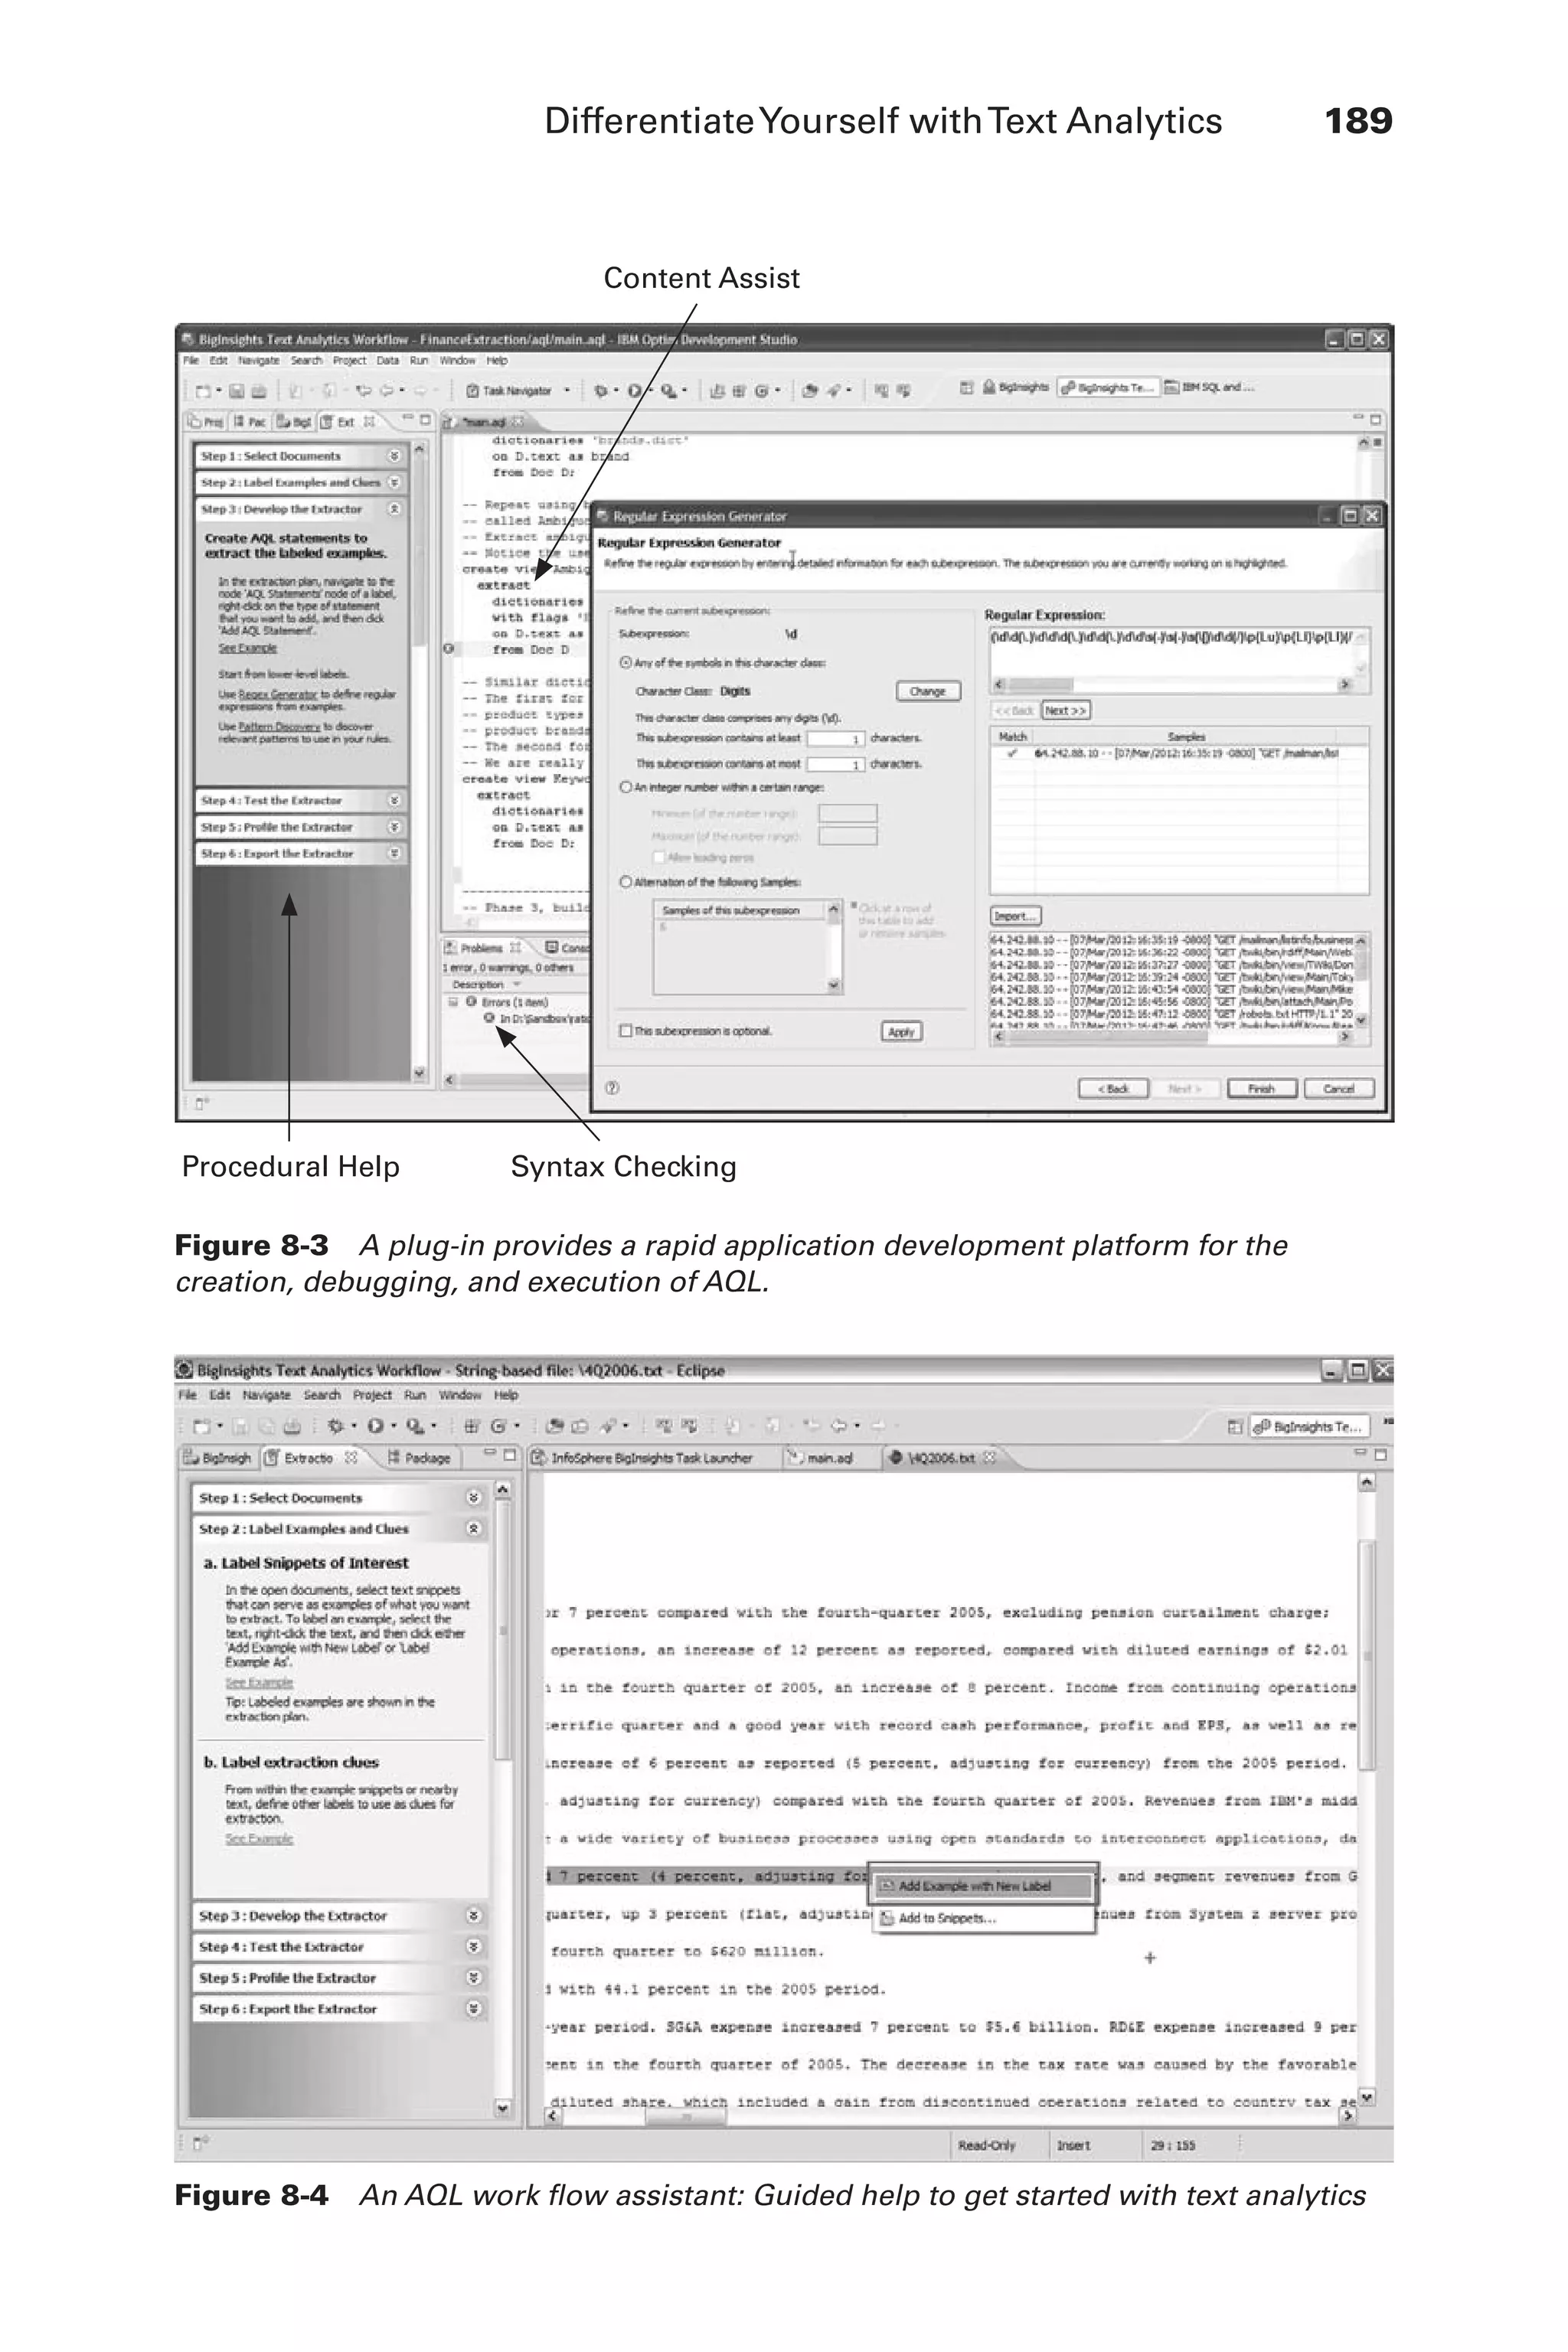
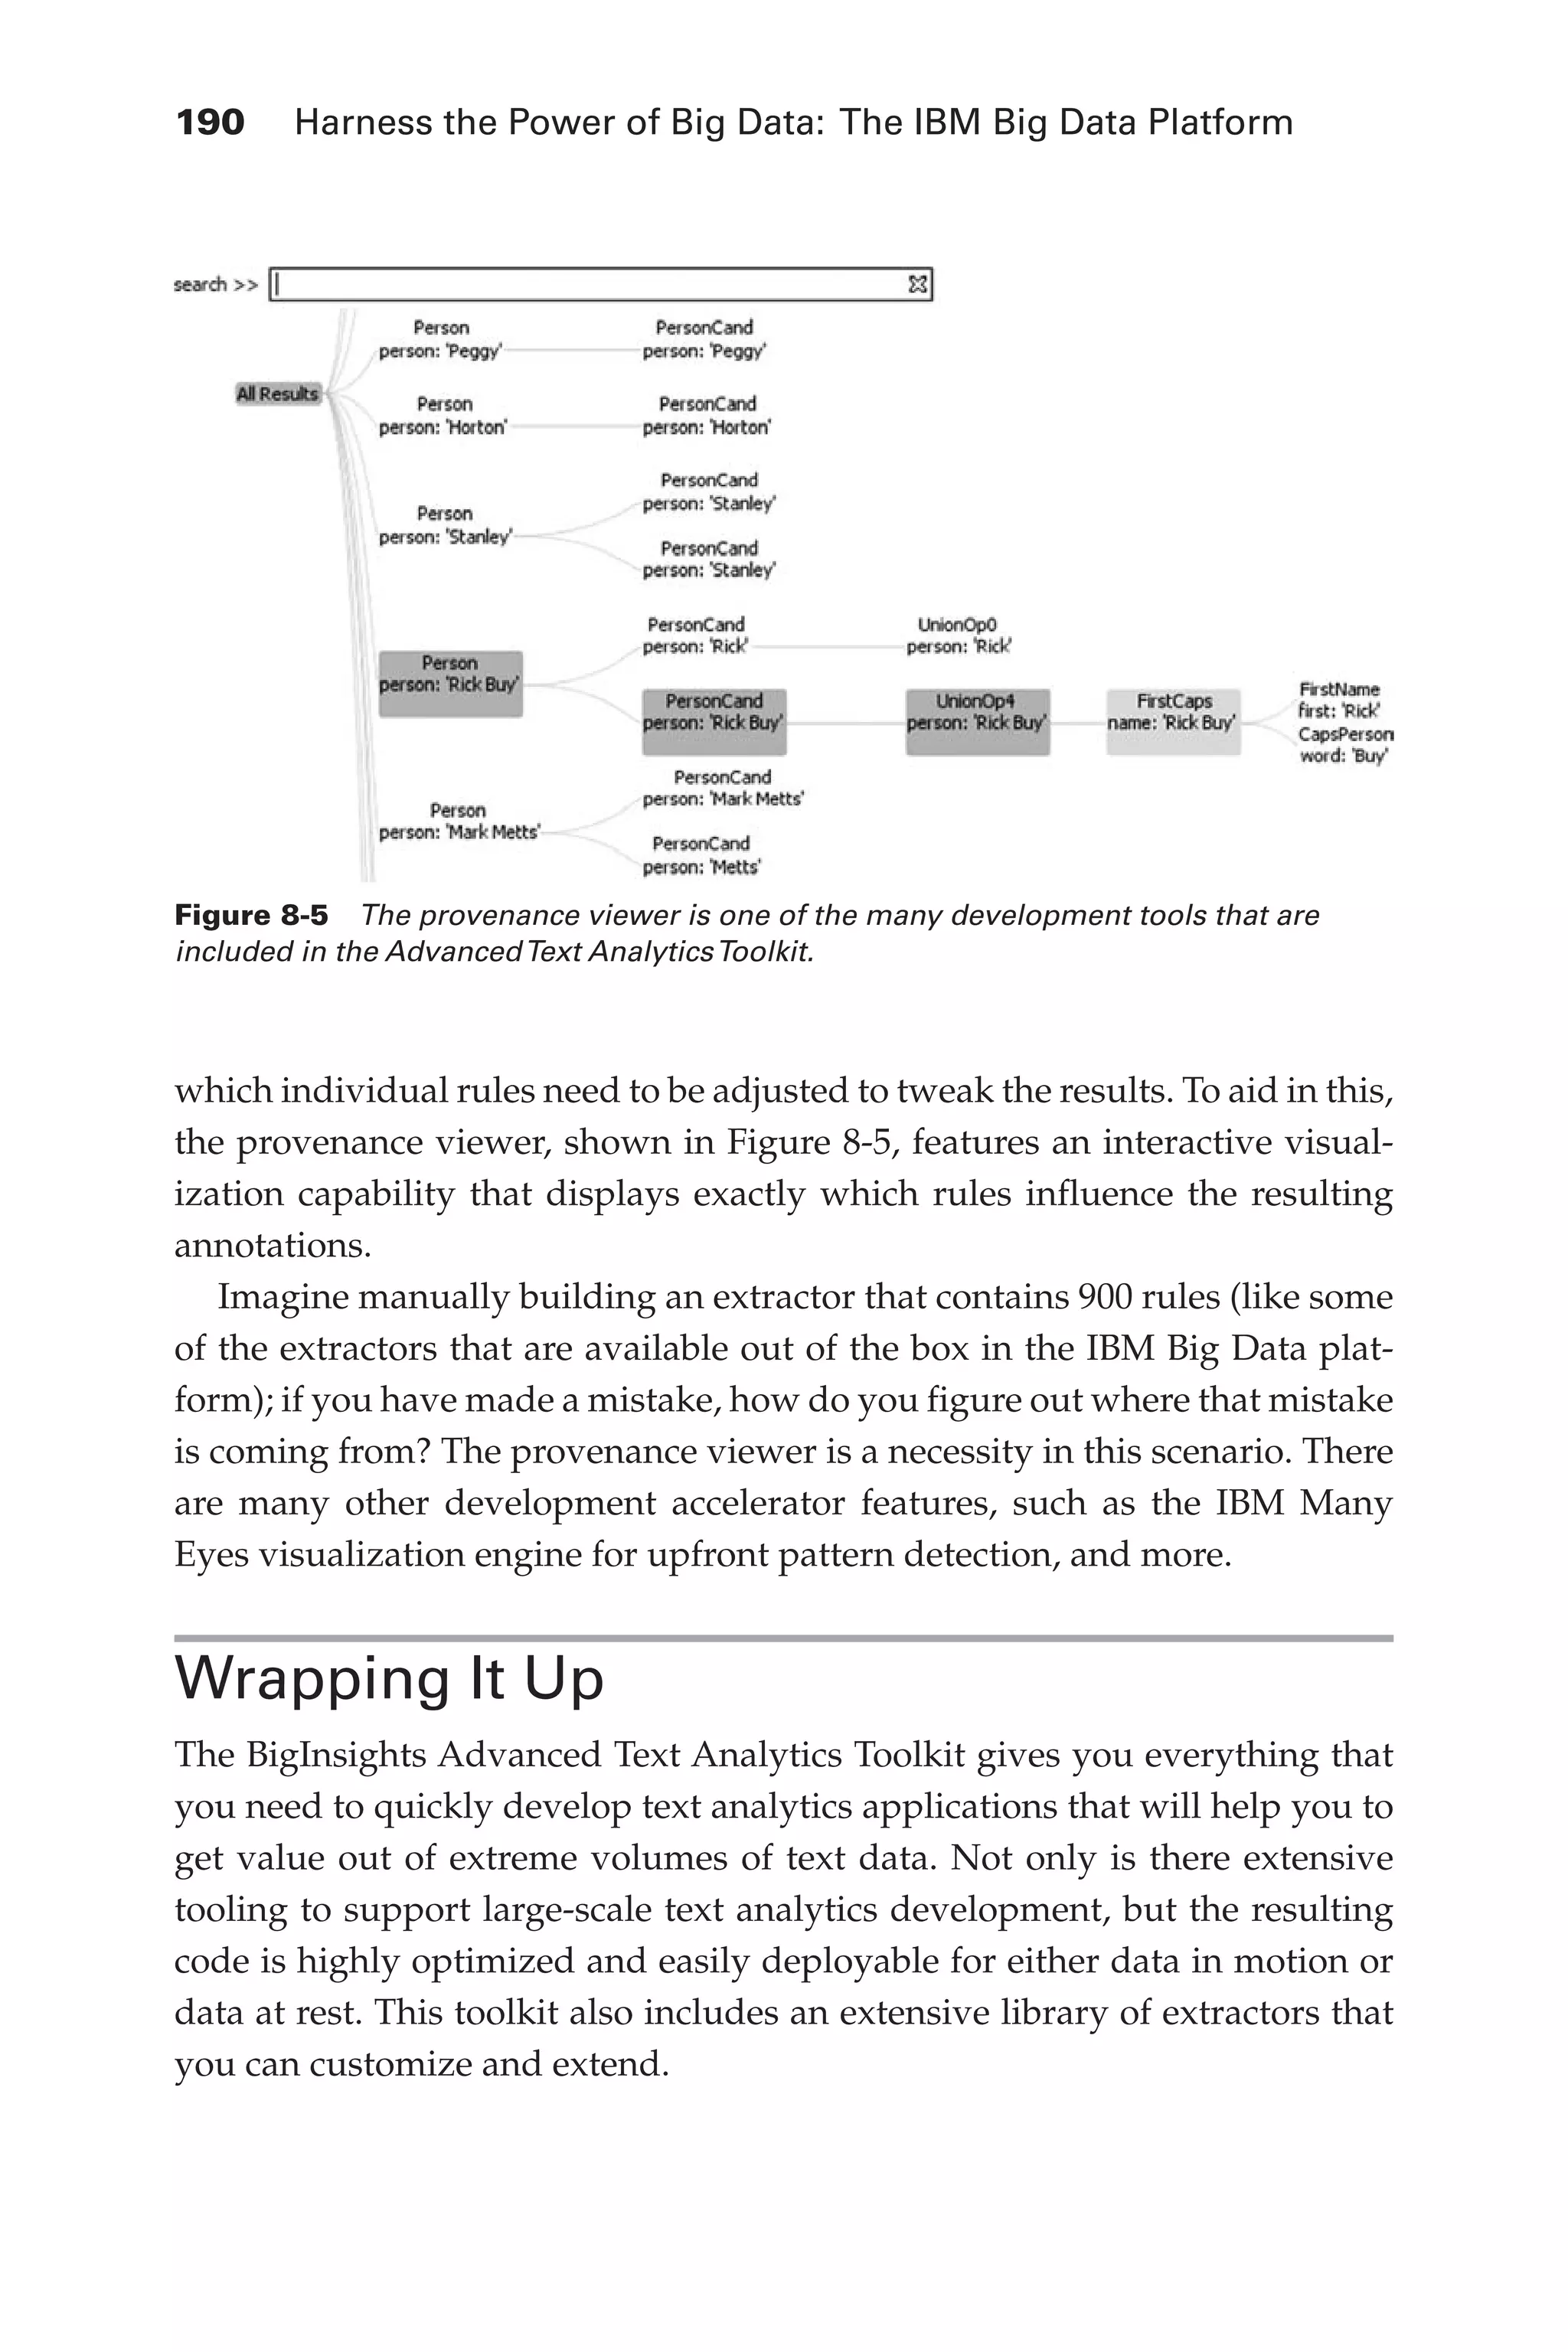
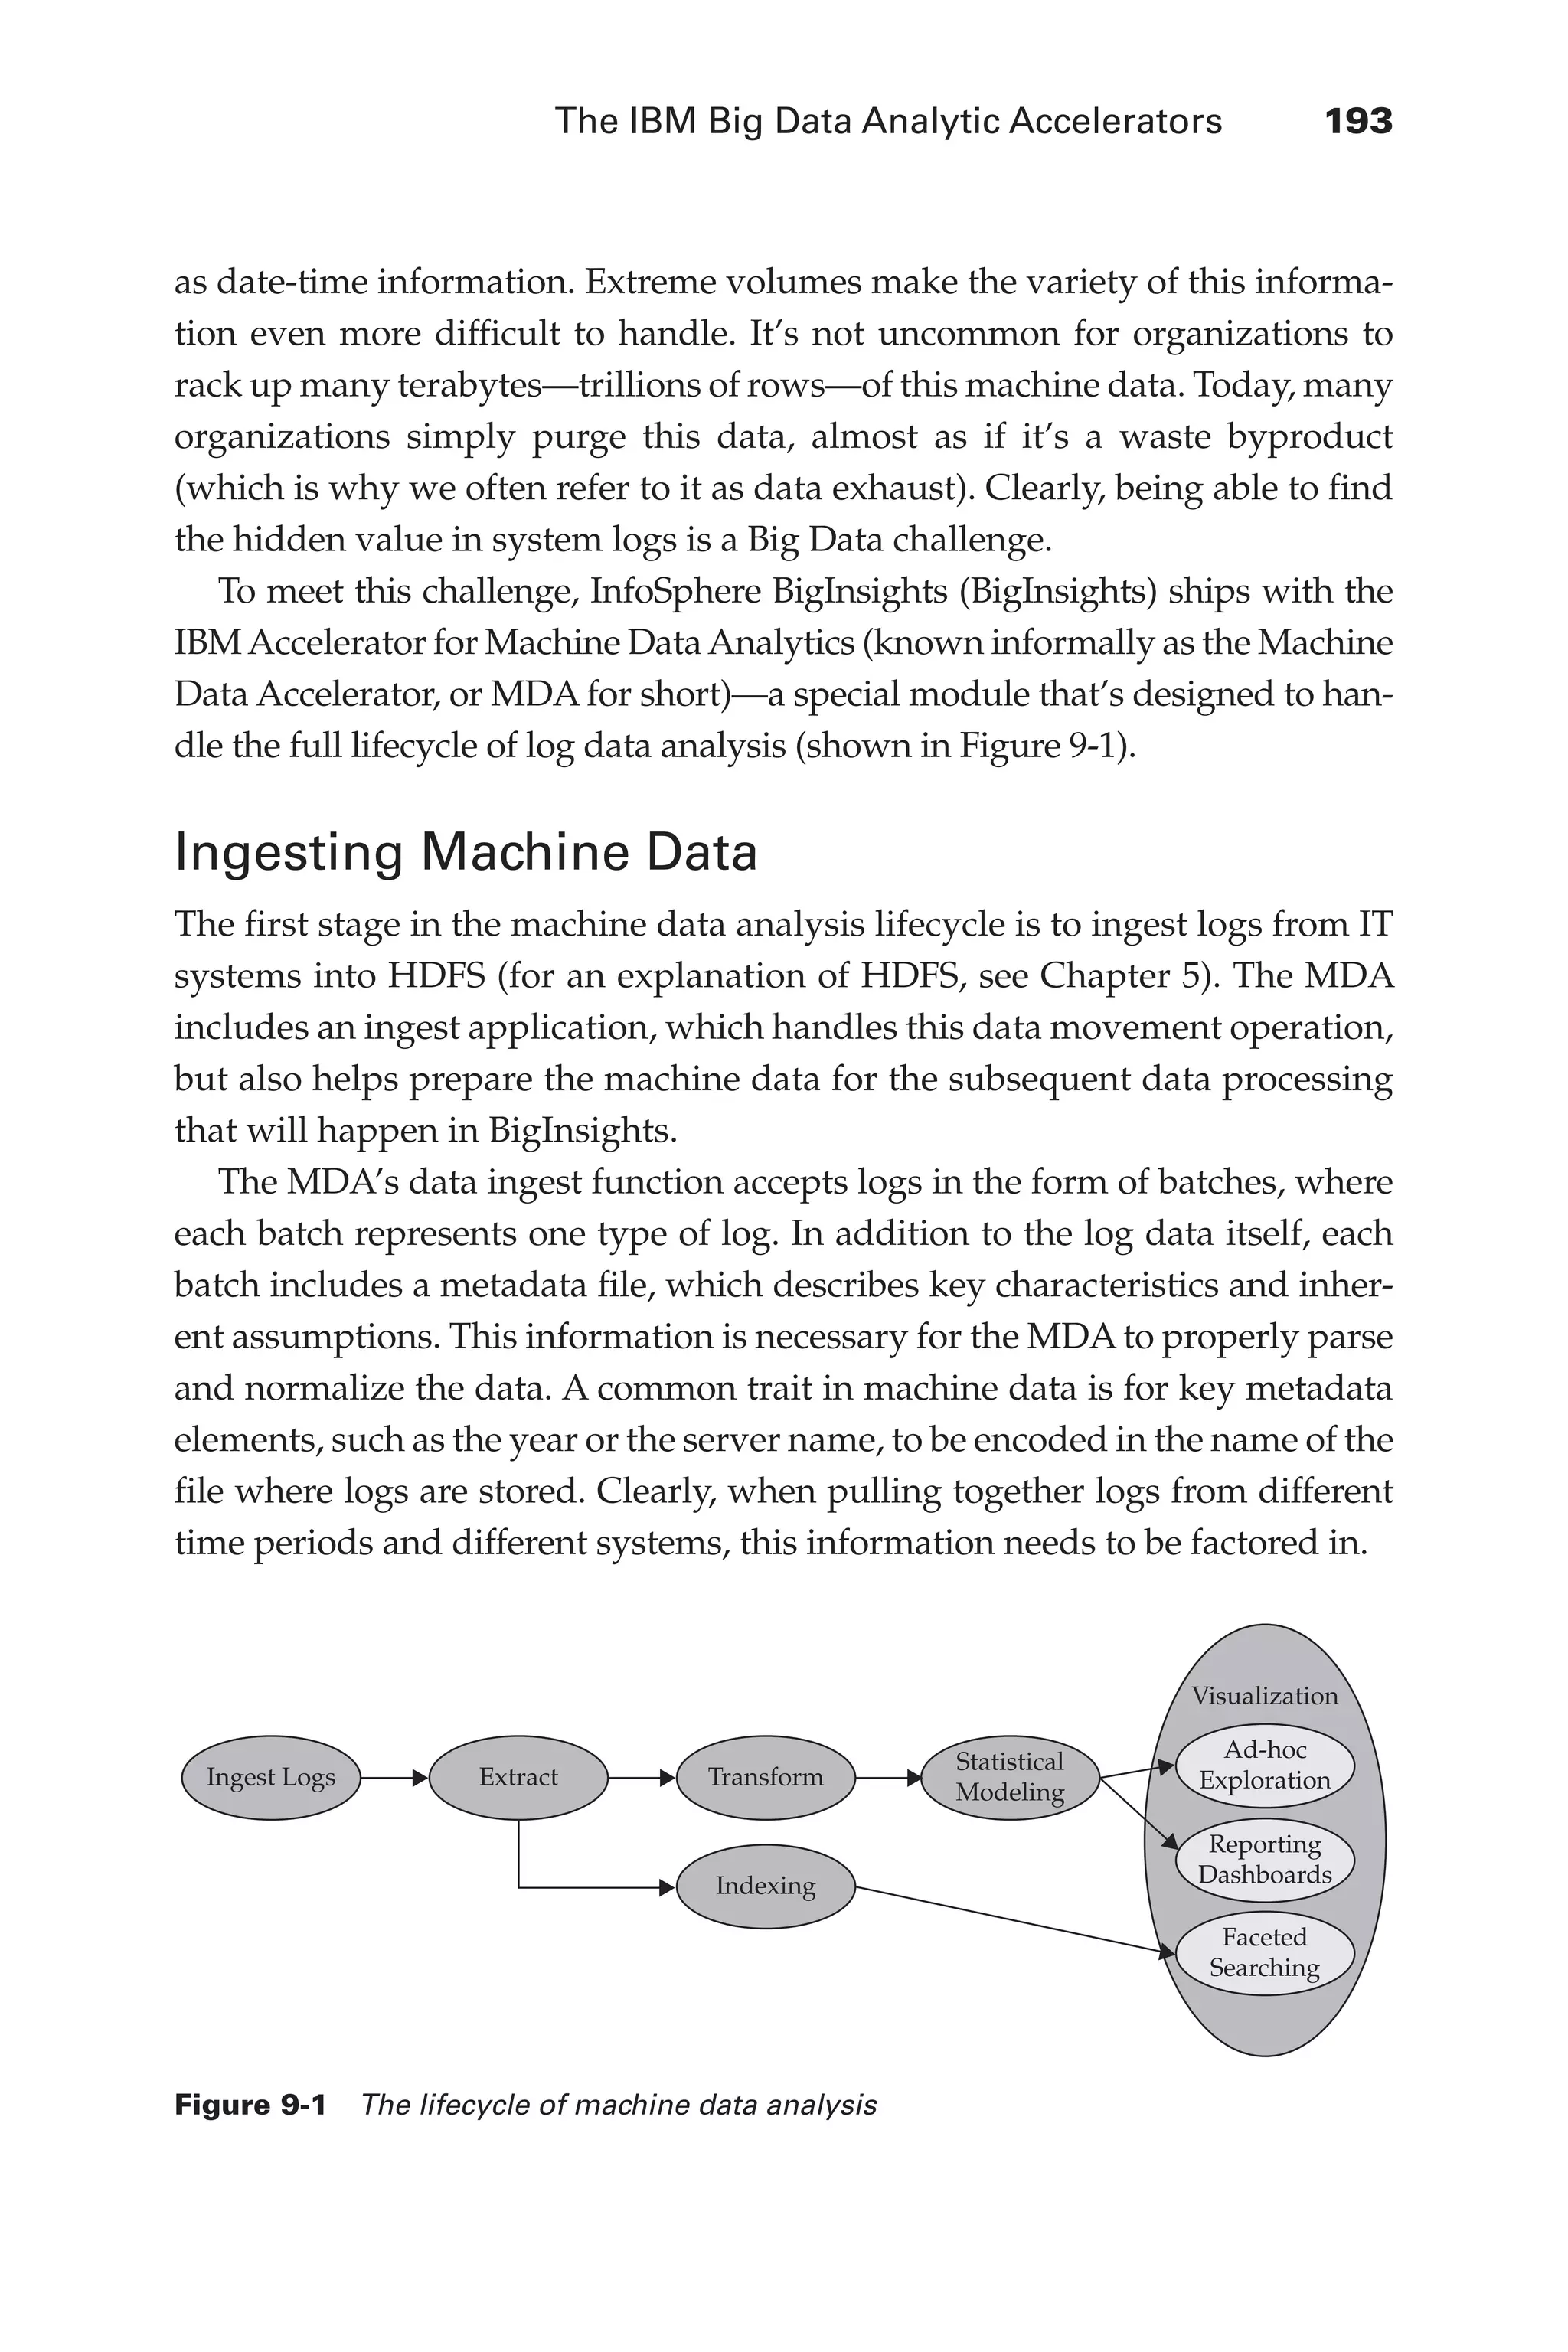
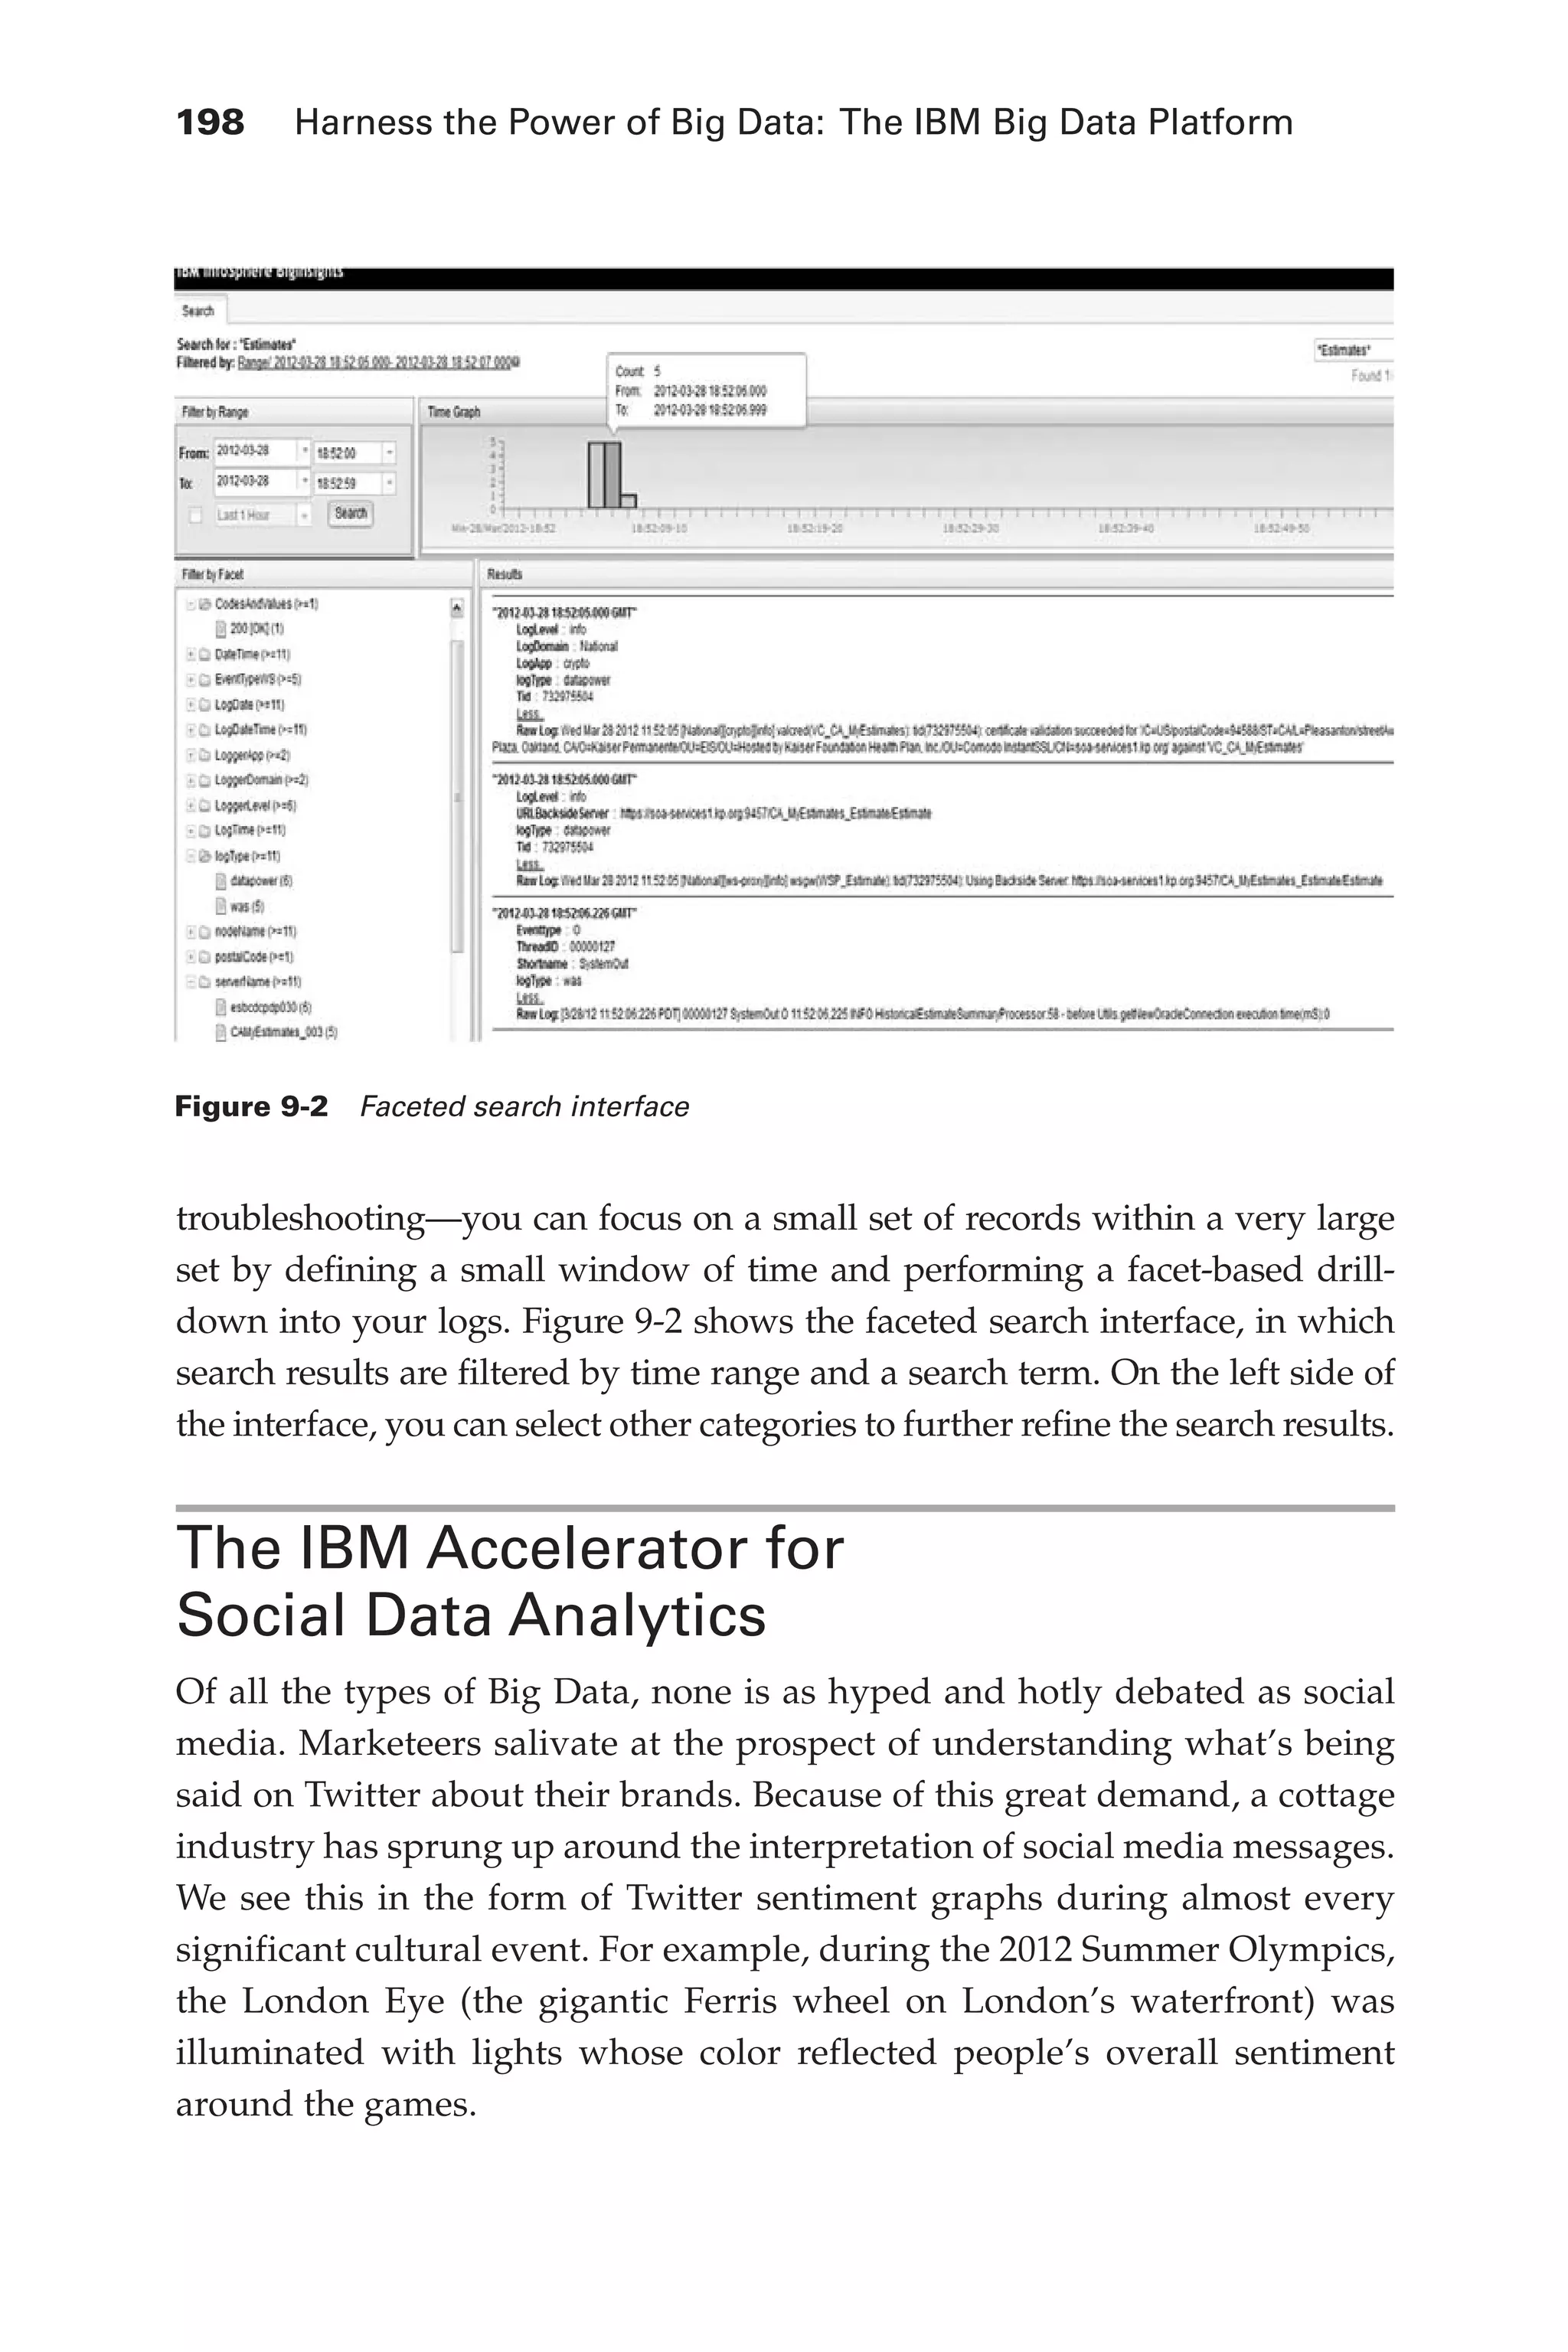
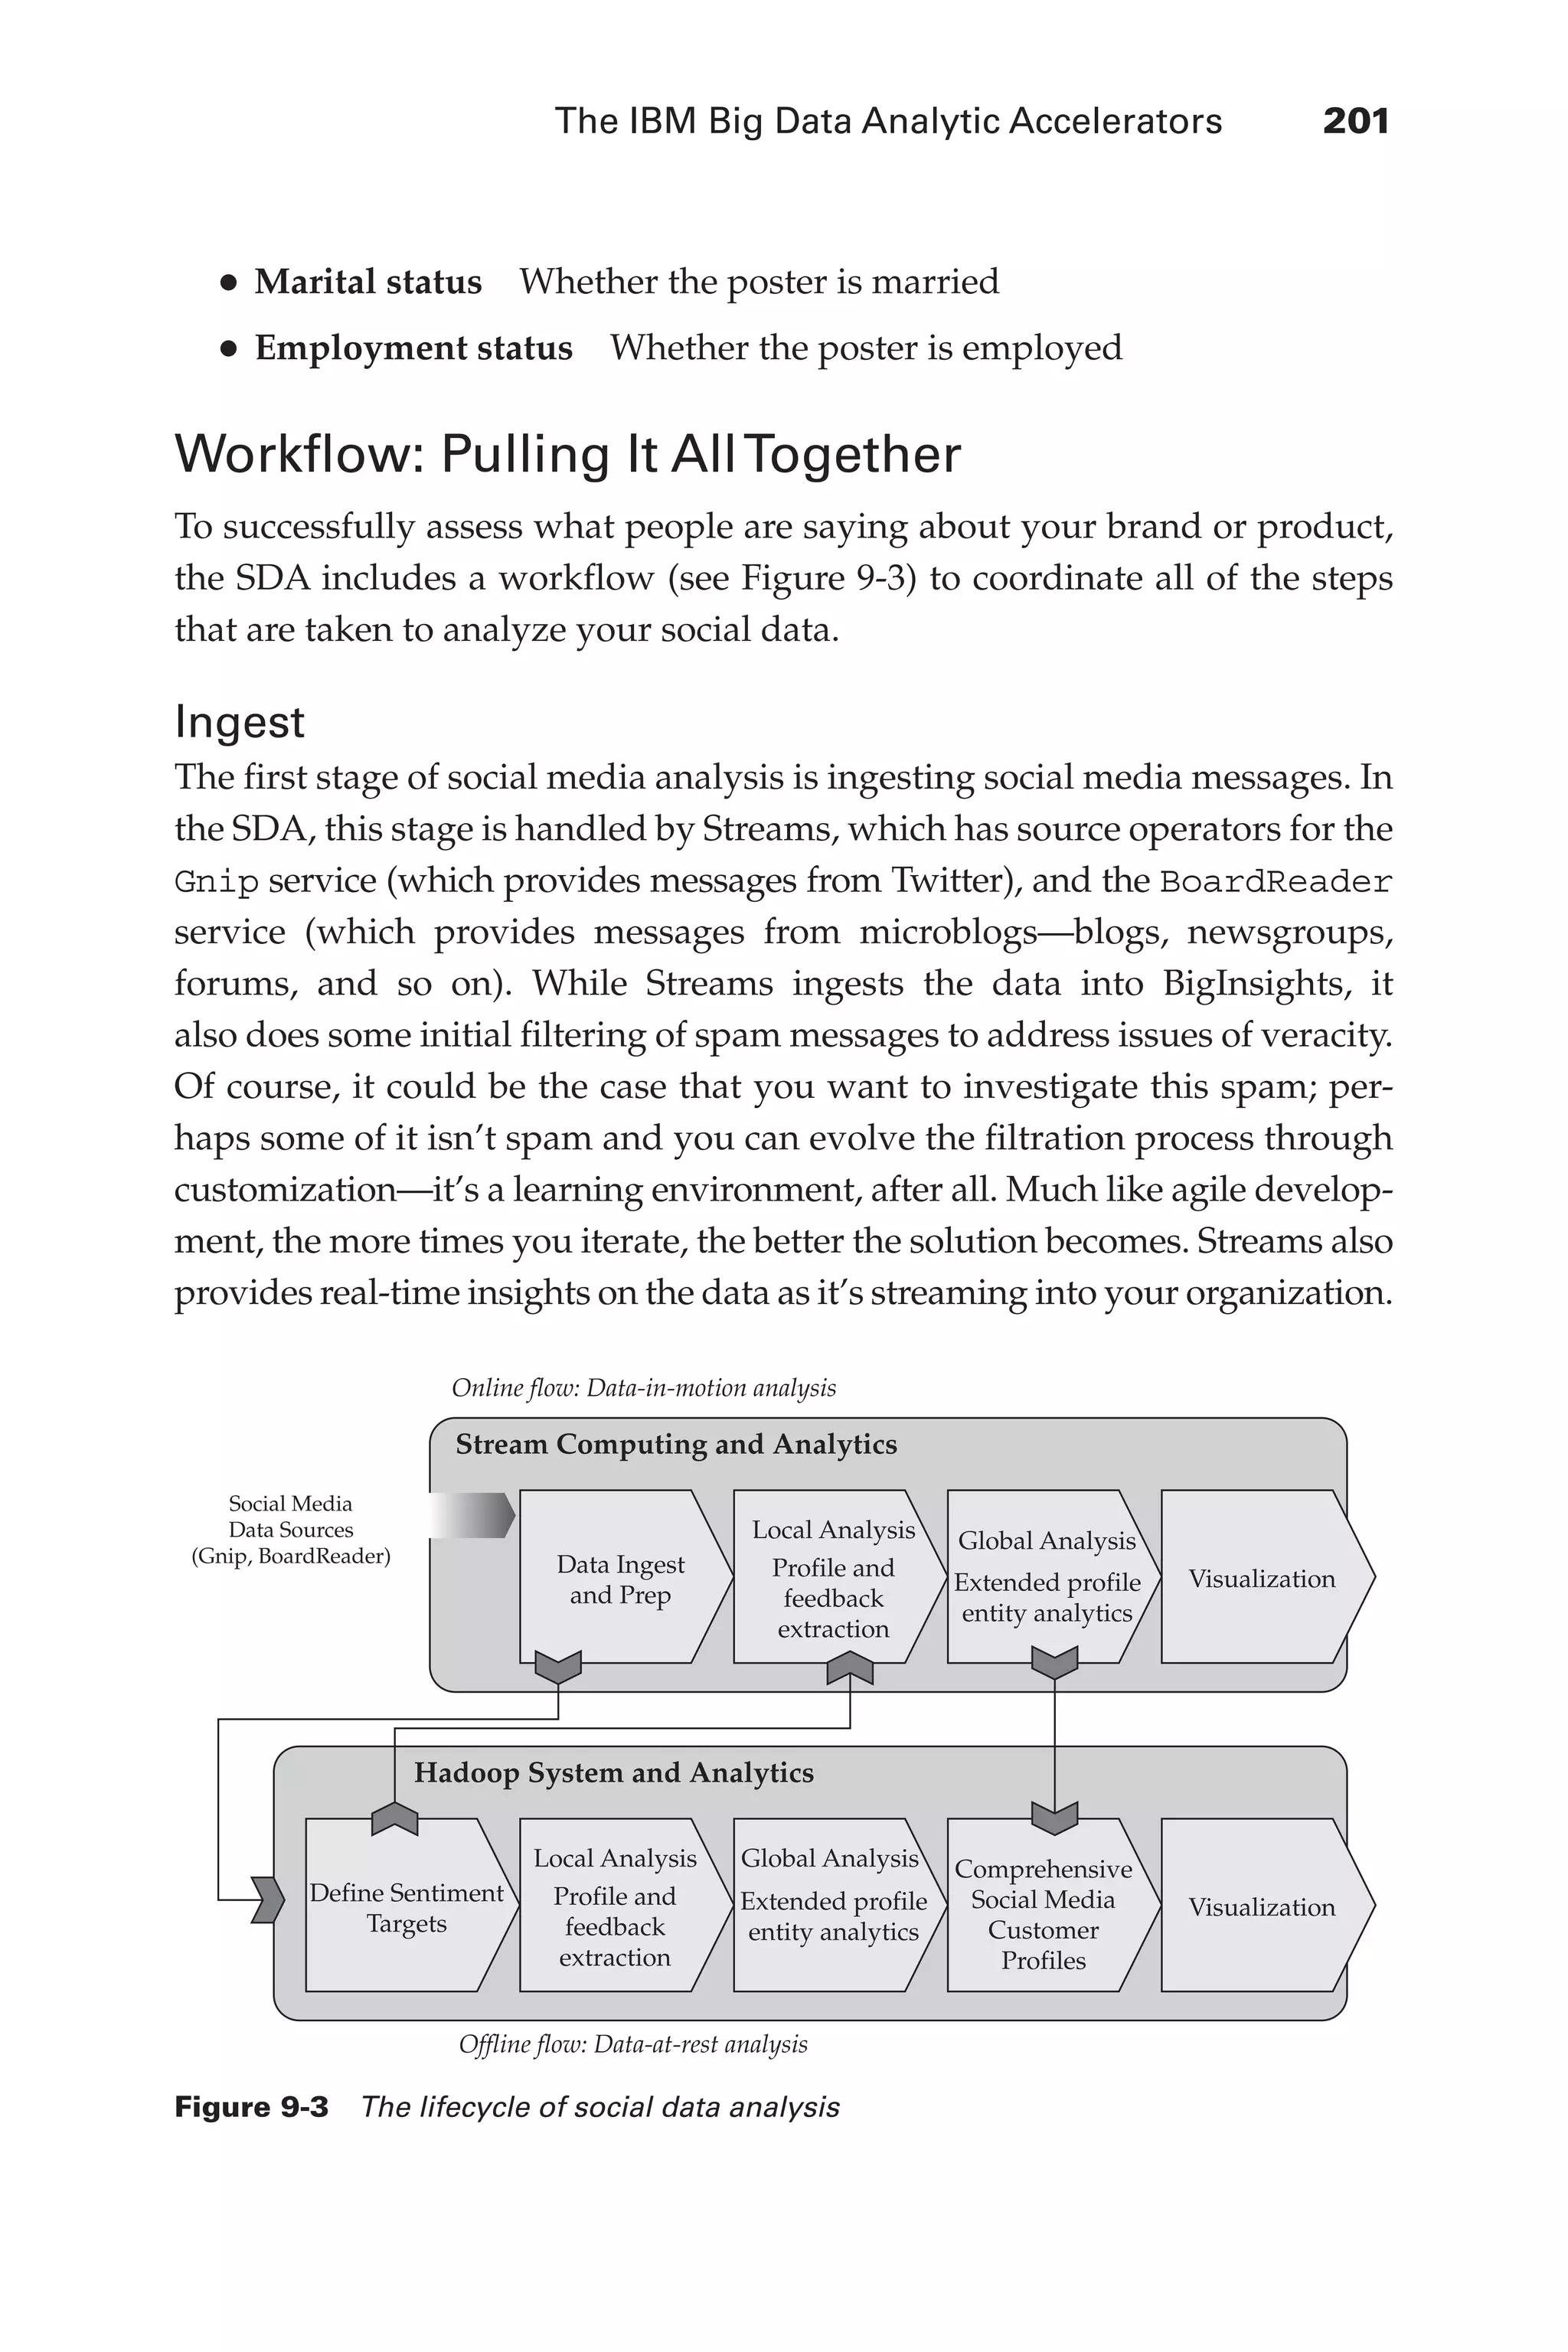
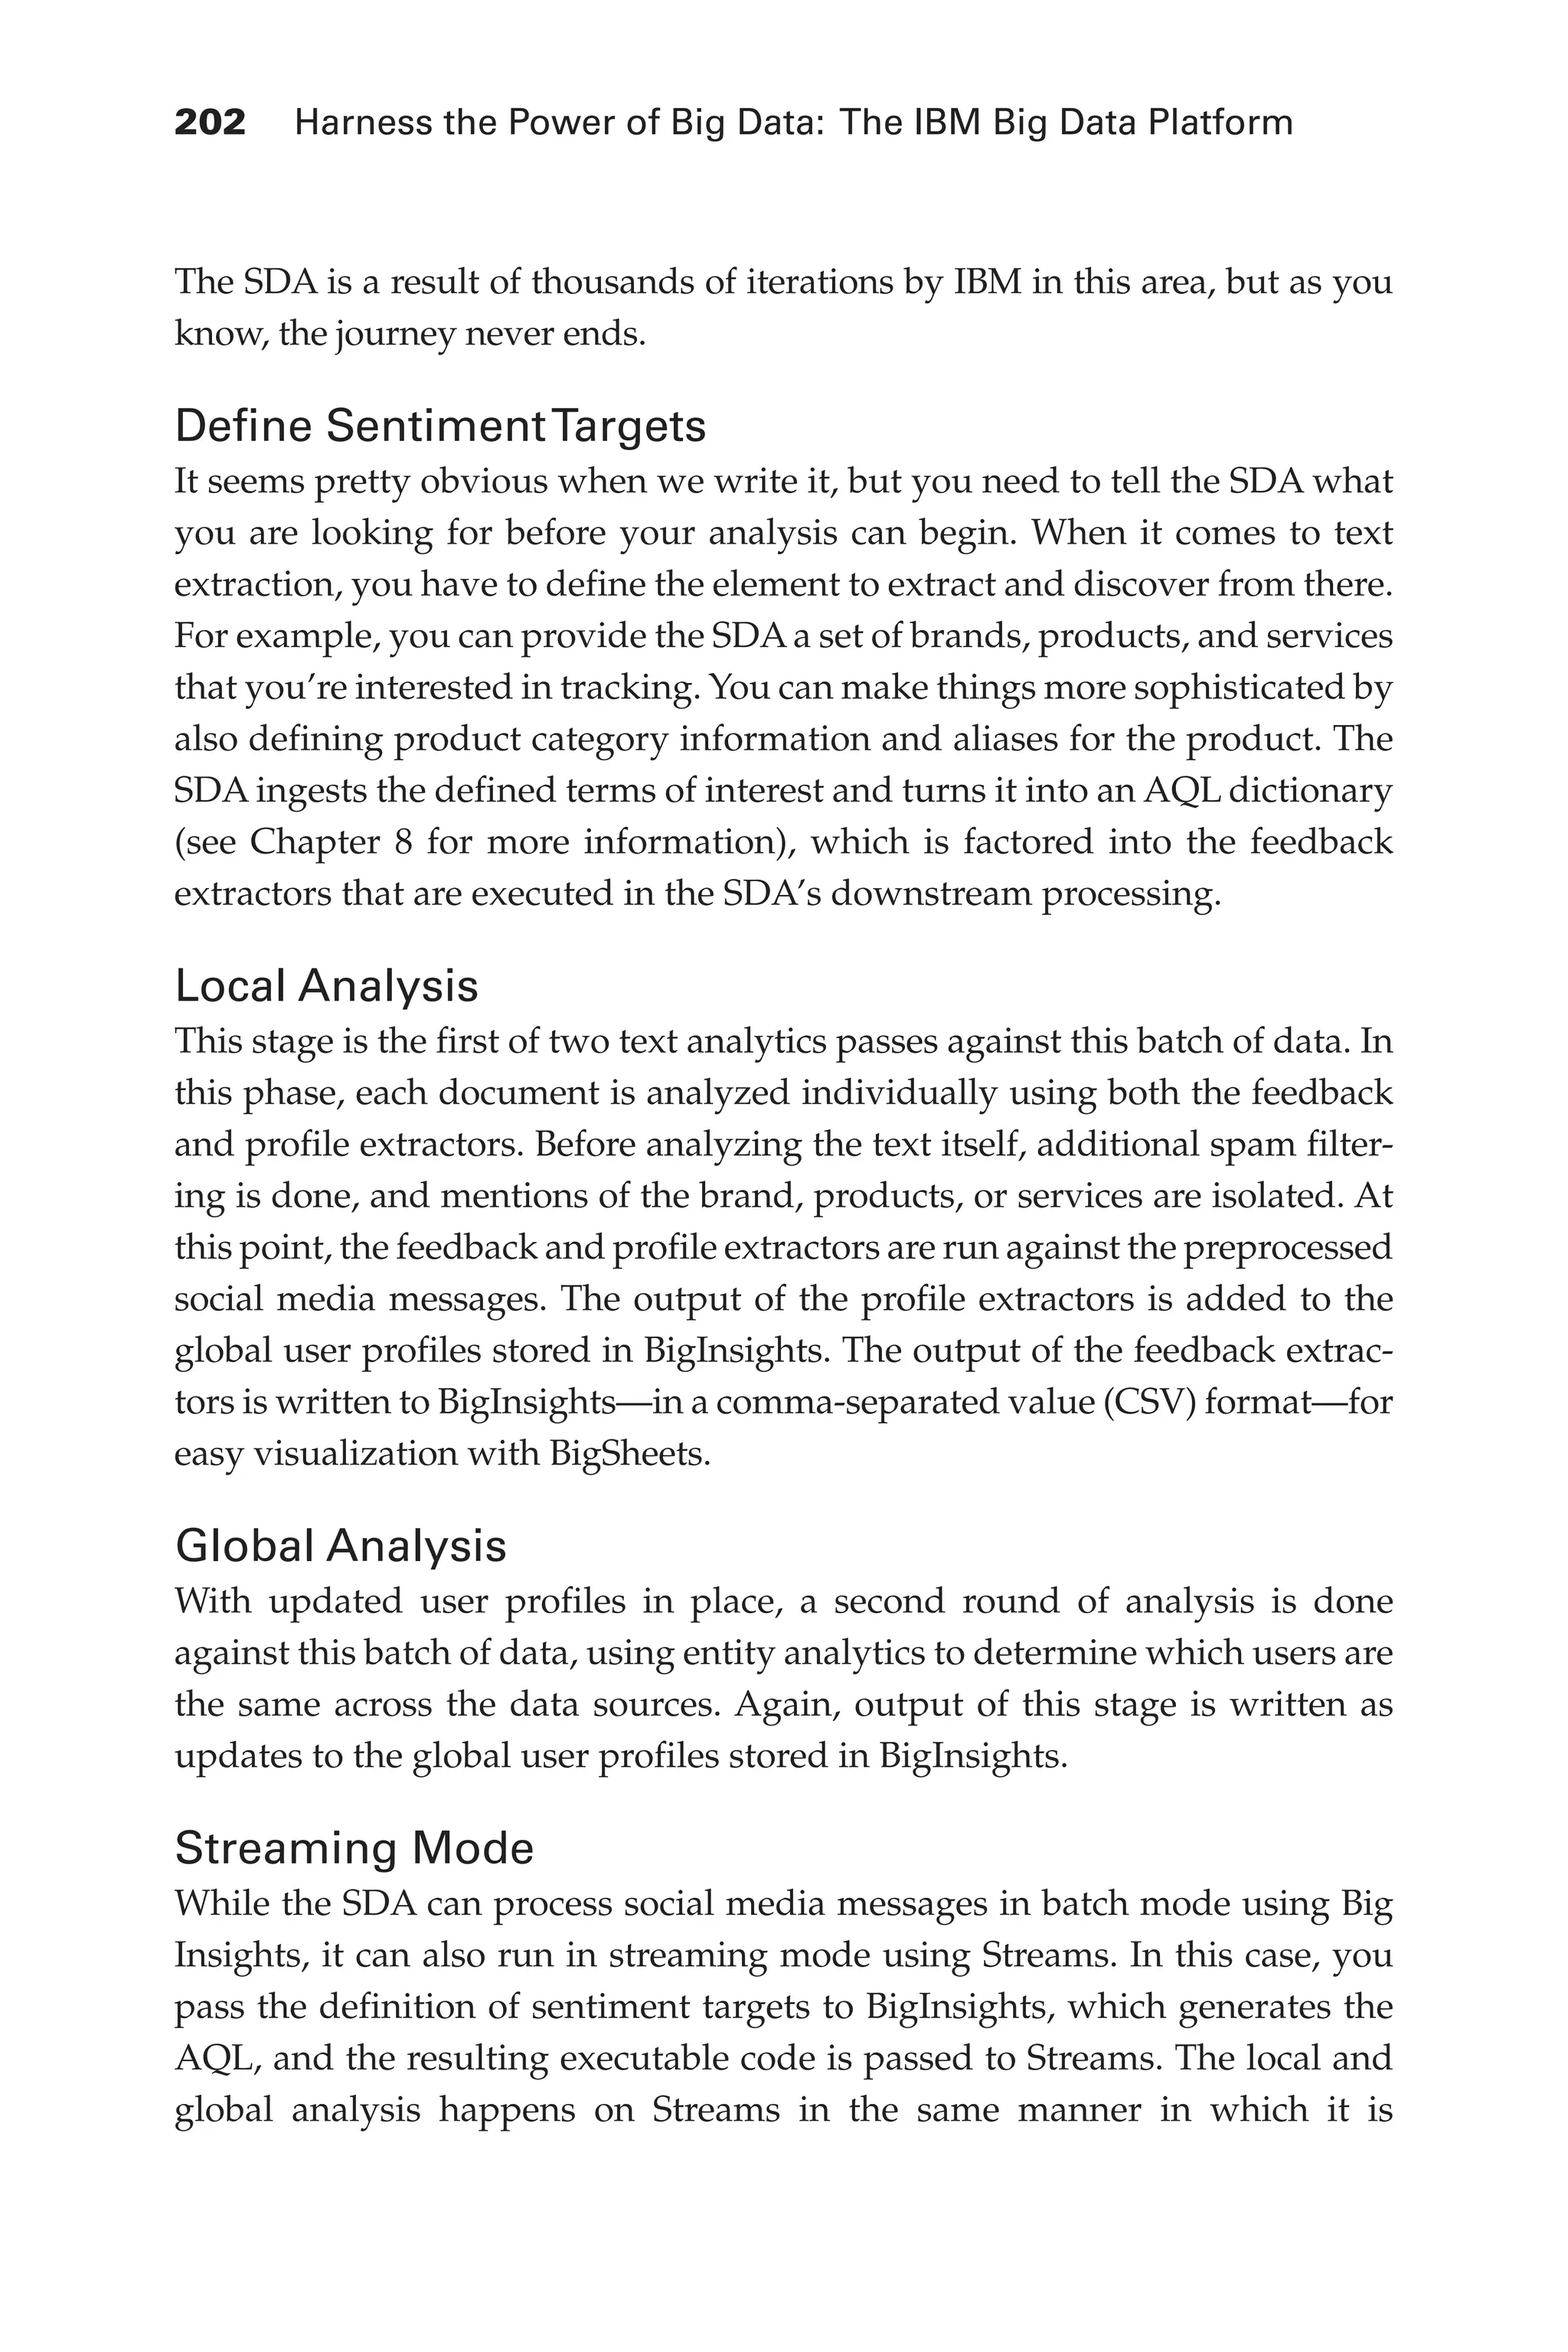
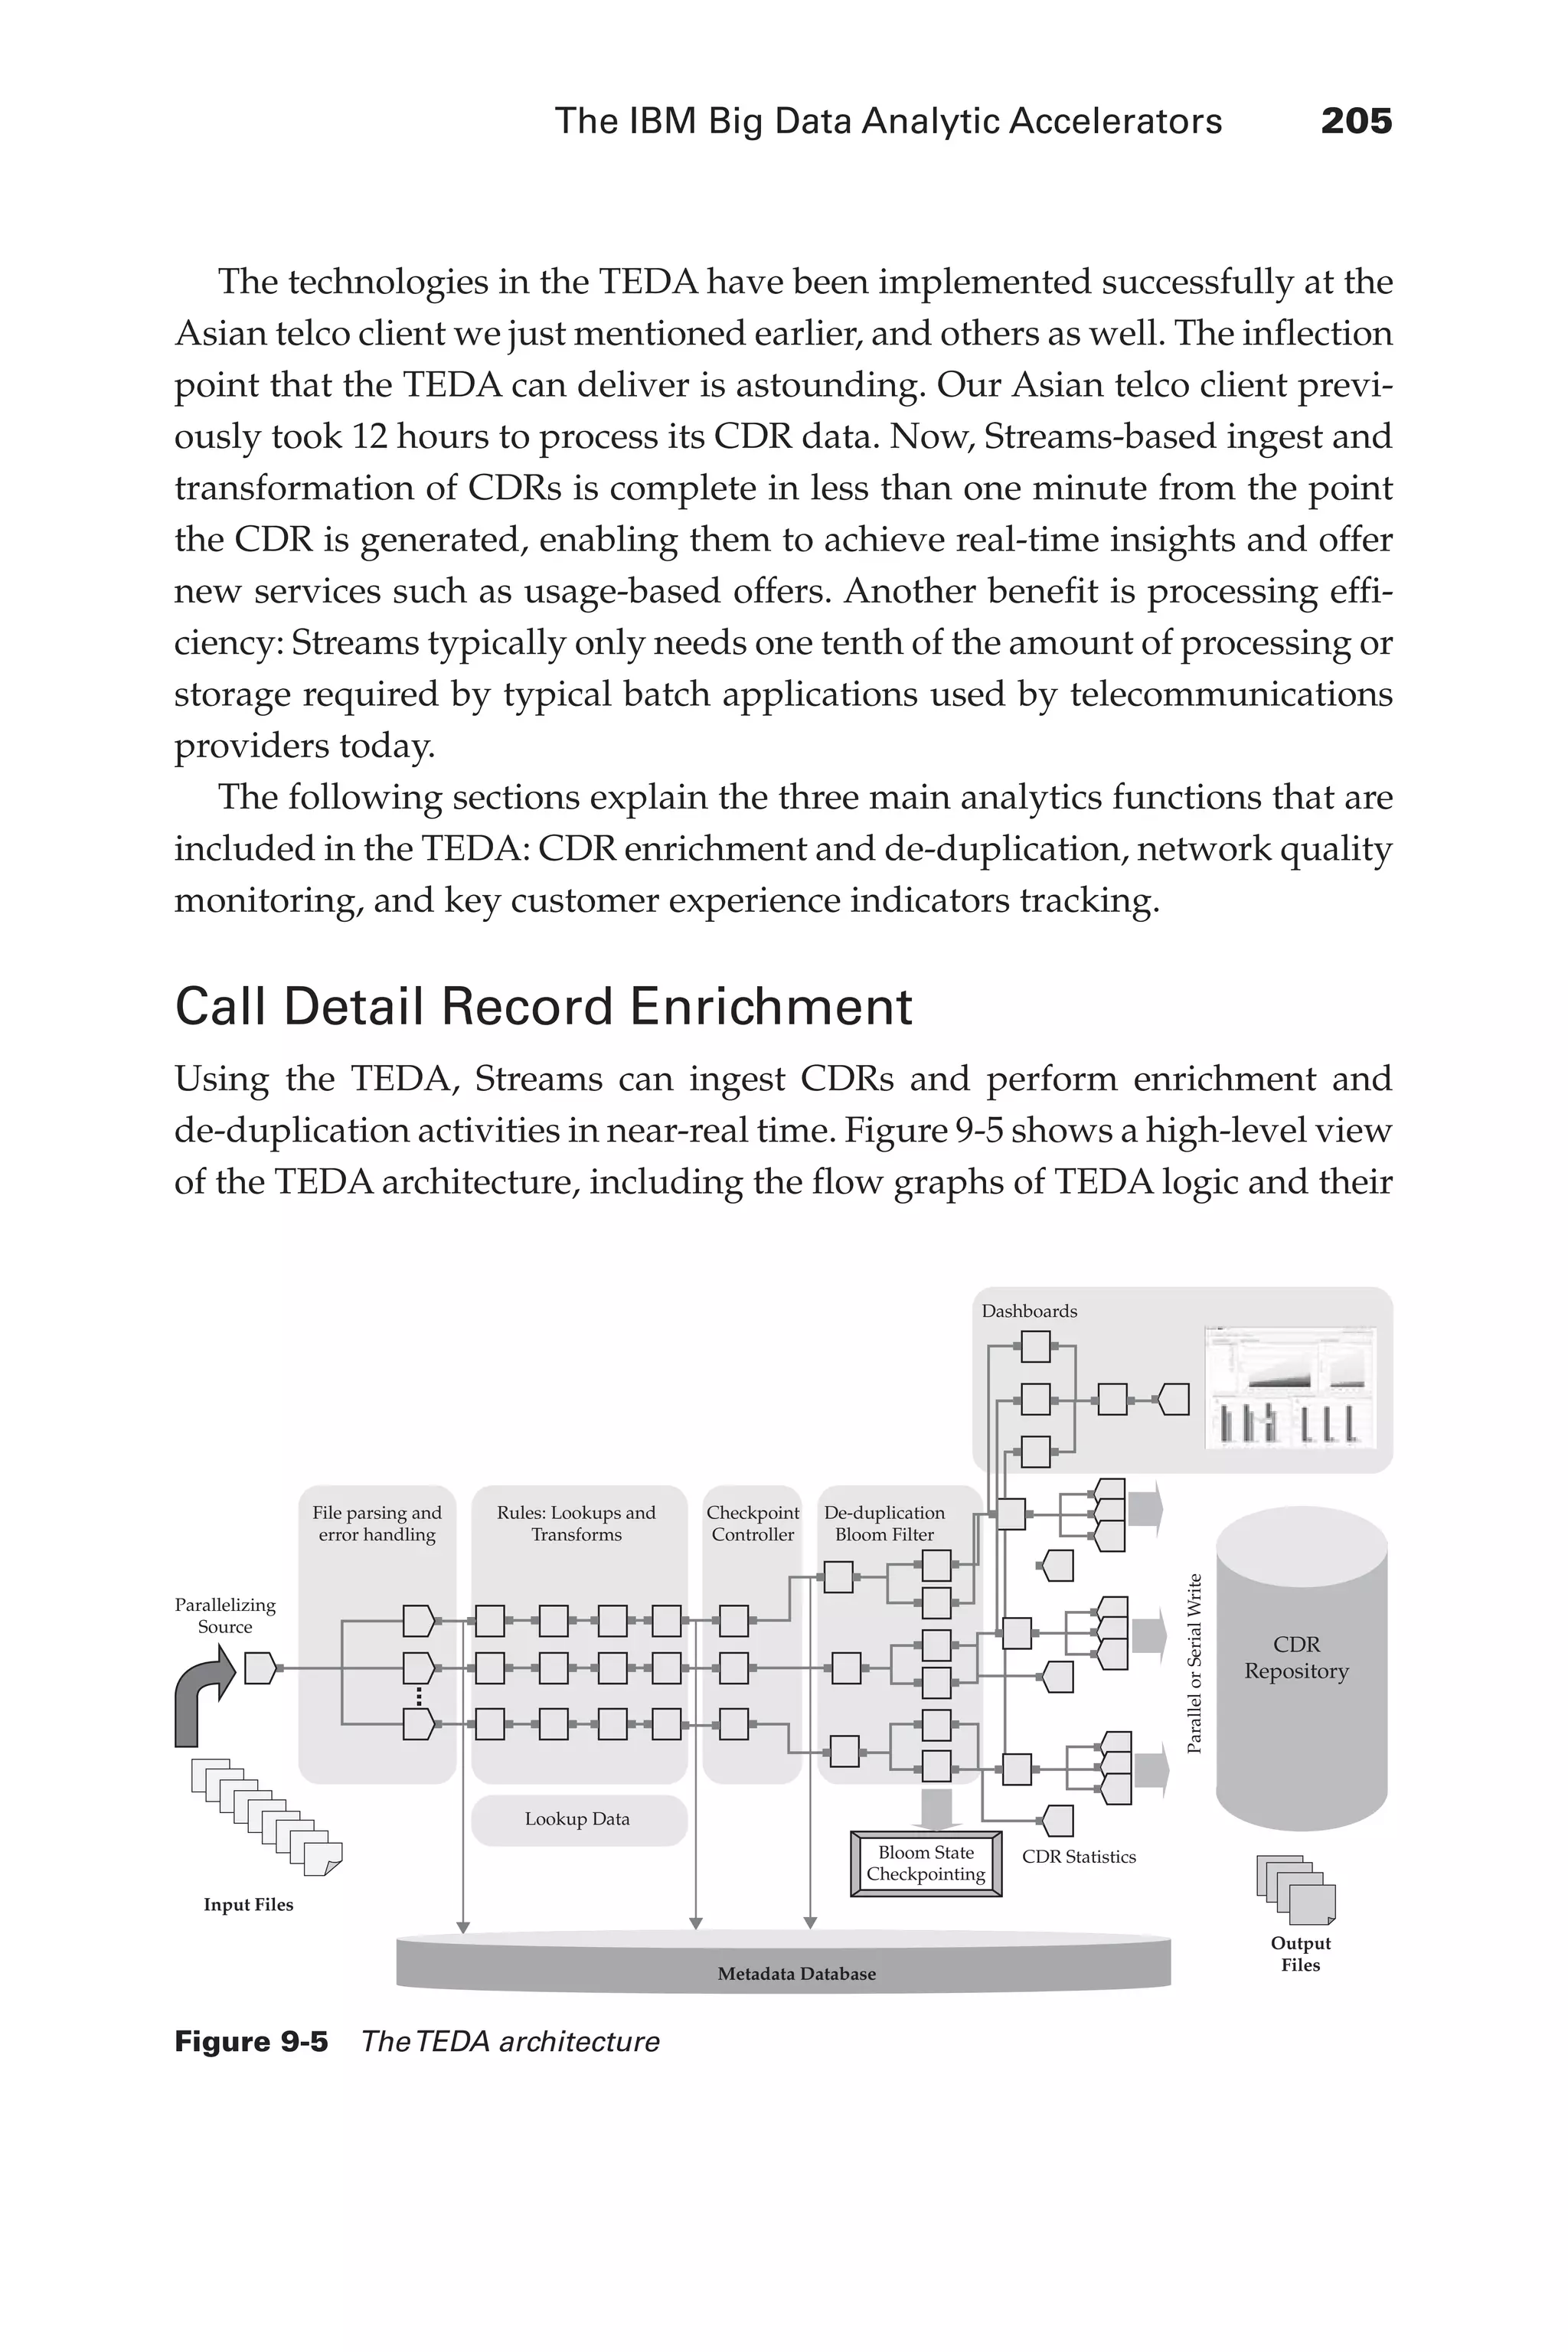
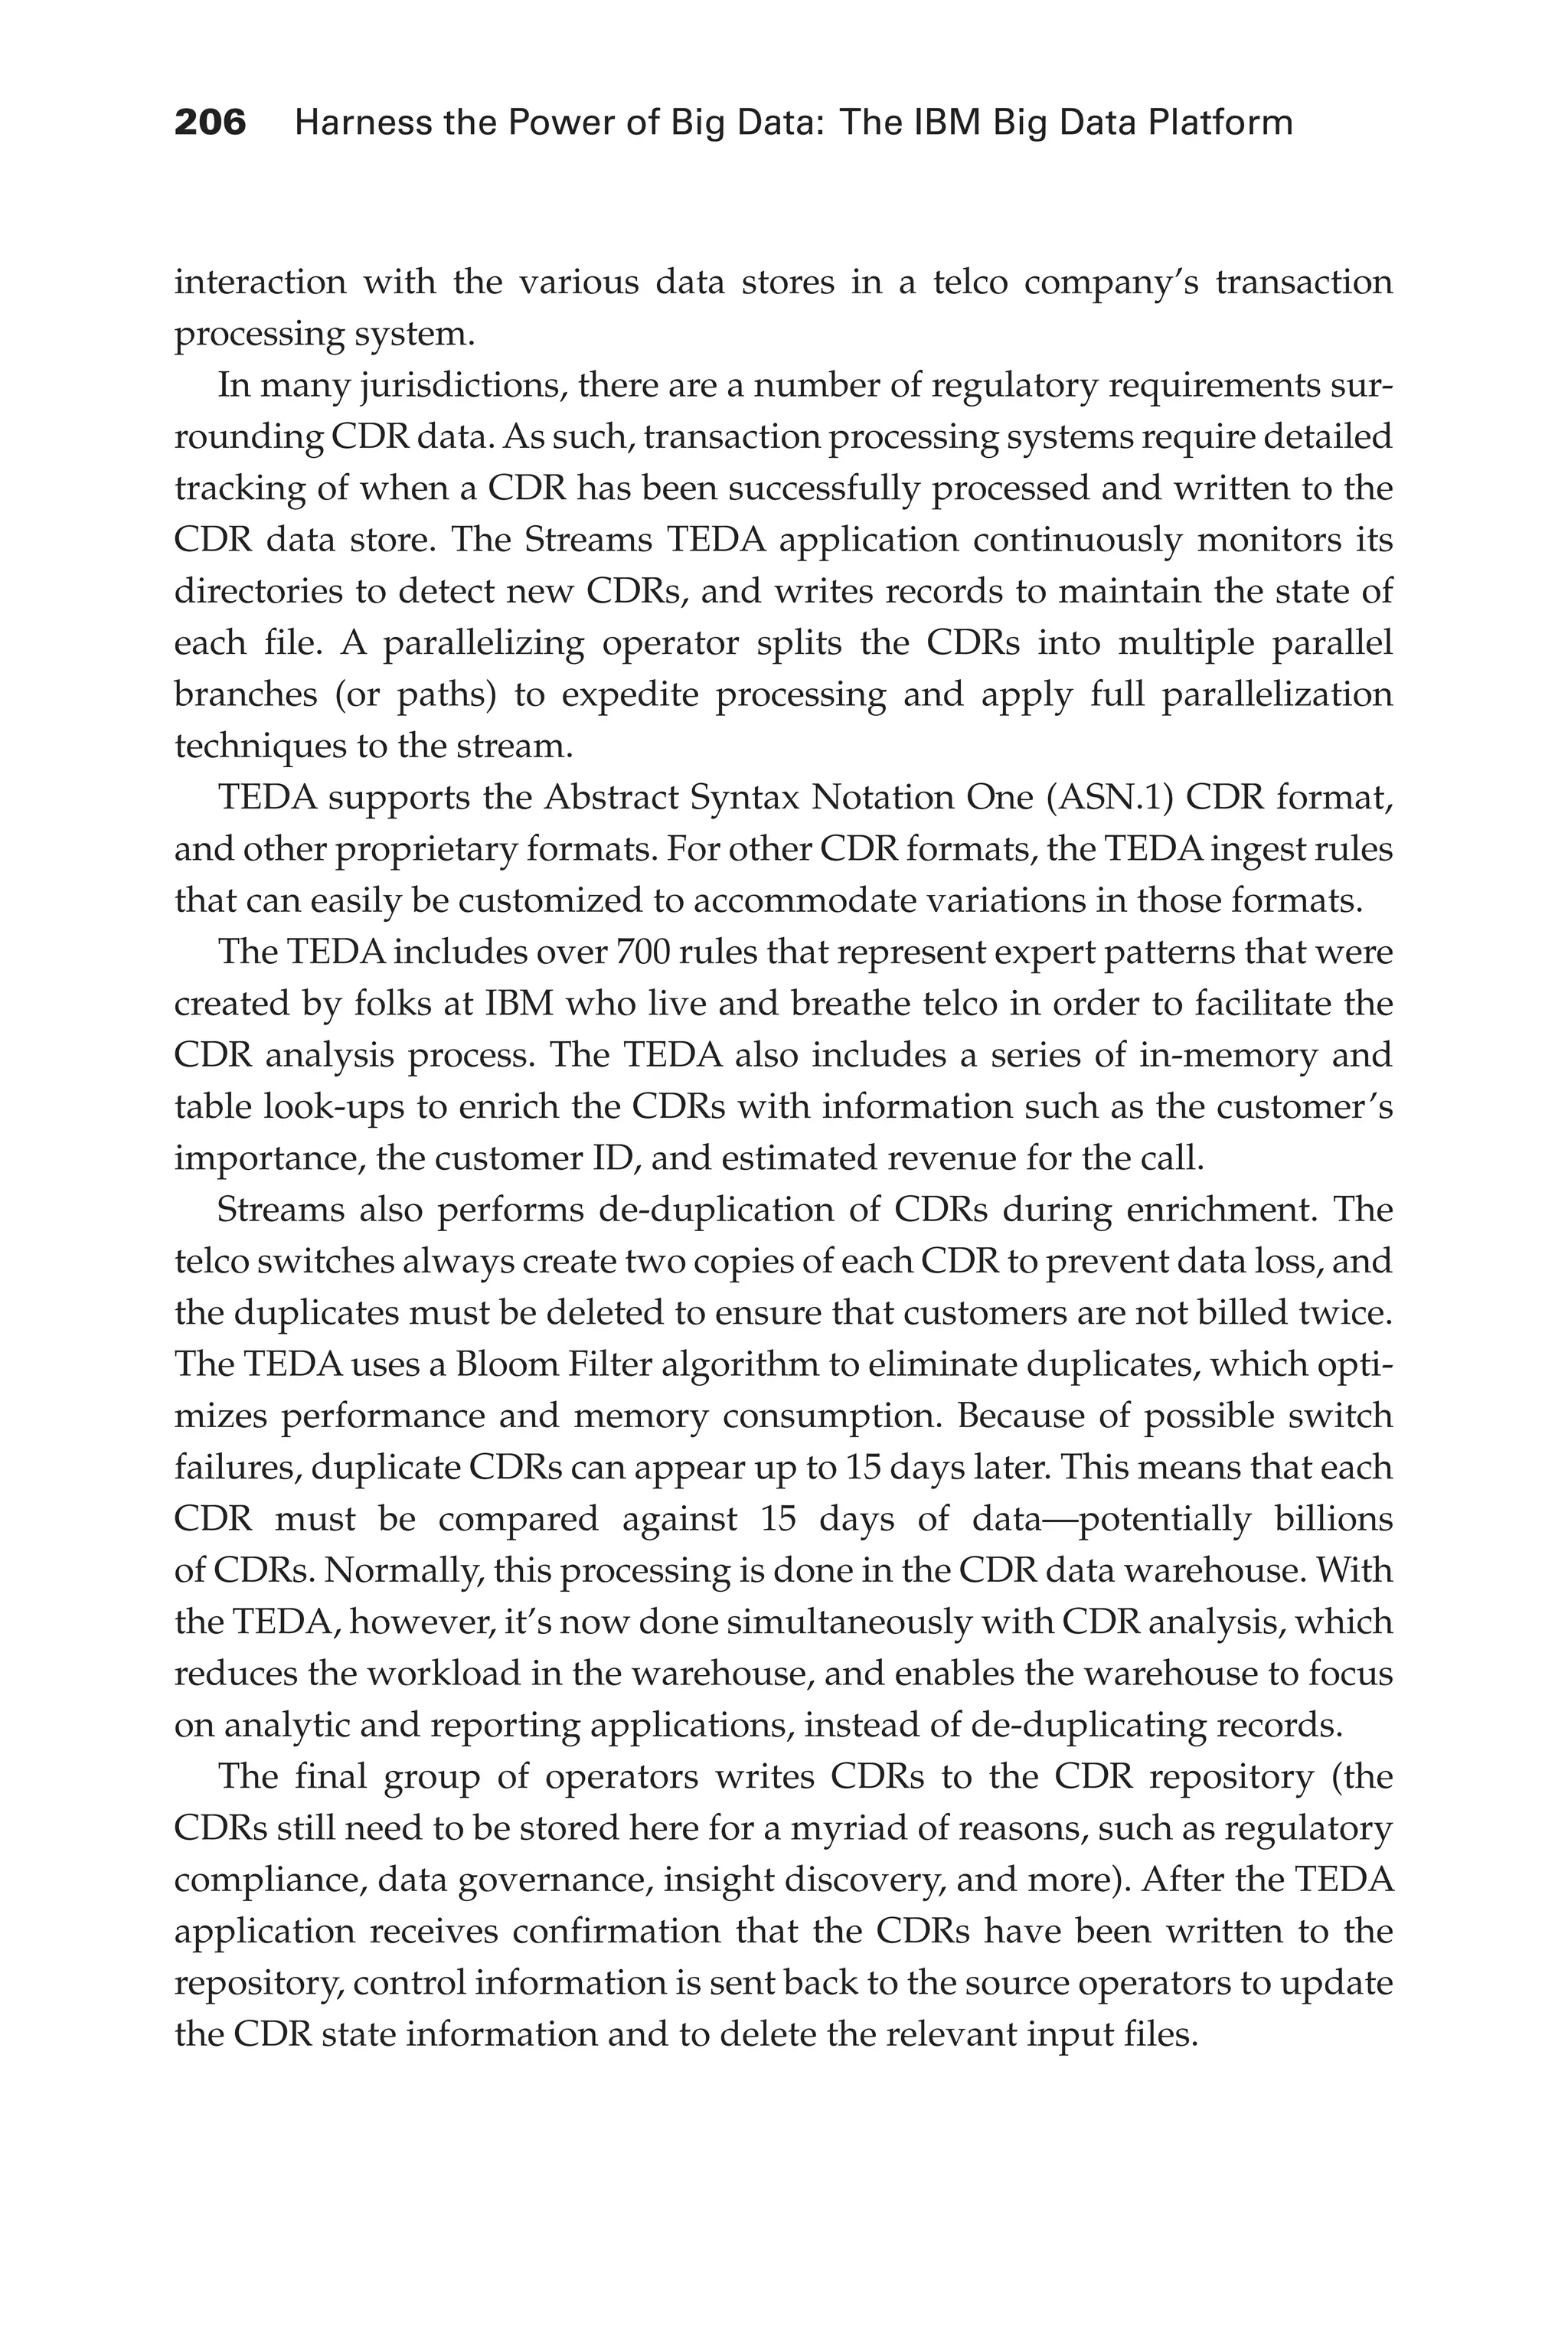
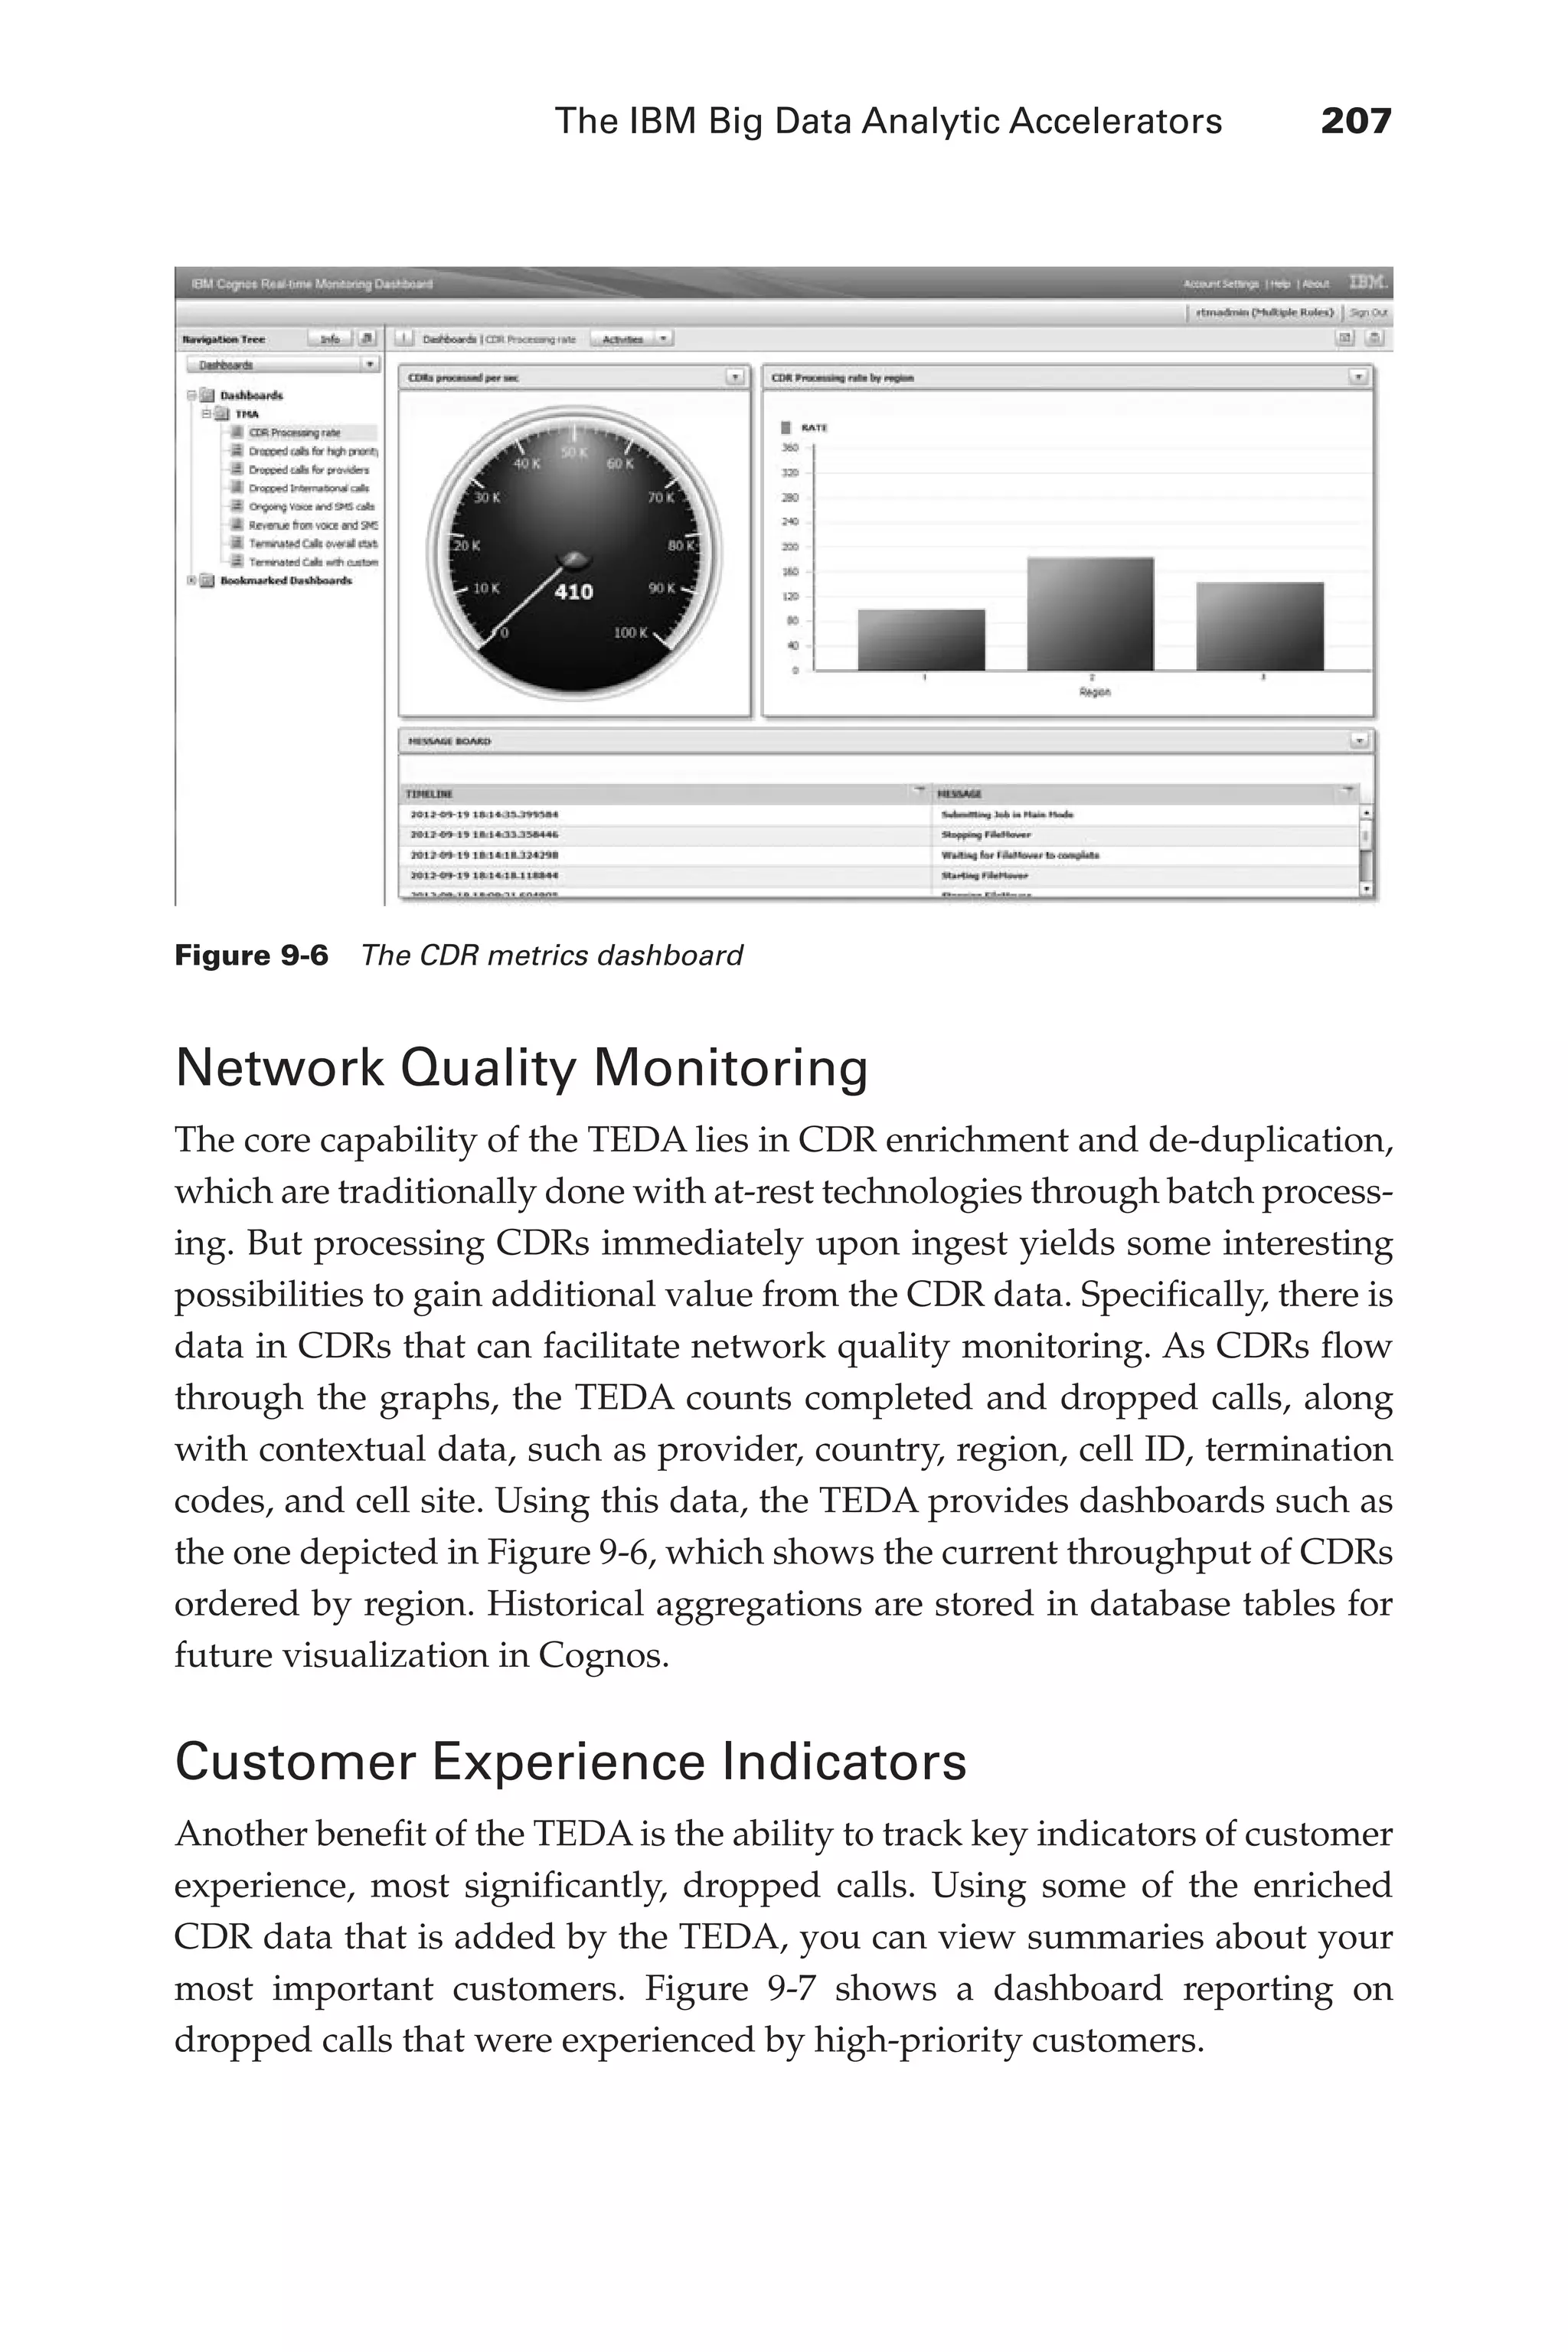

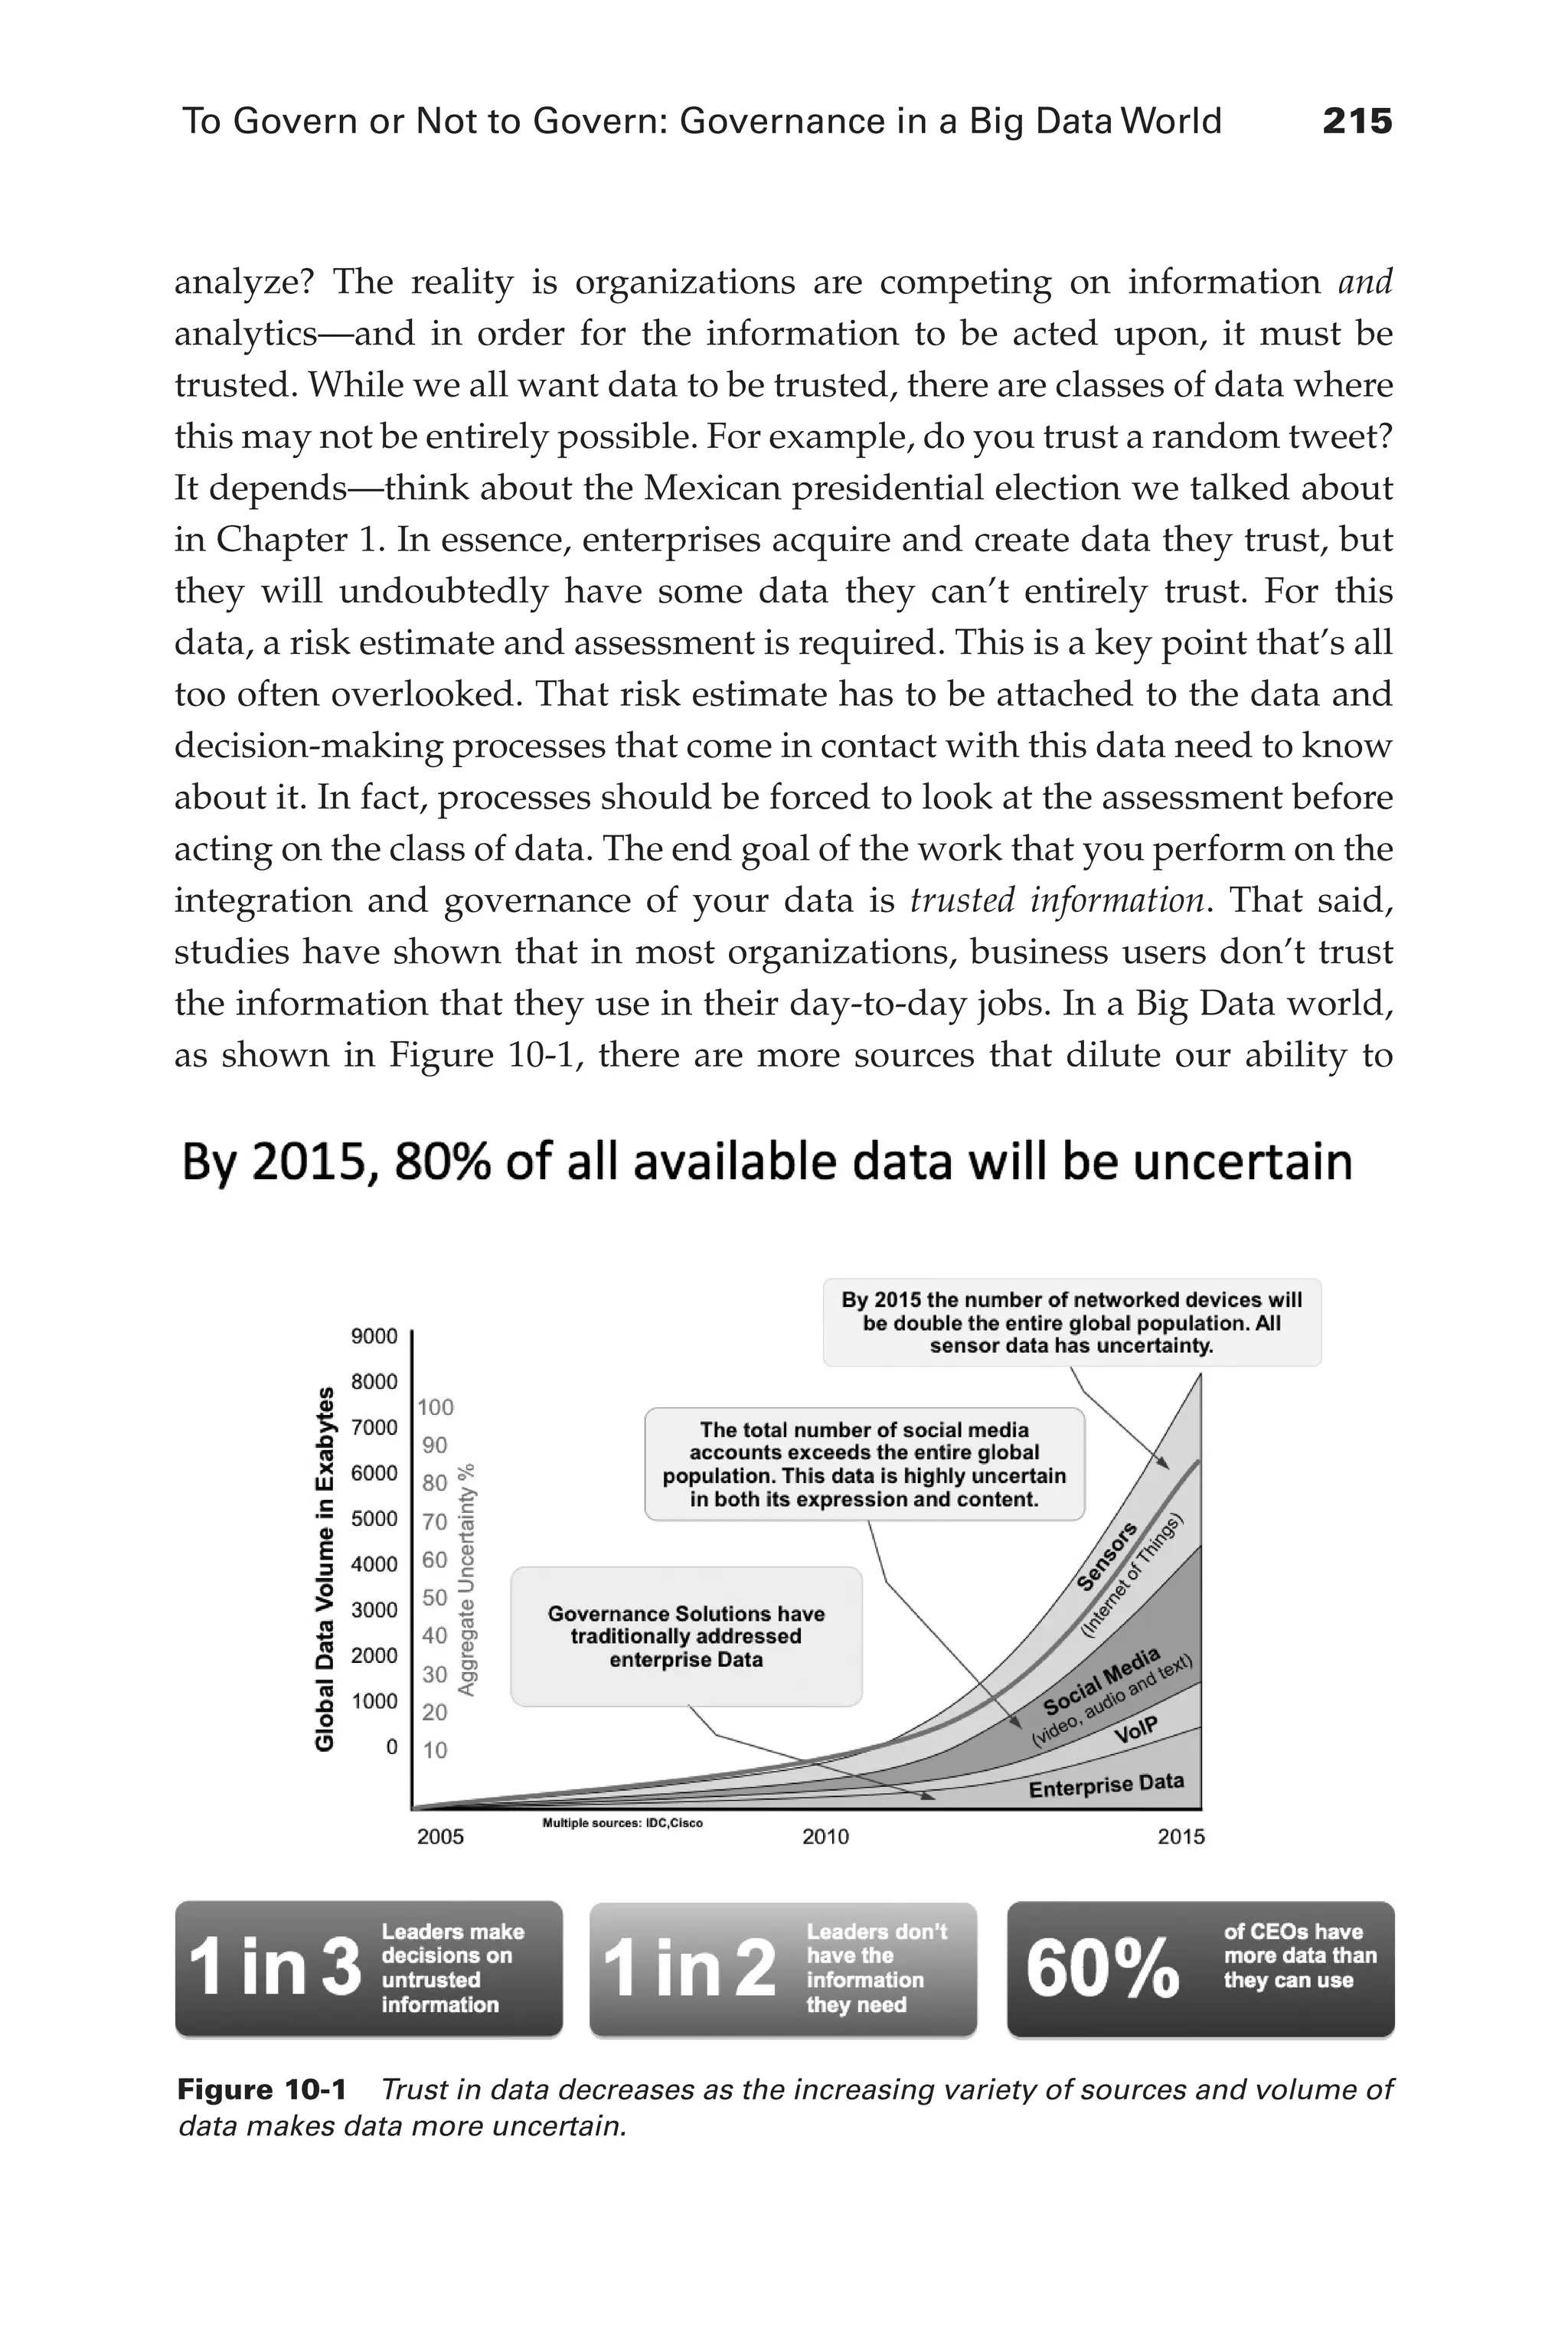
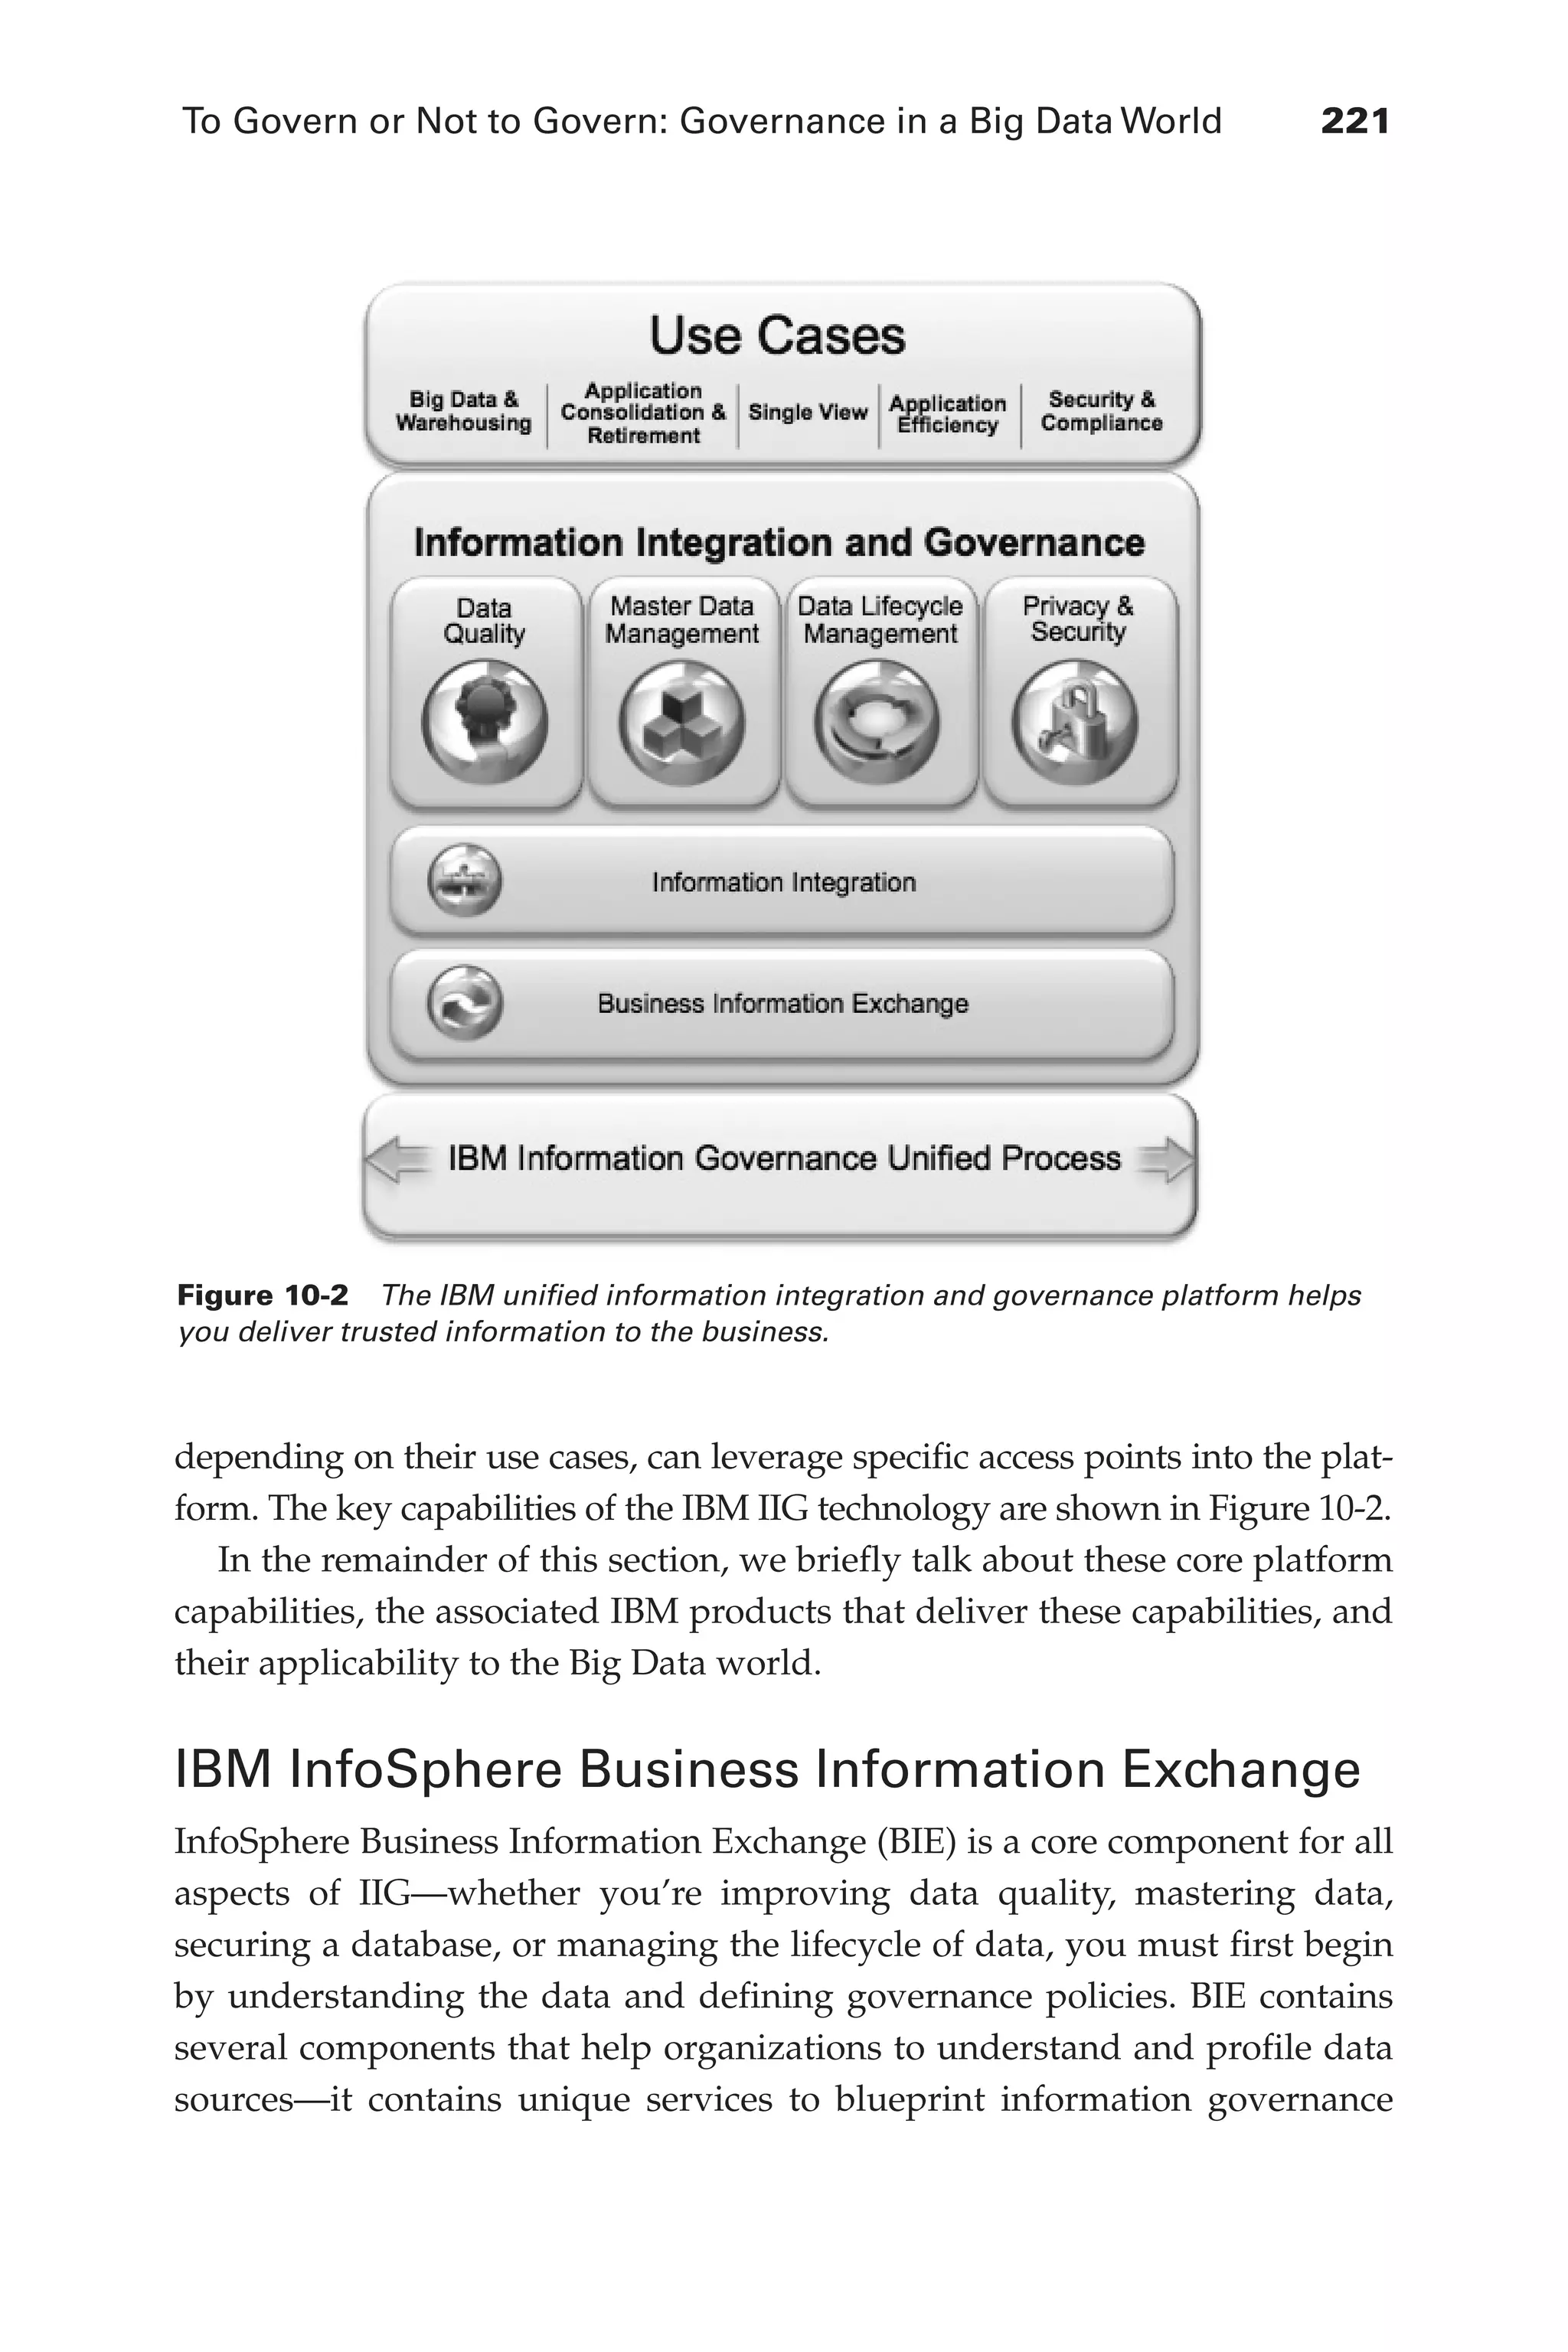
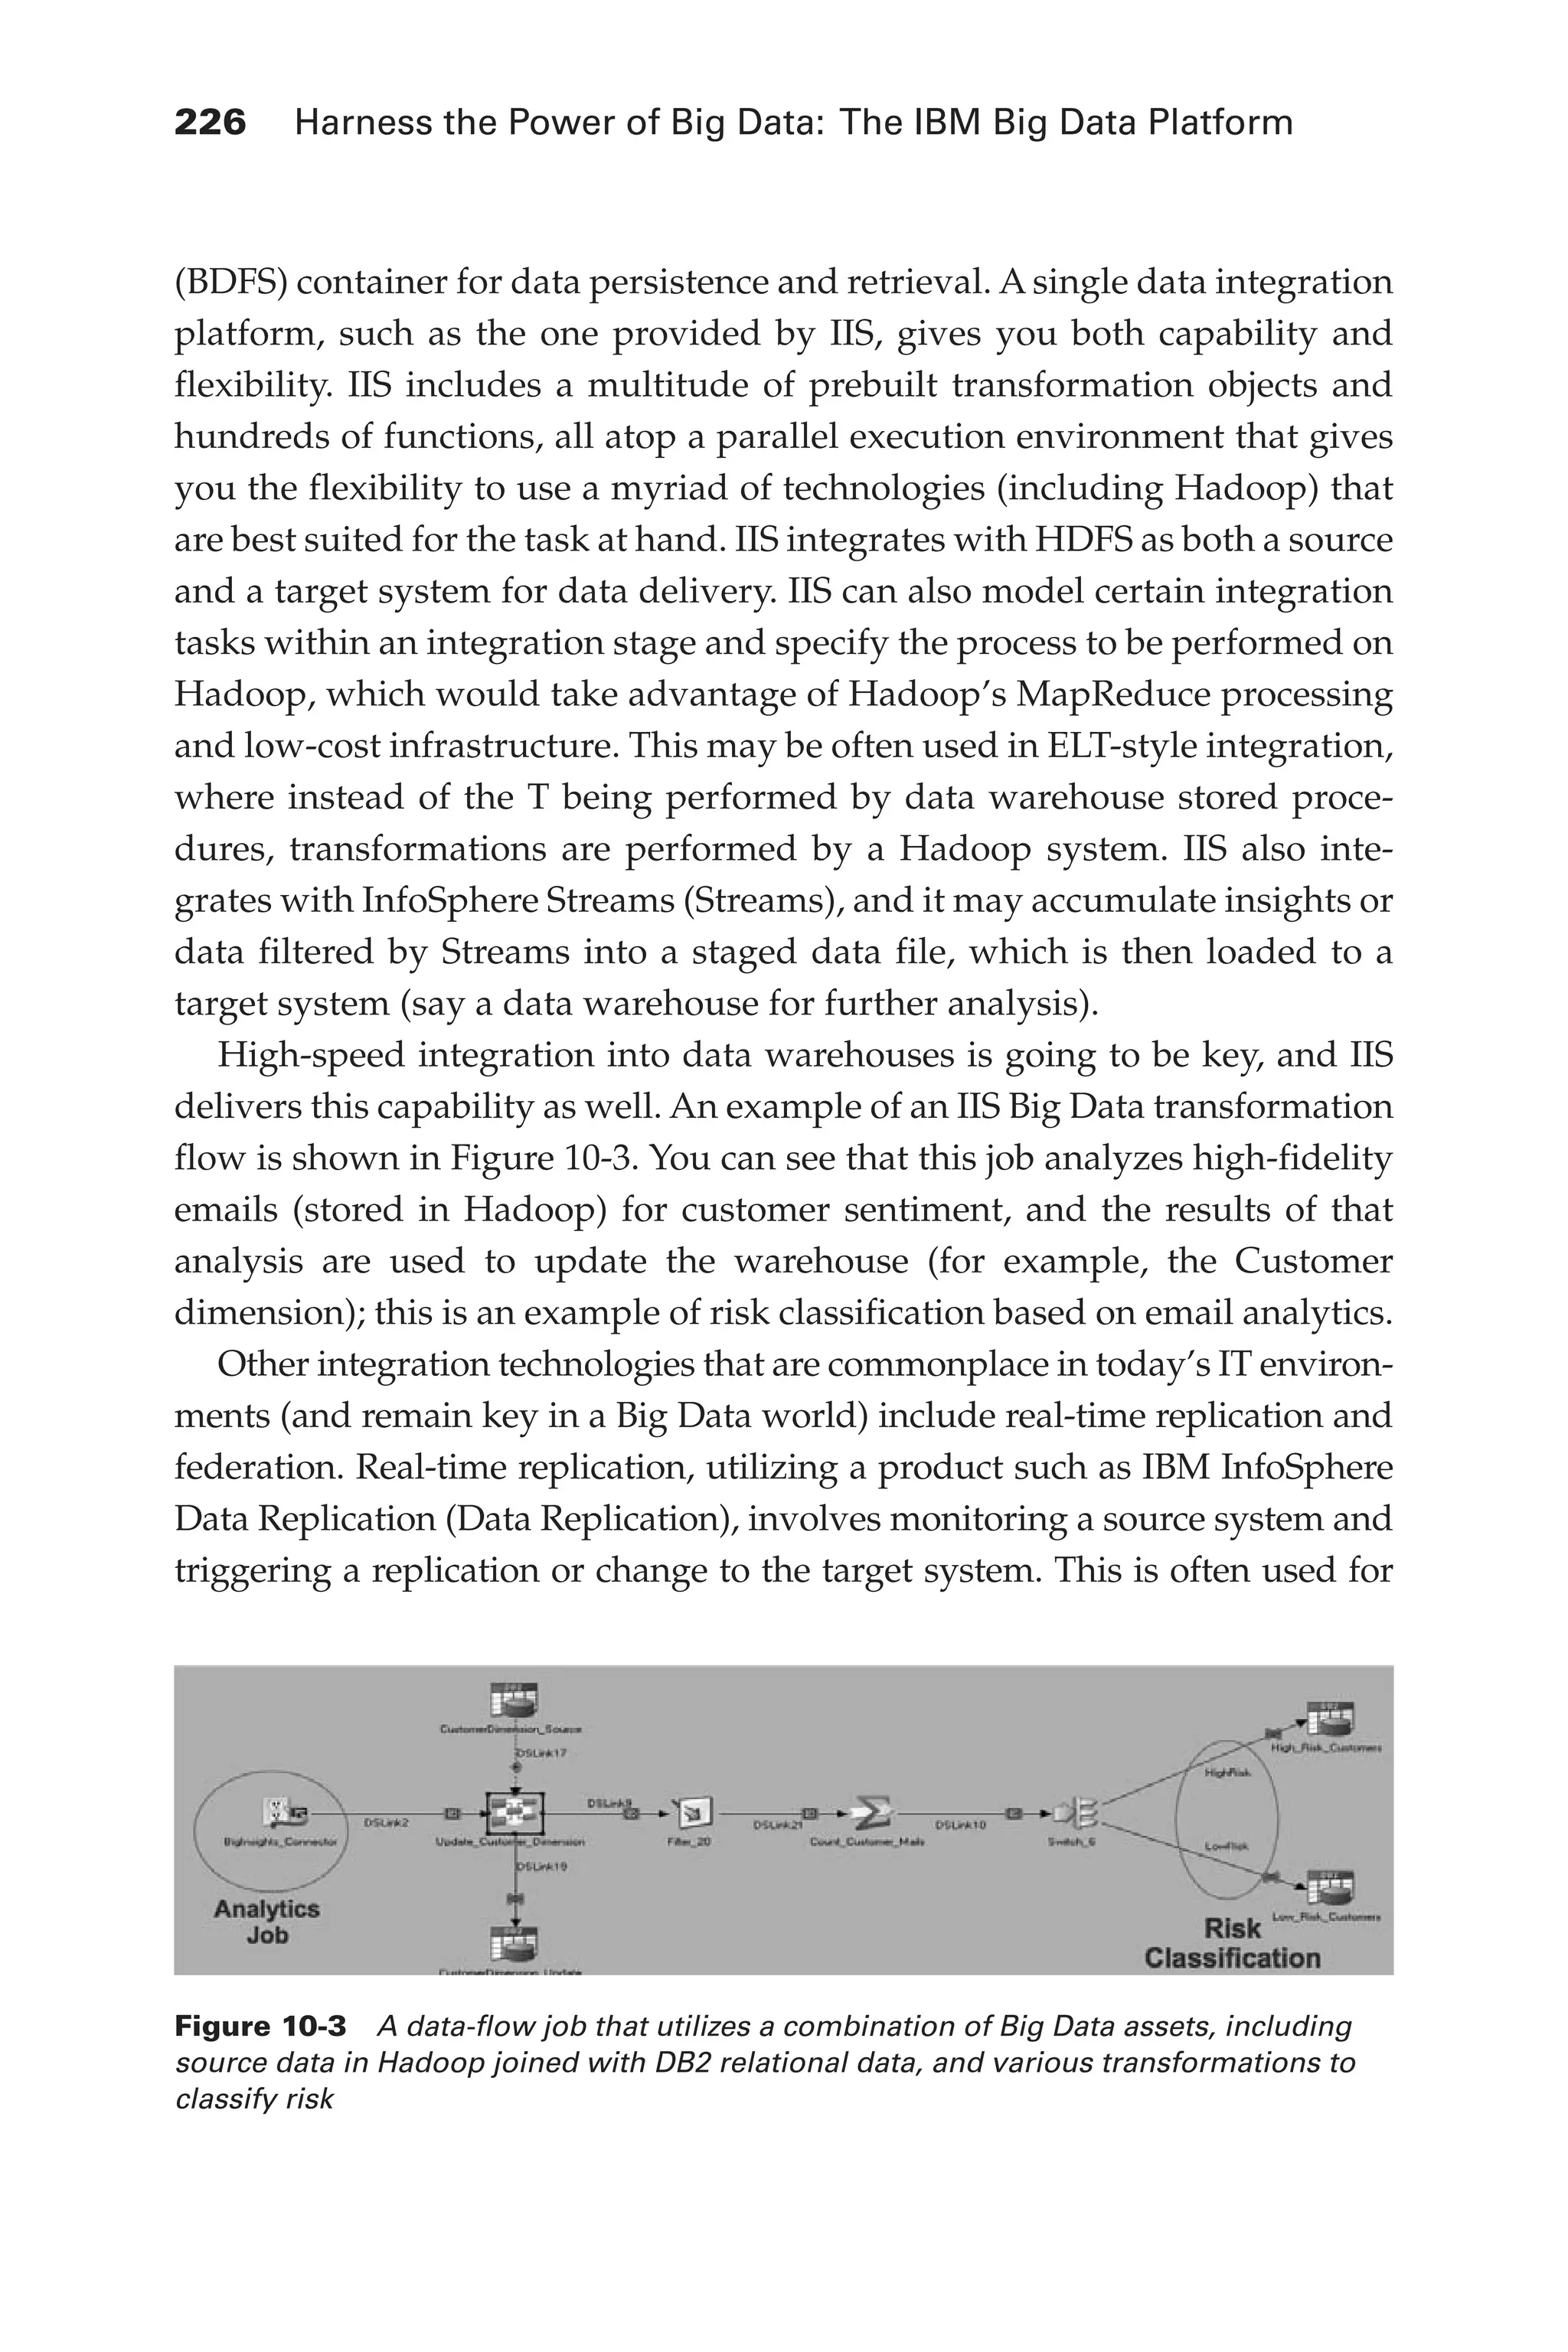
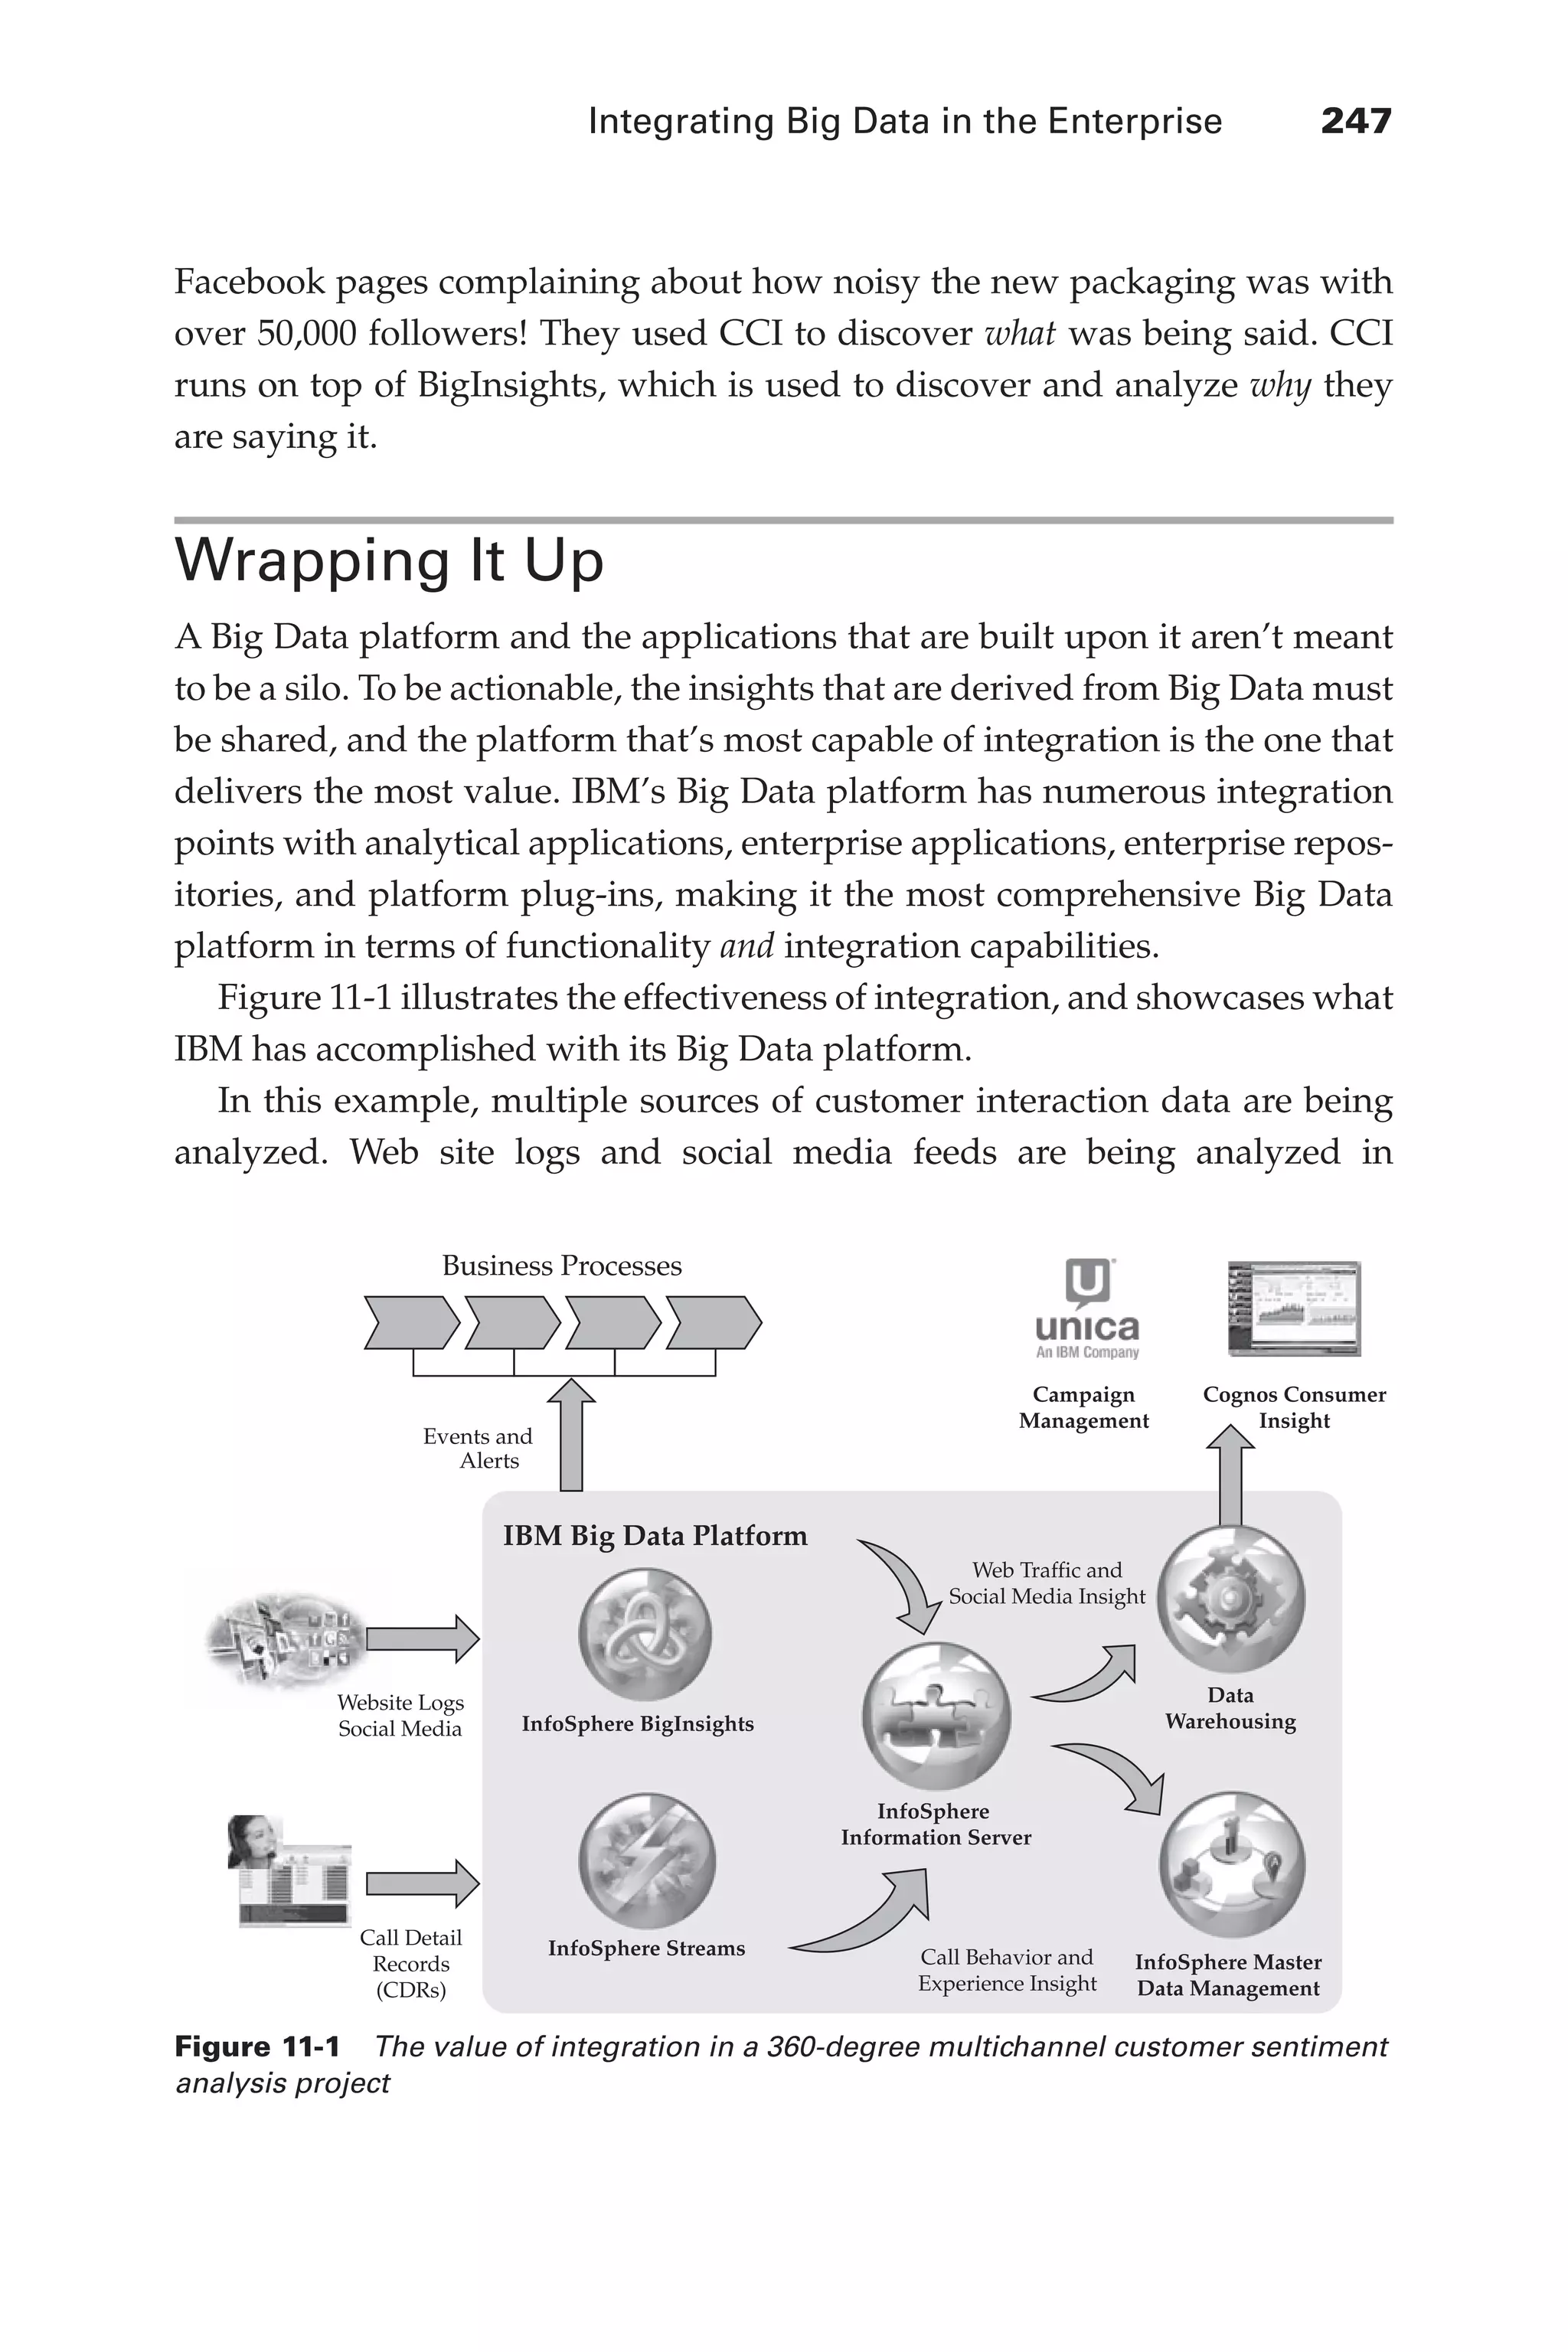


![[EN] From ECM Enterprise Content Management to EIM Enterprise Information Man...](https://cdn.slidesharecdn.com/ss_thumbnails/20090212ecmtoeimfujitsumarrakech3kffhandout-090306090559-phpapp01-thumbnail.jpg?width=640&height=640&fit=bounds)


![Coded Agents – with UiPath SDK + LangGraph [Virtual Hands-on Workshop]](https://cdn.slidesharecdn.com/ss_thumbnails/codedagentsdeck-251215155422-5497c599-thumbnail.jpg?width=640&height=640&fit=bounds)


