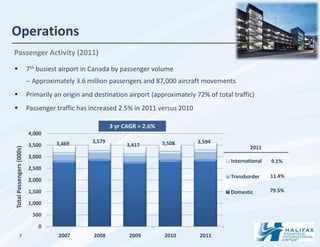
The document provides an overview of the Halifax International Airport Authority (HIAA). HIAA operates Halifax Stanfield International Airport, the 7th busiest airport in Canada by passenger volume. Some key points:
- HIAA has invested $400 million in capital improvements since 2000, including expanding facilities and upgrading infrastructure.
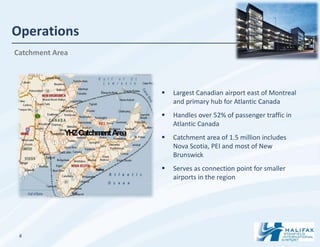
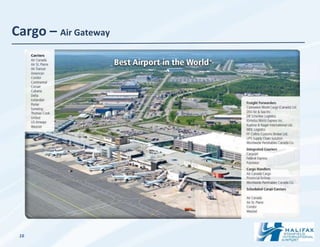
- The airport serves the Atlantic region as the largest airport east of Montreal, handling over 50% of passenger traffic in the region.
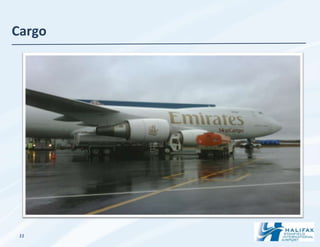
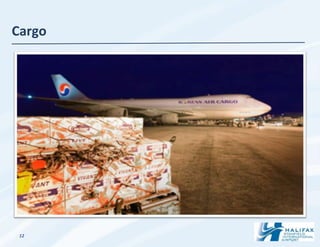
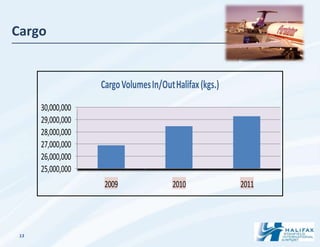
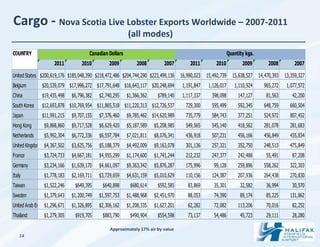
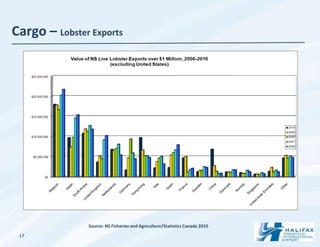
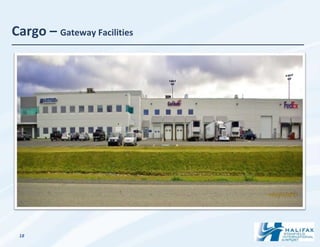
- Cargo is a major business, with over 25,000 tonnes handled annually. Live lobster exports to countries like the US and China are a key part of cargo operations.
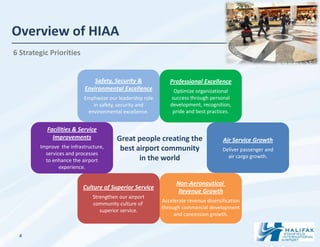
- HIAA has strategic priorities around safety, facilities improvements