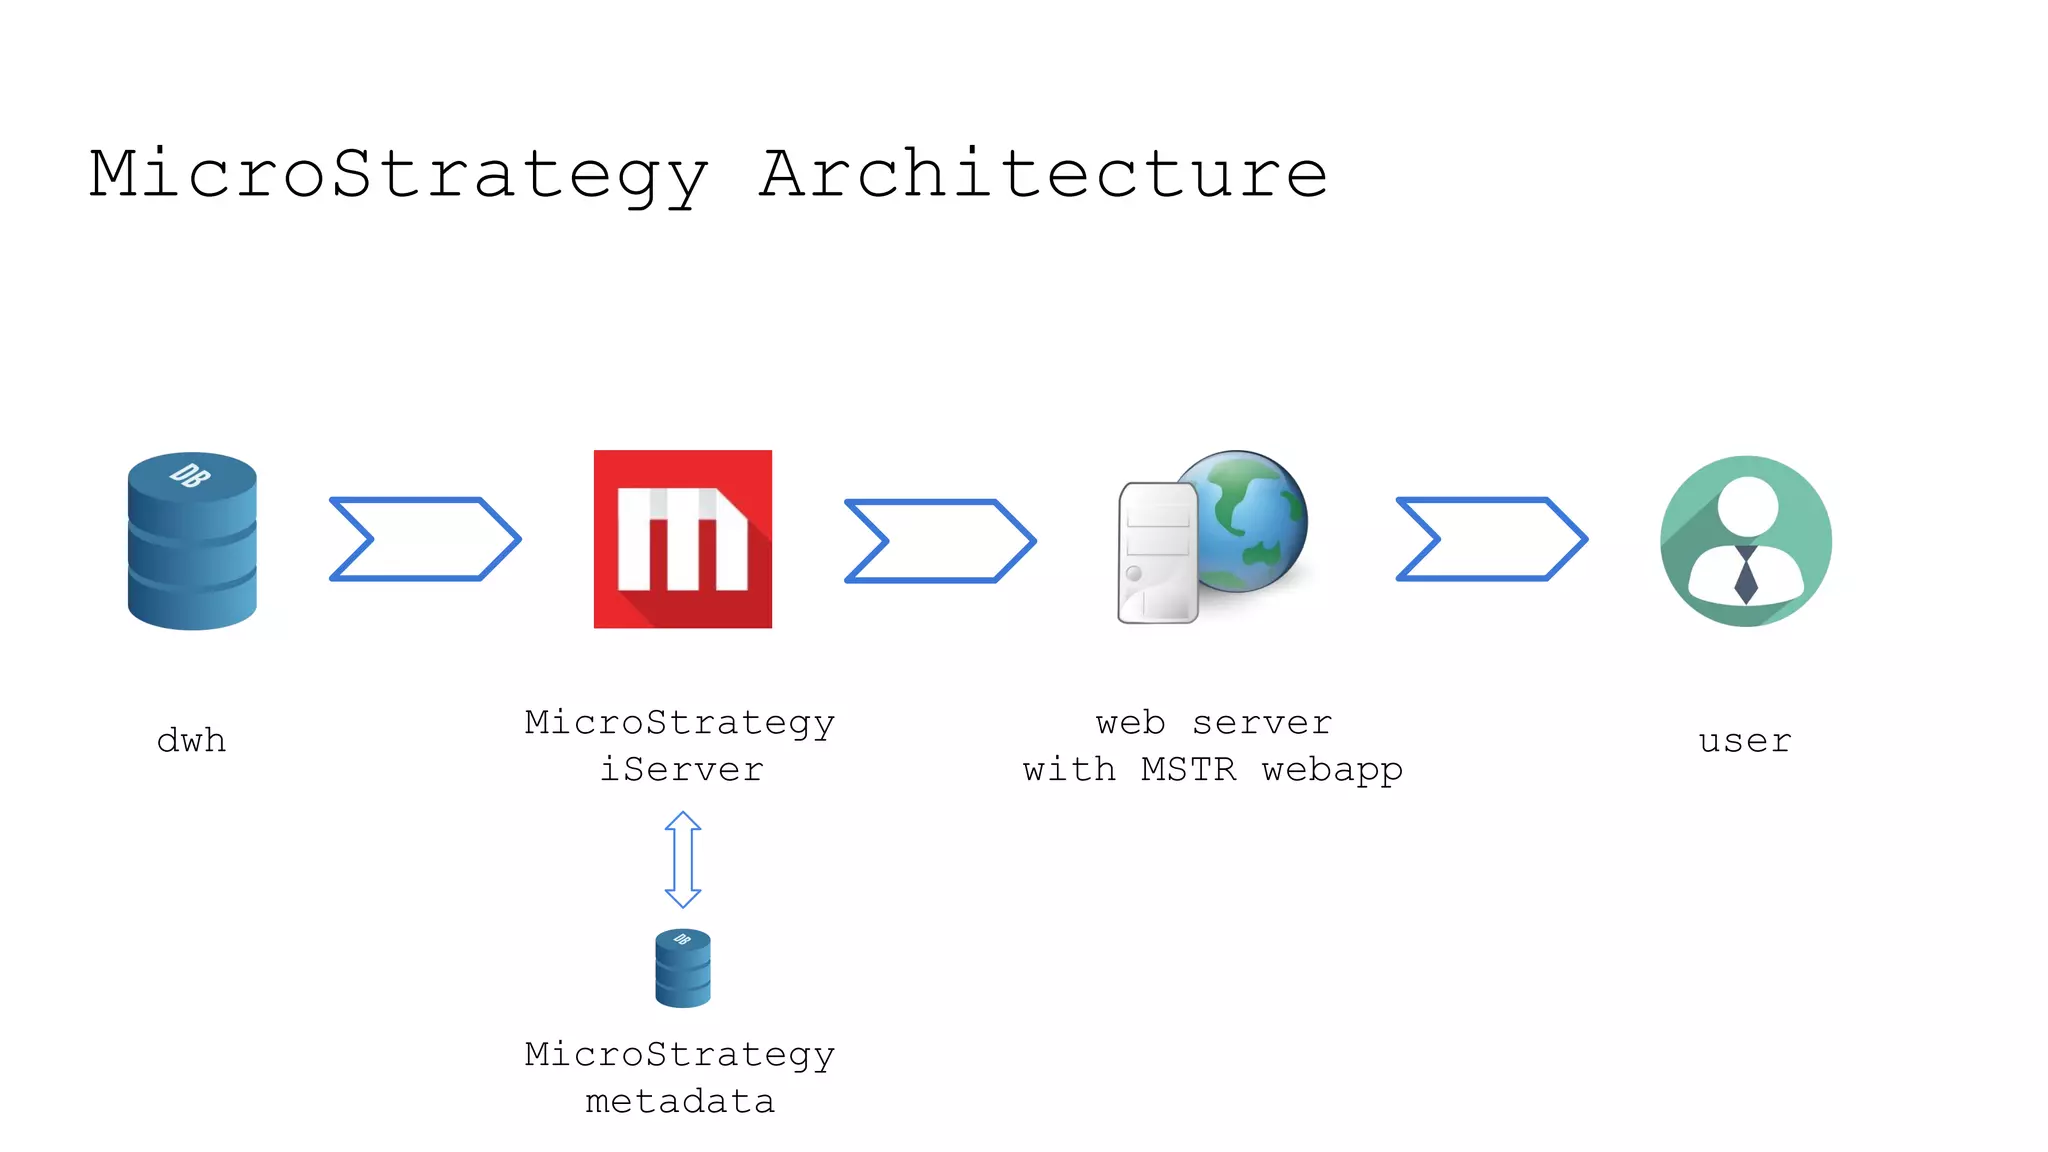
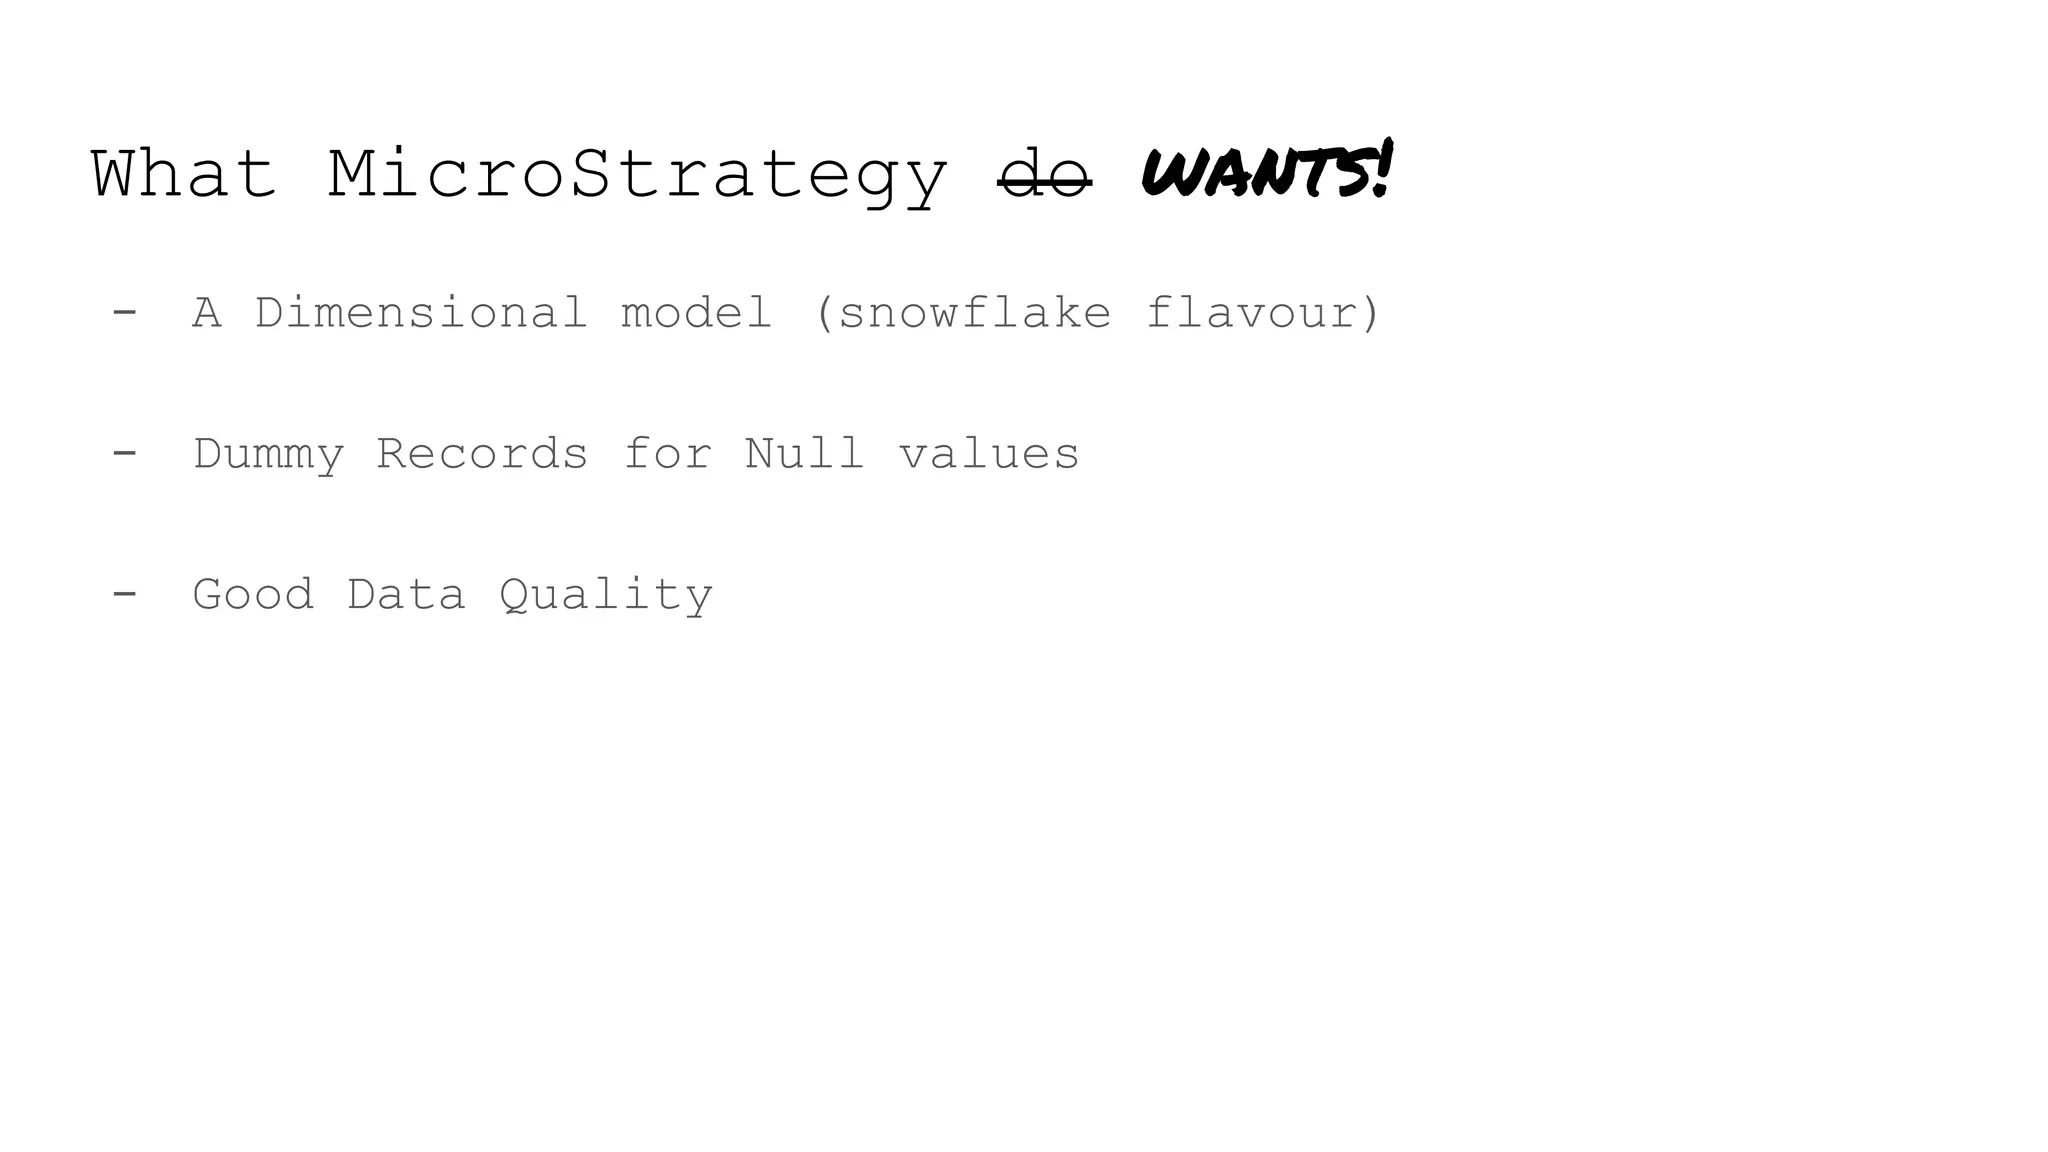
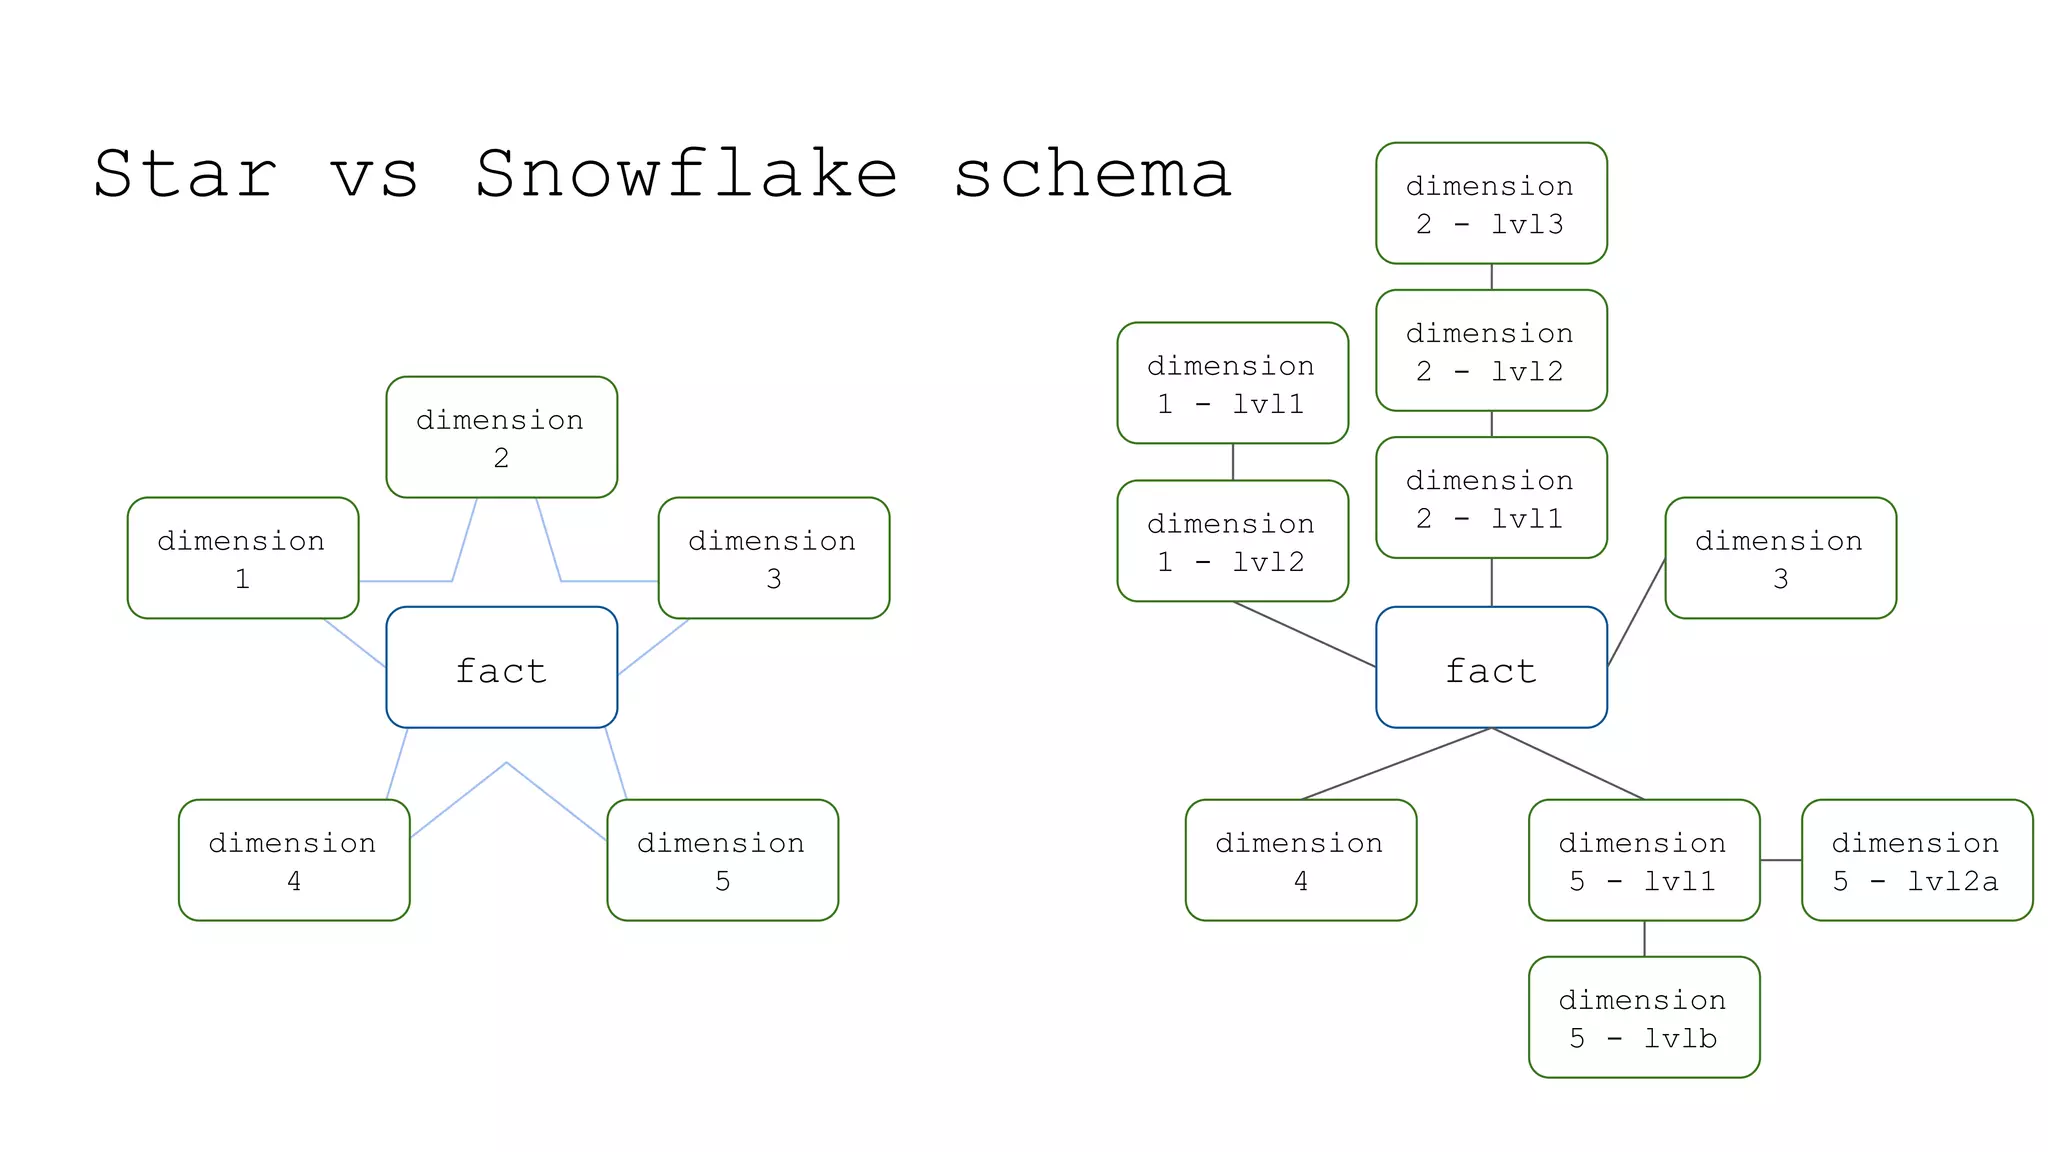
This document provides a summary of MicroStrategy, a business intelligence reporting tool. It discusses MicroStrategy's architecture, including its use of a dimensional data model and common table expressions in generated SQL. It also summarizes MicroStrategy objects like tables, attributes, metrics, reports, filters, intelligent cubes, and dashboards. Debugging tips are provided for interpreting MicroStrategy's generated SQL.
User can run queries via MicroStrategy’s visual interface without the need to write unfamiliar HiveQL or MapReduce scripts. In essence, any user, without programming skill in Hadoop, can ask questions against vast volumes of structured and unstructured data to gain valuable business insights.
Eyecademy's top 15 new features list for microstratevy version 10Eyecademy
Eyecademy is a premier UK Microstrategy consultancy. These slides, from our June 2016 Microstrategy Version 10 event, highlight some of the key new features from Microstrategy Version 9.
To download go to http://www.microstrategy.com/9/
In this presentation you'll find information about the following subjects:
- The MicroStrategy Architecture
- Extending the Performance, Scalability & Effeciency of Enterprise BI
- Enabling Rapid Deployment of Departemental BI
- Supporting Smooth Migration from Deparatemental Islands of BI to Enterprise BI
- MicroStrategy Products
World 2013 - Pushing MicroStrategy to the Limit, The Hacker WayBryan Brandow
This presentation was delivered jointly with two colleagues. The original slides have been stripped down and blog links have been added where videos used to be.
Watch this webinar in full here: https://buff.ly/2MVTKqL
Self-Service BI promises to remove the bottleneck that exists between IT and business users. The truth is, if data is handed over to a wide range of data consumers without proper guardrails in place, it can result in data anarchy.
Attend this session to learn why data virtualization:
• Is a must for implementing the right self-service BI
• Makes self-service BI useful for every business user
• Accelerates any self-service BI initiative
The Big Data Analytics Ecosystem at LinkedInrajappaiyer
LinkedIn has several data driven products that improve the experience of its users -- whether they are professionals or enterprises. Supporting this is a large ecosystem of systems and processes that provide data and insights in a timely manner to the products that are driven by it.
This talk provides an overview of the various components of this ecosystem which are:
- Hadoop
- Teradata
- Kafka
- Databus
- Camus
- Lumos
etc.
The importance of efficient data management for Digital TransformationMongoDB
Digital Transformation has developed from hype into a “standard” tool for businesses that need to modernise and compete. Experiencing pressure from new market entrants, incumbents are challenged on a daily basis to redefine their ways of doing business. This doesn’t only include people and processes, but of course also the underlying technology. With data being the force behind the most successful transformation stories in the past years, we are explored some of the challenges of legacy Information Management Systems, and look at new ways of managing Data in Motion, Data at Rest, and Data in Use to drive a successful Digital Transformation programme to gain a competitive advantage.
Data marts,Types of Data Marts,Multidimensional Data Model,Fact table ,Dimension table ,Data Warehouse Schema,Star Schema,Snowflake Schema,Fact-Constellation Schema
Online SAP BO 4.2 Training
Ashok
Contact numbers : +91 9972971235,
+91-9663233300(India)
Email Id : Madhukar.dwbi@gmail.com
Website:http://onlinebusinessobjectstraining.com
An introduction to data virtualization in business intelligenceDavid Walker
A brief description of what Data Virtualisation is and how it can be used to support business intelligence applications and development. Originally presented to the ETIS Conference in Riga, Latvia in October 2013
Data Mesh in Practice - How Europe's Leading Online Platform for Fashion Goes...Dr. Arif Wider
A talk presented by Max Schultze from Zalando and Arif Wider from ThoughtWorks at NDC Oslo 2020.
Abstract:
The Data Lake paradigm is often considered the scalable successor of the more curated Data Warehouse approach when it comes to democratization of data. However, many who went out to build a centralized Data Lake came out with a data swamp of unclear responsibilities, a lack of data ownership, and sub-par data availability.
At Zalando - europe’s biggest online fashion retailer - we realised that accessibility and availability at scale can only be guaranteed when moving more responsibilities to those who pick up the data and have the respective domain knowledge - the data owners - while keeping only data governance and metadata information central. Such a decentralized and domain focused approach has recently been coined a Data Mesh.
The Data Mesh paradigm promotes the concept of Data Products which go beyond sharing of files and towards guarantees of quality and acknowledgement of data ownership.
This talk will take you on a journey of how we went from a centralized Data Lake to embrace a distributed Data Mesh architecture and will outline the ongoing efforts to make creation of data products as simple as applying a template.
BigdataConference Europe - BigQuery MLMárton Kodok
One of the hottest topics in database land these days is BigQuery ML. A new way to use machine learning on top of tabular data straight on your tables without leaving the query editor.
With BigQuery ML, you can build machine learning models without leaving the database environment and training it on massive datasets.
In this demo session, we are going to demonstrate common marketing Machine Learning use cases how to build, train, eval and predict, your own scalable machine learning models using SQL language.
The audience will get first hand experience how to write CREATE MODEL sql syntax to build machine learning models such as:
– Multiclass logistic regression for classification
– K-means clustering
– Matrix factorization
– ARIMA time series predictions
– Import TensorFlow models for prediction in BigQuery
Models are trained and accessed in BigQuery using SQL — a language data analysts know. This enables business decision making through predictive analytics across the organization without leaving the query editor.
To learn how to run a report, it is essential trainees take up the Workday Report training where the users will learn about Report Data Sources, Reporting Resources, Business Objects, Fields and much more.
Applying BigQuery ML on e-commerce data analyticsMárton Kodok
With BigQuery ML, you can build machine learning models without leaving the database environment and training it on massive datasets. We are going to demonstrate common marketing Machine Learning use cases we do at REEA.net to build, train, eval and predict, your own scalable machine learning models using SQL language in Google BigQuery and to address the following use cases:
Customer Segmentation
Customer Lifetime Value (LTV) prediction
Conversion/Purchase prediction
The audience will get first hand experience how to write CREATE MODEL sql syntax to build machine learning models such as:
Multiclass logistic regression for classification
K-means clustering
Import TensorFlow models for prediction in BigQuery
Models are trained and accessed in BigQuery using SQL — a language data analysts know. This enables business decision making through predictive analytics across the organization without leaving the query editor
Pysyvästi laadukasta masterdataa SmartMDM:n avullaBilot
1.9.2016 aamiaistilaisuuden esitys.
Mitäpä jos valjastaisit koko organisaatio masterdatan ylläpitoon? Hallitsisit hajauttamalla? Uudistunut SmartMDM tuo käyttöösi hallinnan, Microsoft SQL Server Master Data Services (MDS) keskityksen.
Lisää tapahtumiamme sivustollamme: http://www.bilot.fi/en/events/
BigQuery ML - Machine learning at scale using SQLMárton Kodok
With BigQuery ML, you can build machine learning models without leaving the data warehouse environment and training it on massive datasets. We are going to demonstrate how to build, train, eval and predict, your own scalable machine learning models using standard SQL language in Google BigQuery.
We will see how can we use CREATE MODEL sql syntax to build different models such as:
-Linear regression
-Multiclass logistic regression for classification
-K-means clustering
-Import TensorFlow models for prediction in BigQuery
We will see how we can apply these models on tabular data in retail and marketing use cases.
Models are trained and accessed in BigQuery using SQL — a language data analysts know. This enables business decision making through predictive analytics across the organization without leaving the query editor.
User Case of Migration from MicroStrategy to Power BIGreenM
На Data Monsters Руслан Золотухин, Power BI Trainer & Consultant, описал юзкейсы при переносе отчетов из MicroStrategy в Power BI, рассказал о миграционной стратегии и функциях MicroStrategy, которые пугают всех BI девелоперов.
MOPs & ML Pipelines on GCP - Session 6, RGDCgdgsurrey
MLOps Lifecycle
ML problem framing
ML solution architecture
Data preparation and processing
ML model development
ML pipeline automation and orchestration
ML solution monitoring, optimization, and maintenance
BigQuery ML - Machine learning at scale using SQLMárton Kodok
With BigQuery ML, you can build machine learning models without leaving the data warehouse environment and training it on massive datasets. We are going to demonstrate how to build, train, eval and predict, your own scalable machine learning models using standard SQL language in Google BigQuery.
We will see how can we use CREATE MODEL sql syntax to build different models such as:
Linear regression
Multiclass logistic regression for classification
K-means clustering
Import TensorFlow models for prediction in BigQuery
We will see how we can apply these models on tabular data in retail and marketing use cases.
Models are trained and accessed in BigQuery using SQL — a language data analysts know. This enables business decision making through predictive analytics across the organization without leaving the query editor.
Supercharge your data analytics with BigQueryMárton Kodok
Powering interactive data analysis require massive architecture, and Know-How to build a fast real-time computing system. BigQuery solves this problem by enabling super-fast, SQL-like queries against petabytes of data using the processing power of Google’s infrastructure. We will cover its core features, creating tables, columns, views, working with partitions, clustering for cost optimizations, streaming inserts, User Defined Functions, and several use cases for everydaay developer: funnel analytics, behavioral analytics, exploring unstructured data.
The other part will be about BigQuery ML, which enables users to create and execute machine learning models in BigQuery using standard SQL queries. BigQuery ML democratizes machine learning by enabling SQL practitioners to build models using existing SQL tools and skills. BigQuery ML increases development speed by eliminating the need to move data.
8. MicroStrategy Schema - Tables
A MicroStrategy Tables maps a
database table or view.
Multiple physical tables can be
mapped as partition of a
MicroStrategy table.
9. MicroStrategy Schema - Logical Tables
A Logical Table allows to use a
query as a table.
In the definition you must:
- Set the database instance to use
- Map all the columns returned by
you query
10. MicroStrategy Schema - Attributes
- A level of a Dimension.
- Needs a lookup table.
- Can have parents and children.
- Has multiple forms.
- Each form can have multiple
expressions.
11. MicroStrategy Schema - Facts
A numeric* value that needs to be
measured by the business.
Can have multiple expressions.
Doesn’t know how it will be used.
Can be extended, if required.
* usually
12. MicroStrategy Schema - Facts
A numeric* value that needs to be
measured by the business.
Can have multiple expressions.
Doesn’t know how it will be used.
Can be extended, if required.
* usually
13. MicroStrategy Schema - Advanced topics
Expressions can contain intra-row operations.
Expressions can contain 1-1 functions.
Attributes determine the Logical Weight of a table.
Transformations defines ways to transform an attribute
element to one or more elements of the same attribute:
i.e. Previous Year or Year-to-date.
14. MicroStrategy Metrics
A Fact defines which column of
which table we want to use.
A Metric defines what, how,
where, when to do with that
fact/column.
15. MicroStrategy Metrics
How to aggregate?
The Formula defines the kind
of aggregation we want to use.
Metrics can be compound of
other metrics:
Profit = Revenue - Cost
16. MicroStrategy Metrics
Where to aggregate?
The Level allows to fine tune
the aggregation, depending on
attributes/dimension.
Filtering: ignore or not a
where condition?
Grouping: aggregate using the
standard grouping or not.
17. MicroStrategy Metrics
When to aggregate?
Condition: a where condition.
This can become a CASE statement or a
separated sub-query.
Transformation: a rule to
transform an attribute value
19. MicroStrategy Reports
OLAP capabilities:
- Moving objects in template
- Moving objects between Report
object and template
- Modify the View Filters
Non-OLAP:
- Add new objects
- Change the Report Filter
20. MicroStrategy Reports: SQL
...
Pass0 - Query Pass Start Time: 09/06/2016 23:22:50
Query Pass End Time: 09/06/2016 23:22:52
Query Execution: 0:00:01.78
Data Fetching and Processing: 0:00:00.00
Data Transfer from Datasource(s): 0:00:00.00
Other Processing: 0:00:00.02
Rows selected: 131
with gopa1 as
(select /*Administrator - job 1049 - New Report - 20160609:232250*/ a13.PROFILE_GENDER_ID
PROFILE_GENDER_ID,
a12.ACQUISITION_BRAND ACQUISITION_BRAND,
a11.PROFILE_REGISTERED_DT Reporting_Date_DT,
count(distinct a11.PROFILE_USER_ID) n_users
from MICRO.MS_F_PROFILE_REGISTRATION a11
...
For the full SQL code click here.
21. MicroStrategy Intelligent Cubes
In memory copy of a query result.
Can be also partially re-published.
A report based on an Intelligent Cubes:
- has access only to that cube objects
- generates an MDX query
Dynamic Sourcing allows also not cube-based reports to use
available cubes.
22. MicroStrategy Reports - Free Form SQL
A FFSQL is a report created
starting from an existing query.
Very good for prototyping
Very bad for maintenance
You can also have FFSQL cubes.
23. MicroStrategy Reports - Free Form SQL
Things to define:
- Database Instance
- Query
- Free form objects
24. MicroStrategy Filters
Filters are like where
conditions.
Multiple filters can be
combined, using AND,
OR, and NOT, to make
complex ones.
25. MicroStrategy Filters: Advanced
Reports can be used as
filters.
Set Qualification are
used to filter
attributes based on
elements not always
present in the final
report.
26. MicroStrategy Filters: Advanced
gopa1 as
(select /*Administrator - job 2158 - All TYPE REG Active with Revenue - 20160610:132345*/ a11.PROFILE_USER_ID PROFILE_USER_ID
from MICRO.MS_F_PROFILE_REGISTRATION a11
group by a11.PROFILE_USER_ID
having sum(a11.PROFILE_PHOTOS_TOTAL_COUNT) >= 3.0
),
gopa9 as
(select /*Administrator - job 2158 - All TYPE REG Active with Revenue - 20160610:132345*/ a15.REGISTRATION_METHOD REGISTRATION_METHOD,
a13.PROFILE_REGISTERED_DT first_click_date,
a14.ACQUISITION_BRAND ACQUISITION_BRAND,
a14.ACQUISITION_TRANSLATION ACQUISITION_TRANSLATION,
a13.PROFILE_GENDER_ID PROFILE_GENDER_ID,
count(distinct a11.PROFILE_USER_ID) WJXBFS1
from INGRES.MS_DIM_PROFILE a11
join gopa1 pa12
on (a11.PROFILE_USER_ID = pa12.PROFILE_USER_ID)
join INGRES.MS_DIM_PROFILE a13
on (a11.PROFILE_USER_ID = a13.PROFILE_USER_ID)
join ingres.DIM_ACQUISITION_PLATFORM a14
on (a13.PROFILE_ACQUISITION_PLATFORM = a14.ACQUISITION_PLATFORM)
join ingres.MS_DIM_PROFILE_EXTRA a15
on (a11.PROFILE_USER_ID = a15.PROFILE_USER_ID)
where (a13.PROFILE_REGISTERED_DT >= DATE '2016-01-01'
and a13.PROFILE_IS_TEST_USER_ID = 0
and a14.ACQUISITION_TRANSLATION in ('Android', 'iOS', 'Webapp', 'Windows')
and a14.ACQUISITION_BRAND in ('Badoo'))
group by a15.REGISTRATION_METHOD,
a13.PROFILE_REGISTERED_DT,
a14.ACQUISITION_BRAND,
a14.ACQUISITION_TRANSLATION,
a13.PROFILE_GENDER_ID
)
29. MicroStrategy Dashboards
A dashboard has at least one tab.
A tab has one or more panels.
A panel contains visualizations.
Each visualization is based on one
or more datasets.
30. MicroStrategy Dashboards
A dashboard has at least one tab.
A tab has one or more panels.
A panel contains visualizations.
Each visualization is based on one
or more datasets.
31. MicroStrategy Debugging
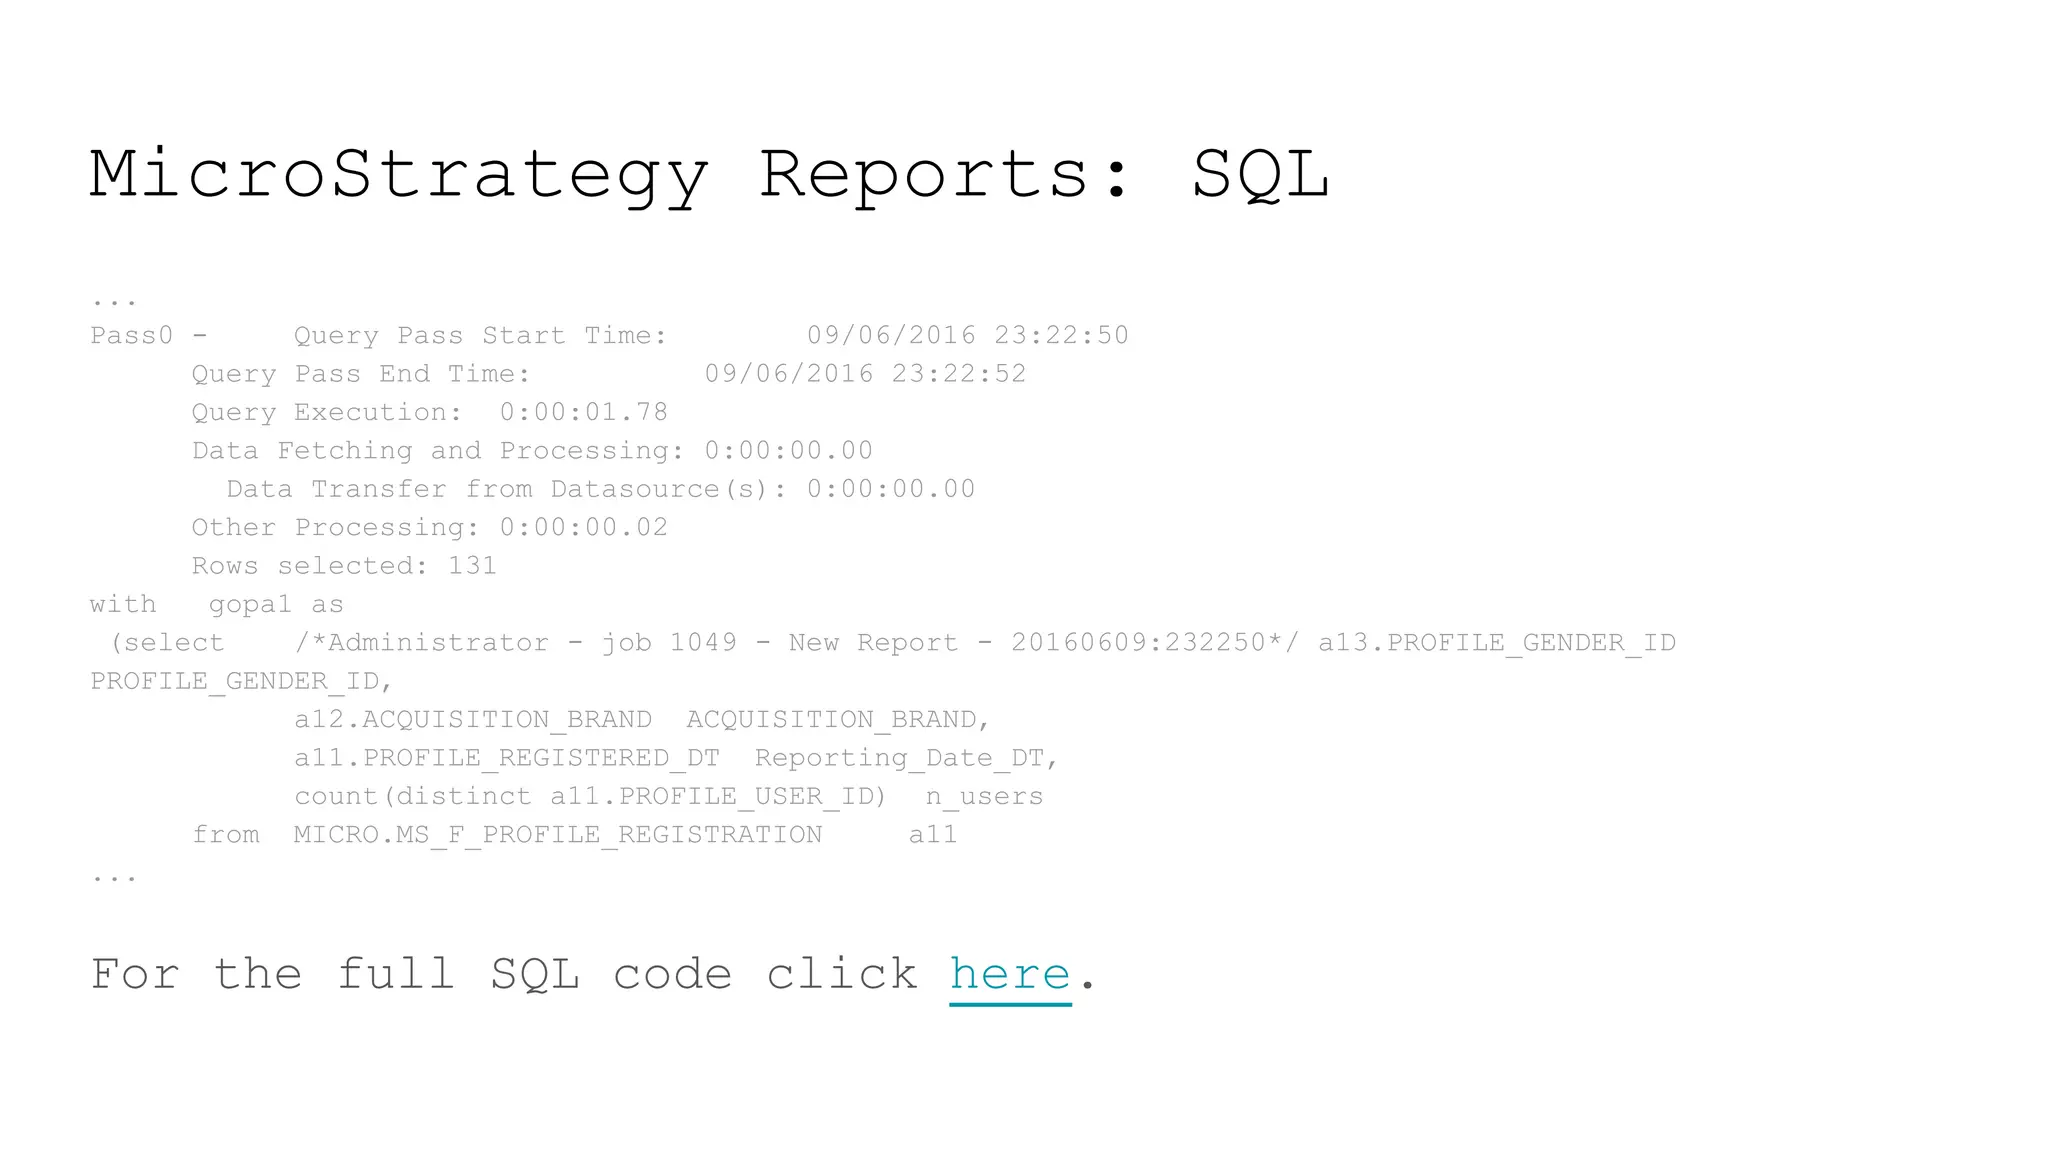
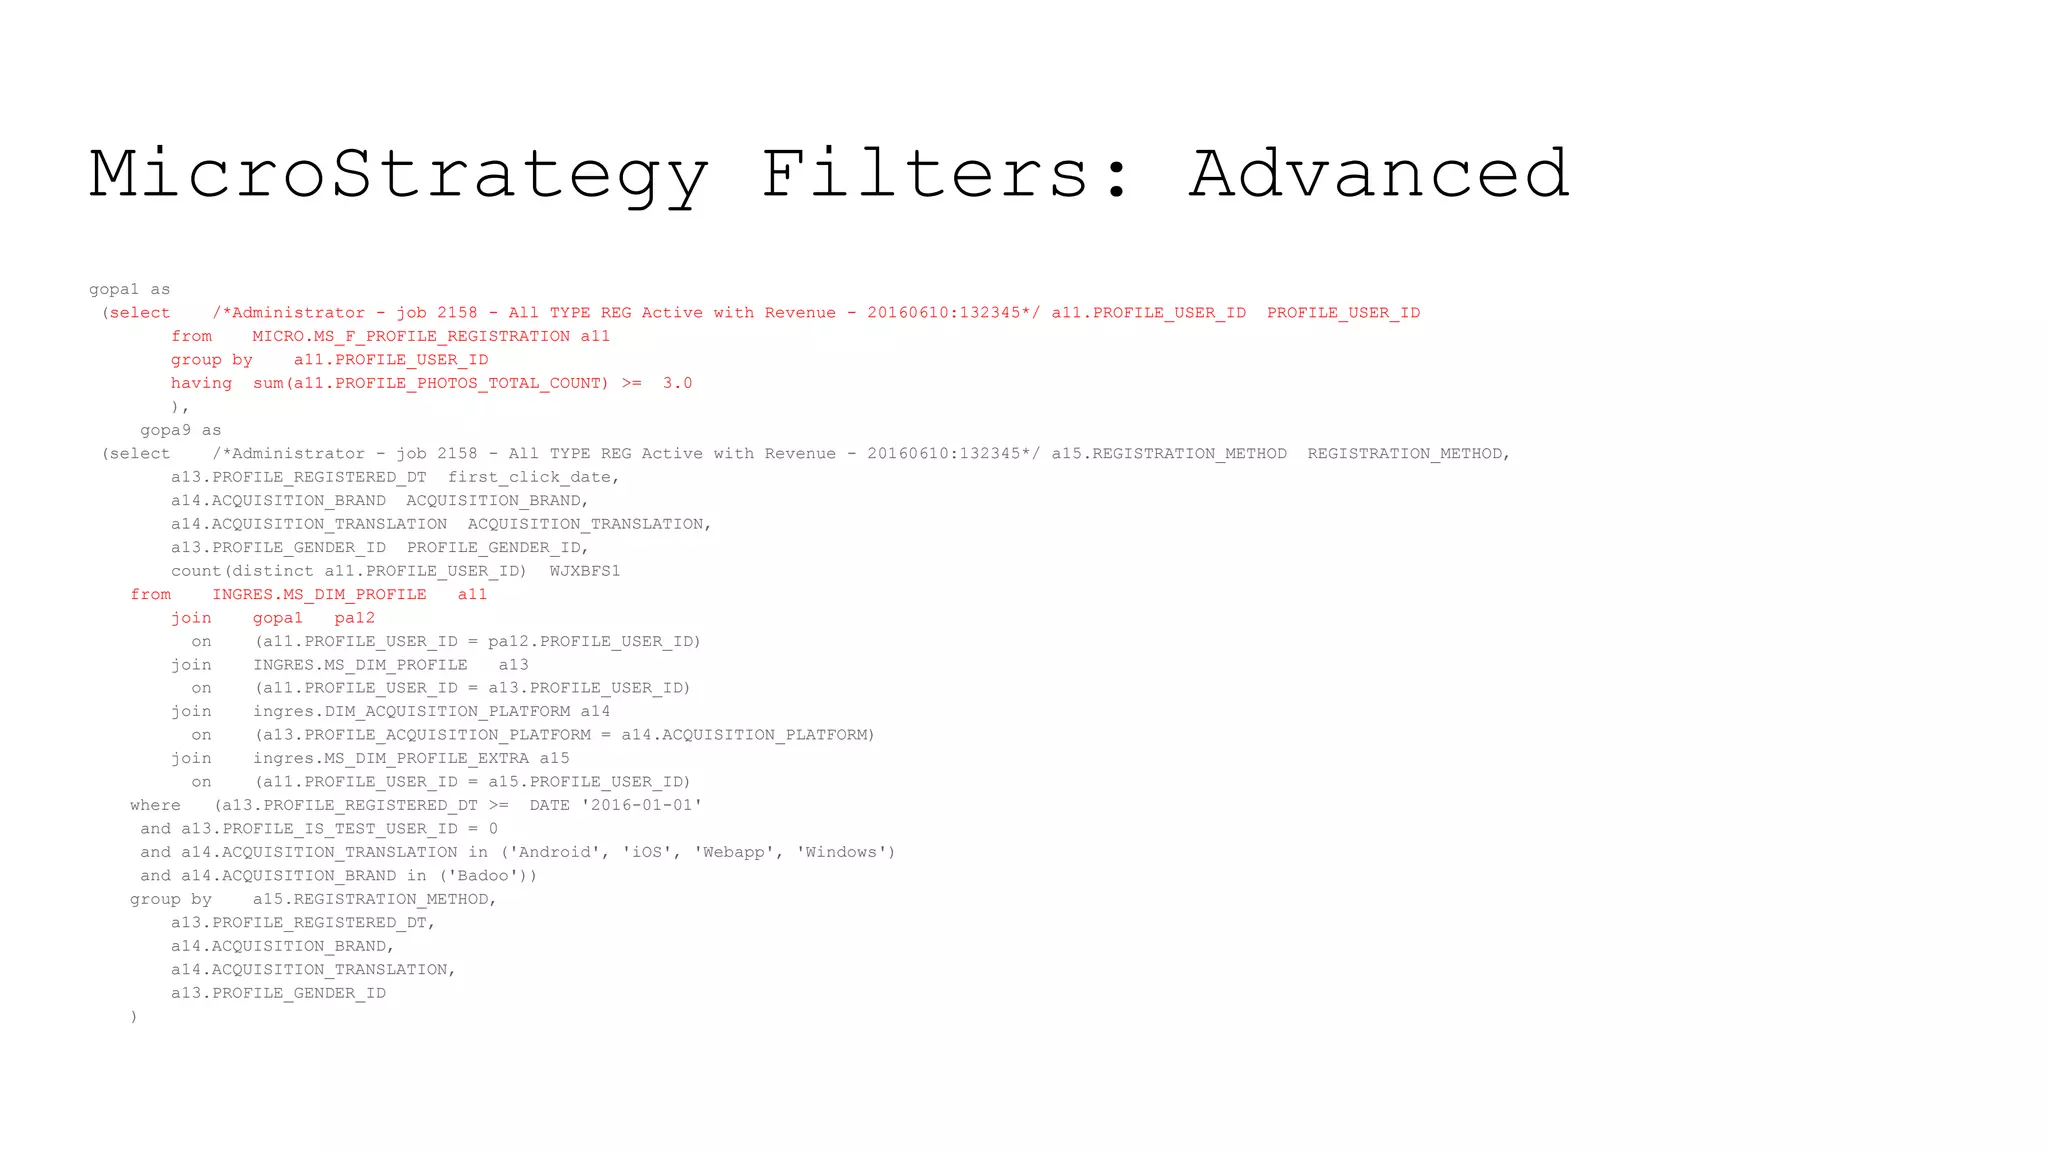
A simple report sql .
[originally here there was a link to a SQL report were I was discussing the
different sections, results and how to interpreter the SQL, with common
table expressions, generated by MicroStrategy]