Archaeological and groundwater investigations
•Download as PPTX, PDF•
1 like•804 views

This document discusses the use of seismic methods for archaeological and groundwater investigations. It provides examples of how seismic reflection and refraction surveys can be used to map subsurface structures and locate buried archaeological remains or water sources. Specifically, it describes 3D seismic acquisition techniques that provide ultra-high resolution for shallow investigations. Case studies demonstrate how seismic imaging can detect a buried shipwreck and Roman dyke. The document also discusses applications of seismic methods for groundwater exploration, such as locating aquifers and fractured zones.

Recommended
Recommended
More Related Content
What's hot
What's hot (20)
Similar to Archaeological and groundwater investigations
Similar to Archaeological and groundwater investigations (20)
Recently uploaded
Recently uploaded (20)
Archaeological and groundwater investigations
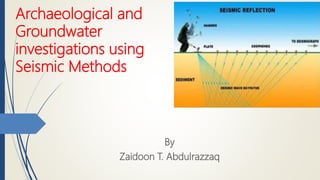
- 1. Archaeological and Groundwater investigations using Seismic Methods By Zaidoon T. Abdulrazzaq
- 2. Seismic methods are the most effective and expensive of all the geophysical techniques used to investigate layered media. Seismic investigations utilize the fact that elastic waves (also called seismic waves) travel with different velocities in different rocks. By generating seismic waves at a point and observing the times of arrival of these waves at a number of other points on the surface of the earth, it is possible to determine the velocity distribution and locate subsurface interfaces where the waves are reflected or refracted. The reflection and refraction survey methods are widely applied to studies of crustal structure, geological correlation of layered sequences and mapping of structures in the uppermost crust, and to hydrocarbon exploration. In the same way, but on a smaller scale, these methods are applied to environmental and geotechnical problems such as location of water table, water bearing fracture zones, cavities and sinkholes, delineation of faults and fractures, archaeological prospection and site investigations of foundation conditions including determination of depth to bedrock. In this Seminar, the main focus will be on shallow seismic methods and their applications for archaeological site and groundwater. Introduction
- 3. 1. Applications of seismic methods in Archaeological prospection Archaeological prospection or (Archaeogeophysics) includes the diverse geophysical methods employed either in planned excavations to guide the archaeological research in advance and during the excavation process or in salvage excavations to provide a rapid assessment during the development of infrastructures in urban or rural environments. In a more general basis these techniques are also applicable to support regional archaeological surveys by locating areas of archaeological interest and contributing in the settlement pattern analysis (Sarris and Jones, 2000). Unlike the destructive nature of the archaeological excavations, geophysical prospection techniques are non-invasive, providing at the same time a rapid reconnaissance of a site without disturbing the ground or the monuments themselves. The success or the failure of these techniques strongly depends on the contrasting physical properties that exist between the archaeological buried targets and the hosting material.
- 4. The early efforts of geophysical prospection methods for mapping concealed cultural remains, in terms of measuring the subsurface earth resistance, date back to late 1930s and early 1940s in USA and Britain respectively (Linford, 2006). After a period of experimentation, archaeological prospection presents an abrupt increase during the 1960s and 1970s. This period, known as the “Golden Period” of archaeological prospection, is closely connected to the design and development of specialized field instrumentation sensitive to the relatively low-amplitude / short-wavelengths archaeological signals and the introduction of dedicated algorithms for the data treatment and image processing (Scollar et al.,1986).
- 5. Geophysical methods can have an integrated part within wider geo- archaeological projects aiming to outline the extent of settlements or explore the wider limits of the habitation in a region (Sarris et al., 2014). Seismic refraction and Electric resistivity techniques ERT (Fig. 1), have been used in modeling the vertical stratigraphy and mapping the bedrock of an area in an ultimate effort to study possible locations of ancient ports (Vafidis et al., 2005) or reconstruct geomorphological characteristics and their significance for human occupation (Siart et al. 2009). Geo-Archaeological applications
- 6. Fig. 1: a) Layout of the geophysical grids, ERT lines and seismic refraction transects that have been completed during the geoarchaeological project in Istron at the east part of Crete. b) Velocity depth slices for the depths 10m and 50m below the ground surface. The cross-sectional velocity distribution along the dotted lines A and B is also presented (Shahrukh et al., 2012).
- 7. 3D seismic acquisition has been employed for more than 20 years in the hydrocarbon industry but has had limited application in near surface archaeological and engineering surveys. In archaeological work, the objective is commonly to locate buried architectural structures and small-scale man-made features at shallow depths of penetration (typically 5 m). Object detection at such shallow depths requires ultra-high-resolution seismic acquisition and processing methods. These include the use of high frequency, broadband seismic sources and processing routines that are geared to maximizing seismic resolution. These requirements and the need for specialized seismic processing hardware have largely limited the application of 3D seismic methods for many near-surface applications. 3D seismic acquisition
- 8. The recent advent of more powerful personal computers and PC based seismic processing and interpretation software has made ultrahigh-resolution 3D seismic surveys feasible for marine archaeological work. Whilst the resolution requirements of archaeological and engineering surveys are significantly greater when compared to hydrocarbon exploration, at the same time the survey areas are much smaller, and thus the amount of data collected remains comparable to that typical in industry (i.e. tens or even hundreds of giga bytes). The advances in computer technology have thus stimulated the development and adaptation of 3D seismic acquisition in shallow geophysical studies. It is now possible to employ 3D seismic imaging for object detection and mapping of archaeological structures below the sea floor in full three dimensions.
- 9. Between 2004 and 2006 an ultra-high-resolution marine 3D seismic acquisition system was also developed at the Christian Albrechts-University in Kiel for detailed archaeological site investigation in very shallow water (Fig. 2). The project received the acronym SEAMAP-3D, which stands for SEISMO Acoustical Marine Archaeological Prospection in 3D. It is funded by the German Ministry of Education and Research (BMBF). Fig. 2: SEAMAP-3D ultra-high-resolution seismic acquisition prototype on a lake in Northern Germany. A refitted catamaran is used as the acquisition vessel. It is towing the boomer seismic source and the rigid frame hydrophone array
- 10. The seismic method traditionally is used for deep exploration and has been less successful at imaging the near surface due to its low frequency and noise content (Aitken and Stewart, 2004). GPR conversely is considered to be a viable geophysical tool in the shallow section due to its inherent high frequency which translates to finer resolution. The disadvantage of GPR is the inability to see deeper into the subsurface (Daniels, D.J., 2004). Fig. 3 presents a display of the GPR and seismic micro-surveys both converted to depth using their appropriate velocities. It serves to illustrate how much better the resolution and definition of the GPR section is compared to the seismic micro-survey record from a depth range of 0.7 – 1.75 m. However, the depth of penetration of the seismic is superior to that of the GPR. The seismic micro-survey display shows recorded events up to 45 ms, an additional 25 ms below that of the GPR. This essentially translates into additional data that the GPR was unable to “see”. A combination of the two would undoubtedly be advantageous to archaeologists. Continued research at the University of Calgary will attempt to do just that by focusing on extracting more detail from the 3C-3D seismic micro- survey through processing, and applying more rigorous acquisition, processing and modelling techniques to the GPR data (Kaprowski. and Stewart, 2004). The GPR and the Seismic Micro-Survey
- 11. Fig.3: Comparison of the seismic micro-survey (left) and GPR (right) at depths 0.7-1.75 m.
- 12. Marine seismic imaging In marine seismic imaging, an acoustic source and receivers are towed behind a ship. The source emits an acoustic pulse that travels through the water and is reflected from the seabed and subsequent layers of the subsoil (fig. 1). The reflected energy intensity depends on the different densities of the seabed and sub-seafloor layers, the denser (i.e.) the seabed or layer the stronger the reflected signal. The reflected signal then travels harder back through the water to the receiver (fig. 4). The received signals are recorded, and as the ship constantly moves this will result in a vertical cross section through the seabed. So-called reflectors on the seismic image mark the boundary between two distinct subsurface layers. In order to image the shallow subsurface with the highest possible detail (and to allow the detection of small buried objects) a high vertical resolution is needed. This implies the use of high frequency acoustic (seismic) sources, such as boomers and echo-sounders.
- 13. Boomer sources have a frequency ranging between 2 and 5 kHz, and offer a good compromise between resolution (20- 50 cm) and penetration (tens of meters up to hundred m or more). Echo-sounder sources are generally marked by a higher frequency (4 to 10 kHz), resulting in an increased resolution (10-20 cm) but often also a decrease in penetration depth (Missiaen 2008). Fig. 4 Schematic diagram showing the principle of marine seismic imaging. A seismic source emits a sound pulse that is reflected against the sea floor and deeper layers; the reflected signals are recorded by a towed receiver. As the boat moves continuously, this results in a vertical image across the seabed along the ship’s trajectory (Missiaen 2010).
- 14. Case study 1 Seismic imaging of a buried wooden shipwreck, Wadden Sea In July 2003 a seismic survey was carried out over a buried wooden shipwreck (‘Scheurrak SOI’) in the Dutch Wadden Sea (Fig. 5), 25 km NE of Den Helder. The wreck is roughly 25 m long and dates presumably from the late 16th century13 (Manders, 2000). From 1989 to 1997 the wreck has been excavated by divers of the RACM (The Netherlands) - at that time the wreck was largely exposed on the sea floor (Fig.6). Results showed that the wreck had been broken lengthwise (the starboard side had broken of the hull of the ship) (Rijkswaterstaat, 2003). Fig. 5 Left Seismic network (thin blue lines) recorded over the wreck site in the Wadden Sea. Black lines = wreck contours (recorded in excavation when the wreck was still exposed). Right: Multibeam recording over the buried wreck. The wreck is now completely covered by sediments. Black lines = wreck contours. Red dots = short poles used by divers in 1990 to use as an external measuring grid. Thick blue line = location of the seismic profile shown in fig. 6. Courtesy RWS (Missiaen, 2010).
- 15. Fig. 6: Example of a 2D seismic profile (top) and interpreted line-drawing (bottom) across the wreck site in the Wadden Sea (for location of the profile see fig. 5). Depth below the water surface in milliseconds two-way travel time (2 ms = 1.5 m). The profile crosses the wreck more or less obliquely and the wreck outline is clearly observed. The large diffraction at the bottom is possibly related to the ship’s rudder (Missiaen, 2010).
- 16. Case study 2 Seismic investigations of Raversijde The Provincial Domain of Walraversijde, between Ostend and Middelkerke, has been the focus of a large-scale archaeological research project set up by the Flemish Heritage Institute (VIOE) and the province of West-Flanders. The main archaeological findings include the remnants of a Late Medieval settlement, both on the beach (see fig. 7: left and more inland in the dune area (Pieters, 1992). Due to severe coastal erosion the first settlement, dating from the late 13th century, was lost to the sea and relocated behind a dyke in the early 15th century. In September 2005 part of a buried Roman dyke was discovered in Walraversijde. The dyke is over 11 m wide and a little over 1 m high, and has a total length of at least 110 m (Pieters et al. 2006). The dyke is mainly built of stacked clay blocks, on its western side reinforced with peat (fig. 7: right). The dyke is oriented roughly perpendicular to the present coastline, which suggests that its purpose was most likely to embank a tidal gully that stretched further inland (Pieters et al. 2006). In the 70’s traces of the Roman dyke have been found on the beach of Raversijde (Pieters, 2007).
- 17. Fig. 7 Left: Ground plan of a late medieval house on the beach of Raversijde (After Chocqueel, 1950). Right: Excavation of the Roman dyke in Walraversijde. The dyke is made up of carefully stacked clay blocks. Wedge-like peat sods (dark color) were used to reinforce the western side of the dyke, in the forefront a horizontal cross-section of the same peat sods. The latter clearly indicate three successive reinforcement phases of the dyke.
- 18. Applications of seismic methods in Groundwater investigations Seismic method plays a major role in groundwater exploration. Refraction seismic method is more useful in groundwater investigations in comparison with reflection method because it generally aims at determining shallow subsurface structures and fractured zones, if any, in the bedrock (Sigmund 1990). An investigation employing refraction seismic method was carried out to understand the structures favorable for groundwater potentiality. Deep aquifers of fractured biotite gneiss within the bedrock below sandstone have been investigated for possible potential groundwater locations. Survey and a sample seismogram of traverse are given in figures 8 (a and b).
- 19. Fig. 8: (a) Spread geometry of seismic traverses; (b) Sample seismogram of traverse
- 20. The kind of hydro-geological information can be obtained from seismic prospecting The propagation velocity of P-waves depends strongly on the porosity and the water saturation of sediments. S-wave velocity or the shear modulus, respectively, is mainly determined by the stiffness of the rock matrix. In consequence, both P-and S-wave velocities depend significantly on the fracture density of rocks. Therefore, seismic investigations can contribute basically in different regards to hydrogeological investigations: To find the groundwater table or define bed rock levels appear self-evident tasks (Fig. 9). In a more general sense, seismic investigations can serve to determine the structural and lithological framework of hydrogeological studies and to quantify the heterogeneity of aquifers and aquitards off boreholes. In addition, porosity and fracture density can be investigated (Kirsch, et al., 2006)
- 21. The advantages and disadvantages of seismic measurements compared to other methods Seismic prospecting provides reliable information on the depth of interfaces. In comparison to electromagnetic induction and DC-geoelectrical measurements, penetration depth and structural resolution of seismic measurements are usually higher and less ambiguous. These advantages are paid for with higher costs in acquisition and interpretation. The relation of vP and vS to rock parameters such as porosity and pore fill is not unique. Therefore, seismic measurements have to be combined with other types of geophysical methods if sedimentary parameters are to be determined in situ. In hydrogeophysics it is most advantageous to combine geoelectrical and seismic methods to determine. The sequence “drill hole - seismics DC geoelectrics - EM-induction” can be regarded as a sequence of decreasing structural resolution and investigation costs. (Kirsch, et al., 2006).
- 22. Fig. 9: Seismic structure of the weathering zone in a hard rock area based on the application of P-waves. Top: Tomographic interpretation of refracted arrivals. The image shows a cross-section in terms of P-wave velocity vP where unconsolidated material is indicated by low vP values. Bottom: Corresponding seismic reflection section showing the complex layering within the vadoze zone. Velocity contours for vP = 400, 800 and 1200 m/s are indicated by dashed lines for comparison (by courtesy of GeoExpert AG, Schwerzenbach, Switzerland) (Kirsch, et al., 2006)
- 23. Some Applications of shallow seismic methods to groundwater investigations In the following, various applications of the shallow seismic methods are demonstrated by a number of examples. 1. Studying aquifer structure The investigated site is located in the western Mesaoria area of Cyprus, in the vicinity of the village of Meniko. The upper part of the geological section in the area is composed mainly of Pliocene to Middle Miocene marls of the Nicosia formation. The formation is subdivided into two units. Between the two units, a phreatic aquifer is developed in a clastic horizon consisting of gravels and sands. The depth to the aquifer layer is about 200 m and its thickness varies from 0 to 80 m. The area suffers from an insufficient supply of fresh groundwater, and it is therefore important to study the inner structure of the aquifer in the area. For this purpose, a high resolution seismic reflection survey was carried out at the Meniko site (Fig. 10). The survey was performed in the framework of the INCO-DC program, with the aim of detecting and mapping the water-bearing layers and delineating the contact between the sediments of the Nicosia formation and the igneous rocks. Two reflection lines were shot at the site with a 48 channel recorder using explosives. The receivers were single 10 Hz geophones; the source and receiver spacing was 10.0 m. Fig. 11 represents two field records from the survey. The records clearly show a sequence of reflected events down to times of about 500 ms (Shtivelman, 2003).
- 24. Fig. 10: seismic time section along the reflection lines in Meniko area (Shtivelman, 2003).
- 25. Fig. 11 shows a seismic time section along one of the reflection lines (Shtivelman, 2003).
- 26. The Dead Sea area is characterized by extensive development of sinkholes of different dimensions. Along the western coast, more than 700 sinkholes are exposed, with diameters varying from several meters to tens of meters and with depths reaching 15 m. Over the last years, the sinkhole development has increased dramatically, posing a severe problem for a normal functioning and development of the entire region (Shtivelman, 2003). In order to understand the mechanism of the sinkhole development, an integrated geophysical study was carried out in the area. The starting point of the study was the assumption that a direct relationship exists between the rapid lowering of the Dead Sea (approximately 20 m during last 20 years) and the rate of sinkhole development both in time and space. The lowering of the Dead Sea level is accompanied by a corresponding decrease of the groundwater level in the vicinity of the shore and by penetration of unsaturated groundwater into the coastal area. If this water encounters a shallow salt layer, it may cause its dissolution and formation of cavities within the salt. As a result, the overlaying material (usually poorly consolidated alluvium) collapses into the cavities, forming sinkholes at the surface. Thus, the working hypothesis of the study suggests the existence of a shallow salt layer as a necessary factor for sinkhole development. Since seismic velocity in the salt layer is supposed to be higher than that of the overlaying alluvium, it makes it a good target for the seismic refraction method. Therefore, in order to verify the existence of such a layer, seismic refraction surveys were carried out in several sinkhole areas. 2. Detecting a salt layer in sinkhole areas
- 27. The following example shows the results of such a survey. A refraction line was shot in the vicinity of a number of opened sinkholes, one of which is shown in Fig. 12. The source of energy was Dynasource (a track- mounted vacuum-accelerated heavy weightdrop); the receiver spacing was 5 m. The depth section along the line (Fig. 13) shows a presence of a relatively high-velocity (2930 m/s) layer at the depths of 20 – 25 m which can be identified with salt. The layer is overlain by two low-velocity layers which can be related to the dry (the velocity of 630 m/s) and water saturated (the velocity of 1650 m/s) parts of an alluvium unit. This subsurface model was further confirmed by a borehole drilled at the site. The borehole penetrated the salt layer between the depths of 24 – 36 m. The refraction surveys carried out in other sinkhole areas produced similar results, thus confirming the existence of a shallow high-velocity salt-related layer in these areas (Shtivelman, 2003).
- 28. Fig. 12: A sinkhole in the Dead Sea area (Shtivelman, 2003)
- 29. Fig. 13: A Depth section along the refraction line located in the vicinity of the sinkhole of Fig.11 (Shtivelman, 2003)
- 30. References - Aitken, J.A and Stewart, R. R., 2004: Shallow GPR and seismic surveying in a carbonate environment: Belize, Central America, CREWES Research Report, V. 16. - Bull, J., Gutowski, M., Dix, J., Henstock, T., Hogarth, P., White, P., Leighton, P., 2005: Design of a 3D chirp sub-bottom imaging system. Marine Geophysical Researches 26, 157–169. - Chocqueel A. 1950: Les civilisations préhistoriques et anciennes de la Flandre Occidentale d’après l’examen d’objets leur ayant appartenu, Bruxelles. - Daniels, D.J., 2004: Ground Penetrating Radar 2nd edition: The Institute of Electrical Engineers, London, England. - Gutowski, M., 2005: 3D high-resolution sub-bottom profiling — 3D chirp. Hydro International 2– 4. - Henriet, J., Verschuren, M., Versteeg, W., 1992: Very high resolution 3D seismic reflection imaging of small- scale structural deformation. First Break 10 (3), 81– 88. - Henriet, J.,1998: Very high resolution 3D marine seismic data processing for geotechnical applications. Geophysical Prospecting 46 (2), 105–120. - Kaprowski, N.A. and Stewart R.R., 2004: 3C-3D seismic micro-survey at a Maya plaza ruin in Belize, Central America: CSEG Recorder, V.29, No. 9, pp36-40. - Kirsch, R., Ernstson, K., and, Yaramanci, U. 2006: Groundwater Geophysics A Tool for Hydrogeology. Springer Berlin Heidelberg New York, 493 P. - Linford, N., 2006: The application of geophysical methods in archaeological prospection. Rep. Prog. Phys. 69, 2205-2257.
- 31. - Manders M.R. 2000: The mysteries of a Baltic Trader. In: Beltrame C. (ed.), Boats Ships and Shipyards. Proceedings of the 9th Int. Symposium on Boat and Ship Archaeology (ISBSA 9), Venice 2000, Oxford 2003, 320-329. - Marsset, B., Missiaen, T., De Roeck, Y., Noble, M., Versteeg, W., Missiaen, T., Murphy, S., Loncke, L., Henriet, J., 2002: Very high-resolution seismic mapping of shallow gas in the Belgian coastal zone. Continental Shelf Research 22 (16), 2291–2301. - Missiaen T. 2008: Shallow Marine Acoustic Imaging in Environmental Investigations, Dissertation submitted for the degree of Doctor of Science, Geology, Ghent University. - Missiaen T. 2010: The potential of seismic imaging in marine archaeological site investigations, Relicta, V 6. 219-236. - Müller, C., 2005: The marine VHR 2.5D seismic brute stack cube as a feasible tool for low budget investigation and research. Marine Geophysical Researches 26, 197–206. - Müller, C., Milkereit, B., Bohlen, T., Theilen, F., 2002: Towards high-resolution 3D marine seismic surveying using Boomer sources. Geophysical Prospecting 50, 517–526. - Pieters M. 1992: Archeologisch onderzoek te Raversijde (stad Oostende, prov. West-Vlaanderen), Archeologie in Vlaanderen II, 247- 264. - Pieters M., Demerre I. & Zeebroek I. 2006: Dijk uit de Romeinse tijd aangesneden onder het middeleeuwse vissersdorp Walraversijde. In: Bosman A., De Clercq W. & Hoevenberg J. (red.), Romeinendag. Jaarlijks Belgisch congres voor Romeinse archeologie. Journée d’archéologie Romaine. Conférence annuelle Belge d’archéologie Romaine. Gent 06 05-2006 Gand, 93-97.
- 32. - Pieters M. 2007: Onderzoek op het strand van raversijde, pionierswerk in de maritieme archeologie. In: Gevaert G. (red.), De archeologische site ‘Raversijde-strand’. Academische zitting over maritieme archeologie, Raversijde, 6 november 2007, Brussel, 31-33.Bibliography. - Pulliam, J., Austin, J., Luhurbudi, E., Saustrup, S., P.L., S., 1996: An ultrahigh resolution 3D survey of the shallow subsurface on the continental shelf of New Jersey. The Leading Edge 15 (7), 839–845. - Rijkswaterstaat 2003: Onderzoekslokaties IMAGO prijsvraag, Rijkswaterstaat Internal Report, november 2003, Lelystad. - Sarris, A. and Jones, R.E., 2000: Geophysical and Related Techniques Applied to Archaeological Survey in Mediterranean: A review. Journal of Mediterranean Archaeology, 13, 3-75. - Sarris, A, Papadopoulos, N.G., Salvi, M.C. and Dederix, S., 2014: Preservation Assessment of Ancient Theatres through Integrated Geophysical Technologies, published in :A Sense of the Past: Studies in current archaeological applications of remote sensing and non-invasive prospection methods, Edited by Hans Kamermans, Martin Gojda, Axel G. Posluschny, Archaeopress and the individual authors 2014, ISBN 978 1 4073 1216 3, 33-40. - Scheidhauer, M., Marillier, F., Dupuy, D., 2005: Development of a system for 3D high resolution seismic reflection profiling on lakes. Marine Geophysical Researches 26, 183–195. - Scollar, I., Weidner, B. and Segeth, K. 1986: Display of archaeological magnetic data, Geophysics, 51, 3, 623-633. - Shahrukh, M., Soupios, P., Papadopoulos N., and Sarris, A., 2012: Geophysical Investigations at the Istron Archaeological Site, eastern Cretem Greece Using Seismic Refraction and Electrical Resistivity Tomography., J. Geophys. Eng. 9, 749-760.
- 33. - Shtivelman V. 2003: Application of shallow seismic methods to engineering, environmental and groundwater investigations. Bollettino di Geofisica teorica ed applicata, Vol. 44, n. 3-4, pp. 209-222. - Siart, C., Ghilardi, M., Holzhauer, I., 2009: Geoarchaeological study of karst depressions integrating geophysical and sedimentological methods: case studies from Zominthos and Lato (Central & East Crete, Greece). Géomorphologie: relief, processus, environnement 2009/4, 17-32. - Sigmund, D. S, 1990: Detection of distressed rock and potential collapse feature above old mine workings by the seismic refraction method; In: SEG by S.H. Ward, 3 pp. 281-288. - Sourlas, G., Vrontaki, E., Sarris, A., Guy, M., Kalpaxis, Th., 2005: Integrated geophysical studies at ancient Itanos (Greece), Journal of Archaeological Science, 32, 1023-1036. - Vafidis, A., Economou, N., Ganiatsos, Y., Manakou, M., Poulioudis, G., Vardy, M.E., Dix, J.K., Henstock, T.J., Bull, J.M., Gutowski, M., 2008: Decimeter-resolution 3D seismic volume in shallow water: a case study in small-object detection. Geophysics 73 (No. 2).