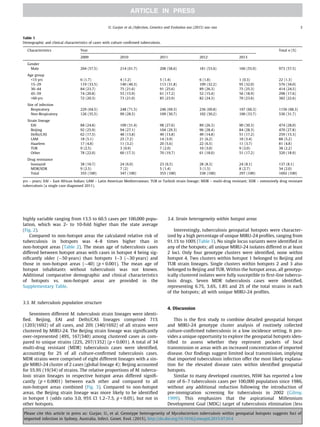
SlideShare a Scribd company logo
Genotype heterogeneity of Mycobacterium tuberculosis within geospatial
hotspots suggests foci of imported infection in Sydney, Australia
Ulziijargal Gurjav a,c
, Peter Jelfs b,c
, Grant A. Hill-Cawthorne a,d
, Ben J. Marais a
, Vitali Sintchenko a,c,⇑
a
Sydney Medical School and the Marie Bashir Institute for Infectious Diseases and Biosecurity, The University of Sydney, Sydney, Australia
b
NSW Mycobacterium Reference Laboratory, Centre for Infectious Diseases and Microbiology Laboratory Services, Institute of Clinical Pathology
and Medical Research – Pathology West, Sydney, Australia
c
Centre for Infectious Diseases and Microbiology – Public Health, Westmead Hospital, Sydney, Australia
d
School of Public Health, The University of Sydney, Sydney, Australia
a r t i c l e i n f o
Article history:
Received 30 January 2015
Received in revised form 6 July 2015
Accepted 13 July 2015
Available online xxxx
Keywords:
Mycobacterium tuberculosis
Molecular epidemiology
Genotyping
Geospatial hotspot
a b s t r a c t
In recent years the State of New South Wales (NSW), Australia, has maintained a low tuberculosis inci-
dence rate with little evidence of local transmission. Nearly 90% of notified tuberculosis cases occurred
in people born in tuberculosis-endemic countries. We analyzed geographic, epidemiological and geno-
typic data of all culture-confirmed tuberculosis cases to identify the bacterial and demographic determi-
nants of tuberculosis hotspot areas in NSW. Standard 24-loci mycobacterium interspersed repetitive
unit-variable number tandem repeat (MIRU-24) typing was performed on all isolates recovered between
2009 and 2013. In total 1692/1841 (91.9%) cases with confirmed Mycobacterium tuberculosis infection had
complete MIRU-24 and demographic data and were included in the study. Despite some year-to-year
variability, spatio-temporal analysis identified four tuberculosis hotspots. The incidence rate and the rel-
ative risk of tuberculosis in these hotspots were 2- to 10-fold and 4- to 8-fold higher than the state aver-
age, respectively. MIRU-24 profiles of M. tuberculosis isolates associated with these hotspots revealed
high levels of heterogeneity. This suggests that these spatio-temporal hotspots, within this low incidence
setting, can represent areas of predominantly imported infection rather than clusters of cases due to local
transmission. These findings provide important epidemiological insight and demonstrate the value of
combining tuberculosis genotyping and spatiotemporal data to guide better-targeted public health
interventions.
Ó 2015 Published by Elsevier B.V.
1. Introduction
Tuberculosis remains a major cause of disease and death in
poverty-stricken and conflict-ridden parts of the world (WHO,
2014a). In non-endemic countries such as Australia, tuberculosis
notification rates have decreased significantly over the years,
plateauing at an incidence of 5–6 per 100,000 population since
1985 (Barry et al., 2012). Disease rates among Australian-born
non-Aboriginal groups are minimal, but Aboriginal and immigrant
populations are disproportionally affected. Nationally, more than
85% of adult tuberculosis cases occur in immigrants from high inci-
dence countries (Lumb et al., 2011; Roberts-Witteveen et al.,
2010). In addition, Australia is a highly mobile nation and
Australian-born residents frequently travel to tuberculosis
endemic areas.
New South Wales (NSW) reports the highest absolute case
numbers and tuberculosis incidence rates within Australia, with
most of these cases located in metropolitan Sydney (Barry et al.,
2012). Tuberculosis cases show significant geographic clustering,
with incidence rates in excess of 60 per 100,000 population
recorded in some metropolitan areas (Massey et al., 2013). As in
the rest of the country, the vast majority of cases occur in people
born in tuberculosis endemic countries (Lowbridge et al., 2013).
From a public health perspective it is important to understand
the likely origin of disease, since this knowledge can guide local
tuberculosis control strategies. In a low-incidence setting such as
Australia, most tuberculosis cases result from imported infection
in either an active, incipient or latent form, despite routine
pre-migration screening. Determinants of tuberculosis risk in
non-endemic areas include factors related to (i) M. tuberculosis infec-
tion risk (e.g. being born in, or travel to, a tuberculosis-endemic
http://dx.doi.org/10.1016/j.meegid.2015.07.014
1567-1348/Ó 2015 Published by Elsevier B.V.
⇑ Corresponding author at: Sydney Medical School and the Marie Bashir Institute
for Infectious Diseases and Biosecurity, The University of Sydney, Sydney, Australia.
E-mail address: vitali.sintchenko@sydney.edu.au (V. Sintchenko).
Infection, Genetics and Evolution xxx (2015) xxx–xxx
Contents lists available at ScienceDirect
Infection, Genetics and Evolution
journal homepage: www.elsevier.com/locate/meegid
Please cite this article in press as: Gurjav, U., et al. Genotype heterogeneity of Mycobacterium tuberculosis within geospatial hotspots suggests foci of
imported infection in Sydney, Australia. Infect. Genet. Evol. (2015), http://dx.doi.org/10.1016/j.meegid.2015.07.014
country), and (ii) the risk of primary disease progression or reactiva-
tion, caused by infection with human immunodeficiency virus (HIV),
older age or the use of immunosuppressive drugs (Marais et al.,
2013; Nguyen et al., 2004). Routine treatment of ‘‘latent’’ infection
is not practiced in Australia and there is no post-immigration
screening following new immigrant settlement and or subsequent
visits to tuberculosis-endemic areas.
Spatial scan statistics can reliably identify geographic areas
with higher than expected case notifications in space and/or time
(Kulldorff et al., 1998) and therefore can assist in directing inter-
ventions, resource allocation and surveillance in these areas
(Coleman et al., 2009; Shah et al., 2014). However, the specificity
of hotspot alerts provided by purely statistical techniques has
not been adequately evaluated. Clinical isolates of M. tuberculosis
have been routinely typed in NSW using 24-loci mycobacterial
interspersed repetitive unit-variable number of tandem repeats
(MIRU-24) since 2009 to monitor for case clusters, potential local
transmission and laboratory cross-contamination (Gallego et al.,
2010). Cluster identification, using either genotypic or epidemio-
logical methods, can provide important evidence to direct public
health responses and limit potential epidemic spread (Gurjav
et al., 2014). In this study we aimed to synthesize two lines of evi-
dence offered by spatial scan statistics and genotyping of M. tuber-
culosis in order to improve the resolution of case clustering
assessment and the validity of hotspot analysis.
2. Methods
2.1. Study population
Routine surveillance data of all culture-confirmed tuberculosis
cases identified between January 2009 and December 2013 in the
State of NSW were included in the study. The Mycobacterium
Reference Laboratory (MRL) at the Institute of Clinical Pathology
and Medical Research (ICPMR), Pathology West, Sydney, receives
all M. tuberculosis complex isolates for further confirmatory and
drug susceptibility testing (Gallego et al., 2010) and prospective
MIRU-24 typing (Supply et al., 2006). Duplicate isolates were
excluded from this study. Patient demographic data such as age,
gender, site of infection and residential postcode was obtained
from the ICPMR Laboratory Information System. Programmatic
data indicate that the vast majority of tuberculosis cases identified
in NSW, as in the rest of Australia, occur among recent immigrants
(Roberts-Witteveen et al., 2010).
2.2. Geospatial hotspot description
Spatial scan statistics was calculated using SatScan software
(Boston, USA) with retrospective time–space Poisson distribution
analysis parameter (Kulldorff et al., 1998). Briefly, hotspots were
identified through comparing the observed cases in a given spa-
tiotemporal location with the expected Poisson distribution of
cases. Statistical significance was detected by the log likelihood
ratio test and p-values obtained through 999 Monte Carlo simula-
tions. The population density for the greater Sydney metropolitan
area is 380 people per square kilometer compared to the rest of
NSW where average population density is 9 people per square kilo-
meter. Therefore the spatial scan resolution was set to a diameter
of 5 km to allow for adequate breakdown of densely populated
areas, especially within the Greater Sydney area. Geospatial hot-
spots were visualized using the Quantum Geographical
Information System (Holt et al., 2013). NSW 2011 population cen-
sus data were obtained from the Australian Bureau of Statistics
(ABS) Canberra, Australia and used for the annual incidence rate
calculation (ABS, 2011).
2.3. Genotypic cluster description
Twenty-four loci MIRU genotyping was performed and strain
lineage using MIRU-24 was assigned as previously described using
miru-vntrplus.org online database (Weniger et al., 2010; Gurjav
et al., 2014). Two or more isolates sharing an identical MIRU profile
were considered a genotype cluster, suggesting local transmission.
Conversely, two or more isolates differing at one or more MIRU-24
loci were considered unique.
2.4. Statistical analysis
The relative risk (RR) for each of the hotspot areas was com-
puted by binomial logistic regression using non-hotspot areas as
the reference. Briefly, tuberculosis case number was defined as
the dependable variable and coded hotspot and non-hotspot areas
considered as a covariate to calculate RR confidence intervals using
a forward model. Descriptive statistics were used to explore differ-
ences between hotspot areas and associations with M. tuberculosis
strain lineages. v2
and One-way ANOVA tests were used where
applicable. All statistical analyses were performed using SPSS
22.0 (IBM, USA) and p-values less than 0.05 we considered
significant. The study was approved by the Human Research
Ethics Committee of the University of Sydney (project number
2013/126).
3. Results
3.1. Background epidemiology
During the 5-year study period a total of 1872 patients with
culture-confirmed M. tuberculosis complex infections were diag-
nosed, including four Mycobacterium bovis and 27 M. bovis BCG
cases. M. bovis BCG cases all received intravesicular BCG installa-
tion for bladder cancer treatment and the four M. bovis cases had
no epidemiological link suggestive of possible transmission.
After exclusion of the 31 M. bovis and M. bovis BCG cases the
denominator was 1841 cases. The incidence of culture-confirmed
tuberculosis was maintained at 6/100,000 population, with the
lowest absolute number (n = 297) of cases reported in 2013. Of
the confirmed M. tuberculosis cases, 91.9% (1692/1841) had com-
plete demographic and MIRU-24 genotyping data and were
included in subsequent analyses. Basic demographic and
bacteriological data of all culture-confirmed tuberculosis cases
are shown in Table 1. The most common strain lineages were
East African Indian (EAI) and Beijing, accounting for around
55.8% (944/1692) of all strains. Among the minority strains the
Turkish (TUR) strain lineage accounted for 2.2% (38/1692) of
culture-confirmed cases.
3.2. Geospatial hotspots
All of the hotspot areas identified were within the Greater
Sydney area. Fig. 1 provides an overview of the spatio-temporal
dynamics of culture-confirmed tuberculosis cases in NSW.
Culture-confirmed tuberculosis cases were notified in 286 of 607
postcode areas. Although the hotspots identified in each study year
showed some variability, three non-adjacent and two adjacent
postcodes were consistently identified in each of the five study
years (Fig. 1, last panel). The three non-adjacent postcodes were
considered as three independent hotspots and the two adjacent
postcodes were amalgamated into a single hotspot, providing a
total of four geospatial hotspots as reflected in the aggregate data
for the study period (Hotspots 1–4; Fig. 1, last panel). Annual
tuberculosis incidence rates within the geospatial hotspots were
2 U. Gurjav et al. / Infection, Genetics and Evolution xxx (2015) xxx–xxx
Please cite this article in press as: Gurjav, U., et al. Genotype heterogeneity of Mycobacterium tuberculosis within geospatial hotspots suggests foci of
imported infection in Sydney, Australia. Infect. Genet. Evol. (2015), http://dx.doi.org/10.1016/j.meegid.2015.07.014
highly variable ranging from 13.5 to 60.5 cases per 100,000 popu-
lation, which was 2- to 10-fold higher than the state average
(Fig. 2).
Compared to non-hotspot areas the calculated relative risk of
tuberculosis in hotspots was 4–8 times higher than in
non-hotspot areas (Table 2). The mean age of tuberculosis cases
differed between hotspot areas with cases in hotspot 4 being sig-
nificantly older (50 years) than hotspots 1–3 (30 years) and
those in non-hotspot areas (40) (p  0.001). The mean age of
hotspot inhabitants without tuberculosis was not known.
Additional comparative demographic and clinical characteristics
of hotspots vs. non-hotspot areas are provided in the
Supplementary Table.
3.3. M. tuberculosis population structure
Seventeen different M. tuberculosis strain lineages were identi-
fied. Beijing, EAI and Delhi/CAS lineages comprised 71%
(1203/1692) of all cases, and 20% (340/1692) of all strains were
clustered by MIRU-24. The Beijing strain lineage was significantly
over-represented (49%, 167/340) among clustered cases as com-
pared to unique strains (22%, 297/1352) (p  0.001). A total of 34
multi-drug resistant (MDR) tuberculosis cases were identified,
accounting for 2% of all culture-confirmed tuberculosis cases.
MDR strains were comprised of eight different lineages with a sin-
gle MIRU-24 cluster of 2 cases (global lineage 4); Beijing accounted
for 55.9% (19/34) of strains. The relative proportions of M. tubercu-
losis strain lineages in respective hotspot areas differed signifi-
cantly (p  0.0001) between each other and compared to all
non-hotspot areas combined (Fig. 3). Compared to non-hotspot
areas, the Beijing strain lineage was more likely to be identified
in hotspot 1 (odds ratio 3.0, 95% CI 1.2–7.5, p  0.05), but not in
other hotspots.
3.4. Strain heterogeneity within hotspot areas
Interestingly, tuberculosis geospatial hotspots were character-
ized by a high percentage of unique MIRU-24 profiles, ranging from
91.1% to 100% (Table 3). No single locus variants were identified in
any of the hotspots; all unique MIRU-24 isolates differed in at least
2 loci. Only four genotype clusters were identified, none within
hotspot 4. Two clusters within hotspot 1 belonged to Beijing and
TUR strain lineages. Single clusters within hotspots 2 and 3 also
belonged to Beijing and TUR. Within the hotspot areas, all genotyp-
ically clustered isolates were fully susceptible to first-line tubercu-
losis drugs. Seven MDR tuberculosis cases were identified,
representing 6.7%, 3.6%, 1.8% and 2% of the total strains in each
of the hotspots; all with unique MIRU-24 profiles.
4. Discussion
This is the first study to combine detailed geospatial hotspot
and MIRU-24 genotype cluster analysis of routinely collected
culture-confirmed tuberculosis in a low incidence setting. It pro-
vides a unique opportunity to explore the geospatial hotspots iden-
tified to assess whether they represent pockets of local
transmission or areas with an increased concentration of imported
disease. Our findings suggest limited local transmission, implying
that imported tuberculosis infection offer the most likely explana-
tion for the elevated disease rates within identified geospatial
hotspots.
Similar to many developed countries, NSW has reported a low
rate of 6–7 tuberculosis cases per 100,000 population since 1986,
without any additional reduction following the introduction of
pre-immigration screening for tuberculosis in 2002 (Gilroy,
1999). This emphasizes that the aspirational Millennium
Development Goal (MDG) target of tuberculosis elimination (less
Table 1
Demographic and clinical characteristics of cases with culture confirmed tuberculosis.
Characteristics Year Total n (%)
2009 2010 2011 2012 2013
Gender
Male 204 (57.5) 214 (61.7) 208 (58.6) 181 (53.6) 166 (55.9) 973 (57.5)
Age group
15 yrs 6 (1.7) 4 (1.2) 5 (1.4) 6 (1.8) 1 (0.3) 22 (1.3)
15–29 119 (33.5) 140 (40.3) 113 (31.8) 109 (32.2) 95 (32.0) 576 (34.0)
30–44 84 (23.7) 75 (21.6) 91 (25.6) 89 (26.3) 75 (25.3) 414 (24.5)
45–59 74 (20.8) 55 (15.9) 61 (17.2) 52 (15.4) 56 (18.9) 298 (17.6)
60 yrs 72 (20.3) 73 (21.0) 85 (23.9) 82 (24.3) 70 (23.6) 382 (22.6)
Site of infection
Respiratory 229 (64.5) 248 (71.5) 246 (69.3) 236 (69.8) 197 (66.3) 1156 (68.3)
Non-Respiratory 126 (35.5) 99 (28.5) 109 (30.7) 102 (30.2) 100 (33.7) 536 (31.7)
Strain lineage
EAI 88 (24.8) 109 (31.4) 98 (27.6) 89 (26.3) 90 (30.3) 474 (28.0)
Beijing 92 (25.9) 94 (27.1) 104 (29.3) 96 (28.4) 84 (28.3) 470 (27.8)
Delhi/CAS 62 (17.5) 48 (13.8) 49 (13.8) 49 (14.8) 51 (17.2) 259 (15.3)
LAM 18 (5.1) 25 (7.2) 14 (3.9) 21 (6.2) 10 (3.4) 88 (5.2)
Haarlem 17 (4.8) 11 (3.2) 20 (5.6) 22 (6.5) 11 (3.7) 81 (4.8)
TUR 9 (2.5) 3 (0.9) 7 (2.0) 10 (3.0) 9 (3.0) 38 (2.2)
Other 78 (22.0) 60 (17.3) 70 (19.7) 61 (18.0) 51 (17.2) 320 (18.9)
Drug resistance
Isoniazid 38 (10.7) 24 (6.9) 23 (6.5) 28 (8.3) 24 (8.1) 137 (8.1)
MDR/XDR 9 (2.5) 7 (2) 5 (1.4) 5 (1.5) 8 (2.7) 34 (2.0)
Total 355 (100) 347 (100) 355 (100) 338 (100) 297 (100) 1692 (100)
yrs – years; EAI – East African Indian; LAM – Latin American Mediterranean; TUR or Turkish strain lineage; MDR – multi-drug resistant; XDR – extensively drug resistant
tuberculosis (a single case diagnosed 2011).
U. Gurjav et al. / Infection, Genetics and Evolution xxx (2015) xxx–xxx 3
Please cite this article in press as: Gurjav, U., et al. Genotype heterogeneity of Mycobacterium tuberculosis within geospatial hotspots suggests foci of
imported infection in Sydney, Australia. Infect. Genet. Evol. (2015), http://dx.doi.org/10.1016/j.meegid.2015.07.014
than 1 case in 1,000,000 population) will require enhanced tuber-
culosis control efforts (WHO, 2014b). We demonstrate the added
value of geospatial hotspot identification combined with genotypic
cluster analysis to provide epidemiological insights that may guide
enhanced concentrated public health responses. Our data show
that better integration of epidemiological, clinical and laboratory
data are required for geographically targeted and more effective
approaches to tuberculosis control and possibly aid in reaching
to the MDG.
In total, four geospatial hotspots were identified, featuring their
own M. tuberculosis and human population structures. This reflects
the highly diverse and evolving demographics of metropolitan
Sydney, which has a higher proportion of non-Australian born
people than the rest of NSW. Pronounced geographical variations
in tuberculosis epidemiology among immigrant populations has
also been recognized in the USA and recommendations have been
made to tailor the tuberculosis program based on local needs (CDC,
1998), with area-based interventions for tuberculosis control (Oren
et al., 2014).
Hotspot 1 is of particular interest, since it shows an increasing
trend in the incidence rate, the highest relative tuberculosis risk,
youngest mean age of disease diagnosis and strong association
with the Beijing strain lineage. This geographic area had the high-
est proportion of overseas-born inhabitants (76.3%) across NSW.
Studies from Vietnam revealed an increasing number of Beijing
strains among the younger population, which implies more recent
Fig. 1. Spatio-temporal dynamics of culture confirmed tuberculosis in NSW, Australia (incidence rates shown per 100,000 population).
4 U. Gurjav et al. / Infection, Genetics and Evolution xxx (2015) xxx–xxx
Please cite this article in press as: Gurjav, U., et al. Genotype heterogeneity of Mycobacterium tuberculosis within geospatial hotspots suggests foci of
imported infection in Sydney, Australia. Infect. Genet. Evol. (2015), http://dx.doi.org/10.1016/j.meegid.2015.07.014
transmission of Beijing strains within the community (Srilohasin
et al., 2014). However in our study, although Beijing lineage strains
accounted for 60% of all cases in hotspot 1, the high proportion of
unique strains suggests likely importation of these strains rather
than local transmission within NSW. Previously described and cur-
rent Beijing MIRU-24 genotype clusters did not overlap with
geospatial hotspots (Gurjav et al., 2014). Interestingly, the minority
TUR strain lineage had two small MIRU-24 clusters identified
within hotspots 1 and 2, which may represent limited local trans-
mission within each hotspot areas. All 34 MDR cases had unique
MIRU-24 profiles and were likely imported; China and Vietnam
were most frequently considered to be the likely ‘‘source country’’,
accounting for nearly half (15/34) of the cases imported from 11
different countries. Increased rates of imported disease following
tuberculosis reactivation have also been reported recently in immi-
grants from tuberculosis endemic countries in the USA (Shea et al.,
2014).
Similarly hotspot 4 had an upward trend in tuberculosis inci-
dence rate, but the mean age at diagnosis was significantly higher
than the hotspot 1. No genotype cluster was identified in this hot-
spot and it also represents an area containing a high (57.6%) pro-
portion of overseas-born people. Tuberculosis cases were also
likely to represent reactivation of imported latent infection, rather
than local transmission in another low incidence setting of
Guadeloupe (Ferdinand et al., 2013). Another low incidence coun-
try, Sweden, reported a high (67 years) mean age of overseas-born
tuberculosis patients when compared to Swedish-born patients
(Svensson et al., 2011). Reasons for the age difference observed
between hotspots 1 and 4 remain obscure, but may be related to
recent immigration dynamics, with more recent immigrants and
younger people settling in hotspot 1. Unlike hotspots 1 and 4, hot-
spots 2 and 3 displayed consistently decreasing trends for inci-
dence rate.
Previously, geospatial analysis and routine genotyping results
were integrated into a web-based database to automatically gener-
ate spatial aggregations of specific genotype(s) at the Centers for
Disease Control and Prevention, USA and thus prioritizing geno-
type clusters with potential local transmission (Ghosh et al.,
2012). However, a recent study from Canada, another low
incidence country, reported that such space–time surveillance
had created false alarms leading to unnecessary public health
actions (Verma et al., 2014). Our study, in line with other studies,
highlights the importance of combining genotypic and epidemio-
logic methods to explore geographically concentrated
culture-confirmed tuberculosis cases and their underlying factors,
leading to the spatial targeting of tuberculosis interventions
(Haase et al., 2007; Prussing et al., 2013).
Several study limitations should be noted. Hotspot definitions
based on a 5 km diameter setting may be too stringent to identify
geospatial cluster(s) in rural areas. However, remote areas in NSW
had very few tuberculosis cases and this should not have affected
the validity of our analyses. Other statistical techniques such as
kernel smoothing or weighted local prevalence have been
employed for hotspot identification in the past, but the SatScan
method used seems at least as accurate and sensitive as alterna-
tives in predicting disease clusters (Mosha et al., 2014). The rela-
tively poor resolution of MIRU-24 genotyping, especially for
Beijing lineage strains, reduced our ability to zoom into hotspots
with high fidelity (Allix-Béguec et al., 2014; Gurjav et al., 2014).
Although the high proportion of unique M. tuberculosis MIRU-24
profiles indicate little transmission within identified hotspots, we
could not differentiate the contribution of reactivation vs. recent
importation of tuberculosis, since we had no information on the
duration of patients’ residency in Australia. A study from the USA
suggested that 80% of tuberculosis notifications resulted from reac-
tivation in overseas-born patients, with the highest rates occurring
among young and elderly adults (Walter et al., 2014). The contribu-
tions of patient-specific risk factors such as HIV infection, disease
severity or substance abuse were not considered, since this infor-
mation was not available in the laboratory database. However,
HIV co-infection rates are low in NSW and the risk of tuberculosis
has been consistently associated with birth or past residence in a
high TB incidence country (Lowbridge et al., 2013).
Despite the overall low incidence rate of tuberculosis in NSW,
pockets of relatively high incidence of the disease were identified.
The diversity of MIRU-24 types within these hotspots and relative
0
10
20
30
40
50
60
2009 2010 2011 2012 2013
Incidenceper100,000population
Year
Hotspot 1
Hotspot 2
Hotspot 3
Hotspot 4
State
average
Fig. 2. Temporal dynamics of culture-confirmed tuberculosis hotspots in NSW.
Table 2
Characteristics associated with geospatial hotspots.
Characteristics Hotspot 1 Hotspot 2 Hotspot 3 Hotspot 4 p value
Annualized incidence rate
39.5 (26.4–57.1) 22.0 (15.7–35.3) 45.1 (16.1–60.5) 29.7 (11.4–45.7) –
Relative risk#
(95% CI) 7.0 (5.3–9.5) 3.9 (2.7–5.7) 8.0 (6.2–10.5) 5.9 (4.8–7.3) 0.001
Mean age at TB diagnosis (years, 95% CI) 31 (27–36) 35 (27–42) 34 (30–38) 50 (46–55) 0.001

Average number of new tuberculosis cases diagnosed per annum/100,000 population.
#
Risk of developing tuberculosis compared to non-hotspot area; CI – confidence interval; TB – tuberculosis.
0%
20%
40%
60%
80%
100%
Hotspot 1 Hotspot 2 Hotspot 3 Hotspot 4 Non-hotspot
areas
Percentage
Hotspot areas
Others
TUR
LAM
Haarlem
EAI
Delhi/CAS
Beijing
Fig. 3. M. tuberculosis strain lineages identified within hotspot and non-hotspot
areas. EAI – East African Indian; LAM – Latin American Mediterranean; TUR or
Turkish strain lineage.
U. Gurjav et al. / Infection, Genetics and Evolution xxx (2015) xxx–xxx 5
Please cite this article in press as: Gurjav, U., et al. Genotype heterogeneity of Mycobacterium tuberculosis within geospatial hotspots suggests foci of
imported infection in Sydney, Australia. Infect. Genet. Evol. (2015), http://dx.doi.org/10.1016/j.meegid.2015.07.014
absence of genotype clustering suggested limited local
M. tuberculosis transmission in NSW. These findings demonstrate
the added value of combining M. tuberculosis genotyping and
spatio-temporal clustering of tuberculosis cases to gain new
insights of the epidemiological situation and better target local dis-
ease control interventions.
Conflicts of interest
None to declare.
Author Contributions
U.G. carried out the experiments, data analysis and wrote the
first draft of the manuscript; P.J. provided existing laboratory data
and assisted with strain typing; G.H.C. assisted in proof reading of
the manuscript; B.M. and V.S. helped to conceptualize the project
and revised the manuscript. All authors read and approved the
final manuscript.
Acknowledgements
The authors thank Pathology West-MRL staff members for
training U.G. to perform genotyping for isolates. Also thank Karen
Byth for assistance in statistical analysis. U.G. was funded by a
Mongolian Government Postgraduate Scholarship supplemented
by a grant from the NHMRC Centre for Research Excellence in
Tuberculosis Control and The Westmead Foundation for Medical
Research provided project funding.
Appendix A. Supplementary data
Supplementary data associated with this article can be found, in
the online version, at http://dx.doi.org/10.1016/j.meegid.2015.07.
014.
References
Allix-Béguec, C. et al., 2014. Proposal of a consensus set of hypervariable
mycobacterial interspersed repetitive-unit-variable-number tandem-repeat
loci for subtyping of Mycobacterium tuberculosis Beijing isolates. J. Clin.
Microbiol. 52 (1), 164–172.
Australian Bureau of Statistics (2011), Census of Population and Housing of
Australia, http://www.abs.gov.au/.
Barry, C. et al., 2012. Tuberculosis notifications in Australia, 2008 and 2009.
Commun. Dis. Intell. Q. Rep. 36 (1), 82–94.
Centers for Diseases Control and Prevention (1998), Recommendations for
prevention and control of tuberculosis among foreign-born persons, Report of
the Working Group on Tuberculosis among Foreign-Born Persons, http://www.
cdc.gov/.
Coleman, M. et al., 2009. Using the SaTScan method to detect local malaria clusters
for guiding malaria control programmes. Malar. J. 8, 68.
Ferdinand, S. et al., 2013. Use of genotyping based clustering to quantify recent
tuberculosis transmission in Guadeloupe during a seven years period: analysis
of risk factors and access to health care. BMC Infect. Dis. 13, 364.
Gallego, B. et al., 2010. Three-year longitudinal study of genotypes of
Mycobacterium tuberculosis in a low prevalence population. Pathology 42 (3),
267–272.
Ghosh, S. et al., 2012. Tuberculosis genotyping information management system:
enhancing tuberculosis surveillance in the United States. Infect. Genet. Evol. 12
(4), 782–788.
Gilroy, N., 1999. Tuberculosis notifications in Australia, 1997. National TB Advisory
Group. Communicable Disease Network Australia and New Zealand. Commun.
Dis. Intell. 23 (13), 337–348.
Gurjav, U. et al., 2014. Temporal dynamics of Mycobacterium tuberculosis genotypes
in New South Wales, Australia. BMC Infect. Dis. 14, 455.
Haase, I. et al., 2007. Use of geographic and genotyping tools to characterise
tuberculosis transmission in Montreal. Int. J. Tuberc. Lung Dis. 11 (6), 632–638.
Holt, K.E. et al., 2013. Tracking the establishment of local endemic populations of an
emergent enteric pathogen. Proc. Natl. Acad. Sci. U.S.A. 110 (43), 17522–17527.
Kulldorff, M. et al., 1998. Evaluating cluster alarms: a space-time scan statistic and
brain cancer in Los Alamos, New Mexico. Am. J. Public Health 88 (9), 1377–
1380.
Lowbridge, C., Christensen, A., McAnulty, J.M., 2013. EpiReview: tuberculosis in
NSW, 2009–2011. N.S.W. Public Health Bull. 24 (1), 3–9.
Lumb, R. et al., 2011. Tuberculosis in Australia: bacteriologically confirmed cases
and drug resistance, 2008 and 2009. A report of the Australian Mycobacterium
Reference Laboratory Network. Commun. Dis. Intell. Q. Rep. 35 (2), 154–161.
Marais, B.J. et al., 2013. Tuberculosis comorbidity with communicable and non-
communicable diseases: integrating health services and control efforts. Lancet
Infect. Dis. 13 (5), 436–448.
Massey, P.D. et al., 2013. Local level epidemiological analysis of TB in people from a
high incidence country of birth. BMC Public Health 13, 62.
Mosha, J.F. et al., 2014. Hot spot or not: a comparison of spatial statistical methods
to predict prospective malaria infections. Malar. J. 13, 53.
Nguyen, L.N., Gilbert, G.L., Marks, G.B., 2004. Molecular epidemiology of
tuberculosis and recent developments in understanding the epidemiology of
tuberculosis. Respirology 9 (3), 313–319.
Oren, E. et al., 2014. Neighborhood socioeconomic position and tuberculosis
transmission: a retrospective cohort study. BMC Infect. Dis. 14, 227.
Prussing, C. et al., 2013. Geo-epidemiologic and molecular characterization to
identify social, cultural, and economic factors where targeted tuberculosis
control activities can reduce incidence in Maryland, 2004–2010. Public Health
Rep. 128 (Suppl. 3), 104–114.
Roberts-Witteveen, A.R., Christensen, A., McAnulty, J.M., 2010. EpiReview:
tuberculosis in NSW, 2008. N.S.W. Public Health Bull. 21 (7–8), 174–182.
Shah, L. et al., 2014. Geographic predictors of primary multidrug-resistant
tuberculosis cases in an endemic area of Lima, Peru. Int. J. Tuberc. Lung Dis.
18 (11), 1307–1314.
Shea, K.M. et al., 2014. Estimated rate of reactivation of latent tuberculosis infection
in the United States, overall and by population subgroup. Am. J. Epidemiol. 179
(2), 216–225.
Srilohasin, P. et al., 2014. Genetic diversity and dynamic distribution of
Mycobacterium tuberculosis isolates causing pulmonary and extrapulmonary
tuberculosis in Thailand. J. Clin. Microbiol. 52 (12), 4267–4274.
Supply, P. et al., 2006. Proposal for standardization of optimized mycobacterial
interspersed repetitive unit-variable-number tandem repeat typing of
Mycobacterium tuberculosis. J. Clin. Microbiol. 44 (12), 4498–4510.
Svensson, E. et al., 2011. Impact of immigration on tuberculosis epidemiology in a
low-incidence country. Clin. Microbiol. Infect. 17 (6), 881–887.
Verma, A. et al., 2014. Accuracy of prospective space-time surveillance in detecting
tuberculosis transmission. Spat. Spatiotemporal Epidemiol. 8, 47–54.
Walter, N.D. et al., 2014. Persistent latent tuberculosis reactivation risk in United
States immigrants. Am. J. Respir. Crit. Care Med. 189 (1), 88–95.
Weniger, T. et al., 2010. MIRU-VNTRplus: a web tool for polyphasic genotyping of
Mycobacterium tuberculosis complex bacteria. Nucleic Acids Res. 38, 326–331.
World Health Organization (2014), Global Tuberculosis Report, http://www.who.
int/.
World Health Organization (2014), Framework towards TB Elimination in Low
Incidence Countries, http://www.who.int/.
Table 3
Diversity of MIRU-24 genotype profiles within geospatial hotspots.
Hotspots MIRU-24 genotypes Total TB
case n
No. of MIRU
clusters
Clustered
strains n (%)
Unique
strains n (%)
Hotspot 1 2 4 (8.9) 41 (91.1) 45
Hotspot 2 1 2 (7.7) 26 (92.3) 28
Hotspot 3 1 2 (3.6) 54 (96.4) 56
Hotspot 4 0 0 (0) 97 (100) 97
MIRU – 24-loci mycobacterium interspersed repetitive unit; TB – tuberculosis.
6 U. Gurjav et al. / Infection, Genetics and Evolution xxx (2015) xxx–xxx
Please cite this article in press as: Gurjav, U., et al. Genotype heterogeneity of Mycobacterium tuberculosis within geospatial hotspots suggests foci of
imported infection in Sydney, Australia. Infect. Genet. Evol. (2015), http://dx.doi.org/10.1016/j.meegid.2015.07.014

More Related Content

What's hot

Imjh april-2015-6
Imjh april-2015-6Imjh april-2015-6
Al04606233238
Al04606233238Al04606233238
Al04606233238
IJERA Editor
 
The International Journal of Engineering and Science (The IJES)
The International Journal of Engineering and Science (The IJES)The International Journal of Engineering and Science (The IJES)
The International Journal of Engineering and Science (The IJES)
theijes
 
Modeling the Effect of Variation of Recruitment Rate on the Transmission Dyna...
Modeling the Effect of Variation of Recruitment Rate on the Transmission Dyna...Modeling the Effect of Variation of Recruitment Rate on the Transmission Dyna...
Modeling the Effect of Variation of Recruitment Rate on the Transmission Dyna...
IOSR Journals
 
Assessing the effects of prognostic factors in recovery of tuberculosis patie...
Assessing the effects of prognostic factors in recovery of tuberculosis patie...Assessing the effects of prognostic factors in recovery of tuberculosis patie...
Assessing the effects of prognostic factors in recovery of tuberculosis patie...
Alexander Decker
 
Dynamics and Control of Infectious Diseases (2007) - Alexander Glaser
Dynamics and Control of Infectious Diseases (2007) - Alexander Glaser Dynamics and Control of Infectious Diseases (2007) - Alexander Glaser
Dynamics and Control of Infectious Diseases (2007) - Alexander Glaser
Wouter de Heij
 
Epidemiology
Epidemiology   Epidemiology
Epidemiology
Mehul Shinde
 
Polymicrobial colonisation of the nasopharynx in UK children
Polymicrobial colonisation of the nasopharynx in UK childrenPolymicrobial colonisation of the nasopharynx in UK children
Polymicrobial colonisation of the nasopharynx in UK children
Rebeccagladstone
 
Clinico-epidemiological study of cutaneous tuberculosis in a tertiary care ho...
Clinico-epidemiological study of cutaneous tuberculosis in a tertiary care ho...Clinico-epidemiological study of cutaneous tuberculosis in a tertiary care ho...
Clinico-epidemiological study of cutaneous tuberculosis in a tertiary care ho...
International Multispeciality Journal of Health
 
Seroprevalence and risk factors for Coxiella burnetii (Q fever) infection in ...
Seroprevalence and risk factors for Coxiella burnetii (Q fever) infection in ...Seroprevalence and risk factors for Coxiella burnetii (Q fever) infection in ...
Seroprevalence and risk factors for Coxiella burnetii (Q fever) infection in ...
ILRI
 
Epidemiology
EpidemiologyEpidemiology
Epidemiology
Manoj Godara
 
Imperial college-covid19-npi-modelling-16-03-2020
Imperial college-covid19-npi-modelling-16-03-2020Imperial college-covid19-npi-modelling-16-03-2020
Imperial college-covid19-npi-modelling-16-03-2020
Wouter de Heij
 
Status of major Infectious diseases of IDSP at a tertiary level hospital in w...
Status of major Infectious diseases of IDSP at a tertiary level hospital in w...Status of major Infectious diseases of IDSP at a tertiary level hospital in w...
Status of major Infectious diseases of IDSP at a tertiary level hospital in w...
International Multispeciality Journal of Health
 
Epidemic Investigation of the Jaundice Outbreak in Girdharnagar, Ahmedabad, G...
Epidemic Investigation of the Jaundice Outbreak in Girdharnagar, Ahmedabad, G...Epidemic Investigation of the Jaundice Outbreak in Girdharnagar, Ahmedabad, G...
Epidemic Investigation of the Jaundice Outbreak in Girdharnagar, Ahmedabad, G...
Govt Medical College, Surat.
 
CNS Iinfection dengue, Teaching Slides, Dr M D Mohire, Kolhapur, Maharashtra,...
CNS Iinfection dengue, Teaching Slides, Dr M D Mohire, Kolhapur, Maharashtra,...CNS Iinfection dengue, Teaching Slides, Dr M D Mohire, Kolhapur, Maharashtra,...
CNS Iinfection dengue, Teaching Slides, Dr M D Mohire, Kolhapur, Maharashtra,...
Mahavir Mohire
 
Global HIV cohort studies among IDU and future vaccine trials
Global HIV cohort studies among IDU and future vaccine trialsGlobal HIV cohort studies among IDU and future vaccine trials
Global HIV cohort studies among IDU and future vaccine trialsThira Woratanarat
 
Tuberculosis among household contacts of multidrug resistant tuberculosis cas...
Tuberculosis among household contacts of multidrug resistant tuberculosis cas...Tuberculosis among household contacts of multidrug resistant tuberculosis cas...
Tuberculosis among household contacts of multidrug resistant tuberculosis cas...
SSR Institute of International Journal of Life Sciences
 

What's hot (19)

Imjh april-2015-6
Imjh april-2015-6Imjh april-2015-6
Imjh april-2015-6
 
Al04606233238
Al04606233238Al04606233238
Al04606233238
 
The International Journal of Engineering and Science (The IJES)
The International Journal of Engineering and Science (The IJES)The International Journal of Engineering and Science (The IJES)
The International Journal of Engineering and Science (The IJES)
 
NASIR HABIB
NASIR HABIBNASIR HABIB
NASIR HABIB
 
Modeling the Effect of Variation of Recruitment Rate on the Transmission Dyna...
Modeling the Effect of Variation of Recruitment Rate on the Transmission Dyna...Modeling the Effect of Variation of Recruitment Rate on the Transmission Dyna...
Modeling the Effect of Variation of Recruitment Rate on the Transmission Dyna...
 
Assessing the effects of prognostic factors in recovery of tuberculosis patie...
Assessing the effects of prognostic factors in recovery of tuberculosis patie...Assessing the effects of prognostic factors in recovery of tuberculosis patie...
Assessing the effects of prognostic factors in recovery of tuberculosis patie...
 
Dynamics and Control of Infectious Diseases (2007) - Alexander Glaser
Dynamics and Control of Infectious Diseases (2007) - Alexander Glaser Dynamics and Control of Infectious Diseases (2007) - Alexander Glaser
Dynamics and Control of Infectious Diseases (2007) - Alexander Glaser
 
Epidemiology
Epidemiology   Epidemiology
Epidemiology
 
Polymicrobial colonisation of the nasopharynx in UK children
Polymicrobial colonisation of the nasopharynx in UK childrenPolymicrobial colonisation of the nasopharynx in UK children
Polymicrobial colonisation of the nasopharynx in UK children
 
Clinico-epidemiological study of cutaneous tuberculosis in a tertiary care ho...
Clinico-epidemiological study of cutaneous tuberculosis in a tertiary care ho...Clinico-epidemiological study of cutaneous tuberculosis in a tertiary care ho...
Clinico-epidemiological study of cutaneous tuberculosis in a tertiary care ho...
 
Seroprevalence and risk factors for Coxiella burnetii (Q fever) infection in ...
Seroprevalence and risk factors for Coxiella burnetii (Q fever) infection in ...Seroprevalence and risk factors for Coxiella burnetii (Q fever) infection in ...
Seroprevalence and risk factors for Coxiella burnetii (Q fever) infection in ...
 
Epidemiology
EpidemiologyEpidemiology
Epidemiology
 
Imperial college-covid19-npi-modelling-16-03-2020
Imperial college-covid19-npi-modelling-16-03-2020Imperial college-covid19-npi-modelling-16-03-2020
Imperial college-covid19-npi-modelling-16-03-2020
 
Status of major Infectious diseases of IDSP at a tertiary level hospital in w...
Status of major Infectious diseases of IDSP at a tertiary level hospital in w...Status of major Infectious diseases of IDSP at a tertiary level hospital in w...
Status of major Infectious diseases of IDSP at a tertiary level hospital in w...
 
Epidemic Investigation of the Jaundice Outbreak in Girdharnagar, Ahmedabad, G...
Epidemic Investigation of the Jaundice Outbreak in Girdharnagar, Ahmedabad, G...Epidemic Investigation of the Jaundice Outbreak in Girdharnagar, Ahmedabad, G...
Epidemic Investigation of the Jaundice Outbreak in Girdharnagar, Ahmedabad, G...
 
CNS Iinfection dengue, Teaching Slides, Dr M D Mohire, Kolhapur, Maharashtra,...
CNS Iinfection dengue, Teaching Slides, Dr M D Mohire, Kolhapur, Maharashtra,...CNS Iinfection dengue, Teaching Slides, Dr M D Mohire, Kolhapur, Maharashtra,...
CNS Iinfection dengue, Teaching Slides, Dr M D Mohire, Kolhapur, Maharashtra,...
 
Global HIV cohort studies among IDU and future vaccine trials
Global HIV cohort studies among IDU and future vaccine trialsGlobal HIV cohort studies among IDU and future vaccine trials
Global HIV cohort studies among IDU and future vaccine trials
 
Tuberculosis among household contacts of multidrug resistant tuberculosis cas...
Tuberculosis among household contacts of multidrug resistant tuberculosis cas...Tuberculosis among household contacts of multidrug resistant tuberculosis cas...
Tuberculosis among household contacts of multidrug resistant tuberculosis cas...
 
Rotavirus1
Rotavirus1Rotavirus1
Rotavirus1
 

Viewers also liked

Artículo periodístico del español Juan Cueto
Artículo periodístico del español Juan Cueto Artículo periodístico del español Juan Cueto
Artículo periodístico del español Juan Cueto
Escuela Normal Superior Del Distrito De Barranquilla
 
Connecting Kids & Technology at Phoenix Public Library
Connecting Kids & Technology at Phoenix Public LibraryConnecting Kids & Technology at Phoenix Public Library
Connecting Kids & Technology at Phoenix Public Library
phoenixpubliclibrary
 
Ensayo
Ensayo Ensayo
san-francisco-insiders-guide
san-francisco-insiders-guidesan-francisco-insiders-guide
san-francisco-insiders-guideMaria Smirnova
 
Customer stories
Customer storiesCustomer stories
Customer stories
phoenixpubliclibrary
 
Презентация компании Amedia
Презентация компании AmediaПрезентация компании Amedia
Презентация компании Amedia
amedias
 
samenvatting MVO verslag 2013
samenvatting MVO verslag 2013samenvatting MVO verslag 2013
samenvatting MVO verslag 2013Marlou Leenders
 

Viewers also liked (13)

Resune
ResuneResune
Resune
 
Artículo periodístico del español Juan Cueto
Artículo periodístico del español Juan Cueto Artículo periodístico del español Juan Cueto
Artículo periodístico del español Juan Cueto
 
20150728 dimosiog 245_prok
20150728 dimosiog 245_prok20150728 dimosiog 245_prok
20150728 dimosiog 245_prok
 
Connecting Kids & Technology at Phoenix Public Library
Connecting Kids & Technology at Phoenix Public LibraryConnecting Kids & Technology at Phoenix Public Library
Connecting Kids & Technology at Phoenix Public Library
 
Ensayo
Ensayo Ensayo
Ensayo
 
san-francisco-insiders-guide
san-francisco-insiders-guidesan-francisco-insiders-guide
san-francisco-insiders-guide
 
doc_5248
doc_5248doc_5248
doc_5248
 
Fabio Valenzuela Resume
Fabio Valenzuela ResumeFabio Valenzuela Resume
Fabio Valenzuela Resume
 
Customer stories
Customer storiesCustomer stories
Customer stories
 
Презентация компании Amedia
Презентация компании AmediaПрезентация компании Amedia
Презентация компании Amedia
 
samenvatting MVO verslag 2013
samenvatting MVO verslag 2013samenvatting MVO verslag 2013
samenvatting MVO verslag 2013
 
MVOverslag RNL 2011
MVOverslag RNL 2011MVOverslag RNL 2011
MVOverslag RNL 2011
 
resume mayrachelsilverio
resume mayrachelsilverioresume mayrachelsilverio
resume mayrachelsilverio
 

Similar to Gurjav IGE 2015

Incidence of Tuberculosis in HIV Sero-positive Patients at HIV Clinic at Kamp...
Incidence of Tuberculosis in HIV Sero-positive Patients at HIV Clinic at Kamp...Incidence of Tuberculosis in HIV Sero-positive Patients at HIV Clinic at Kamp...
Incidence of Tuberculosis in HIV Sero-positive Patients at HIV Clinic at Kamp...
PUBLISHERJOURNAL
 
Seroprevalence and risk factors of Coxiella burnetii (Q fever) infection amon...
Seroprevalence and risk factors of Coxiella burnetii (Q fever) infection amon...Seroprevalence and risk factors of Coxiella burnetii (Q fever) infection amon...
Seroprevalence and risk factors of Coxiella burnetii (Q fever) infection amon...
ILRI
 
Prevalence of hiv infection in pulmonary tuberculosis suspects;
Prevalence of hiv infection in pulmonary tuberculosis suspects;Prevalence of hiv infection in pulmonary tuberculosis suspects;
Prevalence of hiv infection in pulmonary tuberculosis suspects;
Alexander Decker
 
1.CRYPTOCOCCAL AND PCP.pptx
1.CRYPTOCOCCAL AND PCP.pptx1.CRYPTOCOCCAL AND PCP.pptx
1.CRYPTOCOCCAL AND PCP.pptx
Mkindi Mkindi
 
A Retrospective Disease Surveillance Based Approach in the Investigation and ...
A Retrospective Disease Surveillance Based Approach in the Investigation and ...A Retrospective Disease Surveillance Based Approach in the Investigation and ...
A Retrospective Disease Surveillance Based Approach in the Investigation and ...
Stephen Olubulyera
 
Correlation of Pulmonary Tuberculosis in HIV Positive Patients and its Associ...
Correlation of Pulmonary Tuberculosis in HIV Positive Patients and its Associ...Correlation of Pulmonary Tuberculosis in HIV Positive Patients and its Associ...
Correlation of Pulmonary Tuberculosis in HIV Positive Patients and its Associ...
SSR Institute of International Journal of Life Sciences
 
Two stories on brucellosis in Kenya
Two stories on brucellosis in KenyaTwo stories on brucellosis in Kenya
Two stories on brucellosis in Kenya
ILRI
 
IOSRPHR(www.iosrphr.org) IOSR Journal of Pharmacy
IOSRPHR(www.iosrphr.org) IOSR Journal of PharmacyIOSRPHR(www.iosrphr.org) IOSR Journal of Pharmacy
IOSRPHR(www.iosrphr.org) IOSR Journal of Pharmacyiosrphr_editor
 
IOSRPHR(www.iosrphr.org) IOSR Journal of Pharmacy
IOSRPHR(www.iosrphr.org) IOSR Journal of PharmacyIOSRPHR(www.iosrphr.org) IOSR Journal of Pharmacy
IOSRPHR(www.iosrphr.org) IOSR Journal of Pharmacyiosrphr_editor
 
Top Papers 2014
Top Papers 2014Top Papers 2014
1 s2.0-s2352396419302592-main (1)
1 s2.0-s2352396419302592-main (1)1 s2.0-s2352396419302592-main (1)
1 s2.0-s2352396419302592-main (1)
Miguel Alca Alvaro
 
Evaluation factors contributing to the treatment default by tuberculosis pati...
Evaluation factors contributing to the treatment default by tuberculosis pati...Evaluation factors contributing to the treatment default by tuberculosis pati...
Evaluation factors contributing to the treatment default by tuberculosis pati...
PUBLISHERJOURNAL
 
Evaluation factors contributing to the treatment default by tuberculosis pati...
Evaluation factors contributing to the treatment default by tuberculosis pati...Evaluation factors contributing to the treatment default by tuberculosis pati...
Evaluation factors contributing to the treatment default by tuberculosis pati...
PUBLISHERJOURNAL
 
PERTUSSIS PROTECTION - CURRENT SCHEDULES IN EUROPE
PERTUSSIS PROTECTION - CURRENT SCHEDULES IN EUROPEPERTUSSIS PROTECTION - CURRENT SCHEDULES IN EUROPE
PERTUSSIS PROTECTION - CURRENT SCHEDULES IN EUROPE
WAidid
 
Prof Sir Brian Greenwood @ MRF's Meningitis & Septicaemia in Children & Adult...
Prof Sir Brian Greenwood @ MRF's Meningitis & Septicaemia in Children & Adult...Prof Sir Brian Greenwood @ MRF's Meningitis & Septicaemia in Children & Adult...
Prof Sir Brian Greenwood @ MRF's Meningitis & Septicaemia in Children & Adult...
Meningitis Research Foundation
 
Dengue Seminar September 2011
Dengue Seminar September 2011Dengue Seminar September 2011
Dengue Seminar September 2011
javed.khalil
 
Prevalence and Risk Factors of Bacterial Urinary Tract Infection among Adults...
Prevalence and Risk Factors of Bacterial Urinary Tract Infection among Adults...Prevalence and Risk Factors of Bacterial Urinary Tract Infection among Adults...
Prevalence and Risk Factors of Bacterial Urinary Tract Infection among Adults...
ijtsrd
 
The SIR Model and the 2014 Ebola Virus Disease Outbreak in Guinea, Liberia an...
The SIR Model and the 2014 Ebola Virus Disease Outbreak in Guinea, Liberia an...The SIR Model and the 2014 Ebola Virus Disease Outbreak in Guinea, Liberia an...
The SIR Model and the 2014 Ebola Virus Disease Outbreak in Guinea, Liberia an...
CSCJournals
 
Epidemiology of wound_infection_in_a_surgical_ward_of_a_tertiary_care_hospita...
Epidemiology of wound_infection_in_a_surgical_ward_of_a_tertiary_care_hospita...Epidemiology of wound_infection_in_a_surgical_ward_of_a_tertiary_care_hospita...
Epidemiology of wound_infection_in_a_surgical_ward_of_a_tertiary_care_hospita...
Jacob Amofa
 
2009 skin infection in children colonized with community associated methicill...
2009 skin infection in children colonized with community associated methicill...2009 skin infection in children colonized with community associated methicill...
2009 skin infection in children colonized with community associated methicill...
PatriciaSantos283
 

Similar to Gurjav IGE 2015 (20)

Incidence of Tuberculosis in HIV Sero-positive Patients at HIV Clinic at Kamp...
Incidence of Tuberculosis in HIV Sero-positive Patients at HIV Clinic at Kamp...Incidence of Tuberculosis in HIV Sero-positive Patients at HIV Clinic at Kamp...
Incidence of Tuberculosis in HIV Sero-positive Patients at HIV Clinic at Kamp...
 
Seroprevalence and risk factors of Coxiella burnetii (Q fever) infection amon...
Seroprevalence and risk factors of Coxiella burnetii (Q fever) infection amon...Seroprevalence and risk factors of Coxiella burnetii (Q fever) infection amon...
Seroprevalence and risk factors of Coxiella burnetii (Q fever) infection amon...
 
Prevalence of hiv infection in pulmonary tuberculosis suspects;
Prevalence of hiv infection in pulmonary tuberculosis suspects;Prevalence of hiv infection in pulmonary tuberculosis suspects;
Prevalence of hiv infection in pulmonary tuberculosis suspects;
 
1.CRYPTOCOCCAL AND PCP.pptx
1.CRYPTOCOCCAL AND PCP.pptx1.CRYPTOCOCCAL AND PCP.pptx
1.CRYPTOCOCCAL AND PCP.pptx
 
A Retrospective Disease Surveillance Based Approach in the Investigation and ...
A Retrospective Disease Surveillance Based Approach in the Investigation and ...A Retrospective Disease Surveillance Based Approach in the Investigation and ...
A Retrospective Disease Surveillance Based Approach in the Investigation and ...
 
Correlation of Pulmonary Tuberculosis in HIV Positive Patients and its Associ...
Correlation of Pulmonary Tuberculosis in HIV Positive Patients and its Associ...Correlation of Pulmonary Tuberculosis in HIV Positive Patients and its Associ...
Correlation of Pulmonary Tuberculosis in HIV Positive Patients and its Associ...
 
Two stories on brucellosis in Kenya
Two stories on brucellosis in KenyaTwo stories on brucellosis in Kenya
Two stories on brucellosis in Kenya
 
IOSRPHR(www.iosrphr.org) IOSR Journal of Pharmacy
IOSRPHR(www.iosrphr.org) IOSR Journal of PharmacyIOSRPHR(www.iosrphr.org) IOSR Journal of Pharmacy
IOSRPHR(www.iosrphr.org) IOSR Journal of Pharmacy
 
IOSRPHR(www.iosrphr.org) IOSR Journal of Pharmacy
IOSRPHR(www.iosrphr.org) IOSR Journal of PharmacyIOSRPHR(www.iosrphr.org) IOSR Journal of Pharmacy
IOSRPHR(www.iosrphr.org) IOSR Journal of Pharmacy
 
Top Papers 2014
Top Papers 2014Top Papers 2014
Top Papers 2014
 
1 s2.0-s2352396419302592-main (1)
1 s2.0-s2352396419302592-main (1)1 s2.0-s2352396419302592-main (1)
1 s2.0-s2352396419302592-main (1)
 
Evaluation factors contributing to the treatment default by tuberculosis pati...
Evaluation factors contributing to the treatment default by tuberculosis pati...Evaluation factors contributing to the treatment default by tuberculosis pati...
Evaluation factors contributing to the treatment default by tuberculosis pati...
 
Evaluation factors contributing to the treatment default by tuberculosis pati...
Evaluation factors contributing to the treatment default by tuberculosis pati...Evaluation factors contributing to the treatment default by tuberculosis pati...
Evaluation factors contributing to the treatment default by tuberculosis pati...
 
PERTUSSIS PROTECTION - CURRENT SCHEDULES IN EUROPE
PERTUSSIS PROTECTION - CURRENT SCHEDULES IN EUROPEPERTUSSIS PROTECTION - CURRENT SCHEDULES IN EUROPE
PERTUSSIS PROTECTION - CURRENT SCHEDULES IN EUROPE
 
Prof Sir Brian Greenwood @ MRF's Meningitis & Septicaemia in Children & Adult...
Prof Sir Brian Greenwood @ MRF's Meningitis & Septicaemia in Children & Adult...Prof Sir Brian Greenwood @ MRF's Meningitis & Septicaemia in Children & Adult...
Prof Sir Brian Greenwood @ MRF's Meningitis & Septicaemia in Children & Adult...
 
Dengue Seminar September 2011
Dengue Seminar September 2011Dengue Seminar September 2011
Dengue Seminar September 2011
 
Prevalence and Risk Factors of Bacterial Urinary Tract Infection among Adults...
Prevalence and Risk Factors of Bacterial Urinary Tract Infection among Adults...Prevalence and Risk Factors of Bacterial Urinary Tract Infection among Adults...
Prevalence and Risk Factors of Bacterial Urinary Tract Infection among Adults...
 
The SIR Model and the 2014 Ebola Virus Disease Outbreak in Guinea, Liberia an...
The SIR Model and the 2014 Ebola Virus Disease Outbreak in Guinea, Liberia an...The SIR Model and the 2014 Ebola Virus Disease Outbreak in Guinea, Liberia an...
The SIR Model and the 2014 Ebola Virus Disease Outbreak in Guinea, Liberia an...
 
Epidemiology of wound_infection_in_a_surgical_ward_of_a_tertiary_care_hospita...
Epidemiology of wound_infection_in_a_surgical_ward_of_a_tertiary_care_hospita...Epidemiology of wound_infection_in_a_surgical_ward_of_a_tertiary_care_hospita...
Epidemiology of wound_infection_in_a_surgical_ward_of_a_tertiary_care_hospita...
 
2009 skin infection in children colonized with community associated methicill...
2009 skin infection in children colonized with community associated methicill...2009 skin infection in children colonized with community associated methicill...
2009 skin infection in children colonized with community associated methicill...
 

Gurjav IGE 2015

  • 1. Genotype heterogeneity of Mycobacterium tuberculosis within geospatial hotspots suggests foci of imported infection in Sydney, Australia Ulziijargal Gurjav a,c , Peter Jelfs b,c , Grant A. Hill-Cawthorne a,d , Ben J. Marais a , Vitali Sintchenko a,c,⇑ a Sydney Medical School and the Marie Bashir Institute for Infectious Diseases and Biosecurity, The University of Sydney, Sydney, Australia b NSW Mycobacterium Reference Laboratory, Centre for Infectious Diseases and Microbiology Laboratory Services, Institute of Clinical Pathology and Medical Research – Pathology West, Sydney, Australia c Centre for Infectious Diseases and Microbiology – Public Health, Westmead Hospital, Sydney, Australia d School of Public Health, The University of Sydney, Sydney, Australia a r t i c l e i n f o Article history: Received 30 January 2015 Received in revised form 6 July 2015 Accepted 13 July 2015 Available online xxxx Keywords: Mycobacterium tuberculosis Molecular epidemiology Genotyping Geospatial hotspot a b s t r a c t In recent years the State of New South Wales (NSW), Australia, has maintained a low tuberculosis inci- dence rate with little evidence of local transmission. Nearly 90% of notified tuberculosis cases occurred in people born in tuberculosis-endemic countries. We analyzed geographic, epidemiological and geno- typic data of all culture-confirmed tuberculosis cases to identify the bacterial and demographic determi- nants of tuberculosis hotspot areas in NSW. Standard 24-loci mycobacterium interspersed repetitive unit-variable number tandem repeat (MIRU-24) typing was performed on all isolates recovered between 2009 and 2013. In total 1692/1841 (91.9%) cases with confirmed Mycobacterium tuberculosis infection had complete MIRU-24 and demographic data and were included in the study. Despite some year-to-year variability, spatio-temporal analysis identified four tuberculosis hotspots. The incidence rate and the rel- ative risk of tuberculosis in these hotspots were 2- to 10-fold and 4- to 8-fold higher than the state aver- age, respectively. MIRU-24 profiles of M. tuberculosis isolates associated with these hotspots revealed high levels of heterogeneity. This suggests that these spatio-temporal hotspots, within this low incidence setting, can represent areas of predominantly imported infection rather than clusters of cases due to local transmission. These findings provide important epidemiological insight and demonstrate the value of combining tuberculosis genotyping and spatiotemporal data to guide better-targeted public health interventions. Ó 2015 Published by Elsevier B.V. 1. Introduction Tuberculosis remains a major cause of disease and death in poverty-stricken and conflict-ridden parts of the world (WHO, 2014a). In non-endemic countries such as Australia, tuberculosis notification rates have decreased significantly over the years, plateauing at an incidence of 5–6 per 100,000 population since 1985 (Barry et al., 2012). Disease rates among Australian-born non-Aboriginal groups are minimal, but Aboriginal and immigrant populations are disproportionally affected. Nationally, more than 85% of adult tuberculosis cases occur in immigrants from high inci- dence countries (Lumb et al., 2011; Roberts-Witteveen et al., 2010). In addition, Australia is a highly mobile nation and Australian-born residents frequently travel to tuberculosis endemic areas. New South Wales (NSW) reports the highest absolute case numbers and tuberculosis incidence rates within Australia, with most of these cases located in metropolitan Sydney (Barry et al., 2012). Tuberculosis cases show significant geographic clustering, with incidence rates in excess of 60 per 100,000 population recorded in some metropolitan areas (Massey et al., 2013). As in the rest of the country, the vast majority of cases occur in people born in tuberculosis endemic countries (Lowbridge et al., 2013). From a public health perspective it is important to understand the likely origin of disease, since this knowledge can guide local tuberculosis control strategies. In a low-incidence setting such as Australia, most tuberculosis cases result from imported infection in either an active, incipient or latent form, despite routine pre-migration screening. Determinants of tuberculosis risk in non-endemic areas include factors related to (i) M. tuberculosis infec- tion risk (e.g. being born in, or travel to, a tuberculosis-endemic http://dx.doi.org/10.1016/j.meegid.2015.07.014 1567-1348/Ó 2015 Published by Elsevier B.V. ⇑ Corresponding author at: Sydney Medical School and the Marie Bashir Institute for Infectious Diseases and Biosecurity, The University of Sydney, Sydney, Australia. E-mail address: vitali.sintchenko@sydney.edu.au (V. Sintchenko). Infection, Genetics and Evolution xxx (2015) xxx–xxx Contents lists available at ScienceDirect Infection, Genetics and Evolution journal homepage: www.elsevier.com/locate/meegid Please cite this article in press as: Gurjav, U., et al. Genotype heterogeneity of Mycobacterium tuberculosis within geospatial hotspots suggests foci of imported infection in Sydney, Australia. Infect. Genet. Evol. (2015), http://dx.doi.org/10.1016/j.meegid.2015.07.014
  • 2. country), and (ii) the risk of primary disease progression or reactiva- tion, caused by infection with human immunodeficiency virus (HIV), older age or the use of immunosuppressive drugs (Marais et al., 2013; Nguyen et al., 2004). Routine treatment of ‘‘latent’’ infection is not practiced in Australia and there is no post-immigration screening following new immigrant settlement and or subsequent visits to tuberculosis-endemic areas. Spatial scan statistics can reliably identify geographic areas with higher than expected case notifications in space and/or time (Kulldorff et al., 1998) and therefore can assist in directing inter- ventions, resource allocation and surveillance in these areas (Coleman et al., 2009; Shah et al., 2014). However, the specificity of hotspot alerts provided by purely statistical techniques has not been adequately evaluated. Clinical isolates of M. tuberculosis have been routinely typed in NSW using 24-loci mycobacterial interspersed repetitive unit-variable number of tandem repeats (MIRU-24) since 2009 to monitor for case clusters, potential local transmission and laboratory cross-contamination (Gallego et al., 2010). Cluster identification, using either genotypic or epidemio- logical methods, can provide important evidence to direct public health responses and limit potential epidemic spread (Gurjav et al., 2014). In this study we aimed to synthesize two lines of evi- dence offered by spatial scan statistics and genotyping of M. tuber- culosis in order to improve the resolution of case clustering assessment and the validity of hotspot analysis. 2. Methods 2.1. Study population Routine surveillance data of all culture-confirmed tuberculosis cases identified between January 2009 and December 2013 in the State of NSW were included in the study. The Mycobacterium Reference Laboratory (MRL) at the Institute of Clinical Pathology and Medical Research (ICPMR), Pathology West, Sydney, receives all M. tuberculosis complex isolates for further confirmatory and drug susceptibility testing (Gallego et al., 2010) and prospective MIRU-24 typing (Supply et al., 2006). Duplicate isolates were excluded from this study. Patient demographic data such as age, gender, site of infection and residential postcode was obtained from the ICPMR Laboratory Information System. Programmatic data indicate that the vast majority of tuberculosis cases identified in NSW, as in the rest of Australia, occur among recent immigrants (Roberts-Witteveen et al., 2010). 2.2. Geospatial hotspot description Spatial scan statistics was calculated using SatScan software (Boston, USA) with retrospective time–space Poisson distribution analysis parameter (Kulldorff et al., 1998). Briefly, hotspots were identified through comparing the observed cases in a given spa- tiotemporal location with the expected Poisson distribution of cases. Statistical significance was detected by the log likelihood ratio test and p-values obtained through 999 Monte Carlo simula- tions. The population density for the greater Sydney metropolitan area is 380 people per square kilometer compared to the rest of NSW where average population density is 9 people per square kilo- meter. Therefore the spatial scan resolution was set to a diameter of 5 km to allow for adequate breakdown of densely populated areas, especially within the Greater Sydney area. Geospatial hot- spots were visualized using the Quantum Geographical Information System (Holt et al., 2013). NSW 2011 population cen- sus data were obtained from the Australian Bureau of Statistics (ABS) Canberra, Australia and used for the annual incidence rate calculation (ABS, 2011). 2.3. Genotypic cluster description Twenty-four loci MIRU genotyping was performed and strain lineage using MIRU-24 was assigned as previously described using miru-vntrplus.org online database (Weniger et al., 2010; Gurjav et al., 2014). Two or more isolates sharing an identical MIRU profile were considered a genotype cluster, suggesting local transmission. Conversely, two or more isolates differing at one or more MIRU-24 loci were considered unique. 2.4. Statistical analysis The relative risk (RR) for each of the hotspot areas was com- puted by binomial logistic regression using non-hotspot areas as the reference. Briefly, tuberculosis case number was defined as the dependable variable and coded hotspot and non-hotspot areas considered as a covariate to calculate RR confidence intervals using a forward model. Descriptive statistics were used to explore differ- ences between hotspot areas and associations with M. tuberculosis strain lineages. v2 and One-way ANOVA tests were used where applicable. All statistical analyses were performed using SPSS 22.0 (IBM, USA) and p-values less than 0.05 we considered significant. The study was approved by the Human Research Ethics Committee of the University of Sydney (project number 2013/126). 3. Results 3.1. Background epidemiology During the 5-year study period a total of 1872 patients with culture-confirmed M. tuberculosis complex infections were diag- nosed, including four Mycobacterium bovis and 27 M. bovis BCG cases. M. bovis BCG cases all received intravesicular BCG installa- tion for bladder cancer treatment and the four M. bovis cases had no epidemiological link suggestive of possible transmission. After exclusion of the 31 M. bovis and M. bovis BCG cases the denominator was 1841 cases. The incidence of culture-confirmed tuberculosis was maintained at 6/100,000 population, with the lowest absolute number (n = 297) of cases reported in 2013. Of the confirmed M. tuberculosis cases, 91.9% (1692/1841) had com- plete demographic and MIRU-24 genotyping data and were included in subsequent analyses. Basic demographic and bacteriological data of all culture-confirmed tuberculosis cases are shown in Table 1. The most common strain lineages were East African Indian (EAI) and Beijing, accounting for around 55.8% (944/1692) of all strains. Among the minority strains the Turkish (TUR) strain lineage accounted for 2.2% (38/1692) of culture-confirmed cases. 3.2. Geospatial hotspots All of the hotspot areas identified were within the Greater Sydney area. Fig. 1 provides an overview of the spatio-temporal dynamics of culture-confirmed tuberculosis cases in NSW. Culture-confirmed tuberculosis cases were notified in 286 of 607 postcode areas. Although the hotspots identified in each study year showed some variability, three non-adjacent and two adjacent postcodes were consistently identified in each of the five study years (Fig. 1, last panel). The three non-adjacent postcodes were considered as three independent hotspots and the two adjacent postcodes were amalgamated into a single hotspot, providing a total of four geospatial hotspots as reflected in the aggregate data for the study period (Hotspots 1–4; Fig. 1, last panel). Annual tuberculosis incidence rates within the geospatial hotspots were 2 U. Gurjav et al. / Infection, Genetics and Evolution xxx (2015) xxx–xxx Please cite this article in press as: Gurjav, U., et al. Genotype heterogeneity of Mycobacterium tuberculosis within geospatial hotspots suggests foci of imported infection in Sydney, Australia. Infect. Genet. Evol. (2015), http://dx.doi.org/10.1016/j.meegid.2015.07.014
  • 3. highly variable ranging from 13.5 to 60.5 cases per 100,000 popu- lation, which was 2- to 10-fold higher than the state average (Fig. 2). Compared to non-hotspot areas the calculated relative risk of tuberculosis in hotspots was 4–8 times higher than in non-hotspot areas (Table 2). The mean age of tuberculosis cases differed between hotspot areas with cases in hotspot 4 being sig- nificantly older (50 years) than hotspots 1–3 (30 years) and those in non-hotspot areas (40) (p 0.001). The mean age of hotspot inhabitants without tuberculosis was not known. Additional comparative demographic and clinical characteristics of hotspots vs. non-hotspot areas are provided in the Supplementary Table. 3.3. M. tuberculosis population structure Seventeen different M. tuberculosis strain lineages were identi- fied. Beijing, EAI and Delhi/CAS lineages comprised 71% (1203/1692) of all cases, and 20% (340/1692) of all strains were clustered by MIRU-24. The Beijing strain lineage was significantly over-represented (49%, 167/340) among clustered cases as com- pared to unique strains (22%, 297/1352) (p 0.001). A total of 34 multi-drug resistant (MDR) tuberculosis cases were identified, accounting for 2% of all culture-confirmed tuberculosis cases. MDR strains were comprised of eight different lineages with a sin- gle MIRU-24 cluster of 2 cases (global lineage 4); Beijing accounted for 55.9% (19/34) of strains. The relative proportions of M. tubercu- losis strain lineages in respective hotspot areas differed signifi- cantly (p 0.0001) between each other and compared to all non-hotspot areas combined (Fig. 3). Compared to non-hotspot areas, the Beijing strain lineage was more likely to be identified in hotspot 1 (odds ratio 3.0, 95% CI 1.2–7.5, p 0.05), but not in other hotspots. 3.4. Strain heterogeneity within hotspot areas Interestingly, tuberculosis geospatial hotspots were character- ized by a high percentage of unique MIRU-24 profiles, ranging from 91.1% to 100% (Table 3). No single locus variants were identified in any of the hotspots; all unique MIRU-24 isolates differed in at least 2 loci. Only four genotype clusters were identified, none within hotspot 4. Two clusters within hotspot 1 belonged to Beijing and TUR strain lineages. Single clusters within hotspots 2 and 3 also belonged to Beijing and TUR. Within the hotspot areas, all genotyp- ically clustered isolates were fully susceptible to first-line tubercu- losis drugs. Seven MDR tuberculosis cases were identified, representing 6.7%, 3.6%, 1.8% and 2% of the total strains in each of the hotspots; all with unique MIRU-24 profiles. 4. Discussion This is the first study to combine detailed geospatial hotspot and MIRU-24 genotype cluster analysis of routinely collected culture-confirmed tuberculosis in a low incidence setting. It pro- vides a unique opportunity to explore the geospatial hotspots iden- tified to assess whether they represent pockets of local transmission or areas with an increased concentration of imported disease. Our findings suggest limited local transmission, implying that imported tuberculosis infection offer the most likely explana- tion for the elevated disease rates within identified geospatial hotspots. Similar to many developed countries, NSW has reported a low rate of 6–7 tuberculosis cases per 100,000 population since 1986, without any additional reduction following the introduction of pre-immigration screening for tuberculosis in 2002 (Gilroy, 1999). This emphasizes that the aspirational Millennium Development Goal (MDG) target of tuberculosis elimination (less Table 1 Demographic and clinical characteristics of cases with culture confirmed tuberculosis. Characteristics Year Total n (%) 2009 2010 2011 2012 2013 Gender Male 204 (57.5) 214 (61.7) 208 (58.6) 181 (53.6) 166 (55.9) 973 (57.5) Age group 15 yrs 6 (1.7) 4 (1.2) 5 (1.4) 6 (1.8) 1 (0.3) 22 (1.3) 15–29 119 (33.5) 140 (40.3) 113 (31.8) 109 (32.2) 95 (32.0) 576 (34.0) 30–44 84 (23.7) 75 (21.6) 91 (25.6) 89 (26.3) 75 (25.3) 414 (24.5) 45–59 74 (20.8) 55 (15.9) 61 (17.2) 52 (15.4) 56 (18.9) 298 (17.6) 60 yrs 72 (20.3) 73 (21.0) 85 (23.9) 82 (24.3) 70 (23.6) 382 (22.6) Site of infection Respiratory 229 (64.5) 248 (71.5) 246 (69.3) 236 (69.8) 197 (66.3) 1156 (68.3) Non-Respiratory 126 (35.5) 99 (28.5) 109 (30.7) 102 (30.2) 100 (33.7) 536 (31.7) Strain lineage EAI 88 (24.8) 109 (31.4) 98 (27.6) 89 (26.3) 90 (30.3) 474 (28.0) Beijing 92 (25.9) 94 (27.1) 104 (29.3) 96 (28.4) 84 (28.3) 470 (27.8) Delhi/CAS 62 (17.5) 48 (13.8) 49 (13.8) 49 (14.8) 51 (17.2) 259 (15.3) LAM 18 (5.1) 25 (7.2) 14 (3.9) 21 (6.2) 10 (3.4) 88 (5.2) Haarlem 17 (4.8) 11 (3.2) 20 (5.6) 22 (6.5) 11 (3.7) 81 (4.8) TUR 9 (2.5) 3 (0.9) 7 (2.0) 10 (3.0) 9 (3.0) 38 (2.2) Other 78 (22.0) 60 (17.3) 70 (19.7) 61 (18.0) 51 (17.2) 320 (18.9) Drug resistance Isoniazid 38 (10.7) 24 (6.9) 23 (6.5) 28 (8.3) 24 (8.1) 137 (8.1) MDR/XDR 9 (2.5) 7 (2) 5 (1.4) 5 (1.5) 8 (2.7) 34 (2.0) Total 355 (100) 347 (100) 355 (100) 338 (100) 297 (100) 1692 (100) yrs – years; EAI – East African Indian; LAM – Latin American Mediterranean; TUR or Turkish strain lineage; MDR – multi-drug resistant; XDR – extensively drug resistant tuberculosis (a single case diagnosed 2011). U. Gurjav et al. / Infection, Genetics and Evolution xxx (2015) xxx–xxx 3 Please cite this article in press as: Gurjav, U., et al. Genotype heterogeneity of Mycobacterium tuberculosis within geospatial hotspots suggests foci of imported infection in Sydney, Australia. Infect. Genet. Evol. (2015), http://dx.doi.org/10.1016/j.meegid.2015.07.014
  • 4. than 1 case in 1,000,000 population) will require enhanced tuber- culosis control efforts (WHO, 2014b). We demonstrate the added value of geospatial hotspot identification combined with genotypic cluster analysis to provide epidemiological insights that may guide enhanced concentrated public health responses. Our data show that better integration of epidemiological, clinical and laboratory data are required for geographically targeted and more effective approaches to tuberculosis control and possibly aid in reaching to the MDG. In total, four geospatial hotspots were identified, featuring their own M. tuberculosis and human population structures. This reflects the highly diverse and evolving demographics of metropolitan Sydney, which has a higher proportion of non-Australian born people than the rest of NSW. Pronounced geographical variations in tuberculosis epidemiology among immigrant populations has also been recognized in the USA and recommendations have been made to tailor the tuberculosis program based on local needs (CDC, 1998), with area-based interventions for tuberculosis control (Oren et al., 2014). Hotspot 1 is of particular interest, since it shows an increasing trend in the incidence rate, the highest relative tuberculosis risk, youngest mean age of disease diagnosis and strong association with the Beijing strain lineage. This geographic area had the high- est proportion of overseas-born inhabitants (76.3%) across NSW. Studies from Vietnam revealed an increasing number of Beijing strains among the younger population, which implies more recent Fig. 1. Spatio-temporal dynamics of culture confirmed tuberculosis in NSW, Australia (incidence rates shown per 100,000 population). 4 U. Gurjav et al. / Infection, Genetics and Evolution xxx (2015) xxx–xxx Please cite this article in press as: Gurjav, U., et al. Genotype heterogeneity of Mycobacterium tuberculosis within geospatial hotspots suggests foci of imported infection in Sydney, Australia. Infect. Genet. Evol. (2015), http://dx.doi.org/10.1016/j.meegid.2015.07.014
  • 5. transmission of Beijing strains within the community (Srilohasin et al., 2014). However in our study, although Beijing lineage strains accounted for 60% of all cases in hotspot 1, the high proportion of unique strains suggests likely importation of these strains rather than local transmission within NSW. Previously described and cur- rent Beijing MIRU-24 genotype clusters did not overlap with geospatial hotspots (Gurjav et al., 2014). Interestingly, the minority TUR strain lineage had two small MIRU-24 clusters identified within hotspots 1 and 2, which may represent limited local trans- mission within each hotspot areas. All 34 MDR cases had unique MIRU-24 profiles and were likely imported; China and Vietnam were most frequently considered to be the likely ‘‘source country’’, accounting for nearly half (15/34) of the cases imported from 11 different countries. Increased rates of imported disease following tuberculosis reactivation have also been reported recently in immi- grants from tuberculosis endemic countries in the USA (Shea et al., 2014). Similarly hotspot 4 had an upward trend in tuberculosis inci- dence rate, but the mean age at diagnosis was significantly higher than the hotspot 1. No genotype cluster was identified in this hot- spot and it also represents an area containing a high (57.6%) pro- portion of overseas-born people. Tuberculosis cases were also likely to represent reactivation of imported latent infection, rather than local transmission in another low incidence setting of Guadeloupe (Ferdinand et al., 2013). Another low incidence coun- try, Sweden, reported a high (67 years) mean age of overseas-born tuberculosis patients when compared to Swedish-born patients (Svensson et al., 2011). Reasons for the age difference observed between hotspots 1 and 4 remain obscure, but may be related to recent immigration dynamics, with more recent immigrants and younger people settling in hotspot 1. Unlike hotspots 1 and 4, hot- spots 2 and 3 displayed consistently decreasing trends for inci- dence rate. Previously, geospatial analysis and routine genotyping results were integrated into a web-based database to automatically gener- ate spatial aggregations of specific genotype(s) at the Centers for Disease Control and Prevention, USA and thus prioritizing geno- type clusters with potential local transmission (Ghosh et al., 2012). However, a recent study from Canada, another low incidence country, reported that such space–time surveillance had created false alarms leading to unnecessary public health actions (Verma et al., 2014). Our study, in line with other studies, highlights the importance of combining genotypic and epidemio- logic methods to explore geographically concentrated culture-confirmed tuberculosis cases and their underlying factors, leading to the spatial targeting of tuberculosis interventions (Haase et al., 2007; Prussing et al., 2013). Several study limitations should be noted. Hotspot definitions based on a 5 km diameter setting may be too stringent to identify geospatial cluster(s) in rural areas. However, remote areas in NSW had very few tuberculosis cases and this should not have affected the validity of our analyses. Other statistical techniques such as kernel smoothing or weighted local prevalence have been employed for hotspot identification in the past, but the SatScan method used seems at least as accurate and sensitive as alterna- tives in predicting disease clusters (Mosha et al., 2014). The rela- tively poor resolution of MIRU-24 genotyping, especially for Beijing lineage strains, reduced our ability to zoom into hotspots with high fidelity (Allix-Béguec et al., 2014; Gurjav et al., 2014). Although the high proportion of unique M. tuberculosis MIRU-24 profiles indicate little transmission within identified hotspots, we could not differentiate the contribution of reactivation vs. recent importation of tuberculosis, since we had no information on the duration of patients’ residency in Australia. A study from the USA suggested that 80% of tuberculosis notifications resulted from reac- tivation in overseas-born patients, with the highest rates occurring among young and elderly adults (Walter et al., 2014). The contribu- tions of patient-specific risk factors such as HIV infection, disease severity or substance abuse were not considered, since this infor- mation was not available in the laboratory database. However, HIV co-infection rates are low in NSW and the risk of tuberculosis has been consistently associated with birth or past residence in a high TB incidence country (Lowbridge et al., 2013). Despite the overall low incidence rate of tuberculosis in NSW, pockets of relatively high incidence of the disease were identified. The diversity of MIRU-24 types within these hotspots and relative 0 10 20 30 40 50 60 2009 2010 2011 2012 2013 Incidenceper100,000population Year Hotspot 1 Hotspot 2 Hotspot 3 Hotspot 4 State average Fig. 2. Temporal dynamics of culture-confirmed tuberculosis hotspots in NSW. Table 2 Characteristics associated with geospatial hotspots. Characteristics Hotspot 1 Hotspot 2 Hotspot 3 Hotspot 4 p value Annualized incidence rate 39.5 (26.4–57.1) 22.0 (15.7–35.3) 45.1 (16.1–60.5) 29.7 (11.4–45.7) – Relative risk# (95% CI) 7.0 (5.3–9.5) 3.9 (2.7–5.7) 8.0 (6.2–10.5) 5.9 (4.8–7.3) 0.001 Mean age at TB diagnosis (years, 95% CI) 31 (27–36) 35 (27–42) 34 (30–38) 50 (46–55) 0.001 Average number of new tuberculosis cases diagnosed per annum/100,000 population. # Risk of developing tuberculosis compared to non-hotspot area; CI – confidence interval; TB – tuberculosis. 0% 20% 40% 60% 80% 100% Hotspot 1 Hotspot 2 Hotspot 3 Hotspot 4 Non-hotspot areas Percentage Hotspot areas Others TUR LAM Haarlem EAI Delhi/CAS Beijing Fig. 3. M. tuberculosis strain lineages identified within hotspot and non-hotspot areas. EAI – East African Indian; LAM – Latin American Mediterranean; TUR or Turkish strain lineage. U. Gurjav et al. / Infection, Genetics and Evolution xxx (2015) xxx–xxx 5 Please cite this article in press as: Gurjav, U., et al. Genotype heterogeneity of Mycobacterium tuberculosis within geospatial hotspots suggests foci of imported infection in Sydney, Australia. Infect. Genet. Evol. (2015), http://dx.doi.org/10.1016/j.meegid.2015.07.014
  • 6. absence of genotype clustering suggested limited local M. tuberculosis transmission in NSW. These findings demonstrate the added value of combining M. tuberculosis genotyping and spatio-temporal clustering of tuberculosis cases to gain new insights of the epidemiological situation and better target local dis- ease control interventions. Conflicts of interest None to declare. Author Contributions U.G. carried out the experiments, data analysis and wrote the first draft of the manuscript; P.J. provided existing laboratory data and assisted with strain typing; G.H.C. assisted in proof reading of the manuscript; B.M. and V.S. helped to conceptualize the project and revised the manuscript. All authors read and approved the final manuscript. Acknowledgements The authors thank Pathology West-MRL staff members for training U.G. to perform genotyping for isolates. Also thank Karen Byth for assistance in statistical analysis. U.G. was funded by a Mongolian Government Postgraduate Scholarship supplemented by a grant from the NHMRC Centre for Research Excellence in Tuberculosis Control and The Westmead Foundation for Medical Research provided project funding. Appendix A. Supplementary data Supplementary data associated with this article can be found, in the online version, at http://dx.doi.org/10.1016/j.meegid.2015.07. 014. References Allix-Béguec, C. et al., 2014. Proposal of a consensus set of hypervariable mycobacterial interspersed repetitive-unit-variable-number tandem-repeat loci for subtyping of Mycobacterium tuberculosis Beijing isolates. J. Clin. Microbiol. 52 (1), 164–172. Australian Bureau of Statistics (2011), Census of Population and Housing of Australia, http://www.abs.gov.au/. Barry, C. et al., 2012. Tuberculosis notifications in Australia, 2008 and 2009. Commun. Dis. Intell. Q. Rep. 36 (1), 82–94. Centers for Diseases Control and Prevention (1998), Recommendations for prevention and control of tuberculosis among foreign-born persons, Report of the Working Group on Tuberculosis among Foreign-Born Persons, http://www. cdc.gov/. Coleman, M. et al., 2009. Using the SaTScan method to detect local malaria clusters for guiding malaria control programmes. Malar. J. 8, 68. Ferdinand, S. et al., 2013. Use of genotyping based clustering to quantify recent tuberculosis transmission in Guadeloupe during a seven years period: analysis of risk factors and access to health care. BMC Infect. Dis. 13, 364. Gallego, B. et al., 2010. Three-year longitudinal study of genotypes of Mycobacterium tuberculosis in a low prevalence population. Pathology 42 (3), 267–272. Ghosh, S. et al., 2012. Tuberculosis genotyping information management system: enhancing tuberculosis surveillance in the United States. Infect. Genet. Evol. 12 (4), 782–788. Gilroy, N., 1999. Tuberculosis notifications in Australia, 1997. National TB Advisory Group. Communicable Disease Network Australia and New Zealand. Commun. Dis. Intell. 23 (13), 337–348. Gurjav, U. et al., 2014. Temporal dynamics of Mycobacterium tuberculosis genotypes in New South Wales, Australia. BMC Infect. Dis. 14, 455. Haase, I. et al., 2007. Use of geographic and genotyping tools to characterise tuberculosis transmission in Montreal. Int. J. Tuberc. Lung Dis. 11 (6), 632–638. Holt, K.E. et al., 2013. Tracking the establishment of local endemic populations of an emergent enteric pathogen. Proc. Natl. Acad. Sci. U.S.A. 110 (43), 17522–17527. Kulldorff, M. et al., 1998. Evaluating cluster alarms: a space-time scan statistic and brain cancer in Los Alamos, New Mexico. Am. J. Public Health 88 (9), 1377– 1380. Lowbridge, C., Christensen, A., McAnulty, J.M., 2013. EpiReview: tuberculosis in NSW, 2009–2011. N.S.W. Public Health Bull. 24 (1), 3–9. Lumb, R. et al., 2011. Tuberculosis in Australia: bacteriologically confirmed cases and drug resistance, 2008 and 2009. A report of the Australian Mycobacterium Reference Laboratory Network. Commun. Dis. Intell. Q. Rep. 35 (2), 154–161. Marais, B.J. et al., 2013. Tuberculosis comorbidity with communicable and non- communicable diseases: integrating health services and control efforts. Lancet Infect. Dis. 13 (5), 436–448. Massey, P.D. et al., 2013. Local level epidemiological analysis of TB in people from a high incidence country of birth. BMC Public Health 13, 62. Mosha, J.F. et al., 2014. Hot spot or not: a comparison of spatial statistical methods to predict prospective malaria infections. Malar. J. 13, 53. Nguyen, L.N., Gilbert, G.L., Marks, G.B., 2004. Molecular epidemiology of tuberculosis and recent developments in understanding the epidemiology of tuberculosis. Respirology 9 (3), 313–319. Oren, E. et al., 2014. Neighborhood socioeconomic position and tuberculosis transmission: a retrospective cohort study. BMC Infect. Dis. 14, 227. Prussing, C. et al., 2013. Geo-epidemiologic and molecular characterization to identify social, cultural, and economic factors where targeted tuberculosis control activities can reduce incidence in Maryland, 2004–2010. Public Health Rep. 128 (Suppl. 3), 104–114. Roberts-Witteveen, A.R., Christensen, A., McAnulty, J.M., 2010. EpiReview: tuberculosis in NSW, 2008. N.S.W. Public Health Bull. 21 (7–8), 174–182. Shah, L. et al., 2014. Geographic predictors of primary multidrug-resistant tuberculosis cases in an endemic area of Lima, Peru. Int. J. Tuberc. Lung Dis. 18 (11), 1307–1314. Shea, K.M. et al., 2014. Estimated rate of reactivation of latent tuberculosis infection in the United States, overall and by population subgroup. Am. J. Epidemiol. 179 (2), 216–225. Srilohasin, P. et al., 2014. Genetic diversity and dynamic distribution of Mycobacterium tuberculosis isolates causing pulmonary and extrapulmonary tuberculosis in Thailand. J. Clin. Microbiol. 52 (12), 4267–4274. Supply, P. et al., 2006. Proposal for standardization of optimized mycobacterial interspersed repetitive unit-variable-number tandem repeat typing of Mycobacterium tuberculosis. J. Clin. Microbiol. 44 (12), 4498–4510. Svensson, E. et al., 2011. Impact of immigration on tuberculosis epidemiology in a low-incidence country. Clin. Microbiol. Infect. 17 (6), 881–887. Verma, A. et al., 2014. Accuracy of prospective space-time surveillance in detecting tuberculosis transmission. Spat. Spatiotemporal Epidemiol. 8, 47–54. Walter, N.D. et al., 2014. Persistent latent tuberculosis reactivation risk in United States immigrants. Am. J. Respir. Crit. Care Med. 189 (1), 88–95. Weniger, T. et al., 2010. MIRU-VNTRplus: a web tool for polyphasic genotyping of Mycobacterium tuberculosis complex bacteria. Nucleic Acids Res. 38, 326–331. World Health Organization (2014), Global Tuberculosis Report, http://www.who. int/. World Health Organization (2014), Framework towards TB Elimination in Low Incidence Countries, http://www.who.int/. Table 3 Diversity of MIRU-24 genotype profiles within geospatial hotspots. Hotspots MIRU-24 genotypes Total TB case n No. of MIRU clusters Clustered strains n (%) Unique strains n (%) Hotspot 1 2 4 (8.9) 41 (91.1) 45 Hotspot 2 1 2 (7.7) 26 (92.3) 28 Hotspot 3 1 2 (3.6) 54 (96.4) 56 Hotspot 4 0 0 (0) 97 (100) 97 MIRU – 24-loci mycobacterium interspersed repetitive unit; TB – tuberculosis. 6 U. Gurjav et al. / Infection, Genetics and Evolution xxx (2015) xxx–xxx Please cite this article in press as: Gurjav, U., et al. Genotype heterogeneity of Mycobacterium tuberculosis within geospatial hotspots suggests foci of imported infection in Sydney, Australia. Infect. Genet. Evol. (2015), http://dx.doi.org/10.1016/j.meegid.2015.07.014